An artery-specific fluorescent dye for studying neurovascular coupling
|
|
|
- Shanon Arnold
- 5 years ago
- Views:
Transcription
1 Nature Methods An artery-specific fluorescent dye for studying neurovascular coupling Zhiming Shen, Zhongyang Lu, Pratik Y Chhatbar, Philip O Herron & Prakash Kara Supplementary Figure 1 Delay between the filling of arteries and veins after intravenous dye injection confirms artery specificity of Alexa 633 labeling in vivo Supplementary Figure 2 Vessel classification using brightfield vs. two-photon fluorescein dextran + Alexa 633 in vivo Supplementary Figure 3 Vessel classification using brightfield vs. two-photon green tomato lectin + Alexa 633 in vivo Supplementary Figure 4 Supplementary Figure 5 Supplementary Figure 6 Supplementary Figure 7 Supplementary Figure 8 Supplementary Figure 9 Supplementary Figure 1 Supplementary Figure 11 Supplementary Figure 12 Supplementary Figure 13 Persistent in vivo Alexa 633 labeling > 24 hours post-injection Surface and penetrating arterioles 15 µm in diameter are labeled in vivo by Alexa 633 while veins, venules, and microvessels are not The smallest surface arteriole branches ( 1 µm diameter) are not labeled by Alexa 633 in vivo A deep penetrating arteriole labeled by Alexa 633 in vivo Small (< 1-µm-diameter) branchlets off penetrating arterioles are not labeled by Alexa 633 in vivo PDGFR-β immunohistochemistry suggests that pericytes are not labeled by Alexa 633 Alexa 633 does not label the small microvessels in histological sections of the cerebral cortex Arterioles but not venules in the visual cortex respond to drifting grating visual stimuli Neuronal responses are unaffected by local micropipette application of Alexa 633 in the visual cortex Neuronal responses are unaffected before and after intravenous application of Alexa 633 in the same animal Supplementary Figure 14 EEG and heart rate are unaffected by Alexa 633
2 Supplementary Figure 15 Supplementary Figure 16 Supplementary Figure 17 Supplementary Figure 18 Supplementary Figure 19 Supplementary Figure 2 Supplementary Note 1 Supplementary Note 2 Binding site of Alexa 633 on artery/arteriole wall Alexa 633 labels elastin fibers on artery walls in brain and aorta Alexa 633 labeling of human aorta Alexa 633 labeling of mouse kidney Red blood cell velocity in cortical microvessels after intravenous injection of fluorescent dyes Light path used for in vivo two-photon imaging Fluorescence dip artifact caused by arteriole dilation Selectivity of Alexa 633 vs. other rhodamine derivatives Note: Supplementary Videos 1 4 are available on the Nature Methods website.


 and")


3 Supplementary Figure 1 Delay between the filling of arteries and veins after intravenous dye injection confirms artery specificity of Alexa 633 labeling in vivo Brightfield photo a c Site 1 Two-photon images of Alexa 633 (red) and fluorescein dextran (green) labeling Site 1 Site 2 2 µm Site 2 5 µm Time-lapse cortical images after an i.v. injection of fluorescein dextran b 2 µm Arterial filling phase Venous filling phase 5 µm Page 1 of 42
4 Supplementary Figure 1 Delay between the filling of arteries and veins after intravenous dye injection confirms artery specificity of Alexa 633 labeling in vivo (a) Brightfield image of a craniotomy over the cat visual cortex, viewed through a surgical dissecting microscope. No dyes were present in the circulation at this phase of the experiment. Arteries and veins were classified based on small difference in hue arteries orange and veins purple. These differences can be enhanced by using the Auto Levels function in Adobe Photoshop, as done in panel a of this figure and the brightfield images shown in Supplementary Figs Large dashed square indicates the region imaged in b with a monochrome CCD camera and the two smaller square boxes (sites 1 and 2) are sub-regions corresponding to two-photon images shown in c. (b) Time-lapse epifluorescence imaging of cortical vessels immediately after fluorescein dextran was injected intravenously in the femoral vein. The upper panels display two still images from Supplementary Video 1. The left panel was captured shortly after the dye reached the cortex when only the arteries were labeled because the dye must pass from the femoral vein (in the leg) through the heart to get to the cerebral cortex, the arteries must label first. The right panel, captured 7 seconds later when the dye was predominantly in the veins. Because it takes a few circulatory cycles for the dye to become equally distributed in the blood plasma, the arteries darken as the dye moves into the veins. The bottom panel is an RGB image created by overlaying the top two panels. The pixel intensity values from the arterial phase (left panel) are displayed in the red channel and those from the venous phase (right panel) in the green and blue channels hence the cyan shading for veins. (c) Two-photon images corresponding to the sites identified in a, after intravenous injection of Alexa 633 and fluorescein dextran. The subset of vessel walls labeled with Alexa 633 (red) correlate precisely with the classification of arteries by the two independent methods shown in a and b. The two-photon image from site 1 is an average intensity 1-µm-z-projection through the cortex while the two-photon image from site 2 is a single imaging plane on the cortical surface. Hue differences between arteries and veins (as shown in panel a) were consistently observed across all three species examined: cat Supplementary Fig. 1, rat Supplementary Figs. 2-3, and mouse (data not shown). Page 2 of 42


5 Supplementary Figure 2 Vessel classification using brightfield vs. two-photon fluorescein dextran + Alexa 633 in vivo a V 2 µm A b A V V A 5 µm c A 15 µm V A Page 3 of 42
6 Supplementary Figure 2 Vessel classification using brightfield vs. two-photon fluorescein dextran + Alexa 633 in vivo (a) Brightfield image of a craniotomy over rat visual cortex, equivalent to the approach described for cat visual cortex in Supplementary Fig. 1. Orange arteries (A) and purple veins (V) are readily discernable. (b) Two-photon image of a sub-region shown in a, after intravenous injection of Alexa 633 and fluorescein dextran. Image is a 46 µm maximum intensity z projection and shows an arteriole (A) and daughter branches labeled with Alexa 633. A venule (V) running in parallel to the larger arteriole is not labeled by Alexa 633. (c) Higher zoom two-photon image corresponding to a sub-region shown in b. The image is from a single imaging plane corresponding to the z stack shown in Supplementary Video 2. The arteriole branches are well labeled with Alexa 633 while the nearby venule is unlabeled. Page 4 of 42


7 Supplementary Figure 3 Vessel classification using brightfield vs. two-photon green tomato lectin + Alexa 633 in vivo b Alexa 633 / Tomato Lectin a 15 µm 5 µm Page 5 of 42
8 Supplementary Figure 3 Vessel classification using brightfield vs. two-photon green tomato lectin + Alexa 633 in vivo (a) Brightfield image of a craniotomy over rat visual cortex, equivalent to the approach described in Supplementary Figs Orange arteries and purple veins are readily discernable. (b) Two-photon image of a sub-region shown in a, after intravenous injection of Alexa 633 and green tomato lectin. Endothelial cells in all vessels were labeled with green tomato lectin but only arteriole branches were labeled by the Alexa 633 injection. Image is an average intensity 64-µm-z-projection. Page 6 of 42


9 Supplementary Figure 4 Persistent in vivo Alexa 633 labeling > 24 hours post-injection a 4 hours post-injection 5 µm b New craniotomy at 26 hours post-injection 5 µm Page 7 of 42
10 Supplementary Figure 4 Persistent in vivo Alexa 633 labeling > 24 hours post-injection (a) Two-photon image from the cat visual cortex obtained four hours after intravenous injection of Alexa 633 is an average intensity 2-µm-z-projection and shows a cortical artery brightly labeled with Alexa 633. (b) Another two-photon image (average intensity 1-µm-z-projection) showing a different cortical artery in the same cat as shown in a. In a given craniotomy, tissue growth over the cortex (especially in cats) reduces overall imaging quality over long time periods (24 h). Therefore to ensure that we only measured the loss in Alexa 633 wall labeling, we opened a new craniotomy 26 h after the injection and imaged a new artery. The vessel was still brightly labeled. Images shown in a and b were obtained with the identical laser power and PMT value. Page 8 of 42


11 Supplementary Figure 5 Surface and penetrating arterioles 15 µm in diameter are labeled in vivo by Alexa 633 while veins, venules, and microvessels are not a b 5 µm 5 µm c d Page 9 of 42
12 Supplementary Figure 5 Surface and penetrating arterioles 15 µm in diameter are labeled in vivo by Alexa 633 while veins, venules, and microvessels are not (a) Single z plane two-photon image from mouse visual cortex, 78 µm below the pial surface. The entire vasculature is visible (green) after an intravenous injection of fluorescein dextran. The wall of a penetrating arteriole is clearly labeled with Alexa 633 (red) while surrounding micro-vessels are not. (b) A surface two-photon image of a large arteriole labeled with Alexa 633. Surrounding venules and microvessels are not labeled by Alexa 633. Note the hexagonal microvessel loop (white arrows), as described by Blinder and colleagues (Proc. Natl. Acad. Sci. USA 21). The image is a maximum intensity 15-µm-zprojection, from the same craniotomy used to obtain the image shown in a. (c) Dorsal view perspective of a 3D volume rendering of the nearly identical region shown in a, but with a higher 2 optical zoom. The surface and penetrating arterioles are labeled by Alexa 633 while the vein on the right edge and microvessels are not. (d) Left side view perspective of the same 3D volume shown in c. The penetrating arteriole is labeled throughout the imaged depth. In the current example, Alexa 633 labeling was obtained by local micropipette injection (cf. intravenous injection in experiments shown in Supplementary Figs. 1 4). x-y-z volume dimensions in c d: µm. A 36 rendering of the volume is shown in Supplementary Video 3. Page 1 of 42


13 Supplementary Figure 6 The smallest surface arteriole branches ( 1 µm diameter) are not labeled by Alexa 633 in vivo a 5 µm b labeling ends 1 µm Page 11 of 42
14 Supplementary Figure 6 The smallest surface arteriole branches ( 1 µm diameter) are not labeled by Alexa 633 in vivo (a) Average intensity 66-µm-z-projection two-photon image from mouse visual cortex. The entire vasculature is visible (green) after an intravenous injection of fluorescein dextran. The smallest surface arteriole branch 1 µm diameter (white arrow) is unlabeled by local micropipette injection of Alexa 633. (b) Average intensity 12-µm-z-projection two-photon image from rat visual cortex. After intravenous injection of Alexa 633, the 25-µm-diameter arteriole was labeled. But the smaller 7-µm-diameter offshoot was not labeled by Alexa 633 (white arrow). Alexa 633 labeling ends abruptly at the vessel branch point (red arrow). The vasculature lumen is visible (green) via an intravenous injection of fluorescein dextran. Page 12 of 42


15 Supplementary Figure 7 A deep penetrating arteriole labeled by Alexa 633 in vivo a b 5 µm c 25 µm 25 µm d Page 13 of 42
16 Supplementary Figure 7 A deep penetrating arteriole labeled by Alexa 633 in vivo (a) Side view perspective of a 3D volume rendering of a two-photon imaged site in rat visual cortex from the pial surface to a depth of 55 µm. The lumen of all vessels is labeled with fluorescein dextran (green). After intravenous injection of Alexa 633, a penetrating arteriole 17-µm-diameter is labeled with Alexa 633 (red) while the surrounding micro-vessels are not. x-y-z volume dimensions: µm. Gray slices correspond to z cross-sections shown in c and d. (b) Dorsal view of the same cortical region shown in a. The dashed white square indicates the sub-region used to render the 3D volume shown in a. The white arrow shows a small branch coming off the larger 17-µmdiameter penetrating arteriole. This small branch ( 1 µm diameter) is not labeled by the intravenous injection of Alexa 633. (c) Image of a maximum intensity 3-µm-z-projection centered 355 µm below the cortical surface. The penetrating arteriole is labeled by Alexa 633 while two small < 1-µm-diameter branches (white arrows) and surrounding micro-vessels are not. (d) Image of a maximum intensity 2-µm-z-projection centered 48 µm below the cortical surface. The penetrating arteriole is still labeled by Alexa 633 while the small < 1-µm-diameter branchlet (arrowed) and surrounding vessels are not. Page 14 of 42
")


17 Supplementary Figure 8 Small (< 1 µm diameter) branchlets off penetrating arterioles are not labeled by Alexa 633 in vivo 4 V 3 V V V 25 µm Page 15 of 42
18 Supplementary Figure 8 Small (< 1-µm-diameter) branchlets off penetrating arterioles are not labeled by Alexa 633 in vivo Two-photon image of an average intensity 16-µm-z-projection centered 15 µm below the pial surface. The lumen of all vessels is labeled with fluorescein dextran (green). The schematic of a micropipette indicates the tip location where Alexa 633 was ejected. Penetrating arterioles with branchlets (# 1 4) are labeled with Alexa 633 but diving venules (V) and microvessels are not. The white arrow indicates an unlabeled 8-µm-diameter branchlet from the same artery as # 1 ( 12 µm diameter and labeled by Alexa 633). Inset overlaid in the center of the two-photon image provides further details where Alexa 633 labeling ends on arterioles by showing a mask rendering of the penetrating arteriole that gives rise to the two branchlets: # 1 and the other indicated by the white arrow. The mask was created using the automatic masking function in Imaris software. The best visualization of the mask of the two-branchlets with their parent arteriole was via a ventral projection (as shown). Note that the lack of label in the 8-µm-diameter branchlet could not be due to diffusion distance from the injection site since artery # 2 is much further away from the pipette tip and is clearly labeled. Page 16 of 42


19 Supplementary Figure 9 PDGFR-β immunohistochemistry suggests that pericytes are not labeled by Alexa 633 a Alexa 633/PDGFR-β/DAPI b PDGFR-β/Glut1/DAPI 2 µm 2 µm Page 17 of 42
20 Supplementary Figure 9 PDGFR-β immunohistochemistry suggests that pericytes are not labeled by Alexa 633 (a) Triple labeling of Alexa 633/PDGFR-β/DAPI in mouse visual cortex shows no overlap of labeling between Alexa 633 (red) and PDGFR-β (green). Furthermore, pericytes on microvessels, e.g., white arrow, show no labeling by Alexa 633. (b) Triple labeling of PDGFR-β/Glut1/DAPI in mouse visual cortex shows pericytes labeled (red) along microvessels visualized with Glut1 (green). We present numerous lines of in vivo and other histological data to show that there is no labeling of Alexa 633 on microvessels < 1 µm in diameter (also see Supplementary Figs. 5 8, 1). Furthermore, there are no pericytes in the aorta (Wagenseil and Mecham, Physiol. Rev. 29), yet Alexa 633 labels distinct elastin bands in the aorta (Supplementary Fig. 15). The labeling of Alexa 633 is inconsistent with pericytes as a target. Page 18 of 42


21 Supplementary Figure 1 Alexa 633 does not label the small microvessels in histological sections of the cerebral cortex Alexa 633 Glut1 Alexa 633/Glut1 Alexa-633 Glut1 Alexa-633/Glut1 Alexa 633 Laminin Alexa 633/Laminin Alexa 633 Glut1 Alexa 633/Glut1 Alexa 633 Glut1 Alexa 633/Glut1 Page 19 of 42
22 Supplementary Figure 1 Alexa 633 does not label the small microvessels in histological sections of the cerebral cortex Glut-1 or Laminin were used as a green counterstain for microvessels (white arrows) in individual tissue sections. Not a single microvessel was co-labeled by Alexa 633 (red). All data shown are from mouse visual cortex. Scale bars = 2 µm. Page 2 of 42

 Venule Venule 5 µm Time (s) 33")
23 Supplementary Figure 11 Arterioles but not venules in the visual cortex respond to drifting grating visual stimuli a Site 1 Venule 14 c Site 1 Diameter (% ) Arteriole Venule Arteriole Time (s) 41 5 µm b Site 2 14 d Site 2 Arteriole Arteriole Diameter (% ) Venule Venule 5 µm Time (s) 33 Page 21 of 42
24 Supplementary Figure 11 Arterioles but not venules in the visual cortex respond to drifting grating visual stimuli (a b) Two-photon images collected from two adjacent cortical sites in the same mouse. The vascular lumen (green) was labeled by intravenous injection of fluorescein dextran. A single micropipette injection of Alexa 633 (red) selectively labeled arterioles in both sites. White hatched lines correspond to the cross-sections used to analyze the time course of change in vessel diameter with sensory stimulation (c d). White arrow in a denotes the 1-µm-diameter arteriole branchlet that was not labeled by Alexa 633. (c d) Time courses of percent change in the vessel diameter to visual stimulation for arterioles (red traces) and venules (blue traces) recorded simultaneously in each of the two sites using two-photon microscopy. The grey shaded rectangle denotes the period of visual stimulation. Each time course is shown as an average of twentyfour trials to a drifting grating visual stimulus. Error bands represent s.e.m. At both imaged sites, arterioles showed large sensory stimulus evoked responses. Venules were unresponsive to visual stimulation they never showed visually-evoked responses: ANOVA test was always P >.5 across blank and n test visual stimuli, the percentage change of visually-evoked dilation was always < 1%, and visually-evoked dilations never exceeded three standard deviations above the mean pre-stimulation baseline. Page 22 of 42


25 Supplementary Figure 12 Neuronal responses are unaffected by local micropipette application of Alexa 633 in the visual cortex a b Different cells from different cats Control With Alexa 633 d µm 5 µm e c 8 cell 9 º 9º 18º 27º 45º 135º 225º 315º f 8 cell 29 8 cell 4 8 cell 84 F/F (%) 8 cell 48 F/F (%) 8 cell 15 Time (s) 131 Time (s) 131 Page 23 of 42
26 Supplementary Figure 12 Neuronal responses are unaffected by local micropipette application of Alexa 633 in the visual cortex (a c) Masks of identified somata, local orientation map, and time course of calcium transients from a control cat (no Alexa 633 applied). Calcium transients were measured after bulk loading Oregon Green 488 Bapta-1 AM (OGB 1-AM). (d f) Data from another cat, but here Alexa 633 was co-injected with OGB 1-AM. Cell numbers listed in time courses (c,f) match corresponding numbers shown for somata masks (a,d). For the cell masks shown in a and d, cells painted in white were significantly tuned for orientation and cells painted in gray were untuned. Each time course in c and f show individual cell responses four trials superimposed. Greater than 9% of neurons in cat visual cortex were visually responsive both in control (where no Alexa 633 was co-injected with the calcium indicator) and Alexa 633 injected animals. The orientation selectivity index (OSI) of neurons was indistinguishable between control and Alexa 633 animals (control OSI =.736 ±.14 vs. Alexa 633 OSI =.737 ±.19, mean ± s.e.m; control n = 12 cells, Alexa 633 n = 11 cells; P =.46 Mann- Whitney). Cats have distinct iso-orientation domains and thus OGB 1-AM can be injected into specific orientation domains guided by intrinsic signal optical imaging. We deliberately chose cortical locations in control and Alexa 633 treated sites in cat visual cortex that had the same overall orientation and direction preference to avoid domain-based differences (cardinal stimulus orientations over-represented in visual cortex). Page 24 of 42

27 Supplementary Figure 13 Neuronal responses are unaffected before and after intravenous application of Alexa 633 in the same animal a b Control Identical cells in the same cat With Alexa 633 d µ m 5 µ m e c 8 º 9º 18º 27º 45º 135º 225º 315º Cell 58 f 8 Cell 58 8 Cell 61 8 Cell 61 ΔF/F (%) 8 Cell 91 Time (s) 131 Time (s) 131 ΔF/F (%) 8 Cell 91 Page 25 of 42
28 Supplementary Figure 13 Neuronal responses are unaffected before and after intravenous application of Alexa 633 in the same animal (a c) Masks of identified somata, local orientation map, and time course of calcium transients before Alexa 633 was applied. Calcium transients were measured after bulk loading Oregon Green 488 Bapta-1 AM (OGB 1- AM). (d f) Data from same cat exactly the same cells as shown in a c, but after Alexa 633 was applied intravenously (femoral vein). Cell numbers listed in time courses (c,f) match corresponding numbers shown for somata masks (a,d). For the cell masks shown in a and d, cells painted in white were significantly tuned for orientation and cells painted in gray were untuned. Each time course in c and f show individual cell responses four trials superimposed. For the identical neurons, before and after Alexa 633 application injected showed no difference in the amplitude of visually evoked responses (control amplitude F/F = ±.69 % vs. Alexa 633 amplitude F/F = ±.71 %, mean ± s.e.m; n = 15 cells; P =.22 Wilcoxon signed rank test) and orientation selectivity index (control OSI =.88 ±.12 vs. Alexa 633 OSI =.867 ±.14, mean ± s.e.m; n = 15 cells; P =.43 Wilcoxon signed rank test). Page 26 of 42
 1 s b. One hour after Alexa 633 i.v.")
29 Supplementary Figure 14 EEG and heart rate are unaffected by Alexa 633 a. Before Alexa 633 i.v. injection heart beat EEG raw 1 s 5 EEG frequency (Hz) 1 s b. One hour after Alexa 633 i.v. injection heart beat EEG raw 1 s 5 EEG frequency (Hz) 1 s Page 27 of 42
30 Supplementary Figure 14 EEG and heart rate are unaffected by Alexa 633 (a) Heart beat, raw EEG traces, and spectrogram of EEG records before intravenous injection of Alexa 633 in an anesthetized and paralyzed cat. (b) Heart beat, raw EEG traces, and spectrogram of EEG records after intravenous injection of Alexa 633 (1 mg kg 1 ) in the same anesthetized and paralyzed cat used to collect the data shown in a. No difference in heart rate and EEG activity was observed before and after Alexa 633 injection. Alexa 633 labeling of arterioles was visible when data shown in b were collected. Page 28 of 42


31 Supplementary Figure 15 Binding site of Alexa 633 on artery/arteriole wall a 1 b Alexa 633/SMA-α c 1 µm 1 µm Alexa 633/Glut d Alexa µm Alexa µm 5 µm f e Alexa 633 g Alexa 633/Laminin 1 µm Page 29 of 42
32 Supplementary Figure 15 Binding site of Alexa 633 on artery/arteriole wall (a) Schematic of the five distinct layers in the brain arteriole wall: 1. Outermost covering containing collagen, 2. smooth muscle, 3. elastin fibers, 4. endothelial basement membrane, 5. endothelial cells. (b) Anti-SMA-α (green) was used to label smooth muscle in brain arterioles. Anti-SMA-α shows no overlap with Alexa 633 (red) labeling. Data shown are from macaque monkey but identical results were obtained in rodents. (c) Anti-Glut1 (green) was used to label endothelial cells in brain arterioles no overlap with Alexa 633 labeling. Data shown are from mouse but identical results were obtained in other species. Images shown in b, c, g were collected with sequential scanning confocal microscopy. (d) Alexa 633 labeled six characteristic elastin fiber layers in mouse aorta, images collected by using low (2 mw) two-photon laser power. (e) Higher zoom of mouse aorta also collected using low two-photon laser power. Black square within the center of the labeled arteriole wall is from a preceding intentional high power two-photon laser bleach of Alexa 633, to demonstrate that Alexa 633 labeling was not contaminated by autofluorescence. (f) The signature pattern of thin external elastic lamina and thick internal elastic lamina of mouse femoral artery was visible with Alexa 633 staining. (g) Anti-laminin (green) was used to label endothelial basement membrane in mouse femoral artery. Antilaminin staining did not overlap with Alexa 633 labeling. The schematic shown in panel a was made specifically for the current publication and is an original drawing by Emma Vought, a medical illustrator in the Department of Neurosciences at the Medical University of South Carolina. The schematic is based on drawings shown in Principles of Anatomy & Physiology (13 th Edition) by Tortora & Derrickson (Wiley 212). Page 3 of 42


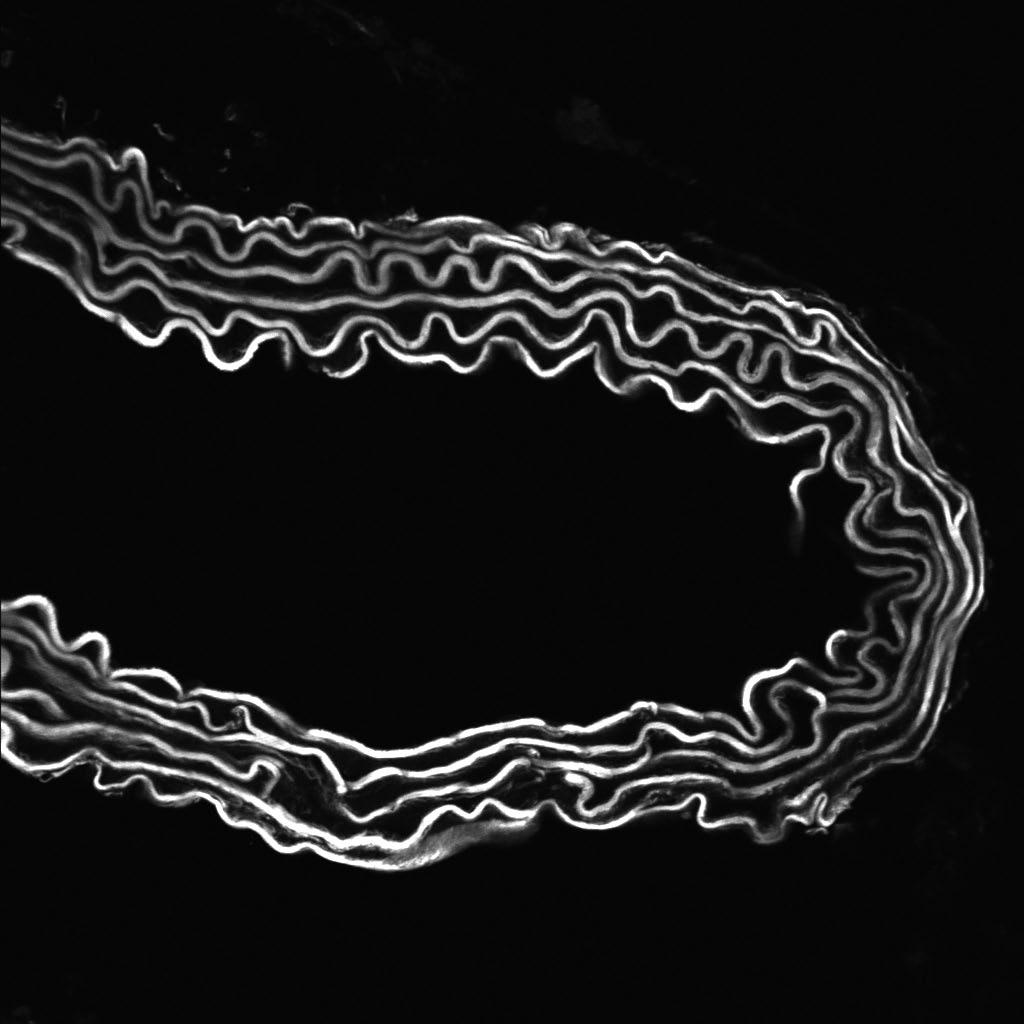
33 Supplementary Figure 16 Alexa 633 labels elastin fibers on artery walls in brain and aorta Ch2: Autofluorescence (low laser power) c mouse aorta b laser power: 2 mw laser power: 2 mw d f g h laser power: 2 mw laser power: 22 mw Merge Ch1 & Ch2 Ch2: Autofluorescence (high laser power) e laser power: 32 mw 5 µm 5 µm Ch1: Alexa 633 mouse visual cortex a laser power: 2 mw Page 31 of 42
34 Supplementary Figure 16 Alexa 633 labels elastin fibers on artery walls in brain and aorta (a,b) Two-photon images of a mouse brain arteriole and a mouse aorta labeled with Alexa 633 (laser power = 2 mw). Data collected on a red emission channel. (c,d) No autofluorescence was measured from the blue-green emission channel with 2 mw laser power. (e,f) Robust elastin autofluorescence was detected from the blue-green emission channel using high (22 32 mw) two-photon laser power. (g,h) Alexa 633 and elastin autofluorescence on the artery wall overlapped near perfectly (Pearson s R r =.84 and.96 in g and h, respectively). Images shown were collected from postmortem tissue sections. Page 32 of 42


35 Supplementary Figure 17 Alexa 633 labeling of human aorta a b 5 µm 5 µm Page 33 of 42
36 Supplementary Figure 17 Alexa 633 labeling of human aorta (a) Two-photon image from a human aorta postmortem tissue cross-section. Unlike the signature six layers of elastin fibers in mouse aorta (see Supplementary Fig. 15 d e), the human aorta has many more tightly packed bands of elastin fibers. From left to right, the image shows Alexa 633 labeling of the tunica media of the aorta and an abrupt transition to the adventitial layer. (b) Higher zoom of the tunica media shown in a. Individual elastin bundles of fibers were well labeled by Alexa 633. Not shown but analogous to our observations in animal tissues (see Supplementary Figs ), human tissue had no blue-green autofluorescence when using low two-photon laser power and high laser power bleached Alexa 633 labeling. Images are not background subtracted. Page 34 of 42


37 Supplementary Figure 18 Alexa 633 labeling of mouse kidney a Mouse Kidney Ch1: Alexa 633 d Mouse Kidney Ch2: Autofluorescence 5 µm b e 5 µm c f 5 µm Page 35 of 42
38 Supplementary Figure 18 Alexa 633 labeling of mouse kidney (a) Two-photon image of a freshly dissected kidney (no fixative). 2 µm Alexa 633 was applied directly to the dissected kidney. An arteriole shown as a longitudinal section was brightly labeled by Alexa 633. The Alexa 633 was applied immediately after the kidney was dissected. The image was collected approximately one hour after the topical Alexa 633 application. (b,c) Two-photon images from another freshly dissected kidney. But here Alexa 633 labeling was done in vivo by tail vein injection (1 mg kg 1 ). An individual two-photon optical slice is shown in b and a maximum intensity 1-µm-z-projection is shown in c. The kidneys were removed approximately 1 hour after the tail vein injection and immediately imaged. (d f). No blue-green autofluorescence detected with the same laser power used to collect red channel Alexa 633 fluorescence shown in a c. Image pairs a,d; b,e; and c,f were each collected simultaneously on two separate detector channels. Images are not background subtracted. Page 36 of 42
39 Supplementary Figure 19 Red blood cell velocity in cortical microvessels after intravenous injection of fluorescent dyes Distance (µm) Distance (µm) Distance (µm) Distance (µm) a Alexa 633 only Time (ms) 471 b Fluorescein dextran only Time (ms) 293 c Ch1: Alexa 633 Time (ms) 293 Ch2: Fluorescein dextran Time (ms) 293 Velocity (mm s 1 ) Velocity (mm s 1 ) Velocity (mm s 1 ) Velocity (mm s 1 ) Alexa 633 Fluorescein dextran Alexa 633 Fluorescein dextran Page 37 of 42
40 Supplementary Figure 19 Red blood cell velocity in cortical microvessels after intravenous injection of fluorescent dyes (a) Rat 1. Red blood cell velocity from line scans after an intravenous injection of Alexa 633. No fluorescein dextran was injected in this rat. Line scans were collected before Alexa 633 cleared the blood plasma. (b) Rat 2. Red blood cell velocity from line scans after intravenous injection of fluorescein dextran. No Alexa 633 was injected in this rat. (c) Rat 3. Red blood cell velocity from line scans after intravenous injection of Alexa 633 (recorded on PMT Channel 1) and fluorescein dextran (recorded on PMT Channel 2). Cross talk between the two PMT channels was eliminated by careful selection of PMT gain and the wide separation of emission bands between the red and green PMT filters used for Alexa 633 and fluorescein dextran imaging. As expected, line scan imaging on Alexa 633 and fluorescein dextran channels resulted in virtually identical mean velocity measurements. Raw line scan data shown for each of the three rat experiments are from a block of 2 line scans. In the mean velocity plots (right panels) error bars are standard deviations. Page 38 of 42
41 Supplementary Figure 2 Light path used for in vivo two-photon imaging 2-photon IR laser (Mai Tai) Half Wave Plate Polarizing beam Splitter Cube Pockels Cell Partially Reflective Mirror Beam Expander Lens Collimator Lens Mirror Beam Dump Power Meter 1 (continuous power monitoring during in vivo brain imaging experiments) Mirrors on servo motors to switch between small and wide beams (fill 4x or 2x objective back aperture) Mirror Shutter Scan Lens Mirror Mirror Mirror Mirror PMT 2 Green Emission Filter (ET525/5m-2p for OGB or fluorescein dextran) Mirror Tube Lens X/Y Galvo Mirrors PMT 1 PMT Cube IR Blocker (et7sp-2p8) Emission Focussing Lens Primary Dichroic (7 dcxr) Objective Lens (2x or 25x or 4x or 6x) Red Emission Filter (HQ645/7m-2p for Alexa 594 or ET665/4m-2p for Alexa 633) Sample plane Power Meter 2 (Calibration before & after brain imaging) Page 39 of 42
42 Supplementary Figure 2 Light path used for in vivo two-photon imaging Note that the specifications for objective lenses and a detailed protocol for line & frame scans are provided in the Methods. Page 4 of 42
43 Supplementary Note 1 Fluorescence dip artifact caused by arteriole dilation Guided by Alexa 633, we showed that arteriole dilation acts like a stimulus-evoked filter and leads to stimulusevoked dips in fluorescence from neurons located directly under arterioles but not veins. We suggest that claims in the literature of the presence of reductions in neural spiking activity (relative to spontaneous baseline firing) from calcium indicator imaging should also include the location of these neurons relative to surface arterioles. Also, the reports should explicitly demonstrate that arteriole dilation is not the source of decreases in neuronal fluorescence. Measurements of neuronal tuning bandwidth inferred from calcium indicator imaging also should include careful consideration of surface arteriole locations. The exact mechanism of how two-photon light passage through the dilating arteriole leads to a reduction in neuronal fluorescence remains to be determined. Perhaps, compared to the unstimulated baseline period, the relatively rapid dilation of arterioles upon sensory visual stimulation produces a larger local hemoglobin volume. This increased volume of hemoglobin absorbs more two-photon excitation light and emitted fluorescence from neurons. However, light scattering from the complex architecture of the arterial wall including the molecular dynamics of elastin fibers 23 should not be ruled out. Supplementary Note 2 Selectivity of Alexa 633 vs. other rhodamine derivatives Alexa 633 is a sulfonated rhodamine derivative 24. Different rhodamine derivatives have been reported to have selectivity for various cell types. Rhodamine-6G labels leukocytes 25. Rhodamine-123 labels mitochondria 26. Sulforhodamine-11 and sulforhodamine-b label astrocytes 27,28. Astrocyte-selective markers like sulforhodamine-11 and sulforhodamine-b will, by definition, outline many vessels including capillaries in the brain via astrocyte end-feet apposition to blood vessels 27. More recently, sulforhodamine-11 has been suggested to also label endothelial cells lining arteries in the cerebral cortex 29, but such labeling of multiple cell classes with sulforhodamine-11 means that distinguishing arterioles from venules remains difficult. The labeling of different cell types alongside vessels of different classes also makes it difficult to use sulforhodamine-11 to track changes in vessel diameter. Finally, sulforhodamine-11 via astrocyte labeling has been reported to induce epileptic seizures by lowering the neuronal action potential threshold 3, further undermining the use of this compound in neurovascular coupling studies in vivo. Our methods provide strong evidence for artery and arteriole specificity of Alexa 633 in the brain bright labeling of a continuous band of elastin fibers wedged between smooth muscle and endothelial basement membrane (with no labeling of neurons, astrocytes, veins, venules, or pericytes). It is possible that excessively high concentrations of Alexa 633 application via many dozens of high pressure pulses through the micropipette rather than just a few low Page 41 of 42
44 pressure pulses of a few psi, or higher than our suggested intravenous dose, combined use of detergents like DMSO, or any stress (e.g., physical, chemical, oxidative, metabolic), that induces astrocytes to become reactive may all lead to non-specific labeling. Poor PMT filter design and resulting cross talk from OGB or GFP labeled neurons and/or astrocytes may also lead to the appearance of non-specific labeling. Although we have examined labeling in five tissue types across five species, we cannot exclude the possibility that some veins in other species or tissues may also take up Alexa 633. Possibly, some peripheral vasculature in the extremities of the limbs, large veins like the superior vena cava in some species, or parenchymal cells in the liver could take up Alexa 633. For example, we have observed some dis-continuous Alexa 633 labeling in femoral veins (data not shown). Note that the astrocyte-specific dye sulforhodamine-11 (discussed above) also labels oligodendrocytes in the retina 31 and motor neurons that innervate peripheral muscles 32. Our review of the literature on the anatomy of veins and venules throughout the body suggest that the presence of a continuous band of elastin in these structures is rather unlikely. But regardless of any future uncovering of accumulation of Alexa 633 in cells or connective tissue in some part of the body, our study establishes the utility for Alexa 633 in neurovascular coupling research. Supplementary References 23. Tamburro, A.M. Nanomedicine (Lond.) 4, (29). 24. Agnew, B., Gee, K.R. & Nyberg, T.G., United States Patent Application No (Oct. 25, 27). 25. Schwarzmaier, S.M., Kim, S.W., Trabold, R. & Plesnila, N. J. Neurotrauma 27, (21). 26. Johnson, L.V., Walsh, M.L. & Chen, L.B. Proc. Natl. Acad. Sci. USA 77, (198). 27. Nimmerjahn, A., Kirchhoff, F., Kerr, J.N. & Helmchen, F. Nat. Methods 1, (24). 28. Verant, P., Ricard, C., Serduc, R., Vial, J.C. & van der Sanden, B. J. Biomed. Opt. 13, 6428 (28). 29. McCaslin, A.F., Chen, B.R., Radosevich, A.J., Cauli, B. & Hillman, E.M. J. Cereb. Blood Flow Metab. 31, (211). 3. Kang, J. et al. Neuroscience 169, (21). 31. Ehinger, B., Zucker, C.L., Bruun, A. & Adolph, A. Glia 1, 4-48 (1994). 32. Lichtman, J.W., Wilkinson, R.S. & Rich, M.M. Nature 314, (1985). Page 42 of 42
Supplementary Figure 1
 Supplementary Figure 1 The average sigmoid parametric curves of capillary dilation time courses and average time to 50% peak capillary diameter dilation computed from individual capillary responses averaged
Intravital Microscopic Interrogation of Peripheral Taste Sensation
 Supplementary Information Intravital Microscopic Interrogation of Peripheral Taste Sensation Myunghwan Choi 1, Woei Ming Lee 1,2, and Seok-Hyun Yun 1 * 1 Harvard Medical School and Wellman Center for Photomedicine,
Nature Neuroscience: doi: /nn Supplementary Figure 1. Large-scale calcium imaging in vivo.
 Supplementary Figure 1 Large-scale calcium imaging in vivo. (a) Schematic illustration of the in vivo camera imaging set-up for large-scale calcium imaging. (b) High-magnification two-photon image from
Supplementary Materials for
 www.sciencetranslationalmedicine.org/cgi/content/full/4/117/117ra8/dc1 Supplementary Materials for Notch4 Normalization Reduces Blood Vessel Size in Arteriovenous Malformations Patrick A. Murphy, Tyson
Nature Neuroscience: doi: /nn Supplementary Figure 1
 Supplementary Figure 1 Relative expression of K IR2.1 transcript to enos was reduced 29-fold in capillaries from knockout animals. Relative expression of K IR2.1 transcript to enos was reduced 29-fold
Nature Neuroscience: doi: /nn Supplementary Figure 1. Trial structure for go/no-go behavior
 Supplementary Figure 1 Trial structure for go/no-go behavior a, Overall timeline of experiments. Day 1: A1 mapping, injection of AAV1-SYN-GCAMP6s, cranial window and headpost implantation. Water restriction
Nature Methods: doi: /nmeth Supplementary Figure 1. Activity in turtle dorsal cortex is sparse.
 Supplementary Figure 1 Activity in turtle dorsal cortex is sparse. a. Probability distribution of firing rates across the population (notice log scale) in our data. The range of firing rates is wide but
Supplementary Figure 1. GABA depolarizes the majority of immature neurons in the
 Supplementary Figure 1. GABA depolarizes the majority of immature neurons in the upper cortical layers at P3 4 in vivo. (a b) Cell-attached current-clamp recordings illustrate responses to puff-applied
Supplementary information - Table (1), Figures (12), and Videos (5)
, Figures (12), and Videos (5)") Supplementary information - Table (1), Figures (12), and Videos (5) A soft, transparent, freely accessible cranial window for chronic imaging and electrophysiology Chaejeong Heo 1, Hyejin Park 1, 2, Yong-Tae
Supplementary information - Table (1), Figures (12), and Videos (5) A soft, transparent, freely accessible cranial window for chronic imaging and electrophysiology Chaejeong Heo 1, Hyejin Park 1, 2, Yong-Tae
A genetically targeted optical sensor to monitor calcium signals in astrocyte processes
 A genetically targeted optical sensor to monitor calcium signals in astrocyte processes 1 Eiji Shigetomi, 1 Sebastian Kracun, 2 Michael V. Sofroniew & 1,2 *Baljit S. Khakh Ψ 1 Departments of Physiology
Summary of behavioral performances for mice in imaging experiments.
 Supplementary Figure 1 Summary of behavioral performances for mice in imaging experiments. (a) Task performance for mice during M2 imaging experiments. Open triangles, individual experiments. Filled triangles,
Supplementary Figure 1. ACE robotic platform. A. Overview of the rig setup showing major hardware components of ACE (Automatic single Cell
 2 Supplementary Figure 1. ACE robotic platform. A. Overview of the rig setup showing major hardware components of ACE (Automatic single Cell Experimenter) including the MultiClamp 700B, Digidata 1440A,
Supplementary Information
 Nature Immunology doi:1.138/ni.2477 Supplementary Information Capillary and arteriolar pericytes attract innate leukocytes exiting through venules and instruct them with pattern recognition and motility
Supplemental Information. Octopamine Neurons Mediate Flight-Induced Modulation of Visual Processing in Drosophila. Supplemental Inventory
 1 Current Biology, Volume 22 Supplemental Information Octopamine Neurons Mediate Flight-Induced Modulation of Visual Processing in Drosophila Marie P. Suver, Akira Mamiya, and Michael H. Dickinson Supplemental
Supplementary Information. Staged decline of neuronal function in vivo in an animal model of Alzheimer s Disease. Supplementary Figures S1-10
 Supplementary Information Staged decline of neuronal function in vivo in an animal model of Alzheimer s Disease Christine Grienberger 1 *, Nathalie L. Rochefort 1 *, Helmuth Adelsberger 1, Horst A. Henning
Specimen. Humeral Head. Femoral Head. Objective. Femoral Condyle (medial) Supplementary Figure 1
 Supplementary Figure 1") A B Specimen Humeral Head 2 1 µm 76 µm Femoral Head Objective Femoral Condyle (medial) Supplementary Figure 1 A Femoral Head Global Cell Density Superficial Cell Density Cell Number at 1 µm Nuclei /.1
A B Specimen Humeral Head 2 1 µm 76 µm Femoral Head Objective Femoral Condyle (medial) Supplementary Figure 1 A Femoral Head Global Cell Density Superficial Cell Density Cell Number at 1 µm Nuclei /.1
Sum of Neurally Distinct Stimulus- and Task-Related Components.
 SUPPLEMENTARY MATERIAL for Cardoso et al. 22 The Neuroimaging Signal is a Linear Sum of Neurally Distinct Stimulus- and Task-Related Components. : Appendix: Homogeneous Linear ( Null ) and Modified Linear
SUPPLEMENTARY INFORMATION. Supplementary Figure 1
 SUPPLEMENTARY INFORMATION Supplementary Figure 1 The supralinear events evoked in CA3 pyramidal cells fulfill the criteria for NMDA spikes, exhibiting a threshold, sensitivity to NMDAR blockade, and all-or-none
Supplemental Information. A Visual-Cue-Dependent Memory Circuit. for Place Navigation
 Neuron, Volume 99 Supplemental Information A Visual-Cue-Dependent Memory Circuit for Place Navigation Han Qin, Ling Fu, Bo Hu, Xiang Liao, Jian Lu, Wenjing He, Shanshan Liang, Kuan Zhang, Ruijie Li, Jiwei
Structural basis for the role of inhibition in facilitating adult brain plasticity
 Structural basis for the role of inhibition in facilitating adult brain plasticity Jerry L. Chen, Walter C. Lin, Jae Won Cha, Peter T. So, Yoshiyuki Kubota & Elly Nedivi SUPPLEMENTARY FIGURES 1-6 a b M
Fibrinogen-induced perivascular microglial clustering is required for the. development of axonal damage in neuroinflammation
 SUPPLEMENTARY INFORMATION Fibrinogen-induced perivascular microglial clustering is required for the development of axonal damage in neuroinflammation Dimitrios Davalos, Jae Kyu Ryu, Mario Merlini, Kim
CD4 and CD8 T cells show a similar accumulation in the tumor stroma.
 Fig S1 CD4 Fibronectin EpCM CD8 CD4 and CD8 T cells show a similar accumulation in the tumor stroma. Fluorescently-labeled CD4 (CMFD, green) and CD8 (Hoechst, yellow) T cells were added to a human lung
Unique functional properties of somatostatin-expressing GABAergic neurons in mouse barrel cortex
 Supplementary Information Unique functional properties of somatostatin-expressing GABAergic neurons in mouse barrel cortex Luc Gentet, Yves Kremer, Hiroki Taniguchi, Josh Huang, Jochen Staiger and Carl
Nature Neuroscience: doi: /nn Supplementary Figure 1. Lick response during the delayed Go versus No-Go task.
 Supplementary Figure 1 Lick response during the delayed Go versus No-Go task. Trial-averaged lick rate was averaged across all mice used for pyramidal cell imaging (n = 9). Different colors denote different
Cardiovascular Physiology
 Cardiovascular Physiology Lecture 1 objectives Explain the basic anatomy of the heart and its arrangement into 4 chambers. Appreciate that blood flows in series through the systemic and pulmonary circulations.
John Nguyen, Nozomi Nishimura, Robert Fetcho, Costantino Iadecola, Chris B. Schaffer
 Supplemental figures and text for Occlusion of cortical ascending venules causes blood flow decreases, reversals in flow direction, and vessel dilation in upstream capillaries John Nguyen, Nozomi Nishimura,
Supplementary Figure 1. SybII and Ceb are sorted to distinct vesicle populations in astrocytes. Nature Neuroscience: doi: /nn.
 Supplementary Figure 1 SybII and Ceb are sorted to distinct vesicle populations in astrocytes. (a) Exemplary images for cultured astrocytes co-immunolabeled with SybII and Ceb antibodies. SybII accumulates
OPTO 5320 VISION SCIENCE I
 OPTO 5320 VISION SCIENCE I Monocular Sensory Processes of Vision: Color Vision Mechanisms of Color Processing . Neural Mechanisms of Color Processing A. Parallel processing - M- & P- pathways B. Second
Supporting Online Material for
 www.sciencemag.org/cgi/content/full/317/5841/183/dc1 Supporting Online Material for Astrocytes Potentiate Transmitter Release at Single Hippocampal Synapses Gertrudis Perea and Alfonso Araque* *To whom
Supplementary Figure 1 Information on transgenic mouse models and their recording and optogenetic equipment. (a) 108 (b-c) (d) (e) (f) (g)
 108 (b-c) (d) (e) (f) (g)") Supplementary Figure 1 Information on transgenic mouse models and their recording and optogenetic equipment. (a) In four mice, cre-dependent expression of the hyperpolarizing opsin Arch in pyramidal cells
Supplementary Figure 1 Information on transgenic mouse models and their recording and optogenetic equipment. (a) In four mice, cre-dependent expression of the hyperpolarizing opsin Arch in pyramidal cells
How we study the brain: a survey of methods used in neuroscience
 How we study the brain: a survey of methods used in neuroscience Preparing living neurons for recording Large identifiable neurons in a leech Rohon-Beard neurons in a frog spinal cord Living slice of a
Supplementary Figure 1
 Supplementary Figure 1 Miniature microdrive, spike sorting and sleep stage detection. a, A movable recording probe with 8-tetrodes (32-channels). It weighs ~1g. b, A mouse implanted with 8 tetrodes in
Tuning properties of individual circuit components and stimulus-specificity of experience-driven changes.
 Supplementary Figure 1 Tuning properties of individual circuit components and stimulus-specificity of experience-driven changes. (a) Left, circuit schematic with the imaged component (L2/3 excitatory neurons)
Supplementary Information
 Supplementary Information Title Degeneration and impaired regeneration of gray matter oligodendrocytes in amyotrophic lateral sclerosis Authors Shin H. Kang, Ying Li, Masahiro Fukaya, Ileana Lorenzini,
Supporting Online Material for
 www.sciencemag.org/cgi/content/full/312/5779/1533/dc1 Supporting Online Material for Long-Term Potentiation of Neuron-Glia Synapses Mediated by Ca 2+ - Permeable AMPA Receptors Woo-Ping Ge, Xiu-Juan Yang,
Wenqin Hu, Cuiping Tian, Tun Li, Mingpo Yang, Han Hou & Yousheng Shu
 Distinct contributions of Na v 1.6 and Na v 1.2 in action potential initiation and backpropagation Wenqin Hu, Cuiping Tian, Tun Li, Mingpo Yang, Han Hou & Yousheng Shu Supplementary figure and legend Supplementary
Cerebral vascular structure in the motor cortex of adult mice is stable and is not altered by voluntary exercise
 Original Article Cerebral vascular structure in the motor cortex of adult mice is stable and is not altered by voluntary exercise Journal of Cerebral Blood Flow & Metabolism () 1 19! Author(s) 216 Reprints
Reward prediction based on stimulus categorization in. primate lateral prefrontal cortex
 Reward prediction based on stimulus categorization in primate lateral prefrontal cortex Xiaochuan Pan, Kosuke Sawa, Ichiro Tsuda, Minoro Tsukada, Masamichi Sakagami Supplementary Information This PDF file
Copyright 2010 Pearson Education, Inc. Blood Vessel Structure
 Blood Vessel Structure Structure of Blood Vessel Walls Arteries and veins Tunica intima, tunica media, and tunica externa Lumen Central blood-containing space Capillaries Endothelium with sparse basal
Supplementary Figure 1. SDS-FRL localization of CB 1 in the distal CA3 area of the rat hippocampus. (a-d) Axon terminals (t) in stratum pyramidale
 Axon terminals (t) in stratum pyramidale") Supplementary Figure 1. SDS-FRL localization of CB 1 in the distal CA3 area of the rat hippocampus. (a-d) Axon terminals (t) in stratum pyramidale (b) show stronger immunolabeling for CB 1 than those in
Supplementary Figure 1. SDS-FRL localization of CB 1 in the distal CA3 area of the rat hippocampus. (a-d) Axon terminals (t) in stratum pyramidale (b) show stronger immunolabeling for CB 1 than those in
Nature Neuroscience: doi: /nn Supplementary Figure 1. Behavioral training.
 Supplementary Figure 1 Behavioral training. a, Mazes used for behavioral training. Asterisks indicate reward location. Only some example mazes are shown (for example, right choice and not left choice maze
Lab Activity 25. Blood Vessels & Circulation. Portland Community College BI 232
 Lab Activity 25 Blood Vessels & Circulation Portland Community College BI 232 Artery and Vein Histology Walls have 3 layers: Tunica intima Tunica media Tunica externa 2 Tunica Intima Is the innermost layer
Nature Neuroscience: doi: /nn Supplementary Figure 1
 Supplementary Figure 1 Drd1a-Cre driven ChR2 expression in the SCN. (a) Low-magnification image of a representative Drd1a-ChR2 coronal brain section (n = 2) showing endogenous tdtomato fluorescence (magenta).
M Cells. Why parallel pathways? P Cells. Where from the retina? Cortical visual processing. Announcements. Main visual pathway from retina to V1
 Announcements exam 1 this Thursday! review session: Wednesday, 5:00-6:30pm, Meliora 203 Bryce s office hours: Wednesday, 3:30-5:30pm, Gleason https://www.youtube.com/watch?v=zdw7pvgz0um M Cells M cells
Supplementary Figure 1. Identification of the type II spiral ganglion neurons (SGN) via immunofluorescence of peripherin protein (PRPH).
 via immunofluorescence of peripherin protein (PRPH).") Supplementary Figure 1. Identification of the type II spiral ganglion neurons (SGN) via immunofluorescence of peripherin protein (PRPH). (a), (b), PRPH immunolabelling of cryosections from post-natal day
Supplementary Figure 1. Identification of the type II spiral ganglion neurons (SGN) via immunofluorescence of peripherin protein (PRPH). (a), (b), PRPH immunolabelling of cryosections from post-natal day
Nature Neuroscience: doi: /nn Supplementary Figure 1. Confirmation that optogenetic inhibition of dopaminergic neurons affects choice
 Supplementary Figure 1 Confirmation that optogenetic inhibition of dopaminergic neurons affects choice (a) Sample behavioral trace as in Figure 1d, but with NpHR stimulation trials depicted as green blocks
Supplementary Materials for
 advances.sciencemag.org/cgi/content/full/3/3/e1600955/dc1 Supplementary Materials for Flexible and stretchable nanowire-coated fibers for optoelectronic probing of spinal cord circuits Chi Lu, Seongjun
On Different Wavelengths: The Spectrum of Retinal Imaging. On Different Wavelengths: The Spectrum of Retinal Imaging. Wavelength Specific Imaging
 On Different Wavelengths: The Spectrum of Retinal Imaging Timothy J. Bennett, CRA, FOPS, OCT-C Penn State Hershey Eye Center Hershey, PA On Different Wavelengths: The Spectrum of Retinal Imaging Wavelengths
Supplemental Information. Memory-Relevant Mushroom Body. Output Synapses Are Cholinergic
 Neuron, Volume 89 Supplemental Information Memory-Relevant Mushroom Body Output Synapses Are Cholinergic Oliver Barnstedt, David Owald, Johannes Felsenberg, Ruth Brain, John-Paul Moszynski, Clifford B.
File name: Supplementary Information Description: Supplementary Figures, Supplementary Table and Supplementary References
 File name: Supplementary Information Description: Supplementary Figures, Supplementary Table and Supplementary References File name: Supplementary Data 1 Description: Summary datasheets showing the spatial
Supplementary Information
 Supplementary Information D-Serine regulates cerebellar LTD and motor coordination through the 2 glutamate receptor Wataru Kakegawa, Yurika Miyoshi, Kenji Hamase, Shinji Matsuda, Keiko Matsuda, Kazuhisa
The individual animals, the basic design of the experiments and the electrophysiological
 SUPPORTING ONLINE MATERIAL Material and Methods The individual animals, the basic design of the experiments and the electrophysiological techniques for extracellularly recording from dopamine neurons were
Plasticity of Cerebral Cortex in Development
 Plasticity of Cerebral Cortex in Development Jessica R. Newton and Mriganka Sur Department of Brain & Cognitive Sciences Picower Center for Learning & Memory Massachusetts Institute of Technology Cambridge,
Cardiac Conduction System
 Cardiac Conduction System What causes the Heart to Beat? Heart contracts by electrical signals! Cardiac muscle tissue contracts on its own an electrical signal is sent out by the heart so that all cells
Histology of the Cardiac System. Dr. Nabil Khoury Anatomy Department
 Histology of the Cardiac System Dr. Nabil Khoury Anatomy Department Objectives 1. Identify the 3 layers of the heart endocardium, myocardium, epicardium 2. Differentiate cardiacmuscle 3. Define intercalated
Supplementary figure 1: LII/III GIN-cells show morphological characteristics of MC
 1 2 1 3 Supplementary figure 1: LII/III GIN-cells show morphological characteristics of MC 4 5 6 7 (a) Reconstructions of LII/III GIN-cells with somato-dendritic compartments in orange and axonal arborizations
Nature Neuroscience: doi: /nn Supplementary Figure 1
 Supplementary Figure 1 Reward rate affects the decision to begin work. (a) Latency distributions are bimodal, and depend on reward rate. Very short latencies (early peak) preferentially occur when a greater
Astrocyte signaling controls spike timing-dependent depression at neocortical synapses
 Supplementary Information Astrocyte signaling controls spike timing-dependent depression at neocortical synapses Rogier Min and Thomas Nevian Department of Physiology, University of Berne, Bern, Switzerland
Supplementary materials for: Executive control processes underlying multi- item working memory
 Supplementary materials for: Executive control processes underlying multi- item working memory Antonio H. Lara & Jonathan D. Wallis Supplementary Figure 1 Supplementary Figure 1. Behavioral measures of
Santulli G. et al. A microrna-based strategy to suppress restenosis while preserving endothelial function
 ONLINE DATA SUPPLEMENTS Santulli G. et al. A microrna-based strategy to suppress restenosis while preserving endothelial function Supplementary Figures Figure S1 Effect of Ad-p27-126TS on the expression
Nature Neuroscience doi: /nn Supplementary Figure 1. Characterization of viral injections.
 Supplementary Figure 1 Characterization of viral injections. (a) Dorsal view of a mouse brain (dashed white outline) after receiving a large, unilateral thalamic injection (~100 nl); demonstrating that
SUPPLEMENTARY INFORMATION
 doi:10.1038/nature10776 Supplementary Information 1: Influence of inhibition among blns on STDP of KC-bLN synapses (simulations and schematics). Unconstrained STDP drives network activity to saturation
Supplementary Figure 1. Nature Neuroscience: doi: /nn.4547
 Supplementary Figure 1 Characterization of the Microfetti mouse model. (a) Gating strategy for 8-color flow analysis of peripheral Ly-6C + monocytes from Microfetti mice 5-7 days after TAM treatment. Living
3.4. The Circulatory System
 The Circulatory System The human circulatory system is made up of the blood, the heart, and the blood vessels. The function of the circulatory system is to transport substances around the body. It moves
The Circulatory System
 The Circulatory System Key Questions What are the functions of the circulatory system? How does the heart pump blood through the body? What are three types of blood vessels? Vocabulary myocardium atrium
Supplementary Movie Caption
 Supplementary Movie Caption 1. Movie S1. Ultrasound-induced blood focusing in vitro (Fig.2b). 2. Movie S2. Acoustic canalization of blood flow in the gap between two capillaries (Fig. 2d). 3. Movie S3.
Supplementary Figure 1: Kv7 currents in neonatal CA1 neurons measured with the classic M- current voltage-clamp protocol.
 Supplementary Figures 1-11 Supplementary Figure 1: Kv7 currents in neonatal CA1 neurons measured with the classic M- current voltage-clamp protocol. (a), Voltage-clamp recordings from CA1 pyramidal neurons
Dep. Control Time (min)
") aa Control Dep. RP 1s 1 mv 2s 1 mv b % potentiation of IPSP 2 15 1 5 Dep. * 1 2 3 4 Time (min) Supplementary Figure 1. Rebound potentiation of IPSPs in PCs. a, IPSPs recorded with a K + gluconate pipette
aa Control Dep. RP 1s 1 mv 2s 1 mv b % potentiation of IPSP 2 15 1 5 Dep. * 1 2 3 4 Time (min) Supplementary Figure 1. Rebound potentiation of IPSPs in PCs. a, IPSPs recorded with a K + gluconate pipette
Blood Vessels. Types of Blood Vessels Arteries carry blood away from the heart Capillaries smallest blood vessels. Veins carry blood toward the heart
 C H A P T E R Blood Vessels 20 Types of Blood Vessels Arteries carry blood away from the heart Capillaries smallest blood vessels The site of exchange of molecules between blood and tissue fluid Veins
J. Cell Sci. 129: doi: /jcs : Supplementary information
 Movie 1. AgLDL is contained in small sub-regions of the lysosomal synapse that are acidic. J774 cells were incubated with agldl dual labeled with a ph sensitive and a ph insensitive fluorophore for 1 hr.
Macrophages form functional vascular mimicry channels in vivo. SI Figures and Legend
 Macrophages form functional vascular mimicry channels in vivo Authors: *Faith H. Barnett, *Mauricio Rosenfeld, Malcolm Wood, William Kiosses, Yoshihiko Usui, Valentina Marchetti, Edith Aguilar, and Martin
Supplementary Information for Correlated input reveals coexisting coding schemes in a sensory cortex
 Supplementary Information for Correlated input reveals coexisting coding schemes in a sensory cortex Luc Estebanez 1,2 *, Sami El Boustani 1 *, Alain Destexhe 1, Daniel E. Shulz 1 1 Unité de Neurosciences,
Supplementary Figure 1
 Supplementary Figure 1 Supplementary Figure 1 SNARE Probes for FRET/2pFLIM Analysis Used in the Present Study. mturquoise (mtq) and Venus (Ven) are in blue and yellow, respectively. The soluble N-ethylmaleimide-sensitive
Any of these questions could be asked as open question or lab question, thus study them well
 Any of these questions could be asked as open question or lab question, thus study them well describe the factors which regulate cardiac output describe the sympathetic and parasympathetic control of heart
Intrinsic Signal Optical Imaging
 Intrinsic Signal Optical Imaging Introduction Intrinsic signal optical imaging (ISOI) is a technique used to map dynamics in single cells, brain slices and even and most importantly entire mammalian brains.
The cardiovascular system
 The cardiovascular system Components of the Cardiovascular system Heart Vessels: Arteries Capillaries Veins Functions of CVS: Transportation system where blood is the transporting vehicle Carries oxygen,
Light-evoked hyperpolarization and silencing of neurons by conjugated polymers
 Light-evoked hyperpolarization and silencing of neurons by conjugated polymers Paul Feyen 1,, Elisabetta Colombo 1,2,, Duco Endeman 1, Mattia Nova 1, Lucia Laudato 2, Nicola Martino 2,3, Maria Rosa Antognazza
Tanimoto et al., http ://www.jcb.org /cgi /content /full /jcb /DC1
 Supplemental material JCB Tanimoto et al., http ://www.jcb.org /cgi /content /full /jcb.201510064 /DC1 THE JOURNAL OF CELL BIOLOGY Figure S1. Method for aster 3D tracking, extended characterization of
Supplementary Figure 1
 8w Pia II/III IV V VI PV EYFP EYFP PV EYFP PV d PV EYFP Supplementary Figure a Spike probability x - PV-Cre d Spike probability x - RS RS b e Spike probability Spike probability.6......8..... FS FS c f
Supplementary Figure 1. Mother centrioles can reduplicate while in the close association
 C1-GFP distance (nm) C1-GFP distance (nm) a arrested HeLa cell expressing C1-GFP and Plk1TD-RFP -3 s 1 2 3 4 5 6 7 8 9 11 12 13 14 16 17 18 19 2 21 22 23 24 26 27 28 29 3 b 9 8 7 6 5 4 3 2 arrested HeLa
Hormonal gain control of a medial preoptic area social reward circuit
 CORRECTION NOTICE Nat. Neurosci. 20, 449 458 (2017) Hormonal gain control of a medial preoptic area social reward circuit Jenna A McHenry, James M Otis, Mark A Rossi, J Elliott Robinson, Oksana Kosyk,
Nature Neuroscience: doi: /nn Supplementary Figure 1
 Supplementary Figure 1 Atlas representations of the midcingulate (MCC) region targeted in this study compared against the anterior cingulate (ACC) region commonly reported. Coronal sections are shown on
SUPPLEMENTARY INFORMATION
 DOI: 10.1038/ncb2988 Supplementary Figure 1 Kif7 L130P encodes a stable protein that does not localize to cilia tips. (a) Immunoblot with KIF7 antibody in cell lysates of wild-type, Kif7 L130P and Kif7
Microcircuitry coordination of cortical motor information in self-initiation of voluntary movements
 Y. Isomura et al. 1 Microcircuitry coordination of cortical motor information in self-initiation of voluntary movements Yoshikazu Isomura, Rie Harukuni, Takashi Takekawa, Hidenori Aizawa & Tomoki Fukai
Ube3a is required for experience-dependent maturation of the neocortex
 Ube3a is required for experience-dependent maturation of the neocortex Koji Yashiro, Thorfinn T. Riday, Kathryn H. Condon, Adam C. Roberts, Danilo R. Bernardo, Rohit Prakash, Richard J. Weinberg, Michael
Blood Vessels and Our Pulse
 Blood Vessels and Our Pulse Blood Vessels in Your Body All the blood vessels in your body joined together in a straight line would reach from St. John s, Newfoundland, to Victoria, British Columbia, and
Real-time imaging reveals the single steps of brain metastasis fo mation r
 Real-time imaging reveals the single steps of brain metastasis fo mation r Yvonne Kienast, Louisa von Baumgarten, Martin Fuhrmann, Wolfgang E.F. Klinkert, Roland Goldbrunner, Jochen Herms and Frank Winkler
Anatomy Review: The Heart Graphics are used with permission of A.D.A.M. Software, Inc. and Benjamin/Cummings Publishing Co.
 Anatomy Review: The Heart Graphics are used with permission of A.D.A.M. Software, Inc. and Benjamin/Cummings Publishing Co. Anatomy Views Label the diagrams of the heart below: Interactive Physiology Study
Cardiovascular System Blood Vessels
 Cardiovascular System Blood Vessels Structure of Blood Vessels The three layers (tunics) Tunica intima composed of simple squamous epithelium Tunica media sheets of smooth muscle Contraction vasoconstriction
Thalamo-Cortical Relationships Ultrastructure of Thalamic Synaptic Glomerulus
 Central Visual Pathways V1/2 NEUR 3001 dvanced Visual Neuroscience The Lateral Geniculate Nucleus () is more than a relay station LP SC Professor Tom Salt UCL Institute of Ophthalmology Retina t.salt@ucl.ac.uk
Supplementary Table I Blood pressure and heart rate measurements pre- and post-stroke
 SUPPLEMENTARY INFORMATION doi:10.1038/nature09511 Supplementary Table I Blood pressure and heart rate measurements pre- and post-stroke Pre Post 7-days Systolic Diastolic BPM Systolic Diastolic BPM Systolic
The Circulatory System. Lesson Overview. Lesson Overview The Circulatory System
 33.1 THINK ABOUT IT More than one-third of the 1.2 million Americans who suffer a heart attack each year die. This grim evidence shows that the heart and the circulatory system it powers are vital to life.
Ch. 12 The Circulatory System. The heart. The heart is a double pump. A quick note on arteries vs. veins. = the muscular pump of the CV system
 Ch. 12 The Circulatory System The heart A.k.a. the cardiovascular system Blood was discussed in Ch. 11 Focus of Ch. 12: heart and blood vessels = the muscular pump of the CV system ~ 100,000 heartbeats/day!
Major Function of the Cardiovascular System. Transportation. Structures of the Cardiovascular System. Heart - muscular pump
 Structures of the Cardiovascular System Heart - muscular pump Blood vessels - network of tubes Blood - liquid transport vehicle brachiocephalic trunk superior vena cava right pulmonary arteries right pulmonary
Supplementary Figure 1. Basic properties of compound EPSPs at
 Supplementary Figure 1. Basic properties of compound EPSPs at hippocampal CA3 CA3 cell synapses. (a) EPSPs were evoked by extracellular stimulation of the recurrent collaterals and pharmacologically isolated
The Circulatory System
 The Circulatory System Dr. Sami Zaqout The circulatory system Circulatory system Blood vascular systems Lymphatic vascular systems Blood vascular systems Blood vascular systems The circulatory system Circulatory
Supplementary Data Dll4-containing exosomes induce capillary sprout retraction ina 3D microenvironment
 Supplementary Data Dll4-containing exosomes induce capillary sprout retraction ina 3D microenvironment Soheila Sharghi-Namini 1, Evan Tan 1,2, Lee-Ling Sharon Ong 1, Ruowen Ge 2 * and H. Harry Asada 1,3
SUPPLEMENTARY INFORMATION
 DOI: 10.1038/ncb3443 In the format provided by the authors and unedited. Supplementary Figure 1 TC and SC behaviour during ISV sprouting. (a) Predicted outcome of TC division and competitive Dll4-Notch-mediated
Anatomy of the Blood Vessels
 Biology 212: Anatomy and Physiology II Anatomy of the Blood Vessels References: Saladin, KS: Anatomy and Physiology, The Unity of Form and Function 8 th (2018). Required reading before beginning this lab:
Vessels by Design: Basic Vessel Anatomy. Student Information Page 3A
 Vessels by Design: Basic Vessel Anatomy Student Information Page 3A Activity Introduction: Once you get home from running around all day, your throat is probably a little dry. You go to your kitchen, get