Gene Set Enrichment Analysis: A Knowledge-Based Approach for Interpreting Genome-wide Expression Profiles
|
|
|
- Griffin Banks
- 5 years ago
- Views:
Transcription
1 8/3/05 Gene Set Enrichment Analysis: A Knowledge-Based Approach for Interpreting Genome-wide Expression Profiles Aravind Subramanian *,, Pablo Tamayo *,, Vamsi K. Mootha,, Sayan Mukherjee, Benjamin L. Ebert,, Michael A. Gillette,, Amanda Paulovich, Scott L. Pomeroy **, Todd R. Golub,, Eric S. Lander,,,, Jill P. Mesirov * These authors contributed equally to this work Broad Institute of MIT and Harvard, 320 Charles St. Cambridge, MA, Department of Systems Biology, Alpert 536, Harvard Medical School, 200 Longwood Ave, Boston, MA Institute for Genome Sciences and Policy, CIEMAS, Duke University 101 Science Drive, Durham, NC Department of Medical Oncology, Dana-Farber Cancer Institute, 44 Binney Street, Boston, MA Division of Pulmonary and Critical Care Medicine, Massachusetts General Hospital, 55 Fruit Street, Boston, MA Fred Hutchinson Cancer Research Center, 1100 Fairview Avenue N., C2-023 PO Box 19024, Seattle, WA **Department of Neurology, Enders 260, Children's Hospital, Harvard Medical School, 300 Longwood Avenue, Boston, MA Department of Biology, Massachusetts Institute of Technology, Cambridge, Massachusetts Whitehead Institute for Biomedical Research, Massachusetts Institute of Technology, Cambridge, Massachusetts Classification: Biological Sciences; Genetics Correspondence should be addressed to: Jill P. Mesirov Broad Institute of MIT and Harvard Cambridge, MA Phone: (617) , Fax: (617) mesirov@broad.mit.edu 1
2 8/3/05 Abbreviations: FDR, GSEA, MHT, MSigDB 2
3 8/3/05 Abstract Although genome-wide RNA expression analysis has become a routine tool in biomedical research, extracting biological insight from such information remains a major challenge. Here, we describe a powerful analytical method called Gene Set Enrichment Analysis (GSEA) for interpreting gene expression data. The method derives its power by focusing on gene sets that is, groups of genes that share common biological function, chromosomal location or regulation. We demonstrate how GSEA yields insights into several cancer-related datasets, including leukemia and lung cancer. Notably, where single-gene analysis finds little similarity between two independent studies of patient survival in lung cancer, GSEA reveals many biological pathways in common. The GSEA method is embodied in a freely available software package, together with an initial database of 1325 biologically defined gene sets. 1. Introduction Genome-wide expression analysis using DNA microarrays has become a mainstay of genomics research (1, 2). The challenge no longer lies in obtaining gene expression profiles, but rather in interpreting the results to gain insights into biological mechanisms. In a typical experiment, mrna expression profiles are generated for thousands of genes from a collection of samples belonging to one of two classes for example, tumors that are sensitive vs. resistant to a drug. The genes can be ordered in a ranked list L, according to their differential expression between the classes. The challenge is to extract meaning from this list. A common approach involves focusing on a handful of genes at the top and bottom of L (i.e., those showing the largest difference), to discern telltale biological clues. This approach has a few major limitations: (i) After correcting for multiple hypotheses testing (MHT), no individual gene may meet the threshold for statistical significance, because the relevant biological differences are modest relative to the noise inherent to the microarray technology. 3
4 8/3/05 (ii) Alternatively, one may be left with a long list of statistically significant genes without any unifying biological theme. Interpretation can be daunting and ad hoc, being dependent on a biologist s area of expertise. (iii) Single-gene analysis may miss important effects on pathways. Cellular processes often affect sets of genes acting in concert. An increase of 20% in all genes encoding members of a metabolic pathway may dramatically alter the flux through the pathway and may be more important than a 20-fold increase in a single gene. (iv) When different groups study the same biological system, the list of statistically significant genes from the two studies may show distressingly little overlap (3). To overcome these analytical challenges, we recently developed a method called Gene Set Enrichment Analysis (GSEA) that evaluates microarray data at the level of gene sets. The gene sets are defined based on prior biological knowledge, e.g., published information about biochemical pathways or co-expression in previous experiments. The goal of GSEA is to determine whether members of a gene set S tend to occur toward the top (or bottom) of the list L, in which case the gene set is correlated with the phenotypic class distinction. We used a preliminary version of GSEA to analyze data from muscle biopsies from diabetics vs. healthy controls (4). The method revealed that genes involved in oxidative phosphorylation (OXPHOS) show reduced expression in diabetics, although the average decrease per gene is only 20%. The results from this study have been independently validated by other microarray studies (5) and by in vivo functional studies (6). Given this success, we have developed GSEA into a robust technique for analyzing molecular profiling data. We studied its characteristics and performance and substantially revised and generalized the original method for broader applicability. In this paper, we provide a full mathematical description of the GSEA methodology and illustrate its utility by applying it to several diverse biological problems. We have also created a software package, called GSEA-P and an initial inventory of gene sets (MSigDB), both of which are freely available. 4
5 8/3/05 2. Overview of GSEA GSEA considers experiments with genome-wide expression profiles from samples belonging to two classes, labeled 1 or 2. Genes are ranked based on the correlation between their expression and the class distinction, using any suitable metric (Fig. 1A). Given an a priori defined set of genes S (e.g., genes encoding products in a metabolic pathway, located in the same cytogenetic band, or sharing the same GO category), the goal of GSEA is to determine whether the members of S are randomly distributed throughout L, or primarily found at the top or bottom. We expect that sets related to the phenotypic distinction will tend to show the latter distribution. There are three key elements of the GSEA method: Step 1: Calculation of an enrichment score. We calculate an enrichment score (ES) that reflects the degree to which a set S is over-represented at the extremes (top or bottom) of the entire ranked list L. The score is calculated by walking down the list L, increasing a running-sum statistic when we encounter a gene in S and decreasing it when we encounter genes not in S. The magnitude of the increment depends on the correlation of the gene with the phenotype. The enrichment score is the maximum deviation from zero encountered in the random walk; it corresponds to a weighted Kolmogorov- Smirnov-like statistic (7) (Fig. 1B). Step 2: Estimation of significance level of ES. We estimate the statistical significance (nominal P-value) of the ES, using an empirical phenotype-based permutation test procedure that preserves the complex correlation structure of the gene expression data. Specifically, we permute the phenotype labels and re-compute the ES of the gene set for the permutated data; this generates a null distribution for the ES. The empirical, nominal P-value of the observed ES is then calculated relative to this null distribution. Importantly, the permutation of class labels preserves gene-gene correlations and thus provides a more biologically reasonable assessment of significance than would be obtained by permuting genes. Step 3: Adjustment for multiple hypothesis testing. When an entire database of gene sets is evaluated, we adjust the estimated significance level to account for multiple hypothesis testing (MHT). We first normalize the ES for each gene set to account for the size of the set, yielding a normalized enrichment score (NES). We then control the 5
6 8/3/05 proportion of false positives by calculating the false discovery rate (FDR) (8, 9) corresponding to each NES. The FDR is the estimated probability that a set with a given NES represents a false positive finding; it is computed by comparing the tails of the observed and null distributions for the NES. The details of the implementation are described in the Appendix and Supporting Information. We note that the GSEA method differs in several important ways from the preliminary version (see Supporting Information). In the original implementation, the running-sum statistic used equal weights at every step. However, we found that this yielded high scores for sets clustered near the middle of the ranked list (Fig. 2A); these sets do not represent biologically-relevant correlation with the phenotype. We addressed this by weighting the steps according to each gene s correlation with phenotype. We noticed that the use of weighted steps could cause the distribution of observed ES scores to be asymmetric in cases where many more genes are correlated with one of the two phenotypes. We therefore estimate the significance levels by considering separately the positively- and negatively-scoring gene sets (see Appendix and Supporting Information Fig. SF1). Our preliminary implementation used a different approach, family-wise-error rate (FWER), to correct for MHT. The FWER is a conservative correction that seeks to ensure that the list of reported results does not include even a single false-positive gene set. This criterion turned out to be so conservative that many applications yielded no statistically significant results. Because our primary goal is to generate hypotheses, we chose to use the FDR to focus on controlling the probability that each reported result is a false positive. Based on our statistical analysis and empirical evaluation, GSEA shows broad applicability. It can detect subtle enrichment signals and it preserves our original results in (4), with the OXPHOS pathway significantly enriched in the normal samples (P =.008, FDR =.04). This methodology has been implemented in a software tool called GSEA-P. 3. The leading-edge subset 6
7 8/3/05 Gene sets can be defined using a variety of methods, but not all the members of a gene set will typically participate in a biological process. Often it is useful to extract the core members of high scoring gene sets that contribute to the ES. We define the leadingedge subset to be those genes in the gene set S that appear in the ranked list L at, or before, the point where the running sum reaches its maximum deviation from zero (Fig. 1B). The leading-edge subset can be interpreted as the core of a gene set that accounts for the enrichment signal. Examination of the leading-edge subset can reveal a biologically important subset within a gene set as we show below in our analysis of P53 status in cancer cell lines. This is especially useful with manually curated gene sets, which may represent an amalgamation of interacting processes. We first observed this in our previous study (4) where we manually identified two high scoring sets, a curated pathway and a computationally derived cluster, which shared a large subset of genes later confirmed to be a key regulon altered in human diabetes. High scoring gene sets can be grouped on the basis of leading-edge subsets of genes that they share. Such groupings can reveal which of those gene sets correspond to the same biological processes and which represent distinct processes. The GSEA-P software package includes tools for examining and clustering leading-edge subsets (Supporting Information). 4. An initial catalog of human gene sets GSEA evaluates a query microarray dataset using a collection of gene sets. We therefore created an initial catalog of 1325 gene sets, which we call the Molecular Signature Database (MSigDB 1.0) (Table S1 and Supporting Information), consisting of four types of sets: Cytogenetic sets (C 1, 319 gene sets). This catalog includes 24 sets, one for each of the 24 human chromosomes, and 295 sets corresponding to cytogenetic bands. These sets are helpful in identifying effects related to chromosomal deletions or amplifications, dosage compensation, epigenetic silencing and other regional effects. Functional sets (C 2, 522 gene sets). This catalog includes 472 sets containing genes whose products are involved in specific metabolic and signaling pathways, as reported in 7
8 8/3/05 eight publicly available, manually curated databases, and 50 sets containing genes coregulated in response to genetic and chemical perturbations, as reported in various experimental papers. Regulatory-motif sets (C 3, 57 gene sets). This catalog is based on our recent work reporting 57 commonly conserved regulatory motifs in the promoter regions of human genes (10), and makes it possible to link changes in a microarray experiment to a conserved, putative cis-regulatory element. Neighborhood sets (C 4, 427 gene sets). This catalog consists of sets defined by expression neighborhoods centered on cancer-related genes. This database provides an initial collection of gene sets for use with GSEA and illustrates the types of gene sets that can be defined, including those based on prior knowledge or derived computationally. 5. Applications of GSEA We explored the ability of GSEA to provide biologically meaningful insights in six examples for which considerable background information is available. In each case, we searched for significantly associated gene sets from one or both of the subcatalogs C 1 and C 2 - above. Table 1 lists all gene sets with an FDR Male vs. Female Lymphoblastoid Cells. As a simple test, we generated mrna expression profiles from lymphoblastoid cell lines derived from 15 males and 17 females (unpublished) and sought to identify gene sets correlated with the distinctions male>female and female>male. We first tested enrichment of cytogenetic gene sets (C 1 ). For the male>female comparison, we would expect to find the gene sets on chromosome Y. Indeed, GSEA produced chromosome Y and the two Y bands with at least 15 genes (Yp11 and Yq11). For the female>male comparison, we would not expect to see enrichment for bands on chromosome X because most X-linked genes are subject to dosage compensation and thus not more highly expressed in females (11). We next considered enrichment of functional gene sets (C 2 ). The analysis yielded three biologically informative sets. One consists of genes escaping X inactivation (merged from two sources (12, 13) that largely overlap), discovering the expected 8
9 8/3/05 enrichment in female cells. Two additional sets consist of genes enriched in reproductive tissues (testis and uterus), which is notable inasmuch as mrna expression was measured in lymphoblastoid cells. This result is not simply due to differential expression of genes on chromosomes X and Y, but remains significant when restricted to the autosomal genes within the sets (Supporting Information Table S3). p53 status in cancer cell lines. We next examined gene expression patterns from the NCI-60 collection of cancer cell lines. We sought to use these data to identify targets of the transcription factor p53, which regulates gene expression in response to various signals of cellular stress. The mutational status of the p53 gene has been reported for 50 of the NCI60 cell lines, with 17 being classified as normal and 33 as carrying mutations in the gene (14). We first applied GSEA to identify functional gene sets (C 2 ) correlated with p53 status. The p53 + >p53 - analysis identified five sets whose expression is correlated with normal p53 function (Table 1). All are clearly related to p53 function. The sets are (i) a biologically annotated collection of genes encoding proteins in the p53-signaling pathway that causes cell-cycle arrest in response to DNA damage; (ii) a collection of downstream targets of p53 defined by experimental induction of a temperature-sensitive allele of p53 in a lung cancer cell line; (iii) an annotated collection of genes induced by radiation, whose response is known to involve p53; (iv) an annotated collection of genes induced by hypoxia, which is known to act through a p53-mediated pathway distinct from the response pathway to DNA damage; and (v) an annotated collection of genes encoding heat-shock-protein signaling pathways that protect cells from death in response to various cellular stresses. The complementary analysis (p53 - >p53 + ) identifies one significant gene set: genes involved in the Ras signaling pathway. Interestingly, two additional sets that fall just short of the significance threshold contain genes involved in the Ngf and Igf1 signaling pathways. To explore whether these three sets reflect a common biological function, we examined the leading-edge subset for each gene set (defined above). The leading-edge subsets consist of 16, 11 and 13 genes respectively, with each containing four genes encoding products involved in the MAP-kinase signaling sub-pathway (MAP2K1, RAF1, ELK1, PIK3CA) (Fig. 3). This shared subset in the GSEA signal of the Ras, Ngf and Igf1 9
10 8/3/05 signaling pathways points to up-regulation of this component of the MAP-kinase pathway as a key distinction between the p53 - and p53 + tumors. (We note that a full MAP-kinase pathway appears as the ninth set on the list.) Acute leukemias. We next sought to study acute lymphoid leukemia (ALL) and acute myeloid leukemia (AML), by comparing gene expression profiles that we had previously obtained from 24 ALL patients and 24 AML patients (15). We first applied GSEA to the cytogenetic gene sets (C 1 ), with the expectation that chromosomal bands showing enrichment in one class would likely represent regions of frequent cytogenetic alteration in one of the two leukemias. The ALL>AML comparison yielded five gene sets (Table 1), which could represent frequent amplification in ALL or deletion in AML. Indeed, all five regions are readily interpreted in terms of current knowledge of leukemia. The 5q31 band is consistent with the known cytogenetics of AML. Chromosome 5q deletions are present in most AML patients, with the critical region having been localized to 5q31 (16). The 17q23 band is a site of known genetic rearrangements in myeloid malignancies (17). The 13q14 band, containing the RB locus, is frequently deleted in AML but rarely in ALL (18). Finally, the 6q21 band contains a site of common chromosomal fragility and is commonly deleted in hematologic malignancies (19). Interestingly, the remaining high-scoring band is 14q32. This band contains the immunoglobulin heavy chain locus, which includes over 100 genes expressed almost exclusively in the lymphoid lineage. The enrichment of 14q32 in ALL thus reflects tissue-specific expression in the lineage, rather than a chromosomal abnormality. The reciprocal analysis (AML>ALL) yielded no significantly enriched bands. This likely reflects the relative infrequency of deletions in ALL (20). The analyses with the cytogenetic gene sets thus show that GSEA is able to identify chromosomal aberrations common in particular cancer subtypes. Comparing two studies of lung cancer. A goal of GSEA is to provide a more robust way to compare independently derived gene expression data sets (possibly obtained with different platforms) and obtain more consistent results than single gene analysis. To test this, we re-analyzed data from two recent studies of lung cancer reported by our own group in Boston (21) and another group in Michigan (22). Our goal was not 10
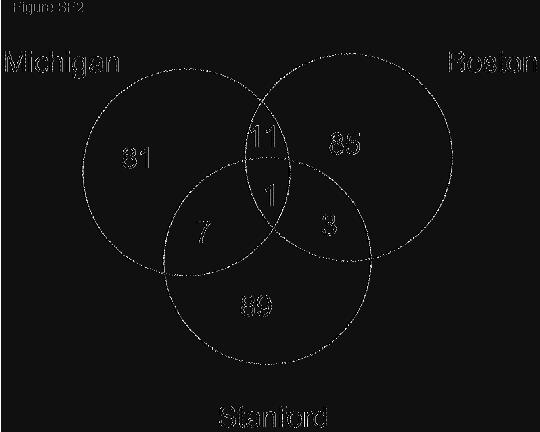
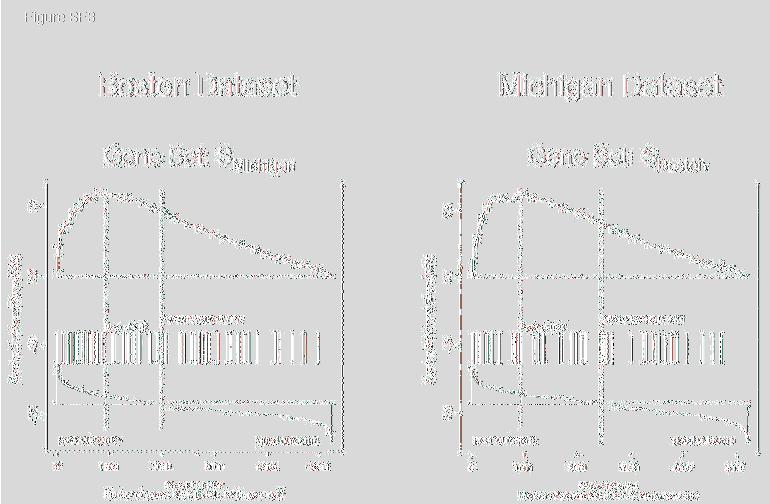
11 8/3/05 to evaluate the results reported by the individual studies, but rather to examine whether common features between the data sets can be more effectively revealed by gene-set analysis rather than single-gene analysis. Both studies determined gene-expression profiles in tumor samples from patients with lung adenocarcinomas (n = 62 for Boston; n = 86 for Michigan) and provided clinical outcomes (classified here as good or poor outcome). We found that no genes in either study were strongly associated with outcome at a significance level of 5% after correcting for MHT. From the perspective of individual genes, the data from the two studies show little in common. A traditional approach is to compare the genes most highly correlated with a phenotype. We defined the gene set S Boston to be the top 100 genes correlated with poor outcome in the Boston study and similarly S Michigan from the Michigan study. The overlap is distressingly small (12 genes in common) and is barely statistically significant using a permutation test (p =.012). When we added a Stanford study (23) involving 24 adenocarcinomas, the three data sets share only one gene in common among the top 100 genes correlated with poor outcome (Table S4 and Fig. SF2 Supporting Information). Moreover, no clear common themes emerge from the genes in the overlaps to provide biological insight. We then explored whether GSEA would reveal greater similarity between the Boston and Michigan lung cancer data sets. We compared the gene set from one data set, S Boston, to the entire ranked gene list from the other. The set S Boston shows a strong significant enrichment in the Michigan data (NES = 1.90, p <0.001). Conversely, the poor outcome set S Michigan is enriched in the Boston data (NES = 2.13, p<0.001). GSEA is thus able to detect a strong common signal in the poor outcome data (Fig. SF3 Supporting Information). Having found that GSEA is able to detect similarities between independently derived datasets, we then went on to see if GSEA could provide biological insight, by identifying important functional sets correlated with poor outcome in lung cancer. For this purpose, we performed GSEA on the Boston and Michigan data with the C 2 catalog of functional gene sets. Given the relatively weak signals found by conventional single gene analysis in each study, it was not clear whether any significant gene sets would be 11
12 8/3/05 found by GSEA. Nonetheless, we identified a number of genes sets significantly correlated with poor outcome (FDR 0.25): 8 in the Boston data and 11 in the Michigan data (Table 1). (The Stanford data had no genes or gene sets significantly correlated with outcome; this is most likely due to the smaller number of samples and many missing values in the data.) Moreover, there is a large overlap among the significantly enriched gene sets in the two studies. About half of the significant gene sets were shared between the two studies and an additional few, though not identical, were clearly related to the same biological process. Specifically, we find a set upregulated by telomerase (24), two different trna-synthesis-related sets, two different insulin-related sets, and two different p53-related sets. This makes a total of 5 out of 8 of the significant sets in Boston identical or related to 6 out of 11 in Michigan. To provide greater insight, we next extended the analysis to include sets beyond those that met the FDR 0.25 criterion. Specifically, we considered the top-scoring 20 gene sets in each of the three studies (60 gene sets) and their corresponding leading-edge subsets in order to better understand the underlying biology in the poor outcome samples (Table S2 Supporting Information). Already in the Boston/Michigan overlap we saw evidence of telomerase and p-53 response as noted above. Telomerase activation is believed to be a key aspect of pathogenesis in lung adenocarcinoma and is well documented as prognostic of poor outcome in lung cancer. In all three studies two additional themes emerge around rapid cellular proliferation, and amino acid biosynthesis (Table S5 Supporting Information): (i) We see striking evidence in all three studies of the effects of rapid cell proliferation. These include sets related to Ras activation and the cell cycle as well as responses to hypoxia including angiogenesis, glycolysis, and carbohydrate metabolism. More than one third of the gene sets (23 of 60) are related to such processes. These responses have been observed in malignant tumor microenvironments where enhanced proliferation of tumor cells leads to low oxygen and glucose levels (25). The leadingedge subsets of the associated significant gene sets include hypoxia-response genes such as HIF1A, VEGF, CRK, PXN, EIF2B1, EIF2B2, EIF2S2, FADD, NFKB1, RELA, GADD45A and also Ras/MAPK activation genes (HRAS, RAF1, MAP2K1). 12
13 8/3/05 (ii) We find strong evidence for the simultaneous presence of increased amino acid biosynthesis, mtor signaling, and up-regulation of a set of genes down-regulated by both amino acid deprivation and rapamycin treatment (26). Supporting this are 17 gene sets associated with amino acid and nucleotide metabolism, immune modulation and mtor signaling. Based on these results, one might speculate that rapamycin treatment might have an effect on this specific component of the poor outcome signal. We note there is evidence of the efficacy of rapamycin in inhibiting growth and metastatic progression of Non-Small Cell Lung Cancer in mice and human cell lines (27). Our analysis shows that we find much greater consistency across the three lung datasets and by using GSEA than single gene analysis. Moreover, we are better able to generate compelling hypotheses for further exploration. In particular, 40 of the 60 top scoring gene sets across these three studies give a consistent picture of underlying biological processes in poor outcome cases. 6. GSEA-P software and MSigDB gene sets To facilitate the use of GSEA, we have developed resources that are freely available at ( The site contains the GSEA-P software; the Molecular Signatures Database (MSigDB 1.0); and accompanying documentation. The software is available as (i) a platform-independent desktop application with a graphical user interface; (ii) programs in R and in Java that advanced users may incorporate into their own analyses or software environments; (iii) an analytic module in our GenePattern microarray analysis package ( (iv) a future web-based GSEA server to allow users to run their own analysis directly on the website. A detailed example of the output format of GSEA is available on the site, as well as in Supporting Information. 7. Use of GSEA in other settings We have focused above on the use of GSEA to analyze a ranked gene list reflecting differential expression between two classes, each represented by a large number of samples. However, the method can be applied to ranked gene lists arising in other settings. 13
14 8/3/05 Genes may be ranked based on the differences seen in a small data set, with too few samples to allow rigorous evaluation of significance levels by permuting the class labels. In these cases, a P-value can be estimated by permuting the genes, with the result that genes are randomly assigned to the sets while maintaining their size. This approach is not strictly accurate: because it ignores gene-gene correlations, it will overestimate the significance levels and may lead to false positives. Nonetheless, it can be useful for hypothesis generation. The GSEA-P software supports this option. Genes may also be ranked based on how well their expression correlates with a given target pattern (such as the expression pattern of a particular gene). In Lamb et al. (28), a GSEA-like procedure was used to demonstrate the enrichment of a set of targets of cyclin D1 list ranked by correlation with the profile of cyclin D1 in a compendium of tumor types. Again, approximate P-values can be estimated by permutation of genes. 8. Discussion Traditional strategies for gene expression analysis have focused on identifying individual genes that exhibit differences between two states of interest. While useful, they fail to detect biological processes - such as metabolic pathways, transcriptional programs, and stress responses that are distributed across an entire network of genes and subtle at the level of individual genes. We previously introduced GSEA to analyze such data at the level of gene sets. The method was initially used to discover metabolic pathways altered in human diabetes and was subsequently applied to discover processes involved in diffuse large B cell lymphoma (29), nutrient-sensing pathways involved in prostate cancer (30), and in comparing the expression profiles of mouse to those of humans (31). In the current paper, we have refined the original approach into a sensitive, robust analytical method and tool with much broader applicability along with a large database of gene sets. GSEA can clearly be applied to other large-scale datasets such as serum proteomics data, genotyping information, or metabolite profiles. GSEA features a number of advantages when compared to single gene methods. First, it eases the interpretation of a large-scale experiment by identifying pathways and processes. Rather than focus on high scoring genes (which can be poorly annotated and 14
15 8/3/05 may not be reproducible), researchers can focus on gene sets. These tend to be more reproducible and more interpretable. Second, when the members of a gene set exhibit strong cross-correlation, GSEA can boost the signal to noise ratio and make it possible to detect modest changes in individual genes. Third, the leading-edge analysis can help define gene subsets to elucidate the results. Several other tools have recently been developed to analyze gene expression using pathway or ontology information, e.g., (32), (33), (34). Most determine whether a group of differentially expressed genes is enriched for a pathway or ontology term by using overlap statistics such as the cumulative hypergeometric distribution. We note that this approach is not able to detect the OXPHOS results discussed above (P =.08, FDR =.50). GSEA differs in two important regards. First, GSEA considers all the genes in an experiment, not only those above an arbitrary cutoff in terms of fold-change or significance. Second, GSEA assesses the significance by permuting the class labels; this preserves gene-gene correlations and thus provides a more accurate null model. The real power of GSEA, however, lies in its flexibility. We have created an initial molecular signature database consisting of over 1000 gene sets. These include sets based on biological pathways, chromosomal location, upstream cis-motifs, responses to a drug treatment, or expression profiles in previously generated microarray datasets. Further sets can be created through genetic and chemical perturbation, computational analysis of genomic information, and additional biological annotation. In addition, GSEA itself could be used to refine manually curated pathways and sets by identifying the leading-edge sets that are shared across diverse experimental datasets. As such sets are added, tools such as GSEA will help link prior knowledge to newly generated data and thereby help uncover the collective behavior of genes in states of health and disease. 8. Appendix: Mathematical Description of Methods Inputs to GSEA: 1. Expression dataset D with N genes and k samples. 2. Ranking procedure to produce Gene List L. Includes a correlation (or other ranking metric,) and a phenotype or profile of interest C. We use only one probe per gene to prevent over-estimation of the enrichment statistic (Supporting Information and Table 15
16 8/3/05 S6). 3. An exponent p to control the weight of the step. 4. Independently derived Gene Set S of N H genes (e.g., a pathway, a cytogenetic band, a GO category). In the analyses above, we used only genes sets with at least 15 members to focus on robust signals (78% of MSigDB) (Table S1). Enrichment Score ES(G): 1. Rank order the N genes in D to form L = {g 1,, g N } according to the correlation, ( ) = r j, of their expression profiles with C using M. r g j 2. Evaluate the fraction of genes in S ( hits ) weighted by their correlation and the fraction of genes not in S ( misses ) present up to a given position i in L. r j p Phit( S,i ) = # where N = r p R j gj!s j "i N R Pmiss( S,i ) = $ gj "S j #i 1 ( N! N H ) The Enrichment Score (ES) is the maximum deviation from zero of P hit - P miss. For a randomly distributed S, ES(S) will be relatively small but if it is concentrated at the top or bottom of the list, or otherwise non-randomly distributed, then ES(S) will be correspondingly high. When p=0, this reduces to the standard Kolmogorov-Smirnov statistic; when p=1, we are weighting the genes in S by their correlation with C normalized by the sum of the correlations over all the genes in S. We set p=1 for the examples in this paper. " gj!s Estimating Significance: We assess the significance of an observed ES by comparing it with the set of scores ES NULL computed with randomly assigned phenotypes. 1. Randomly assign the original phenotype labels to samples, reorder genes, re-compute ES(S). 16
17 8/3/05 2. Repeat step 1 for 1000 permutations, and create a histogram of the corresponding enrichment scores ES NULL. 3. Estimate nominal P-value for S from ES NULL using the positive or negative portion of the distribution corresponding to the sign of the observed ES(S). Multiple Hypothesis Testing: 1. Determine ES(S) for each gene set in the collection or database. 2. For each S and 1000 fixed permutations π of the phenotype labels re-order the genes in L and determine ES(S, π). 3. Adjust for variation in gene set size: Normalize the ES(S, π) and the observed ES(S), separately rescaling the positive and negative scores by dividing by the mean of the ES(S, π). This yields the normalized scores NES(S, π) and NES(S). (See Supporting Information.) 4. Compute False Discovery Rate (FDR). Control the ratio of false positives to the total number of gene sets attaining a fixed level of significance. This is done separately for positive and negative NES(S) and NES(S, π)). Create a histogram of all NES(S, π) over all S and π. Use this null distribution to compute an FDR q-value, for a given NES(S) =NES*! 0. % of all (S,π) with NES(S, π)! 0 whose NES(S, π))! NES* , % of observed S with NES(S)! 0 whose NES(S)! NES* and similarly if NES(S) = NES*! Acknowledgements We gratefully acknowledge discussions with or data from D. Altshuler, N. Patterson, J. Lamb, X. Xie, J-Ph. Brunet, S. Ramaswamy, J-P. Bourquin, B. Sellers, L. Sturla, and C. Nutt; and helpful comments from reviewers. 17
18 8/3/05 Main Paper Captions Figure 1. GSEA Overview. This figure illustrates the original GSEA method from (4). A) An expression dataset sorted by correlation with phenotype, the corresponding heat map, and the gene tags, i.e., location of genes from a set S within the sorted list. B) Plot of the running sum for S in the dataset including the location of the maximum enrichment score (ES) and the leading-edge subset. Figure 2. Enrichment Score Behavior. The behavior of the GSEA score using the original method (4) according to a gene set s distribution on the ranked list. A) The distribution of 3 gene sets, from the C2 functional collection, in the list of genes in the Male/Female Lymphoblastoid cell line example ranked by their correlation with gender: S1, a set of Chromosome X inactivation genes; S2, a pathway describing vitamin c import into neurons; S3, related to chemokine receptors expressed by T helper cells. The figure shows plots of the running sum for the 3 gene sets: S1 is significantly enriched in females as expected; S2 is randomly distributed and scores poorly; S3 is not enriched at the top of the list but is non-random so scores well. Arrows show the location of the maximum enrichment score and the point where the correlation (signal to noise ratio) crosses zero. B) Comparison of the nominal p-values for S1, S2, S3 using the original and new method. The new method reduces the significance of sets like S3. Figure 3. Leading edge overlap for p53- study. This plot shows the ras, ngf, igf1 gene sets correlated with P53 - clustered by their leading-edge subsets indicated in dark blue. A common subgroup of genes, apparent as a dark vertical stripe, consists of MAP2K1, PIK3CA, ELK1 and RAF1 and represents a subsection of the MAPK pathway. Table 1. Summary of GSEA results with FDR For detailed results see Table S2 in Supporting Information. 18
19 8/3/05 Bibliography 1. Schena, M., Shalon, D., Davis, R. W. & Brown, P. O. (1995) Science 270, Lockhart, D. J., Dong, H., Byrne, M. C., Follettie, M. T., Gallo, M. V., Chee, M. S., Mittmann, M., Wang, C., Kobayashi, M., Horton, H., et al. (1996) Nat Biotechnol 14, Fortunel, N. O., Otu, H. H., Ng, H. H., Chen, J., Mu, X., Chevassut, T., Li, X., Joseph, M., Bailey, C., Hatzfeld, J. A., et al. (2003) Science 302, 393; author reply Mootha, V. K., Lindgren, C. M., Eriksson, K. F., Subramanian, A., Sihag, S., Lehar, J., Puigserver, P., Carlsson, E., Ridderstrale, M., Laurila, E., et al. (2003) Nat Genet 34, Patti, M. E., Butte, A. J., Crunkhorn, S., Cusi, K., Berria, R., Kashyap, S., Miyazaki, Y., Kohane, I., Costello, M., Saccone, R., et al. (2003) Proc Natl Acad Sci U S A 100, Petersen, K. F., Dufour, S., Befroy, D., Garcia, R. & Shulman, G. I. (2004) N Engl J Med 350, Hollander, M. & Wolfe, D. A. (1999) Nonparametric statistical methods (J. Wiley, New York). 8. Benjamini, Y., Drai, D., Elmer, G., Kafkafi, N. & Golani, I. (2001) Behav Brain Res 125, Reiner, A., Yekutieli, D. & Benjamini, Y. (2003) Bioinformatics 19, Xie, X., Lu, J., Kulbokas, E. J., Golub, T. R., Mootha, V., Lindblad-Toh, K., Lander, E. S. & Kellis, M. (2005) Nature 434, Plath, K., Mlynarczyk-Evans, S., Nusinow, D. A. & Panning, B. (2002) Annu Rev Genet 36, Carrel, L., Cottle, A. A., Goglin, K. C. & Willard, H. F. (1999) Proc Natl Acad Sci U S A 96, Disteche, C. M., Filippova, G. N. & Tsuchiya, K. D. (2002) Cytogenet Genome Res 99, Olivier, M., Eeles, R., Hollstein, M., Khan, M. A., Harris, C. C. & Hainaut, P. (2002) Hum Mutat 19, Armstrong, S. A., Staunton, J. E., Silverman, L. B., Pieters, R., den Boer, M. L., Minden, M. D., Sallan, S. E., Lander, E. S., Golub, T. R. & Korsmeyer, S. J. (2002) Nat Genet 30, Zhao, N., Stoffel, A., Wang, P. W., Eisenbart, J. D., Espinosa, R., 3rd, Larson, R. A. & Le Beau, M. M. (1997) Proc Natl Acad Sci U S A 94, Barbouti, A., Hoglund, M., Johansson, B., Lassen, C., Nilsson, P. G., Hagemeijer, A., Mitelman, F. & Fioretos, T. (2003) Cancer Res 63, Tanaka, K., Arif, M., Eguchi, M., Guo, S. X., Hayashi, Y., Asaoku, H., Kyo, T., Dohy, H. & Kamada, N. (1999) Leukemia 13, Morelli, C., Karayianni, E., Magnanini, C., Mungall, A. J., Thorland, E., Negrini, M., Smith, D. I. & Barbanti-Brodano, G. (2002) Oncogene 21, Mrozek, K., Heerema, N. A. & Bloomfield, C. D. (2004) Blood Rev 18,
20 8/3/ Bhattacharjee, A., Richards, W. G., Staunton, J., Li, C., Monti, S., Vasa, P., Ladd, C., Beheshti, J., Bueno, R., Gillette, M., et al. (2001) Proc Natl Acad Sci U S A 98, Beer, D. G., Kardia, S. L., Huang, C. C., Giordano, T. J., Levin, A. M., Misek, D. E., Lin, L., Chen, G., Gharib, T. G., Thomas, D. G., et al. (2002) Nat Med 8, Garber, M. E., Troyanskaya, O. G., Schluens, K., Petersen, S., Thaesler, Z., Pacyna-Gengelbach, M., van de Rijn, M., Rosen, G. D., Perou, C. M., Whyte, R. I., et al. (2001) Proc Natl Acad Sci U S A 98, Smith, L. L., Coller, H. A. & Roberts, J. M. (2003) Nat Cell Biol 5, Acker, T. & Plate, K. H. (2002) J Mol Med 80, Peng, T., Golub, T. R. & Sabatini, D. M. (2002) Mol Cell Biol 22, Boffa, D. J., Luan, F., Thomas, D., Yang, H., Sharma, V. K., Lagman, M. & Suthanthiran, M. (2004) Clin Cancer Res 10, Lamb, J., Ramaswamy, S., Ford, H. L., Contreras, B., Martinez, R. V., Kittrell, F. S., Zahnow, C. A., Patterson, N., Golub, T. R. & Ewen, M. E. (2003) Cell 114, Monti, S., Savage, K. J., Kutok, J. L., Feuerhake, F., Kurtin, P., Mihm, M., Wu, B., Pasqualucci, L., Neuberg, D., Aguiar, R. C., et al. (2004) Blood. 30. Majumder, P. K., Febbo, P. G., Bikoff, R., Berger, R., Xue, Q., McMahon, L. M., Manola, J., Brugarolas, J., McDonnell, T. J., Golub, T. R., et al. (2004) Nat Med 10, Sweet-Cordero, A., Mukherjee, S., Subramanian, A., You, H., Roix, J. J., Ladd- Acosta, C., Mesirov, J., Golub, T. R. & Jacks, T. (2005) Nat Genet 37, Doniger, S. W., Salomonis, N., Dahlquist, K. D., Vranizan, K., Lawlor, S. C. & Conklin, B. R. (2003) Genome Biol 4, R Zhong, S., Storch, K. F., Lipan, O., Kao, M. C., Weitz, C. J. & Wong, W. H. (2004) Appl Bioinformatics 3, Berriz, G. F., King, O. D., Bryant, B., Sander, C. & Roth, F. P. (2003) Bioinformatics 19,

21 Figure 1 Figure 2 Figure 3

22 Table 1
23 Supporting Information for: Gene Set Expression Analysis: A knowledge-based approach for interpreting mrna profiles Aravind Subramanian, Pablo Tamayo, Vamsi Mootha, Sayan Mukherjee, Benjamin L. Ebert, Michael A. Gillette, Amanda Paulovich, Scott L. Pomeroy, Todd R. Golub, Eric S. Lander, and Jill P. Mesirov Contents of Supporting Information: 1 Supporting Tables and Figures (attached) Datasets: description, preprocessing and normalization Gene probe to gene symbol reduction Description of data sets Gender Dataset P53 NCI-60 Dataset Leukemia ALL/AML Dataset Lung Cancer Datasets Additional detail on gene set collections Additional detail on the GSEA method Description of GSEA output Post GSEA analysis: leading-edge subset similarity, clustering, and assignment Original GSEA method from Mootha et al GSEA-P R program /3/05 page 1 GSEASupportingText ceh.doc
24 1 Supporting Tables and Figures (attached) Table Captions Table S1. MSigDB Collections. This table gives the number of gene sets in each collection, the numbers of sets that pass the size thresholds (min=15, max=500), and the final number of sets used in the examples in the main paper. Table S2. Summary of GSEA results. The top 20 scoring gene sets for all of the examples described in the paper. Entries in boldface correspond to sets with FDR Table S3. Functional autosomal gene set enrichment with respect to gender. This table shows the GSEA results for the gender dataset using the functional collection C2 after restricting the gene set membership to autosomal genes. Table S4. Single gene overlaps in lung studies. This table shows the pairwise overlap between the top 100 genes correlated with poor outcome in the Michigan, Boston, and Stanford datasets as depicted in Figure SF2. Pair wise overlap is determined using genes which appear on both studies technology platforms. Restricting to genes on all 3 platforms would reduce the gene space by 50% in the Michigan study, and by 70% in the Boston and Stanford studies. Table S5. Functional overlaps of top 20 gene sets enriched in poor outcome in the 3 lung cancer data sets. This table organizes the gene sets enriched in poor outcome in lung shown in Table S2 according to their pathway, process/context, and major biological response/theme. Table S6. Probe set to gene ID reduction. This table shows the distribution of probe sets per gene id in the 3 Affymetrix chip types used on the datasets in the paper. The data displayed is binned by the number of probes per gene. The majority of the overrepresentation arises from 2 or 3 probes per gene. In our analyses we chose the maximally expressed probe as the single representative of the corresponding gene. Figure Captions Figure SF1. Asymmetry of GSEA results due to unbalanced global phenotype expression and gene set collection bias. A) Shows the GSEA observed and null distributions when a collection of random gene sets with the same number and size distribution as the functional C2 collection is run against the diabetes dataset from Mootha et al Random sets have small biases (left) so that only a modest correction is made by the normalization procedure (right). The middle of the observed and null distributions coincide as they should. B) Here the actual C2 collection is run against the diabetes data set and we clearly see the bias in the observed distribution caused by unequal representation gene sets in the two phenotypes. Normalizing the positive and negative side of the distribution independently helps to ameliorate this bias. C) The 8/3/05 page 2 GSEASupportingText ceh.doc
25 Leukemia dataset (1) illustrates bias in the gene expression correlation profiles between the two phenotypes. On the ALL side there are more markers and they are more highly correlated markers (left). Again independent normalization of positive and negative scoring sets decreases this bias (right). Figure SF2. Single gene overlaps in lung cancer studies. This Venn diagram shows the pairwise and 3-way overlap between the top 100 genes correlated with poor outcome in the Michigan, Boston, and Stanford datasets. Pairwise overlap is determined using genes which appear on both studies technology platforms. 3-way overlap is the overlap of the pairwise overlaps. Restricting to genes on all 3 platforms would reduce the gene space by 50% in the Michigan study, and by 70% in the Boston and Stanford studies. Figure SF3. Enrichment plots for poor outcome signatures across lung cancer studies. Enrichment plots for the S Boston and S Michigan signatures of poor outcome against the Michigan and Boston data sets respectively. Signatures are defined as those genes in the set of top 100 outcome markers that are also represented in the other study. The signatures are scored against data from genes represented in both studies. Figure SF4. Enrichment plots for the original and current GSEA methods for the set of genes upregulated by p53 in the p53 wild type phenotype. 2 Datasets: description, preprocessing and normalization. 2.1 Gene probe to gene symbol reduction In all data sets, for each sample the expression values of all probe set ids for a given gene were reduced to a single value by taking the maximum expression value. By this process, the 22,283 features on the U133A chip (diabetes and gender examples) were reduced by 30% to 15,060 features, the 12,625 features on the HGU95Av2 chip (p53, leukemia, & lung Boston) were reduced by 18% to 10,104 features and the 7,129 features on HU6800 (lung Michigan) were reduced by 10% to 6,314 features (see Table S6). Probe set ids which have no known mapping to a gene symbol were left unchanged in the dataset (on average 10% of the probe sets on a chip). This probe reduction method is included in the GSEA-P Java package. 2.2 Description of data sets Gender Dataset. This dataset is unpublished (Paulovich et al.) The U133A CEL files were scaled using Broad Institute s ResFileManager software. Different array intensities were normalized by choosing a linear fit to the median scan (all genes). No further preprocessing was done except for gene probe reduction as described in section 2.1 above. 8/3/05 page 3 GSEASupportingText ceh.doc
26 2.2.2 P53 NCI-60 Dataset. The NCI 60 dataset was downloaded from the DTP website ( No preprocessing was done except for gene probe reduction as described in section 2.1 above Leukemia ALL/AML Dataset. The Leukemia dataset was downloaded from (1) ( No preprocessing was done except for gene probe reduction as described in section 2.1 above Lung Cancer Datasets Michigan: The Beer et al. (2) dataset was downloaded from No further preprocessing was done except for gene probe reduction as described in section 2.1 above. Boston: The Bhattacharjee et al. (3) dataset was downloaded from We extracted those lung adenocarcinomas samples for which outcome information was provided. No further preprocessing was done except for gene probe reduction as described in section 2.1 above. Stanford: The Stanford dataset from Garber et al. (4) was downloaded from Missing values were replaced by zeroes. No further preprocessing was done except for gene probe reduction as described in section 2.1 above. 3 Additional detail on gene set collections. Functional sets (C2, 522 gene sets). The sources for sets in the C2 collection are: 1 BioCarta: 2 Signaling pathway database: 3 Signaling gateway: 4 Signal transduction knowledge environment: 5 Human protein reference database: 6 GenMAPP: 8/3/05 page 4 GSEASupportingText ceh.doc
27 7 Gene ontology: 8 Sigmal Aldrich pathways: rer/key_resources.html 9 Gene arrays, BioScience corporation: 10 Human cancer genome anatomy consortium: Regulatory-motif sets (C3, 57 gene sets). This catalog is based on our recent work reporting 57 commonly conserved regulatory motifs in the promoter regions of human genes (5). Some of the sites correspond to known transcription-related factors (such as SP1 and p53), while others are newly described. For each 8-mer motif, we identified the set of human genes that contain at least one occurrence of the motif that is conserved in the orthologous location in the human, mouse, rat and dog genomes. These gene sets make it possible to link changes in a microarray experiment to a conserved, putative cis-regulatory element. Neighborhood sets (C4, 427 gene sets). We curated a list of 380 cancer associated genes internally and from a published cancer gene database (6). We then defined neighborhoods around these genes in four large gene expression datasets: 1) Novartis normal tissue compendium (7) 2) Novartis carcinoma compendium (8) 3) Global cancer map (9) 4) An internal large compendium of gene expression datasets including many of our in-house Affymetrix U95 cancer samples (1693 in all) from a variety of cancer projects representing many different tissue types, mainly primary tumors, such as prostate, breast, lung, lymphoma, leukemia, etc. Using the profile of a given gene as a template, we ordered every other gene in the dataset by its Pearson correlation coefficient. We applied a cutoff of R 0.85 to extract correlated genes. The calculation of neighborhoods is done independently in each compendium. In this way a given oncogene may have up to four "types" of neighborhoods according to the correlation present in each compendium. Neighborhoods with less than 25 genes at this threshold were omitted yielding the final 427 sets. 4 Additional details on the GSEA method Here we elaborate on some aspects of the GSEA method that are more technical and were not described in great amount of detail in the main text due to space constraints. 4.1 Calculation of an enrichment score Setting of the enrichment weighting exponent p. In the examples described in the 8/3/05 page 5 GSEASupportingText ceh.doc
28 text, and in many other examples not reported, we found that p=1 (weighting by the correlation) is a very reasonable choice that allows significant gene sets with less than perfect coherence, i.e., only a subset of genes in the set are coordinately expressed, to score well. In other less common specific circumstances one may want to use a different setting and for this reason the GSEA-P program accepts p as an input parameter. For example, if one is interested in penalizing sets for lack of coherence or to discover sets with any type of non-random distribution of tags, a value p<1 might be appropriate. On the other hand if one uses sets with large number of genes and only a small subset of those is expected to be coherent then one could consider using p>1. Our recommendation is to use p=1 and use other settings only if you are very experienced with the method and its behavior Benefits of weighting by gene correlation. Most gene sets show some amount of coherent behavior but are far from being perfectly coherent. For example in Figure SF4 we show the enrichment plot for the set of genes upregulated by p53 in the p53 wild type phenotype. This set is one of those that is significantly enriched using the current GSEA method. However if we use the original constant weight GSEA analysis this set is not significant. This is a problem because we would expect such a set to be enriched for the p53 wild type phenotype. From the figure we can see that the 40 genes in the set are not uniformly coherent, but rather split into two co-expressed groups with some additional scatter. The use of equal weighting tends to over-penalize this lack of coherence and does not produce a significant ES for this gene set, even though a significant subset of its genes are near the top of the list. 4.2 Multiple Hypothesis Testing Adjusting for variation in gene set size. As described in the Appendix of the main text, when adjusting for variation in gene set size we normalize the ES(S, π) for a given S, separately rescaling the positive and negative scores by dividing by their mean value. This yields the normalized scores NES(S, π) and NES(S). This gene set size normalization procedure appropriately aligns the null distributions for different gene sets and is motivated by the asymptotic multiplicative scaling of the Kolmogorov-Smirnov distribution as a function of size (10). Here we will make a brief digression to elaborate on this subject. The analytic form of the Kolmogorov-Smirnov distribution scaling with gene set size can be derived from the expectation value of the approximated distribution function of the enrichment statistic: # ( ) = "1 Pr ES( N, N H ) <! k ="# ( ) k exp ("2k 2! 2 n) $, n = (N! N )N H H N, where λ is the enrichment score, N is the number of genes in the gene list and N H the number of genes in the gene set. The number of terms required for the above series to converge depends on!. As! approaches zero, more terms are required. From the 8/3/05 page 6 GSEASupportingText ceh.doc
29 above equation, we can compute the following density function for the enrichment statistic! " 8/3/05 page 7 GSEASupportingText ceh.doc ( ). $ ( ) = 4 % (#1) k +1 k 2 n" exp #2k 2 " 2 n k =#$ Notice the multiplicative scaling of the distribution with n, and for large gene lists (N >> N H ) with N H. The average enrichment score is simply the expectation (integral from λ = 0 to 1), with respect to the above density: ES = E! ( " ) ES N, N H,. = 4 $1 k =$,,k -0 1 ( ) = "!(") & ( ) k +1 ( 1 # d" " =0 ( ) $ 2% exp $2k 2 n 4 ( ' Where erf is the "error function" (integral of the normal distribution). 16 erf ( 2nk ) ) + k n +. * The mean values of the null distribution of enrichment scores computed with this approximation are quite consistent with our actual empirical results when using GSEA unweighted enrichment scores (p=0). Therefore if we were only performing unweighted GSEA and permuting the genes we could analytically compute the normalization factor using the equation above. However our standard practice is to use weighting and to permute the phenotype labels, therefore this expression is not entirely accurate. For example when using GSEA weighted scores (p=1) the empirical mean values are about 5 times smaller. This expected reduction in effective gene set size is the direct effect of gene-gene correlations. Notice that these correlations are preserved by the phenotype label permutation and are also relevant when using the correlation profiles as part of the weighted GSEA enrichment score calculation. Despite the change in the mean, the shape of the distribution is still very much the same and multiplicative scaling works well empirically for the gene set size normalization Computing significance using positive or negative sides of the observed and null bimodal ES distributions: As mentioned in the main text the use of a weighted enrichments score helps make the current GSEA method more sensitive and eliminates some of the limitations of the original GSEA method; however, it also makes more apparent any lack of symmetry in the distribution of observed ES values. This intrinsic asymmetry can be due to class specific biases either in the gene correlations or in the population of the gene set collection itself (Fig. SF1). Specifically, many more genes may be highly correlated with one phenotype, or the collection of gene sets may contain more that are related to one of the two phenotypes. On the other hand, constructing the null using random phenotype assignments tends to produce a more symmetric distribution that may not exactly coincide with the bulk, non-extreme part of the distribution of the
30 observed values. To address this, we determine significance and adjust for multiple hypotheses testing by independently using the positive and negative sides of the observed and null bimodal ES distributions. In this way the significance tests (nominal p-value, FWER and FDR) are single tail tests on the appropriate (positive/negative) side of the null distribution Family Wise Error Rate (FWER). The use of the family-wise-error rate (FWER), which controls the probability of a false positive, to correct for MHT in the original GSEA method is overly conservative and often yields no statistically significant gene sets. For example the analysis results using the original GSEA method do not produce any significant set (FWER < 0.05) on either side in the Gender, Leukemia and p53 examples. Nonetheless the GSEA-P program also computes the family wise error by creating a histogram of the maximum NES(S, π) over all S for each π using the positive or negative values corresponding to the sign of the observed NES(S). This null distribution is then used to compute an FWER p-value. 5 Description of GSEA output. The output of the GSEA-P software includes a list of the gene sets sorted by their NES values along with their nominal and FWER p-values and their FDR q-values. The GSEA-P R and Java programs compute several additional statistics that may be useful to the advanced user: Tag %: The percentage of gene tags before (for positive ES) or after (for negative ES) the peak in the running enrichment score S. The larger the percentage, the more tags in the gene set contribute to the final enrichment score. Gene %: The percentage of genes in the gene list L before (for positive ES) or after (for negative ES) the peak in the running enrichment score, thus it gives an indication of where in the list the enrichment score is attained. Signal strength: The enrichment signal strength that combines the two previous statistics: (Tag %) x (1 Gene %) x (N / (N - N h ), where N = the number of genes in the list and N h is the number of genes in the gene set. The larger this quantity the more enriched the gene set is as a whole. If the gene set is entirely within the first N h positions in the list, then the signal strength is maximal or 1. If the gene set is spread throughout the list, then the signal strength decreases towards 0. FDR (median): An additional FDR q-value computed by using a median null distribution. These values are in general more optimistic than the standard FDR q- values as the median null is a representative of the typical random permutation null rather than the extremes. For this reason, we do not recommend it for common use. However, the FDR median is sometimes useful as a binary indicator function (zero vs. non-zero). When it is zero, it indicates that for those extreme 8/3/05 page 8 GSEASupportingText ceh.doc
31 NES values the observed scores are larger than the values obtained by at least half of the random permutations. One advantage of selecting gene sets in this manner (FDR median = 0) is that a predefined threshold is not required. In practice the gene sets selected in this way appear to be roughly the same as those for which the regular FDR is less than For example in the Leukemia ALL/AML example the FDR median is zero for the 5 top scoring sets (4 of which have FDR < 0.25). glob.p.val: A global nominal p-value for each gene set s NES estimated by the % of all (S, π) with NES(S, π)! NES(S). Theoretically, for a given level of significance (e.g., 0.05), this quantity measures whether the shift of the tail of the distribution of observed values is extreme enough to declare the observed distribution as different from the null. In principle it allows us to compute a quantitative measure of whether there is any enrichment in the dataset with respect to the given database of gene sets. In practice this quantity behaves in a somewhat noisy way because of the sparseness in the tail of the observed distribution. One set of global reports and plots. They include the scores and significance estimates for each gene set, the gene list correlation profile, the global observed and null densities and a heat map for the sorted dataset. A variable number of specific gene set reports and plots (one for each gene set). These include a list of the members of the set and the leading-edge, a gene set running enrichment mountain plot, the gene set null distribution and a heat map for genes in the gene set. The format (columns) for the global result files is as follows. GS: Gene set name. SIZE: Number of genes in the set. SOURCE: Set definition or source. ES: Enrichment score. NES: Normalized (multiplicative rescaling) normalized enrichment score. NOM p-val: Nominal p-value (from the null distribution of the gene set). FDR q-val: False discovery rate q-values. FWER p-val: Family wise error rate p-values. Tag %: Percent of gene set before running enrichment peak. Gene %: Percent of gene list before running enrichment peak. Signal: Enrichment signal strength. FDR (median): FDR q-values from the median of the null distributions. glob.p.val: P-value using a global statistic (number of sets above the given set s NES). The rows are sorted by the NES values (from maximum positive or negative NES to minimum). 8/3/05 page 9 GSEASupportingText ceh.doc
32 The format (columns) for the individual gene set result files contains the following information for each gene in the set: PROBE_ID: The gene name or accession number in the dataset. SYMBOL: gene symbol from the gene annotation file. DESC: gene description (title) from the gene annotation file. LIST LOC: location of the gene in the sorted gene list. S2N: signal to noise ratio (correlation) of the gene in the gene list. RES: value of the running enrichment score at the gene location. CORE_ENRICHMENT: Yes or No variable specifying if the gene is in the leading-edge subset. The rows are sorted by the gene location in the gene list. 6 Post GSEA analysis: leading-edge subset similarity, clustering, and assignment. In analyzing the top scoring gene sets resulting from GSEA we may wish to determine whether their GSEA signal derives from a common subset of genes. This tells us whether we should interpret the sets as representatives of independent processes, or if, in fact, they result from the same common mechanism. If we find that this subset of genes behaves similarly and coherently we may wish to treat it as a new gene set in one of our collections. In order to make the discovery of such common, overlapping signals with the leadingedge subsets of high-scoring gene sets, we have created software that reads the GSEA results and creates several post-analysis reports and visualizations. The software performs the following three basic types of analyses: i) Creates a similarity matrix heat map that shows at a glance if two gene sets leading-edge subsets are highly overlapping. ii) iii) Creates an assignment matrix of gene sets vs. leading-edge genes for each phenotype. This binary matrix shows explicitly the membership of each gene in each high-scoring gene set and the overlaps between the gene sets. Performs a hierarchical clustering (using average linkage) and re-sorts the genes and gene sets in the assignment matrix according to their similarity to create clustered assignment matrices for each phenotype. This clustering helps to uncover common occurrences of the same leading-edge genes in several gene sets. As described in the paper we used this program to study the top scoring gene sets enriched in the p53 mutant cancer cell lines (see Figure 3). 8/3/05 page 10 GSEASupportingText ceh.doc
33 This type of analysis helps in the interpretation of GSEA results and the identification of leading-edge overlaps between gene sets that are responsible for high enrichment scores. If applied systematically it can also provide a method for refining genes sets and creating new ones. 7 Original GSEA method from Mootha et al Here we described the original GSEA method as defined in Mootha et al Step 1: Calculate enrichment. We set the constant step size of the walk, so that it begins and ends with 0, and the area under the running sum is fixed to account for variations in gene set size. We walk down the list L, incrementing the running sum statistic by ( N! N h ) N h when we encounter a gene in S and decrementing by N h N! N h ( ) if the gene is not in S, where N is the number of genes in the list L, and N h is the number of genes in the gene set S. The maximum deviation from zero is the enrichment score (ES) for the gene set S, and corresponds to a standard Kolmogorov-Smirnov statistic (11). Step 2: Determine the significance of ES. We permuted the phenotype labels and re-computed the ES of a gene set to generate a null distribution of ES. Using this null we computed an empirical, nominal P-value for the observed ES. Step 3: Adjust for multiple hypothesis testing (MHT). When scoring multiple gene sets we constructed a null distribution to estimate the family-wise-error rate (FWER) by constructing a histogram of the maximum ES score achieved by any gene set for a given permutation of the phenotype labels. The FWER provides a very conservative correction, which controls the probability of even a single false positive. Notice that except for the normalization procedure (and the use of FDR instead of FWER) the current GSEA method with p=0 is quite similar to this original GSEA method. 8 GSEA-P R program. The R scripts and data which produced the results and figures in this paper are available at 1. Armstrong, S. A., Staunton, J. E., Silverman, L. B., Pieters, R., den Boer, M. L., Minden, M. D., Sallan, S. E., Lander, E. S., Golub, T. R. & Korsmeyer, S. J. (2002) Nat Genet 30, /3/05 page 11 GSEASupportingText ceh.doc
34 2. Beer, D. G., Kardia, S. L., Huang, C. C., Giordano, T. J., Levin, A. M., Misek, D. E., Lin, L., Chen, G., Gharib, T. G., Thomas, D. G., et al. (2002) Nat Med 8, Bhattacharjee, A., Richards, W. G., Staunton, J., Li, C., Monti, S., Vasa, P., Ladd, C., Beheshti, J., Bueno, R., Gillette, M., et al. (2001) Proc Natl Acad Sci U S A 98, Garber, M. E., Troyanskaya, O. G., Schluens, K., Petersen, S., Thaesler, Z., Pacyna-Gengelbach, M., van de Rijn, M., Rosen, G. D., Perou, C. M., Whyte, R. I., et al. (2001) Proc Natl Acad Sci U S A 98, Xie, X., Lu, J., Kulbokas, E. J., Golub, T. R., Mootha, V., Lindblad-Toh, K., Lander, E. S. & Kellis, M. (2005) Nature 434, Brentani, H., Caballero, O. L., Camargo, A. A., da Silva, A. M., da Silva, W. A., Jr., Dias Neto, E., Grivet, M., Gruber, A., Guimaraes, P. E., Hide, W., et al. (2003) Proc Natl Acad Sci U S A 100, Su, A. I., Wiltshire, T., Batalov, S., Lapp, H., Ching, K. A., Block, D., Zhang, J., Soden, R., Hayakawa, M., Kreiman, G., et al. (2004) Proc Natl Acad Sci U S A 101, Su, A. I., Welsh, J. B., Sapinoso, L. M., Kern, S. G., Dimitrov, P., Lapp, H., Schultz, P. G., Powell, S. M., Moskaluk, C. A., Frierson, H. F., Jr., et al. (2001) Cancer Res 61, Ramaswamy, S., Tamayo, P., Rifkin, R., Mukherjee, S., Yeang, C. H., Angelo, M., Ladd, C., Reich, M., Latulippe, E., Mesirov, J. P., et al. (2001) Proc Natl Acad Sci U S A 98, von Mises, R. (1964) Mathematical Theory of Probability and Statistics (Academic Press, New York). 11. Hollander, M. & Wolfe, D. A. (1999) Nonparametric statistical methods (J. Wiley, New York). 8/3/05 page 12 GSEASupportingText ceh.doc

35 Figure SF1A Figure SF1B

36
37
38

39

40 Table S1
41 GENE SET SOURCE ES NES NOM p-val FDR q-val Dataset: Lymphoblast Cell Lines Enriched in Males chry C1: Chromosome Y <0.001 <0.001 chryp11 C1: Cytogenetic band <0.001 <0.001 chryq11 C1: Cytogenetic band <0.001 <0.001 chr9q21 C1: Cytogenetic band chr6q24 C1:Cytogenetic band chr13q13 C1:Cytogenetic band chr11q22 C1:Cytogenetic band chr2q32 C1:Cytogenetic band chr1q24 C1:Cytogenetic band chr5p13 C1:Cytogenetic band chr5p15 C1:Cytogenetic band chr2q24 C1:Cytogenetic band chr21q22 C1:Cytogenetic band chr17p11 C1:Cytogenetic band chr21 C1: Chromosome Y chr8p12 C1: Cytogenetic band chr3p25 C1: Cytogenetic band chr9q34 C1: Cytogenetic band chr4q13 C1: Cytogenetic band chr7p21 C1: Cytogenetic band Testis expressed genes C2: Experimental GNF < Butanoate metabolism C2: GenMAPP nfkb reduced C2: Hinata et al lair pathway C2: BioCarta Kras upregulated (A549) C2: Cordero et al Androgen receptor target genes C2: Curated from NetAffx Androgen receptor target genes (mouse) C2: Manually curated shh pathway C2: BioCarta Wnt Ca2 cyclic GMP pathway C2: Signalling Transduction KE CD44 ligation upregulated genes C2: Hogerkorp et al Cancer related cell adhesion and motlity genes C2: Brentani gata3 pathway C2: BioCarta Epithelial-mesenchymal transition (EMT) down C2: Jechlinger et al Androgen and testosterone target genes C2: Curated from NetAffx Androgen genes C2: Netaffx cell adhesion C2: GO Inflammatory response pathway C2: BioCarta GPCRs class B secretin-like C2: GO Cell signal transduction C2: Signalling Transduction KE inflammatory pathway C2: BioCarta Enriched in Females chrxp22 C1: Cytogenetic band chr6q15 C1: Cytogenetic band chr8q11 C1: Cytogenetic band chr8p11 C1: Cytogenetic band chr12q23 C1: Cytogenetic band chr13q14 C1: Cytogenetic band chrxq23 C1: Cytogenetic band chr10q11 C1: Cytogenetic band chr2q31 C1: Cytogenetic band chr4q22 C1: Cytogenetic band chrxp11 C1: Cytogenetic band chr3q29 C1: Cytogenetic band chr8p23 C1: Cytogenetic band chr20p12 C1: Cytogenetic band chr16p12 C1: Cytogenetic band chr1p34 C1: Cytogenetic band chr13q12 C1: Cytogenetic band chr2q14 C1: Cytogenetic band chr5q14 C1: Cytogenetic band chr11p11 C1: Cytogenetic band Table_S xls8/3/05
42 X inactivation genes C2: Willard et al 1999 & Disteche et al <0.001 <0.001 Female reproductive tissue expressed genes C2: Experimental GNF Cell cycle arrest C2: GO tel pathway C2: BioCarta Insulin upregulated C2: Rome et al mrna splicing C2: BioCarta Proteasome degradation C2: BioCarta Leucine deprivation downregulated genes C2: Peng et al Rapamycin downregulated genes C2: Peng et al Proteasome pathway C2: BioCarta Dictyostelium discoideum camp chemotaxis pathway C2: Signalling Transduction KE Glutamine deprivation downregulated genes C2: Peng et al mrna processing C2: BioCarta G1 and S phases C2: SigmaAldrich rho pathway C2: BioCarta mtor pathway C2: BioCarta Cell cycle pathway C2: BioCarta raccycd pathway C2: BioCarta TCA tricarboxylic acid cycle C2: Manually Curated ATP synthesis C2: GenMAPP GENE SET SOURCE ES NES NOM p-val FDR q-val Dataset: p53 status in NCI-60 Cell Lines Enriched in p53 Mutant Ras signaling pathway C2: BioCarta ngf pathway C2: BioCarta Upregulated by hoxa9 C2: Manually Curated igf1 pathway C2: BioCarta X inactivation genes C2: Willard et al 1999 & Disteche et al egf pathway C2: BioCarta insulin pathway C2: BioCarta MAPK cascade C2: GO BRCA upregulated C2: Welcsh_et_al_ wrk1, erk2, mapk pathway C2: Signalling Transduction KE nfkb reduced C2: Hinata et al gcr pathway C2: BioCarta pitx2 pathway C2: BioCarta erk pathway C2: BioCarta B cell receptor complexes SigmaAldrich bcr pathway C2: BioCarta pdgf pathway C2: BioCarta Phosphoinositide 3 kinase pathway C2: Signalling Transduction KE Proteasome pathway C2: BioCarta fmlp pathway C2: BioCarta Enriched in p53 Wild Type Hypoxia and p53 in the Cardiovascular system C2: BioCarta <0.001 <0.001 Stress induction of HSP regulation C2: BioCarta <0.001 <0.001 p53 signaling pathway C2: BioCarta <0.001 <0.001 p53 upregulated genes C2: Kannan et al < Radiation sensitivity genes C2: BioCarta ck1 pathway C2: BioCarta inflammatory pathway C2: BioCarta no2il12 pathway C2: BioCarta GPCRs Class A Rhodopsin-like C2: GO bad pathway C2: BioCarta Cytokine pathway C2: BioCarta lair pathway C2: BioCarta p53 signalling C2: BioCarta Chemical pathway C2: BioCarta Glycerolipid_metabolism C2: GenMAPP Interleukin 4 pathway C2: Signalling Transduction KE Photosynthesis C2: GenMAPP nkt pathway C2: BioCarta Cell adhesion receptor activity C2: GO Table_S xls8/3/05
43 Telomerase downregulated genes C2: Smith et al GENE SET SOURCE ES NES NOM p-val FDR q-val Dataset: Acute Leukemias Enriched in ALL chr6q21 C1: Cytogenetic band < chr5q31 C1: Cytogenetic band < chr13q14 C1: Cytogenetic band < chr14q32 C1: Cytogenetic band chr17q23 C1: Cytogenetic band chr1q42 C1: Cytogenetic band chr6 C1: Chromosome chr10q24 C1: Cytogenetic band chr3q13 C1: Cytogenetic band chr10p15 C1: Cytogenetic band chr13 C1: Chromosome chr6p21 C1: Cytogenetic band chr6p22 C1: Cytogenetic band chr4p16 C1: Cytogenetic band chr14 C1: Chromosome chr1q25 C1: Cytogenetic band chr6q23 C1: Cytogenetic band chr10q25 C1: Cytogenetic band chr8p11 C1: Cytogenetic band chr17q24 C1: Cytogenetic band Enriched in AML chr15q25 C1: Cytogenetic band chr1q24 C1: Cytogenetic band chr7q36 C1: Cytogenetic band chr17q25 C1: Cytogenetic band chr7q34 C1: Cytogenetic band chr19p13 C1: Cytogenetic band chr4q13 C1: Cytogenetic band chr15q22 C1: Cytogenetic band chr2q35 C1: Cytogenetic band chr16p11 C1: Cytogenetic band chr12p13 C1: Cytogenetic band chr20p11 C1: Cytogenetic band chr19q13 C1: Cytogenetic band chr1p36 C1: Cytogenetic band chr19 C1: Chromosome chr11q24 C1: Cytogenetic band chr18p11 C1: Cytogenetic band chr2p13 C1: Cytogenetic band chr11q12 C1: Cytogenetic band chr15q26 C1: Cytogenetic band GENE SET SOURCE ES NES NOM p-val FDR q-val Dataset: Lung Cancer Outcome, Boston Study Top 20 Poor Outcome Gene Sets Hypoxia and p53 in the Cardiovascular system C2: BioCarta Aminoacyl trna biosynthesis C2: GenMAPP Insulin upregulated genes C2: Rome et al trna synthetases C2: BioCarta Leucine deprivation downregulated genes C2: Peng et al Telomerase upregulated genes C2: Smith et al Glutamine deprivation downregulated genes C2: Peng et al Cell cycle checkpoint C2: GO Proteasome pathway C2: BioCarta Proteasome degradation C2: BioCarta Rapamycin downregulated genes C2: Peng et al p53 signalling C2: BioCarta Kras upregulated (A549) C2: Sweet-Cordero et al Epithelial-mesenchymal transition (EMT) C2: Jechlinger et al Table_S xls8/3/05
44 Cell cycle (GO) C2: GO Starch and sucrose metabolism C2: GenMAPP Transport of vesicles C2: Brentani Glucose deprivation downregulated genes C2: Peng et al vegf pathway C2: BioCarta Glycolysis C2: Manually Curated GENE SET SOURCE ES NES NOM p-val FDR q-val Dataset: Lung Cancer Outcome, Michigan Study Top 20 Poor Outcome Gene Sets Glycolysis Gluconeogenesis C2: GenMAPP < vegf pathway C2: BioCarta < Insulin upregulated genes C2: Rome et al Insulin signalling C2: BioCarta < Telomerase upregulated genes C2: Smith et al Glutamate metabolism C2: GenMAPP Ceramide pathway C2: BioCarta p53 signalling C2: BioCarta < trna synthetases C2: BioCarta Breast cancer estrogen signalling C2: GEArray Aminoacyl trna biosynthesis C2: GenMAPP raccycd pathway C2: BioCarta cxcr4 pathway C2: BioCarta mtor pathway C2: BioCarta bcl2 family and reg. network C2: GEArray Glucose metabolism C2: Manually Curated Transport of vesicles C2: Brentani sppa pathway C2: BioCarta Leucine deprivation downregulated genes C2: Peng et al Glycolysis C2: Manually Curated GENE SET SOURCE ES NES NOM p-val FDR q-val Dataset: Lung Cancer Outcome, Stanford Study Top 20 Poor Outcome Gene Sets Pyrimidine metabolism C2: GenMAPP Purine metabolism C2: GenMAPP DNA repair C2: Brentani Kras upregulated (A549) C2: Sweet-Cordero et al Hox regulated genes C2: Manually Curated ER upregulated genes C2: Frasor et al Fatty acid metabolism C2: GenMAPP CD44 ligation upregulated genes C2: Hogerkorp et al Caspase pathway C2: BioCarta Androgen genes C2: Manually Curated Mitochondrial genes C2: Manually Curated Human mitocondrial C2: Manually Curated Cell cycle C2: Brentani Propanoate metabolism C2: GenMAPP Rapamycin downregulated genes C2: Peng et al Cell cycle (GO) C2: GO Valine leucine and isoleucine degradation C2: GenMAPP Mitochondrion (GO ) C2: GO Electron transport C2: BioCarta Proteasome degradation C2: BioCarta Table_S xls8/3/05

45 Table S3 Table S4
46 Gene Set Dataset(s) Rank(s) in List Pathway Process/Context Major Response/Theme Telomerase upregulated genes Michigan, Boston 5, 6 Telomerase Telomerase Telomerase Cell cycle (GO) Boston, Stanford 15, 16 Cell Proliferation Cell Proliferation rapid cell proliferation Cell cycle checkpoint Boston 8 Cell Proliferation Cell Proliferation rapid cell proliferation Cell cycle Stanford 13 Cell Proliferation Cell Proliferation rapid cell proliferation vegf pathway Michigan, Boston 2, 19 vegf Signaling Angiogenesis rapid cell proliferation Glycolysis Michigan, Boston 20, 20 Glycolisis Glycolysis rapid cell proliferation Glycolysis Gluconeogenesis Michigan 1 Glycolysis Glycoyisis rapid cell proliferation Glucose metabolism Michigan 16 Glucose Metabolism Carbohydrate Metabolism rapid cell proliferation Glucose deprivation downregulated genes Boston 18 Glucose Metabolism Carbohydrate Metabolism rapid cell proliferation Starch and sucrose metabolism Boston 16 Starch And Sucrose Metabolism Carbohydrate Metabolism rapid cell proliferation Propanoate metabolism Stanford 14 Propanoate Metabolism Carbohydrate Metabolism rapid cell proliferation Insulin upregulated genes Michigan, Boston 3, 3 Insulin Up Regulated Insulin Signaling rapid cell proliferation Insulin signalling Michigan 4 Insulin Signaling Insulin Signaling rapid cell proliferation Proteasome degradation Boston, Stanford 10, 20 Proteasome Degradation Protein Degradation rapid cell proliferation Proteasome pathway Boston 9 Proteasome Pathway Protein Degradation rapid cell proliferation Kras upregulated (A549) Boston, Stanford 13, 4 Ras Signaling Ras/MAPK Signaling rapid cell proliferation raccycd pathway Michigan 12 Ras Signaling Ras/MAPK Signaling rapid cell proliferation Ceramide pathway Michigan 7 Ceramide Signaling Ceramide Signaling rapid cell proliferation Glutamine deprivation downregulated genes Boston 7 Glutamine Metabolism Amino Acid Metabolism Rapamycin/Biosynthesis Leucine deprivation downregulated genes Michigan, Boston 19, 5 Leucine Starvation Down Regulated Amino Acid Metabolism Rapamycin/Biosynthesis Glutamate metabolism Michigan 6 Glutamate Metabolism Amino Acid Metabolism Rapamycin/Biosynthesis Valine leucine and isoleucine degradation Stanford 17 Valine, Isoleucine Degradation Amino Acid Metabolism Rapamycin/Biosynthesis Aminoacyl trna biosynthesis Michigan, Boston 11, 2 trna Synthesis Amino Acid Metabolism Rapamycin/Biosynthesis trna synthetases Michigan, Boston 9, 4 trna Synthesis Amino Acid Metabolism Rapamycin/Biosynthesis Fatty acid metabolism Stanford 7 Fatif Acid Metabolism Fatif Acid Metabolism Rapamycin/Biosynthesis Purine metabolism Stanford 2 Purine Metabolism Nucleotide Metabolism Rapamycin/Biosynthesis Pyrimidine metabolism Stanford 1 Pyrimidine Metabolism Nucleotide Metabolism Rapamycin/Biosynthesis CD44 ligation upregulated genes Stanford 8 Chemokine Signaling Immune Modulation Rapamycin/Biosynthesis cxcr4 pathway Michigan 13 Chemokine Signaling Immune Modulation Rapamycin/Biosynthesis mtor pathway Michigan 14 mtor Signaling mtor Signaling Rapamycin/Biosynthesis Rapamycin downregulated genes Boston, Stanford 11, 15 mtor Signaling mtor Signaling Rapamycin/Biosynthesis Androgen genes Stanford 10 Androgen Androgen Signaling --
47 DNA repair Stanford 3 DNA Repair DNA Repair -- Breast cancer estrogen signalling Michigan 10 Estrogen Signaling Estrogen Signaling -- ER upregulated genes Stanford 6 Estrogen Signaling Estrogen Signaling -- Hox regulated genes Stanford 5 Hox Associated Genes Hox Signaling -- sppa pathway Michigan 18 Signaling Pathway in Platelet Activation Platelet Activation -- Transport of vesicles Michigan,Boston 17,17 Vesicles Transport Vesicles Transport -- Hypoxia and p53 in the Cardiovascular system Boston 1 P53 Signaling in Hypoxia Apoptosis -- p53 signalling Michigan, Boston 8, 12 P53 Signaling Apoptosis -- Caspase pathway Stanford 9 Caspase Cascade Apoptosis -- Epithelial-mesenchymal transition (EMT) Boston 14 EM transition Cell Migration/Metastesis -- Mitochondrion (GO ) Stanford 18 Mitochondrial Cell Respiration -- Mitochondrial genes Stanford 11 Mitochondrial Cell Respiration -- Human mitocondrial Stanford 12 Mitochondrial Cell Respiration -- Electron transport Stanford 19 electron transport Cell Respiration -- bcl2 family and reg. network Michigan 15 BCL2 Signaling BCL2 Signaling --


48 Table S6
Genomewide expression analysis with DNA microarrays has
 Gene set enrichment analysis: A knowledge-based approach for interpreting genome-wide expression profiles Aravind Subramanian a,b, Pablo Tamayo a,b, Vamsi K. Mootha a,c, Sayan Mukherjee d, Benjamin L.
Comparison of Gene Set Analysis with Various Score Transformations to Test the Significance of Sets of Genes
 Comparison of Gene Set Analysis with Various Score Transformations to Test the Significance of Sets of Genes Ivan Arreola and Dr. David Han Department of Management of Science and Statistics, University
T. R. Golub, D. K. Slonim & Others 1999
 T. R. Golub, D. K. Slonim & Others 1999 Big Picture in 1999 The Need for Cancer Classification Cancer classification very important for advances in cancer treatment. Cancers of Identical grade can have
Gene Ontology 2 Function/Pathway Enrichment. Biol4559 Thurs, April 12, 2018 Bill Pearson Pinn 6-057
 Gene Ontology 2 Function/Pathway Enrichment Biol4559 Thurs, April 12, 2018 Bill Pearson wrp@virginia.edu 4-2818 Pinn 6-057 Function/Pathway enrichment analysis do sets (subsets) of differentially expressed
Single SNP/Gene Analysis. Typical Results of GWAS Analysis (Single SNP Approach) Typical Results of GWAS Analysis (Single SNP Approach)
 Typical Results of GWAS Analysis (Single SNP Approach)") High-Throughput Sequencing Course Gene-Set Analysis Biostatistics and Bioinformatics Summer 28 Section Introduction What is Gene Set Analysis? Many names for gene set analysis: Pathway analysis Gene set
High-Throughput Sequencing Course Gene-Set Analysis Biostatistics and Bioinformatics Summer 28 Section Introduction What is Gene Set Analysis? Many names for gene set analysis: Pathway analysis Gene set
Package GANPAdata. February 19, 2015
 Type Package Title The GANPA Datasets Package Version 1.0 Date 2011-05-26 Package GANPAdata February 19, 2015 Author Zhaoyuan Fang, Weidong Tian and Hongbin Ji Maintainer Zhaoyuan Fang
Computational Identification and Prediction of Tissue-Specific Alternative Splicing in H. Sapiens. Eric Van Nostrand CS229 Final Project
 Computational Identification and Prediction of Tissue-Specific Alternative Splicing in H. Sapiens. Eric Van Nostrand CS229 Final Project Introduction RNA splicing is a critical step in eukaryotic gene
Comments on Significance of candidate cancer genes as assessed by the CaMP score by Parmigiani et al.
 Comments on Significance of candidate cancer genes as assessed by the CaMP score by Parmigiani et al. Holger Höfling Gad Getz Robert Tibshirani June 26, 2007 1 Introduction Identifying genes that are involved
Nature Neuroscience: doi: /nn Supplementary Figure 1
 Supplementary Figure 1 Illustration of the working of network-based SVM to confidently predict a new (and now confirmed) ASD gene. Gene CTNND2 s brain network neighborhood that enabled its prediction by
SUPPLEMENTARY FIGURE LEGENDS
 SUPPLEMENTARY FIGURE LEGENDS Supplementary Figure 1 Negative correlation between mir-375 and its predicted target genes, as demonstrated by gene set enrichment analysis (GSEA). 1 The correlation between
Classification of cancer profiles. ABDBM Ron Shamir
 Classification of cancer profiles 1 Background: Cancer Classification Cancer classification is central to cancer treatment; Traditional cancer classification methods: location; morphology, cytogenesis;
EXPression ANalyzer and DisplayER
 EXPression ANalyzer and DisplayER Tom Hait Aviv Steiner Igor Ulitsky Chaim Linhart Amos Tanay Seagull Shavit Rani Elkon Adi Maron-Katz Dorit Sagir Eyal David Roded Sharan Israel Steinfeld Yossi Shiloh
Supplementary Methods
 Supplementary Methods Analysis of time course gene expression data. The time course data of the expression level of a representative gene is shown in the below figure. The trajectory of longitudinal expression
Case Studies on High Throughput Gene Expression Data Kun Huang, PhD Raghu Machiraju, PhD
 Case Studies on High Throughput Gene Expression Data Kun Huang, PhD Raghu Machiraju, PhD Department of Biomedical Informatics Department of Computer Science and Engineering The Ohio State University Review
Module 3: Pathway and Drug Development
 Module 3: Pathway and Drug Development Table of Contents 1.1 Getting Started... 6 1.2 Identifying a Dasatinib sensitive cancer signature... 7 1.2.1 Identifying and validating a Dasatinib Signature... 7
Supplementary Figure 1. Metabolic landscape of cancer discovery pipeline. RNAseq raw counts data of cancer and healthy tissue samples were downloaded
 Supplementary Figure 1. Metabolic landscape of cancer discovery pipeline. RNAseq raw counts data of cancer and healthy tissue samples were downloaded from TCGA and differentially expressed metabolic genes
A Strategy for Identifying Putative Causes of Gene Expression Variation in Human Cancer
 A Strategy for Identifying Putative Causes of Gene Expression Variation in Human Cancer Hautaniemi, Sampsa; Ringnér, Markus; Kauraniemi, Päivikki; Kallioniemi, Anne; Edgren, Henrik; Yli-Harja, Olli; Astola,
Nature Genetics: doi: /ng Supplementary Figure 1. SEER data for male and female cancer incidence from
 Supplementary Figure 1 SEER data for male and female cancer incidence from 1975 2013. (a,b) Incidence rates of oral cavity and pharynx cancer (a) and leukemia (b) are plotted, grouped by males (blue),
FUNCTIONAL GENE SETS IN POST-TRAUMATIC STRESS DISORDER
 PROCEEDINGS OF THE YEREVAN STATE UNIVERSITY C h e m i s t r y a n d B i o l o g y 2016, 1, p. 43 48 B i o l o g y FUNCTIONAL GENE SETS IN POST-TRAUMATIC STRESS DISORDER A. A. ARAKELYAN Institute of Molecular
* To whom correspondence should be addressed.
 Modeling Cancer Progression via Pathway Dependencies Elena Edelman 1,2, Justin Guinney 1,2, Jen-TsanChi 1,3, Phillip G. Febbo 1,3,4,7, Sayan Mukherjee 1,5,6,7* 1 Institute for Genome Sciences & Policy,
38 Int'l Conf. Bioinformatics and Computational Biology BIOCOMP'16
 38 Int'l Conf. Bioinformatics and Computational Biology BIOCOMP'16 PGAR: ASD Candidate Gene Prioritization System Using Expression Patterns Steven Cogill and Liangjiang Wang Department of Genetics and
Discovery of Novel Human Gene Regulatory Modules from Gene Co-expression and
 Discovery of Novel Human Gene Regulatory Modules from Gene Co-expression and Promoter Motif Analysis Shisong Ma 1,2*, Michael Snyder 3, and Savithramma P Dinesh-Kumar 2* 1 School of Life Sciences, University
Nature Methods: doi: /nmeth.3115
 Supplementary Figure 1 Analysis of DNA methylation in a cancer cohort based on Infinium 450K data. RnBeads was used to rediscover a clinically distinct subgroup of glioblastoma patients characterized by
Integrated Analysis of Copy Number and Gene Expression
 Integrated Analysis of Copy Number and Gene Expression Nexus Copy Number provides user-friendly interface and functionalities to integrate copy number analysis with gene expression results for the purpose
OncoPPi Portal A Cancer Protein Interaction Network to Inform Therapeutic Strategies
 OncoPPi Portal A Cancer Protein Interaction Network to Inform Therapeutic Strategies 2017 Contents Datasets... 2 Protein-protein interaction dataset... 2 Set of known PPIs... 3 Domain-domain interactions...
Gene expression analysis. Roadmap. Microarray technology: how it work Applications: what can we do with it Preprocessing: Classification Clustering
 Gene expression analysis Roadmap Microarray technology: how it work Applications: what can we do with it Preprocessing: Image processing Data normalization Classification Clustering Biclustering 1 Gene
RASA: Robust Alternative Splicing Analysis for Human Transcriptome Arrays
 Supplementary Materials RASA: Robust Alternative Splicing Analysis for Human Transcriptome Arrays Junhee Seok 1*, Weihong Xu 2, Ronald W. Davis 2, Wenzhong Xiao 2,3* 1 School of Electrical Engineering,
Inferring Biological Meaning from Cap Analysis Gene Expression Data
 Inferring Biological Meaning from Cap Analysis Gene Expression Data HRYSOULA PAPADAKIS 1. Introduction This project is inspired by the recent development of the Cap analysis gene expression (CAGE) method,
IMPaLA tutorial.
 IMPaLA tutorial http://impala.molgen.mpg.de/ 1. Introduction IMPaLA is a web tool, developed for integrated pathway analysis of metabolomics data alongside gene expression or protein abundance data. It
Department of Computer Science, Wayne State University, and 2 Molecular Biology and Genetics, Karmanos Cancer Institute, Detroit, MI, USA
 Assessing the Functional Bias of Commercial Microarrays Using the Onto-Compare Database Sorin Draghici 1, Purvesh Khatri 1, Abhik Shah 1, and Michael A. Tainsky 2 1 Department of Computer Science, Wayne
A quick review. The clustering problem: Hierarchical clustering algorithm: Many possible distance metrics K-mean clustering algorithm:
 The clustering problem: partition genes into distinct sets with high homogeneity and high separation Hierarchical clustering algorithm: 1. Assign each object to a separate cluster. 2. Regroup the pair
Analysis of Sample Set Enrichment Scores: assaying the enrichment of sets of genes for individual samples in genome-wide expression profiles
 Analysis of Sample Set Enrichment Scores: assaying the enrichment of sets of genes for individual samples in genome-wide expression profiles Elena Edelman, Alessandro Porrello, Ran Liu, Bala Balakumaran,
Breast cancer. Risk factors you cannot change include: Treatment Plan Selection. Inferring Transcriptional Module from Breast Cancer Profile Data
 Breast cancer Inferring Transcriptional Module from Breast Cancer Profile Data Breast Cancer and Targeted Therapy Microarray Profile Data Inferring Transcriptional Module Methods CSC 177 Data Warehousing
Nature Immunology: doi: /ni Supplementary Figure 1. Transcriptional program of the TE and MP CD8 + T cell subsets.
 Supplementary Figure 1 Transcriptional program of the TE and MP CD8 + T cell subsets. (a) Comparison of gene expression of TE and MP CD8 + T cell subsets by microarray. Genes that are 1.5-fold upregulated
Chapter 1. Introduction
 Chapter 1 Introduction 1.1 Motivation and Goals The increasing availability and decreasing cost of high-throughput (HT) technologies coupled with the availability of computational tools and data form a
Using dualks. Eric J. Kort and Yarong Yang. October 30, 2018
 Using dualks Eric J. Kort and Yarong Yang October 30, 2018 1 Overview The Kolmogorov Smirnov rank-sum statistic measures how biased the ranks of a subset of items are among the ranks of the entire set.
Roadmap for Developing and Validating Therapeutically Relevant Genomic Classifiers. Richard Simon, J Clin Oncol 23:
 Roadmap for Developing and Validating Therapeutically Relevant Genomic Classifiers. Richard Simon, J Clin Oncol 23:7332-7341 Presented by Deming Mi 7/25/2006 Major reasons for few prognostic factors to
Comparison of open chromatin regions between dentate granule cells and other tissues and neural cell types.
 Supplementary Figure 1 Comparison of open chromatin regions between dentate granule cells and other tissues and neural cell types. (a) Pearson correlation heatmap among open chromatin profiles of different
How To Use MiRSEA. Junwei Han. July 1, Overview 1. 2 Get the pathway-mirna correlation profile(pmset) and a weighting matrix 2
 and a weighting matrix 2") How To Use MiRSEA Junwei Han July 1, 2015 Contents 1 Overview 1 2 Get the pathway-mirna correlation profile(pmset) and a weighting matrix 2 3 Discovering the dysregulated pathways(or prior gene sets) based
How To Use MiRSEA Junwei Han July 1, 2015 Contents 1 Overview 1 2 Get the pathway-mirna correlation profile(pmset) and a weighting matrix 2 3 Discovering the dysregulated pathways(or prior gene sets) based
Probabilistic retrieval and visualization of relevant experiments
 Probabilistic retrieval and visualization of relevant experiments Samuel Kaski Joint work with: José Caldas, Nils Gehlenborg, Ali Faisal, Alvis Brazma Motivation 2 How to best use collections of measurement
Broad H3K4me3 is associated with increased transcription elongation and enhancer activity at tumor suppressor genes
 Broad H3K4me3 is associated with increased transcription elongation and enhancer activity at tumor suppressor genes Kaifu Chen 1,2,3,4,5,10, Zhong Chen 6,10, Dayong Wu 6, Lili Zhang 7, Xueqiu Lin 1,2,8,
a) List of KMTs targeted in the shrna screen. The official symbol, KMT designation,
 List of KMTs targeted in the shrna screen. The official symbol, KMT designation,") Supplementary Information Supplementary Figures Supplementary Figure 1. a) List of KMTs targeted in the shrna screen. The official symbol, KMT designation, gene ID and specifities are provided. Those highlighted
Supplementary Information Supplementary Figures Supplementary Figure 1. a) List of KMTs targeted in the shrna screen. The official symbol, KMT designation, gene ID and specifities are provided. Those highlighted
Liposarcoma*Genome*Project*
 LiposarcomaGenomeProject July2015! Submittedby: JohnMullen,MD EdwinChoy,MD,PhD GregoryCote,MD,PhD G.PeturNielsen,MD BradBernstein,MD,PhD Liposarcoma Background Liposarcoma is the most common soft tissue
Gene Ontology and Functional Enrichment. Genome 559: Introduction to Statistical and Computational Genomics Elhanan Borenstein
 Gene Ontology and Functional Enrichment Genome 559: Introduction to Statistical and Computational Genomics Elhanan Borenstein The parsimony principle: A quick review Find the tree that requires the fewest
Efficacy of the Extended Principal Orthogonal Decomposition Method on DNA Microarray Data in Cancer Detection
 202 4th International onference on Bioinformatics and Biomedical Technology IPBEE vol.29 (202) (202) IASIT Press, Singapore Efficacy of the Extended Principal Orthogonal Decomposition on DA Microarray
Package inote. June 8, 2017
 Type Package Package inote June 8, 2017 Title Integrative Network Omnibus Total Effect Test Version 1.0 Date 2017-06-05 Author Su H. Chu Yen-Tsung Huang
Nature Genetics: doi: /ng Supplementary Figure 1
 Supplementary Figure 1 Expression deviation of the genes mapped to gene-wise recurrent mutations in the TCGA breast cancer cohort (top) and the TCGA lung cancer cohort (bottom). For each gene (each pair
A Network Partition Algorithm for Mining Gene Functional Modules of Colon Cancer from DNA Microarray Data
 Method A Network Partition Algorithm for Mining Gene Functional Modules of Colon Cancer from DNA Microarray Data Xiao-Gang Ruan, Jin-Lian Wang*, and Jian-Geng Li Institute of Artificial Intelligence and
A Cross-Study Comparison of Gene Expression Studies for the Molecular Classification of Lung Cancer
 2922 Vol. 10, 2922 2927, May 1, 2004 Clinical Cancer Research Featured Article A Cross-Study Comparison of Gene Expression Studies for the Molecular Classification of Lung Cancer Giovanni Parmigiani, 1,2,3
HALLA KABAT * Outreach Program, mircore, 2929 Plymouth Rd. Ann Arbor, MI 48105, USA LEO TUNKLE *
 CERNA SEARCH METHOD IDENTIFIED A MET-ACTIVATED SUBGROUP AMONG EGFR DNA AMPLIFIED LUNG ADENOCARCINOMA PATIENTS HALLA KABAT * Outreach Program, mircore, 2929 Plymouth Rd. Ann Arbor, MI 48105, USA Email:
Inferring condition-specific mirna activity from matched mirna and mrna expression data
 Inferring condition-specific mirna activity from matched mirna and mrna expression data Junpeng Zhang 1, Thuc Duy Le 2, Lin Liu 2, Bing Liu 3, Jianfeng He 4, Gregory J Goodall 5 and Jiuyong Li 2,* 1 Faculty
Identification of Tissue Independent Cancer Driver Genes
 Identification of Tissue Independent Cancer Driver Genes Alexandros Manolakos, Idoia Ochoa, Kartik Venkat Supervisor: Olivier Gevaert Abstract Identification of genomic patterns in tumors is an important
Constitutive AP-1 Activity and EBV Infection Induce PD-L1 in Hodgkin. Lymphomas and Post-transplant Lymphoproliferative Disorders:
 Constitutive AP-1 Activity and EBV Infection Induce PD-L1 in Hodgkin Lymphomas and Post-transplant Lymphoproliferative Disorders: Implications for Targeted Therapy Running title: AP-1 Activity and EBV
Refining Prognosis of Early Stage Lung Cancer by Molecular Features (Part 2): Early Steps in Molecularly Defined Prognosis
: Early Steps in Molecularly Defined Prognosis") 5/17/13 Refining Prognosis of Early Stage Lung Cancer by Molecular Features (Part 2): Early Steps in Molecularly Defined Prognosis Johannes Kratz, MD Post-doctoral Fellow, Thoracic Oncology Laboratory
5/17/13 Refining Prognosis of Early Stage Lung Cancer by Molecular Features (Part 2): Early Steps in Molecularly Defined Prognosis Johannes Kratz, MD Post-doctoral Fellow, Thoracic Oncology Laboratory
Title: Prediction of HIV-1 virus-host protein interactions using virus and host sequence motifs
 Author's response to reviews Title: Prediction of HIV-1 virus-host protein interactions using virus and host sequence motifs Authors: Perry PE Evans (evansjp@mail.med.upenn.edu) Will WD Dampier (wnd22@drexel.edu)
IPA Advanced Training Course
 IPA Advanced Training Course October 2013 Academia sinica Gene (Kuan Wen Chen) IPA Certified Analyst Agenda I. Data Upload and How to Run a Core Analysis II. Functional Interpretation in IPA Hands-on Exercises
Hands-On Ten The BRCA1 Gene and Protein
 Hands-On Ten The BRCA1 Gene and Protein Objective: To review transcription, translation, reading frames, mutations, and reading files from GenBank, and to review some of the bioinformatics tools, such
Gene Selection for Tumor Classification Using Microarray Gene Expression Data
 Gene Selection for Tumor Classification Using Microarray Gene Expression Data K. Yendrapalli, R. Basnet, S. Mukkamala, A. H. Sung Department of Computer Science New Mexico Institute of Mining and Technology
Significance Analysis of Prognostic Signatures
 Andrew H. Beck 1 *, Nicholas W. Knoblauch 1, Marco M. Hefti 1, Jennifer Kaplan 1, Stuart J. Schnitt 1, Aedin C. Culhane 2,3, Markus S. Schroeder 2,3, Thomas Risch 2,3, John Quackenbush 2,3,4, Benjamin
Nature Getetics: doi: /ng.3471
 Supplementary Figure 1 Summary of exome sequencing data. ( a ) Exome tumor normal sample sizes for bladder cancer (BLCA), breast cancer (BRCA), carcinoid (CARC), chronic lymphocytic leukemia (CLLX), colorectal
A Practical Guide to Integrative Genomics by RNA-seq and ChIP-seq Analysis
 A Practical Guide to Integrative Genomics by RNA-seq and ChIP-seq Analysis Jian Xu, Ph.D. Children s Research Institute, UTSW Introduction Outline Overview of genomic and next-gen sequencing technologies
A COMBINATORY ALGORITHM OF UNIVARIATE AND MULTIVARIATE GENE SELECTION
 5-9 JATIT. All rights reserved. A COMBINATORY ALGORITHM OF UNIVARIATE AND MULTIVARIATE GENE SELECTION 1 H. Mahmoodian, M. Hamiruce Marhaban, 3 R. A. Rahim, R. Rosli, 5 M. Iqbal Saripan 1 PhD student, Department
Nature Genetics: doi: /ng Supplementary Figure 1. Assessment of sample purity and quality.
 Supplementary Figure 1 Assessment of sample purity and quality. (a) Hematoxylin and eosin staining of formaldehyde-fixed, paraffin-embedded sections from a human testis biopsy collected concurrently with
Supplementary Figures
 Supplementary Figures Supplementary Figure 1. Pan-cancer analysis of global and local DNA methylation variation a) Variations in global DNA methylation are shown as measured by averaging the genome-wide
Gene Expression Analysis Web Forum. Jonathan Gerstenhaber Field Application Specialist
 Gene Expression Analysis Web Forum Jonathan Gerstenhaber Field Application Specialist Our plan today: Import Preliminary Analysis Statistical Analysis Additional Analysis Downstream Analysis 2 Copyright
Supplementary information for: Human micrornas co-silence in well-separated groups and have different essentialities
 Supplementary information for: Human micrornas co-silence in well-separated groups and have different essentialities Gábor Boross,2, Katalin Orosz,2 and Illés J. Farkas 2, Department of Biological Physics,
Computational Analysis of UHT Sequences Histone modifications, CAGE, RNA-Seq
 Computational Analysis of UHT Sequences Histone modifications, CAGE, RNA-Seq Philipp Bucher Wednesday January 21, 2009 SIB graduate school course EPFL, Lausanne ChIP-seq against histone variants: Biological
IN SPITE of a very quick development of medicine within
 INTL JOURNAL OF ELECTRONICS AND TELECOMMUNICATIONS, 21, VOL. 6, NO. 3, PP. 281-286 Manuscript received July 1, 21: revised September, 21. DOI: 1.2478/v1177-1-37-9 Application of Density Based Clustering
Protein SD Units (P-value) Cluster order
 Cluster order") SUPPLEMENTAL TABLE AND FIGURES Table S1. Signature Phosphoproteome of CD22 E12 Transgenic Mouse BPL Cells. T-test vs. Other Protein SD Units (P-value) Cluster order ATPase (Ab-16) 1.41 0.000880 1 mtor
SUPPLEMENTAL TABLE AND FIGURES Table S1. Signature Phosphoproteome of CD22 E12 Transgenic Mouse BPL Cells. T-test vs. Other Protein SD Units (P-value) Cluster order ATPase (Ab-16) 1.41 0.000880 1 mtor
Expanded View Figures
 Solip Park & Ben Lehner Epistasis is cancer type specific Molecular Systems Biology Expanded View Figures A B G C D E F H Figure EV1. Epistatic interactions detected in a pan-cancer analysis and saturation
Abstract. Patricia G. Melloy*
 Laboratory Exercise Using an International p53 Mutation Database as a Foundation for an Online Laboratory in an Upper Level Undergraduate Biology Class ws Patricia G. Melloy* From the Department of Biological
PCxN: The pathway co-activity map: a resource for the unification of functional biology
 PCxN: The pathway co-activity map: a resource for the unification of functional biology Sheffield Institute for Translational Neurosciences Center for Integrative Genome Translation GENOME INFORMATICS
On the Reproducibility of TCGA Ovarian Cancer MicroRNA Profiles
 On the Reproducibility of TCGA Ovarian Cancer MicroRNA Profiles Ying-Wooi Wan 1,2,4, Claire M. Mach 2,3, Genevera I. Allen 1,7,8, Matthew L. Anderson 2,4,5 *, Zhandong Liu 1,5,6,7 * 1 Departments of Pediatrics
Predictive Biomarkers
 Uğur Sezerman Evolutionary Selection of Near Optimal Number of Features for Classification of Gene Expression Data Using Genetic Algorithms Predictive Biomarkers Biomarker: A gene, protein, or other change
Gene and Pathway Analysis of Metabolic Traits in Dairy Cows
 Gene and Pathway Analysis of Metabolic Traits in Dairy Cows Ngoc-Thuy Ha Animal Breeding and Genetics Group Department of Animal Sciences Georg-August-University Goettingen, Germany 1 1 Motivation Background
Statistical analysis of RIM data (retroviral insertional mutagenesis) Bioinformatics and Statistics The Netherlands Cancer Institute Amsterdam
 Bioinformatics and Statistics The Netherlands Cancer Institute Amsterdam") Statistical analysis of RIM data (retroviral insertional mutagenesis) Lodewyk Wessels Bioinformatics and Statistics The Netherlands Cancer Institute Amsterdam Viral integration Viral integration Viral
Statistical analysis of RIM data (retroviral insertional mutagenesis) Lodewyk Wessels Bioinformatics and Statistics The Netherlands Cancer Institute Amsterdam Viral integration Viral integration Viral
Nature Structural & Molecular Biology: doi: /nsmb Supplementary Figure 1
 Supplementary Figure 1 Effect of HSP90 inhibition on expression of endogenous retroviruses. (a) Inducible shrna-mediated Hsp90 silencing in mouse ESCs. Immunoblots of total cell extract expressing the
Chromatin marks identify critical cell-types for fine-mapping complex trait variants
 Chromatin marks identify critical cell-types for fine-mapping complex trait variants Gosia Trynka 1-4 *, Cynthia Sandor 1-4 *, Buhm Han 1-4, Han Xu 5, Barbara E Stranger 1,4#, X Shirley Liu 5, and Soumya
Integrative analysis of survival-associated gene sets in breast cancer
 Varn et al. BMC Medical Genomics (2015) 8:11 DOI 10.1186/s12920-015-0086-0 RESEARCH ARTICLE Open Access Integrative analysis of survival-associated gene sets in breast cancer Frederick S Varn 1, Matthew
Computational Thinking in Genome and Proteome Analysis: A Logician s Adventures in Computational Biology. Wong Limsoon
 Computational Thinking in Genome and Proteome Analysis: A Logician s Adventures in Computational Biology Wong Limsoon 2 what computational thinking is 3 An example of computational thinking Suppose 20%
Supplementary Materials Extracting a Cellular Hierarchy from High-dimensional Cytometry Data with SPADE
 Supplementary Materials Extracting a Cellular Hierarchy from High-dimensional Cytometry Data with SPADE Peng Qiu1,4, Erin F. Simonds2, Sean C. Bendall2, Kenneth D. Gibbs Jr.2, Robert V. Bruggner2, Michael
Mutational Impact on Diagnostic and Prognostic Evaluation of MDS
 Mutational Impact on Diagnostic and Prognostic Evaluation of MDS Elsa Bernard, PhD Papaemmanuil Lab, Computational Oncology, MSKCC MDS Foundation ASH 2018 Symposium Disclosure Research funds provided by
Multiplexed Cancer Pathway Analysis
 NanoString Technologies, Inc. Multiplexed Cancer Pathway Analysis for Gene Expression Lucas Dennis, Patrick Danaher, Rich Boykin, Joseph Beechem NanoString Technologies, Inc., Seattle WA 98109 v1.0 MARCH
Data analysis in microarray experiment
 16 1 004 Chinese Bulletin of Life Sciences Vol. 16, No. 1 Feb., 004 1004-0374 (004) 01-0041-08 100005 Q33 A Data analysis in microarray experiment YANG Chang, FANG Fu-De * (National Laboratory of Medical
S1 Appendix: Figs A G and Table A. b Normal Generalized Fraction 0.075
 Aiello & Alter (216) PLoS One vol. 11 no. 1 e164546 S1 Appendix A-1 S1 Appendix: Figs A G and Table A a Tumor Generalized Fraction b Normal Generalized Fraction.25.5.75.25.5.75 1 53 4 59 2 58 8 57 3 48
Cancer outlier differential gene expression detection
 Biostatistics (2007), 8, 3, pp. 566 575 doi:10.1093/biostatistics/kxl029 Advance Access publication on October 4, 2006 Cancer outlier differential gene expression detection BAOLIN WU Division of Biostatistics,
SUPPLEMENTARY INFORMATION
 doi:10.1038/nature10866 a b 1 2 3 4 5 6 7 Match No Match 1 2 3 4 5 6 7 Turcan et al. Supplementary Fig.1 Concepts mapping H3K27 targets in EF CBX8 targets in EF H3K27 targets in ES SUZ12 targets in ES
SSM signature genes are highly expressed in residual scar tissues after preoperative radiotherapy of rectal cancer.
 Supplementary Figure 1 SSM signature genes are highly expressed in residual scar tissues after preoperative radiotherapy of rectal cancer. Scatter plots comparing expression profiles of matched pretreatment
Gene-microRNA network module analysis for ovarian cancer
 Gene-microRNA network module analysis for ovarian cancer Shuqin Zhang School of Mathematical Sciences Fudan University Oct. 4, 2016 Outline Introduction Materials and Methods Results Conclusions Introduction
Expanded View Figures
 Molecular Systems iology Tumor CNs reflect metabolic selection Nicholas Graham et al Expanded View Figures Human primary tumors CN CN characterization by unsupervised PC Human Signature Human Signature
7.012 Quiz 3 Answers
 MIT Biology Department 7.012: Introductory Biology - Fall 2004 Instructors: Professor Eric Lander, Professor Robert A. Weinberg, Dr. Claudette Gardel Friday 11/12/04 7.012 Quiz 3 Answers A > 85 B 72-84
Cancer Genetics. What is Cancer? Cancer Classification. Medical Genetics. Uncontrolled growth of cells. Not all tumors are cancerous
 Session8 Medical Genetics Cancer Genetics J avad Jamshidi F a s a U n i v e r s i t y o f M e d i c a l S c i e n c e s, N o v e m b e r 2 0 1 7 What is Cancer? Uncontrolled growth of cells Not all tumors
DeSigN: connecting gene expression with therapeutics for drug repurposing and development. Bernard lee GIW 2016, Shanghai 8 October 2016
 DeSigN: connecting gene expression with therapeutics for drug repurposing and development Bernard lee GIW 2016, Shanghai 8 October 2016 1 Motivation Average cost: USD 1.8 to 2.6 billion ~2% Attrition rate
Peak-calling for ChIP-seq and ATAC-seq
 Peak-calling for ChIP-seq and ATAC-seq Shamith Samarajiwa CRUK Autumn School in Bioinformatics 2017 University of Cambridge Overview Peak-calling: identify enriched (signal) regions in ChIP-seq or ATAC-seq
MUTUAL INFORMATION ANALYSIS AS A TOOL TO ASSESS THE ROLE OF ANEUPLOIDY IN THE GENERATION OF CANCER-ASSOCIATED DIFFERENTIAL GENE EXPRESSION PATTERNS
 MUTUAL INFORMATION ANALYSIS AS A TOOL TO ASSESS THE ROLE OF ANEUPLOIDY IN THE GENERATION OF CANCER-ASSOCIATED DIFFERENTIAL GENE EXPRESSION PATTERNS GREGORY T. KLUS @, ANDREW SONG @, ARI SCHICK @, MATTIAS
Introduction to Gene Sets Analysis
 Introduction to Svitlana Tyekucheva Dana-Farber Cancer Institute May 15, 2012 Introduction Various measurements: gene expression, copy number variation, methylation status, mutation profile, etc. Main
Author's response to reviews
 Author's response to reviews Title: Specific Gene Expression Profiles and Unique Chromosomal Abnormalities are Associated with Regressing Tumors Among Infants with Dissiminated Neuroblastoma. Authors:
Claudia Adams Barr Program in Innovative Cancer Research Dana-Farber Cancer Institute BARR PROGRAM IMPACT STATEMENTS
 Claudia Adams Barr Program in Innovative Cancer Research Dana-Farber Cancer Institute BARR PROGRAM IMPACT STATEMENTS Brain Cancer New Treatment Opportunities - Discovery of new pathways in brain cancers
Integration of Cancer Genome into GECCO- Genetics and Epidemiology of Colorectal Cancer Consortium
 Integration of Cancer Genome into GECCO- Genetics and Epidemiology of Colorectal Cancer Consortium Ulrike Peters Fred Hutchinson Cancer Research Center University of Washington U01-CA137088-05, PI: Peters
저작권법에따른이용자의권리는위의내용에의하여영향을받지않습니다.
 저작자표시 - 비영리 - 변경금지 2.0 대한민국 이용자는아래의조건을따르는경우에한하여자유롭게 이저작물을복제, 배포, 전송, 전시, 공연및방송할수있습니다. 다음과같은조건을따라야합니다 : 저작자표시. 귀하는원저작자를표시하여야합니다. 비영리. 귀하는이저작물을영리목적으로이용할수없습니다. 변경금지. 귀하는이저작물을개작, 변형또는가공할수없습니다. 귀하는, 이저작물의재이용이나배포의경우,