EXPression ANalyzer and DisplayER
|
|
|
- Edgar Maxwell
- 5 years ago
- Views:
Transcription

1 EXPression ANalyzer and DisplayER Tom Hait Aviv Steiner Igor Ulitsky Chaim Linhart Amos Tanay Seagull Shavit Rani Elkon Adi Maron-Katz Dorit Sagir Eyal David Roded Sharan Israel Steinfeld Yossi Shiloh Ron Shamir Ron Shamir s Computational Genomics Group Rani Elkon s Group
 Hands-on part I (14:30-14:40)")
 Enrichment analysis")
 Hands-on part")
2 Schedule Data, preprocessing, grouping (14:15-14:30) Hands-on part I (14:30-14:40) Grouping analysis (14:40-14:55) Hands-on part II (14:55-15:10) Enrichment analysis (15:10-15:20) Hands-on part III (15:20-15:30) ChIP-seq and GSEA (15:30-15:45) Hands-on part IV (15:45-16:00)
, arabidopsis, tomato, listeria, leishmania, E. coli (two strains), aspargillus, rice. And v.")
3 EXPANDER an integrative package for analysis of gene expression and NGS data Built-in support for 18 organisms: human, mouse, rat, chicken, fly, zebrafish, C.elegans, yeast (s. cereviciae and s. pombe), arabidopsis, tomato, listeria, leishmania, E. coli (two strains), aspargillus, rice. And v.vinifera (grape) Demonstration on human CAL51 cell line experiments*: RNA-Seq data, which contains expression profiles measured in several time points after IR-induction. P53 ChIP-Seq data after 2 hours of IR-induction. *Data from Rashi-Elkeles, Warnatz and Elkon et al, 2014, Science Signaling, DOI: /scisignal
4 EXPANDER status 829 citations since citations since ,062 downloads since since 2017
5 What can it do? Low level analysis Data adjustments (missing values, merging, divide by base, log) Normalization Probes & condition filtering High level analysis Group detection (supervised clustering, differential expression, clustering, bi-clustering, network based grouping). Ascribing biological meaning to patterns via analysis
6 Links to public annotation databases Input data Preprocessing Grouping Gene sets analysis Visualization utilities Functional Location mirna Targets Promoter analyses pathway
7 EXPANDER Data Expression matrix (probe-row; condition-column) One-channel data (e.g., Affymetrix) Dual-channel data, in which data is log R/G (e.g. cdna microarrays).cel files RNA-Seq counts OR absolute/relative intensities data ChIP-Seq data: in BED or GFF3 formats ID conversion file: maps probes to genes Gene groups data: defines gene groups Gene ranks data: defines gene ranking for GSEA Network information (e.g. PPI network) -.sif format
8 First steps with the data load, define, preprocess Load dialog box, Data menu, Preprocessing menu Data definitions Defining condition subsets Data type & scale (log) Define genes of interest Data Adjustments Missing value estimation (KNN or arbitrary) Flooring Condition reordering Merging conditions Merging probes by gene IDs Assigning genes to ChIP-Seq peaks Divide by base Log data (base 2)
 = a")

9 Data preprocessing Normalization= removal of systematic biases Quantile = equalizes distributions Lowess (locally weighted scatter plot smoothing) = a non linear regression to a base array Visualizations to inspect normalization: box plots Scatter plots (simple and M vs. A) M=log 2 (A1/A2) A = 0.5*log 2 (A1*A2)
10 Data preprocessing Probe filtering Focus downstream analysis on the set of responding genes Fold-Change Variation Statistical tests: T-test, SAM (Significance Analysis of Microarrays), edger and deseq2 (RNAseq count data) It is possible to define VIP genes. Standardization : Mean=0, STD=1 (visualization) Condition filtering Order of operations
")
11 Hands-on (1-2)
12 Links to public annotation databases Input data Preprocessing Grouping Gene sets analysis Visualization utilities Functional Location mirna Targets Promoter signals pathway
 Similarity group (correlation to a selected probe/gene) Rule based grouping (define a")
13 Supervised Grouping Differential expression: a) Under normality assumption: t-test, SAM b) No normality assumption (RNA Seq data): Wilcoxon rank sum test, Negative binomial (edger/deseq2) Similarity group (correlation to a selected probe/gene) Rule based grouping (define a pattern)
14 Unsupervised grouping - cluster Analysis Partition into distinct groups, each with a particular expression pattern co-expression co-function co-expression co-regulation Partition the genes attempts to maximize: Homogeneity within clusters Separation between clusters
15 Cluster Analysis within Expander Implemented algorithms: CLICK, K-means, SOM, Hierarchical Visualization: Mean expression patterns Heat-maps Chromosomal positions Network sub-graph (Cytoscape integration) PCA Clustered heat map

16 Biclustering Clustering seeks global partition according to similarity across ALL conditions >> becomes too restrictive on large datasets. Relevant knowledge can be revealed by identifying genes with common pattern across a subset of the conditions Novel algorithmic approach is needed: Biclustering
 - Ihmels et.al Nat Genet 2002 SAMBA = Statistical Algorithmic Method for Bicluster Analysis ( A. Tanay, R. Sharan, R.")
17 Biclustering II * Bicluster = subset of genes with similar behavior under a subset of conditions Computationally challenging: has to consider many combinations Biclustering methods in EXPANDER: ISA (Iterative Signature Algorithm) - Ihmels et.al Nat Genet 2002 SAMBA = Statistical Algorithmic Method for Bicluster Analysis ( A. Tanay, R. Sharan, R. Shamir RECOMB 02)
18 Drawbacks/ limitations: Useful only for over 20 conditions Parameters How to asses the quality of Bi-clusters


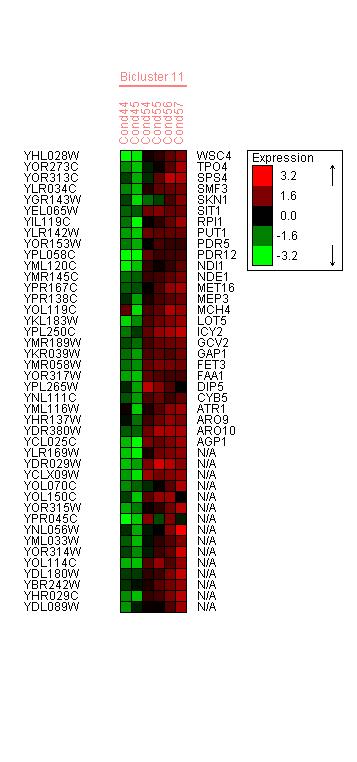
19 Biclustering Visualization
")
20 Hands-on (3-4)
21 Links to public annotation databases Input data Preprocessing Grouping Gene sets analysis Visualization utilities Functional Location mirna Targets Promoter signals pathway
 annotations for all")

22 Functional analysis - Ascribing functional meaning to gene groups Gene Ontology (GO) annotations for all supported organisms TANGO: Apply statistical tests that seek overrepresented GO functional categories in the groups

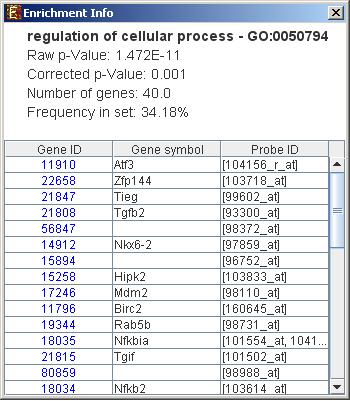

23 Functional Enrichment - Visualization Can be saves as a tabular.txt file
24 Pathway analysis Searches for biological pathways that are overrepresented in gene groups KEGG: Kyoto Encyclopedia of Genes and Genomes (mainly metabolic),all 18 orgs WikiPathways various biological pathways(~20 species, 1765 pathways) open resource Statistical hyper-geometric (HG) cumulative distribution score + multiple testing correction


25 Pathway visualization Same as functional visualization, plus pathway map in browser
26 Links to public annotation databases Input data Preprocessing Grouping Gene sets analysis Visualization utilities Functional Location mirna Targets Promoter Signals (PRIMA/ AMADEUS) pathway
27 Inferring regulatory mechanisms from gene expression data Assumption: co-expression transcriptional co-regulation common cis-regulatory promoter elements Computational identification of cis-regulatory elements over-represention PRIMA - PRomoter Integration in Microarray Analysis (Elkon, et. Al, Genome Research, 2003) AMADEUS novel motif analysis
28 PRIMA general description Input: Target set (e.g. co-expressed genes) Background set (e.g. all genes on the chip) Analysis: Detects TFs with high target set prevalence TF binding site models TRANSFAC DB Default: From bp to 200 bp relative the TSS

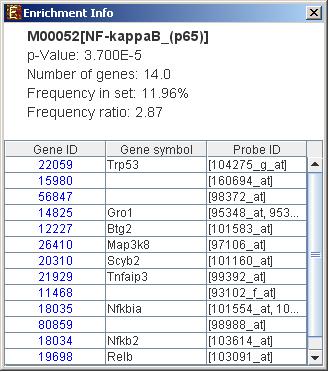


29 Promoter Analysis - Visualization Frequency ratio

30 Amadeus A Motif Algorithm for Detecting Enrichment in multiple Species Supports diverse motif discovery tasks: 1. Finding over-represented motifs in one or more given sets of genes. 2. Identifying motifs with global spatial features given only the genomic sequences. Possible Gene-sets: 1. Identified gene sets clusters vs. all genes promoters. 2. ChIP-Seq peaks sequences using Expander built-in FASTA sequences generation.


31 AMADEUS on ChIP-Seq peaks TF binding site map Binding sites distribution
32 Hands-on (4-7)

 Location mirna Targets (FAME) Promoter")
33 Links to public annotation databases Input data ChIP-Seq Normalization/ Filtering Grouping (Clustering/ Biclustering/ Network based clustering) Gene sets analysis Visualization utilities Functional (TANGO) Location mirna Targets (FAME) Promoter signals (PRIMA/ AMADEUS)
34 Gene Sets Enrichment analysis Goal: Determine whether an a priori defined set of genes shows concordance with a biological pattern (e.g. differences between two phenotypes) Gene set sources: MSigDB (Broad molecular signature database) KEGG Wiki pathways Gene rank sources Phenotype labels Imported Selected condition Significance estimated with permutations FDR correction for multiple comparisons

35 Gene Sets Enrichment visualization
36 ChIP-Seq analysis Searches for over-representation of genes closest to ChIP-Seq data peaks Uses hyper geometric test Multiple testing correction (Bonferroni) Enrichment results visualization (same as other group analysis results)
37 ChIP-Seq visualization Peaks to genomic region distributions Closest gene to peak chromosome visualization Peaks in genomic regions Peaks annotation table including closest gene and genomic region (e.g., 5UTR, Exon etc)


38
39 Integration between different technologies GE data (Microarray/RNA- Seq)? ChIP-Seq peaks data ChIP-Seq vs. GE analysis: GSEA ChIP-Seq target genes as a single set ChIP-Seq of GE s clusters ChIP-Seq target genes distribution in GE Expander tools (e.g., TANGO, PRIMA) select ChIP-Seq target genes as a single cluster

40 GSEA ChIP-Seq vs. GE

41 Rank distribution ChIP-Seq vs. GE

42
")
43 Hands-on (8-10)
Data mining with Ensembl Biomart. Stéphanie Le Gras
 Data mining with Ensembl Biomart Stéphanie Le Gras (slegras@igbmc.fr) Guidelines Genome data Genome browsers Getting access to genomic data: Ensembl/BioMart 2 Genome Sequencing Example: Human genome 2000:
Computational Analysis of UHT Sequences Histone modifications, CAGE, RNA-Seq
 Computational Analysis of UHT Sequences Histone modifications, CAGE, RNA-Seq Philipp Bucher Wednesday January 21, 2009 SIB graduate school course EPFL, Lausanne ChIP-seq against histone variants: Biological
Discovery of Novel Human Gene Regulatory Modules from Gene Co-expression and
 Discovery of Novel Human Gene Regulatory Modules from Gene Co-expression and Promoter Motif Analysis Shisong Ma 1,2*, Michael Snyder 3, and Savithramma P Dinesh-Kumar 2* 1 School of Life Sciences, University
User Guide. Association analysis. Input
 User Guide TFEA.ChIP is a tool to estimate transcription factor enrichment in a set of differentially expressed genes using data from ChIP-Seq experiments performed in different tissues and conditions.
cis-regulatory enrichment analysis in human, mouse and fly
 cis-regulatory enrichment analysis in human, mouse and fly Zeynep Kalender Atak, PhD Laboratory of Computational Biology VIB-KU Leuven Center for Brain & Disease Research Laboratory of Computational Biology
Accessing and Using ENCODE Data Dr. Peggy J. Farnham
 1 William M Keck Professor of Biochemistry Keck School of Medicine University of Southern California How many human genes are encoded in our 3x10 9 bp? C. elegans (worm) 959 cells and 1x10 8 bp 20,000
Micro-RNA web tools. Introduction. UBio Training Courses. mirnas, target prediction, biology. Gonzalo
 Micro-RNA web tools UBio Training Courses Gonzalo Gómez//ggomez@cnio.es Introduction mirnas, target prediction, biology Experimental data Network Filtering Pathway interpretation mirs-pathways network
Nature Immunology: doi: /ni Supplementary Figure 1. Transcriptional program of the TE and MP CD8 + T cell subsets.
 Supplementary Figure 1 Transcriptional program of the TE and MP CD8 + T cell subsets. (a) Comparison of gene expression of TE and MP CD8 + T cell subsets by microarray. Genes that are 1.5-fold upregulated
Analysis of Massively Parallel Sequencing Data Application of Illumina Sequencing to the Genetics of Human Cancers
 Analysis of Massively Parallel Sequencing Data Application of Illumina Sequencing to the Genetics of Human Cancers Gordon Blackshields Senior Bioinformatician Source BioScience 1 To Cancer Genetics Studies
A quick review. The clustering problem: Hierarchical clustering algorithm: Many possible distance metrics K-mean clustering algorithm:
 The clustering problem: partition genes into distinct sets with high homogeneity and high separation Hierarchical clustering algorithm: 1. Assign each object to a separate cluster. 2. Regroup the pair
Gene expression analysis. Roadmap. Microarray technology: how it work Applications: what can we do with it Preprocessing: Classification Clustering
 Gene expression analysis Roadmap Microarray technology: how it work Applications: what can we do with it Preprocessing: Image processing Data normalization Classification Clustering Biclustering 1 Gene
Exercises: Differential Methylation
 Exercises: Differential Methylation Version 2018-04 Exercises: Differential Methylation 2 Licence This manual is 2014-18, Simon Andrews. This manual is distributed under the creative commons Attribution-Non-Commercial-Share
A Practical Guide to Integrative Genomics by RNA-seq and ChIP-seq Analysis
 A Practical Guide to Integrative Genomics by RNA-seq and ChIP-seq Analysis Jian Xu, Ph.D. Children s Research Institute, UTSW Introduction Outline Overview of genomic and next-gen sequencing technologies
Computational aspects of ChIP-seq. John Marioni Research Group Leader European Bioinformatics Institute European Molecular Biology Laboratory
 Computational aspects of ChIP-seq John Marioni Research Group Leader European Bioinformatics Institute European Molecular Biology Laboratory ChIP-seq Using highthroughput sequencing to investigate DNA
High Throughput Sequence (HTS) data analysis. Lei Zhou
 data analysis. Lei Zhou") High Throughput Sequence (HTS) data analysis Lei Zhou (leizhou@ufl.edu) High Throughput Sequence (HTS) data analysis 1. Representation of HTS data. 2. Visualization of HTS data. 3. Discovering genomic
High Throughput Sequence (HTS) data analysis Lei Zhou (leizhou@ufl.edu) High Throughput Sequence (HTS) data analysis 1. Representation of HTS data. 2. Visualization of HTS data. 3. Discovering genomic
Nature Methods: doi: /nmeth.3115
 Supplementary Figure 1 Analysis of DNA methylation in a cancer cohort based on Infinium 450K data. RnBeads was used to rediscover a clinically distinct subgroup of glioblastoma patients characterized by
MethylMix An R package for identifying DNA methylation driven genes
 MethylMix An R package for identifying DNA methylation driven genes Olivier Gevaert May 3, 2016 Stanford Center for Biomedical Informatics Department of Medicine 1265 Welch Road Stanford CA, 94305-5479
Nature Genetics: doi: /ng Supplementary Figure 1. SEER data for male and female cancer incidence from
 Supplementary Figure 1 SEER data for male and female cancer incidence from 1975 2013. (a,b) Incidence rates of oral cavity and pharynx cancer (a) and leukemia (b) are plotted, grouped by males (blue),
Supplementary Figures
 Supplementary Figures Supplementary Figure 1. Heatmap of GO terms for differentially expressed genes. The terms were hierarchically clustered using the GO term enrichment beta. Darker red, higher positive
CNV PCA Search Tutorial
 CNV PCA Search Tutorial Release 8.1 Golden Helix, Inc. March 18, 2014 Contents 1. Data Preparation 2 A. Join Log Ratio Data with Phenotype Information.............................. 2 B. Activate only
7SK ChIRP-seq is specifically RNA dependent and conserved between mice and humans.
 Supplementary Figure 1 7SK ChIRP-seq is specifically RNA dependent and conserved between mice and humans. Regions targeted by the Even and Odd ChIRP probes mapped to a secondary structure model 56 of the
Comparison of open chromatin regions between dentate granule cells and other tissues and neural cell types.
 Supplementary Figure 1 Comparison of open chromatin regions between dentate granule cells and other tissues and neural cell types. (a) Pearson correlation heatmap among open chromatin profiles of different
The 16th KJC Bioinformatics Symposium Integrative analysis identifies potential DNA methylation biomarkers for pan-cancer diagnosis and prognosis
 The 16th KJC Bioinformatics Symposium Integrative analysis identifies potential DNA methylation biomarkers for pan-cancer diagnosis and prognosis Tieliu Shi tlshi@bio.ecnu.edu.cn The Center for bioinformatics
SUPPLEMENTARY INFORMATION
 doi:10.1038/nature10866 a b 1 2 3 4 5 6 7 Match No Match 1 2 3 4 5 6 7 Turcan et al. Supplementary Fig.1 Concepts mapping H3K27 targets in EF CBX8 targets in EF H3K27 targets in ES SUZ12 targets in ES
Breast cancer. Risk factors you cannot change include: Treatment Plan Selection. Inferring Transcriptional Module from Breast Cancer Profile Data
 Breast cancer Inferring Transcriptional Module from Breast Cancer Profile Data Breast Cancer and Targeted Therapy Microarray Profile Data Inferring Transcriptional Module Methods CSC 177 Data Warehousing
Package AbsFilterGSEA
 Type Package Package AbsFilterGSEA September 21, 2017 Title Improved False Positive Control of Gene-Permuting GSEA with Absolute Filtering Version 1.5.1 Author Sora Yoon Maintainer
Integrative analysis of survival-associated gene sets in breast cancer
 Varn et al. BMC Medical Genomics (2015) 8:11 DOI 10.1186/s12920-015-0086-0 RESEARCH ARTICLE Open Access Integrative analysis of survival-associated gene sets in breast cancer Frederick S Varn 1, Matthew
Case Studies on High Throughput Gene Expression Data Kun Huang, PhD Raghu Machiraju, PhD
 Case Studies on High Throughput Gene Expression Data Kun Huang, PhD Raghu Machiraju, PhD Department of Biomedical Informatics Department of Computer Science and Engineering The Ohio State University Review
SUPPLEMENTARY FIGURES: Supplementary Figure 1
 SUPPLEMENTARY FIGURES: Supplementary Figure 1 Supplementary Figure 1. Glioblastoma 5hmC quantified by paired BS and oxbs treated DNA hybridized to Infinium DNA methylation arrays. Workflow depicts analytic
Variant Classification. Author: Mike Thiesen, Golden Helix, Inc.
 Variant Classification Author: Mike Thiesen, Golden Helix, Inc. Overview Sequencing pipelines are able to identify rare variants not found in catalogs such as dbsnp. As a result, variants in these datasets
Supplementary Figure S1. Gene expression analysis of epidermal marker genes and TP63.
 Supplementary Figure Legends Supplementary Figure S1. Gene expression analysis of epidermal marker genes and TP63. A. Screenshot of the UCSC genome browser from normalized RNAPII and RNA-seq ChIP-seq data
Computational Identification and Prediction of Tissue-Specific Alternative Splicing in H. Sapiens. Eric Van Nostrand CS229 Final Project
 Computational Identification and Prediction of Tissue-Specific Alternative Splicing in H. Sapiens. Eric Van Nostrand CS229 Final Project Introduction RNA splicing is a critical step in eukaryotic gene
38 Int'l Conf. Bioinformatics and Computational Biology BIOCOMP'16
 38 Int'l Conf. Bioinformatics and Computational Biology BIOCOMP'16 PGAR: ASD Candidate Gene Prioritization System Using Expression Patterns Steven Cogill and Liangjiang Wang Department of Genetics and
Gene-microRNA network module analysis for ovarian cancer
 Gene-microRNA network module analysis for ovarian cancer Shuqin Zhang School of Mathematical Sciences Fudan University Oct. 4, 2016 Outline Introduction Materials and Methods Results Conclusions Introduction
Gene Expression Analysis Web Forum. Jonathan Gerstenhaber Field Application Specialist
 Gene Expression Analysis Web Forum Jonathan Gerstenhaber Field Application Specialist Our plan today: Import Preliminary Analysis Statistical Analysis Additional Analysis Downstream Analysis 2 Copyright
ChIP-seq analysis. J. van Helden, M. Defrance, C. Herrmann, D. Puthier, N. Servant, M. Thomas-Chollier, O.Sand
 ChIP-seq analysis J. van Helden, M. Defrance, C. Herrmann, D. Puthier, N. Servant, M. Thomas-Chollier, O.Sand Tuesday : quick introduction to ChIP-seq and peak-calling (Presentation + Practical session)
Gene Ontology and Functional Enrichment. Genome 559: Introduction to Statistical and Computational Genomics Elhanan Borenstein
 Gene Ontology and Functional Enrichment Genome 559: Introduction to Statistical and Computational Genomics Elhanan Borenstein The parsimony principle: A quick review Find the tree that requires the fewest
a) List of KMTs targeted in the shrna screen. The official symbol, KMT designation,
 List of KMTs targeted in the shrna screen. The official symbol, KMT designation,") Supplementary Information Supplementary Figures Supplementary Figure 1. a) List of KMTs targeted in the shrna screen. The official symbol, KMT designation, gene ID and specifities are provided. Those highlighted
Supplementary Information Supplementary Figures Supplementary Figure 1. a) List of KMTs targeted in the shrna screen. The official symbol, KMT designation, gene ID and specifities are provided. Those highlighted
Integrating Genome and Functional Genomics Data to Reveal Perturbed Signaling Pathways in Ovarian Cancers
 Integrating Genome and Functional Genomics Data to Reveal Perturbed Signaling Pathways in Ovarian Cancers Songjian Lu, PhD, Xinghua Lu, MD. PhD Dept. Biomedical Informatics, Univ. Pittsburgh, PA 15232
Lecture 21. RNA-seq: Advanced analysis
 Lecture 21 RNA-seq: Advanced analysis Experimental design Introduction An experiment is a process or study that results in the collection of data. Statistical experiments are conducted in situations in
Supplementary Materials for
 www.sciencesignaling.org/cgi/content/full/8/375/ra41/dc1 Supplementary Materials for Actin cytoskeletal remodeling with protrusion formation is essential for heart regeneration in Hippo-deficient mice
A Quick-Start Guide for rseqdiff
 A Quick-Start Guide for rseqdiff Yang Shi (email: shyboy@umich.edu) and Hui Jiang (email: jianghui@umich.edu) 09/05/2013 Introduction rseqdiff is an R package that can detect differential gene and isoform
Rank based statistics in analyzing high-throughput genomic data
 The Raymond and Beverly Sackler Faculty of Exact Sciences School of Computer Science Rank based statistics in analyzing high-throughput genomic data Thesis submitted in partial fulfillment of the requirements
A Network Partition Algorithm for Mining Gene Functional Modules of Colon Cancer from DNA Microarray Data
 Method A Network Partition Algorithm for Mining Gene Functional Modules of Colon Cancer from DNA Microarray Data Xiao-Gang Ruan, Jin-Lian Wang*, and Jian-Geng Li Institute of Artificial Intelligence and
Broad H3K4me3 is associated with increased transcription elongation and enhancer activity at tumor suppressor genes
 Broad H3K4me3 is associated with increased transcription elongation and enhancer activity at tumor suppressor genes Kaifu Chen 1,2,3,4,5,10, Zhong Chen 6,10, Dayong Wu 6, Lili Zhang 7, Xueqiu Lin 1,2,8,
R2 Training Courses. Release The R2 support team
 R2 Training Courses Release 2.0.2 The R2 support team Nov 08, 2018 Students Course 1 Student Course: Investigating Intra-tumor Heterogeneity 3 1.1 Introduction.............................................
Nature Structural & Molecular Biology: doi: /nsmb.2419
 Supplementary Figure 1 Mapped sequence reads and nucleosome occupancies. (a) Distribution of sequencing reads on the mouse reference genome for chromosome 14 as an example. The number of reads in a 1 Mb
Assignment 5: Integrative epigenomics analysis
 Assignment 5: Integrative epigenomics analysis Due date: Friday, 2/24 10am. Note: no late assignments will be accepted. Introduction CpG islands (CGIs) are important regulatory regions in the genome. What
Sexually-dimorphic targeting of functionally-related genes in COPD
 BMC Systems Biology This Provisional PDF corresponds to the article as it appeared upon acceptance. Fully formatted PDF and full text (HTML) versions will be made available soon. Sexually-dimorphic targeting
SUPPLEMENTARY APPENDIX
 SUPPLEMENTARY APPENDIX 1) Supplemental Figure 1. Histopathologic Characteristics of the Tumors in the Discovery Cohort 2) Supplemental Figure 2. Incorporation of Normal Epidermal Melanocytic Signature
Hands-On Ten The BRCA1 Gene and Protein
 Hands-On Ten The BRCA1 Gene and Protein Objective: To review transcription, translation, reading frames, mutations, and reading files from GenBank, and to review some of the bioinformatics tools, such
REACTIN: Regulatory activity inference of transcription factors underlying human diseases with application to breast cancer
 Zhu et al. BMC Genomics 2013, 14:504 METHODOLOGY ARTICLE Open Access REACTIN: Regulatory activity inference of transcription factors underlying human diseases with application to breast cancer Mingzhu
List of Figures. List of Tables. Preface to the Second Edition. Preface to the First Edition
 List of Figures List of Tables Preface to the Second Edition Preface to the First Edition xv xxv xxix xxxi 1 What Is R? 1 1.1 Introduction to R................................ 1 1.2 Downloading and Installing
Supplemental Data. Integrating omics and alternative splicing i reveals insights i into grape response to high temperature
 Supplemental Data Integrating omics and alternative splicing i reveals insights i into grape response to high temperature Jianfu Jiang 1, Xinna Liu 1, Guotian Liu, Chonghuih Liu*, Shaohuah Li*, and Lijun
Integrated Analysis of Copy Number and Gene Expression
 Integrated Analysis of Copy Number and Gene Expression Nexus Copy Number provides user-friendly interface and functionalities to integrate copy number analysis with gene expression results for the purpose
Chapter 1. Introduction
 Chapter 1 Introduction 1.1 Motivation and Goals The increasing availability and decreasing cost of high-throughput (HT) technologies coupled with the availability of computational tools and data form a
Inferring Biological Meaning from Cap Analysis Gene Expression Data
 Inferring Biological Meaning from Cap Analysis Gene Expression Data HRYSOULA PAPADAKIS 1. Introduction This project is inspired by the recent development of the Cap analysis gene expression (CAGE) method,
Modeling Sentiment with Ridge Regression
 Modeling Sentiment with Ridge Regression Luke Segars 2/20/2012 The goal of this project was to generate a linear sentiment model for classifying Amazon book reviews according to their star rank. More generally,
Cancer Informatics Lecture
 Cancer Informatics Lecture Mayo-UIUC Computational Genomics Course June 22, 2018 Krishna Rani Kalari Ph.D. Associate Professor 2017 MFMER 3702274-1 Outline The Cancer Genome Atlas (TCGA) Genomic Data Commons
Classification of cancer profiles. ABDBM Ron Shamir
 Classification of cancer profiles 1 Background: Cancer Classification Cancer classification is central to cancer treatment; Traditional cancer classification methods: location; morphology, cytogenesis;
Supplemental Figure S1. Expression of Cirbp mrna in mouse tissues and NIH3T3 cells.
 SUPPLEMENTAL FIGURE AND TABLE LEGENDS Supplemental Figure S1. Expression of Cirbp mrna in mouse tissues and NIH3T3 cells. A) Cirbp mrna expression levels in various mouse tissues collected around the clock
genomics for systems biology / ISB2020 RNA sequencing (RNA-seq)
") RNA sequencing (RNA-seq) Module Outline MO 13-Mar-2017 RNA sequencing: Introduction 1 WE 15-Mar-2017 RNA sequencing: Introduction 2 MO 20-Mar-2017 Paper: PMID 25954002: Human genomics. The human transcriptome
RNA sequencing (RNA-seq) Module Outline MO 13-Mar-2017 RNA sequencing: Introduction 1 WE 15-Mar-2017 RNA sequencing: Introduction 2 MO 20-Mar-2017 Paper: PMID 25954002: Human genomics. The human transcriptome
BIMM 143. RNA sequencing overview. Genome Informatics II. Barry Grant. Lecture In vivo. In vitro.
 RNA sequencing overview BIMM 143 Genome Informatics II Lecture 14 Barry Grant http://thegrantlab.org/bimm143 In vivo In vitro In silico ( control) Goal: RNA quantification, transcript discovery, variant
Chip Seq Peak Calling in Galaxy
 Chip Seq Peak Calling in Galaxy Chris Seward PowerPoint by Pei-Chen Peng Chip-Seq Peak Calling in Galaxy Chris Seward 2018 1 Introduction This goals of the lab are as follows: 1. Gain experience using
ChIP-seq data analysis
 ChIP-seq data analysis Harri Lähdesmäki Department of Computer Science Aalto University November 24, 2017 Contents Background ChIP-seq protocol ChIP-seq data analysis Transcriptional regulation Transcriptional
Gene Ontology 2 Function/Pathway Enrichment. Biol4559 Thurs, April 12, 2018 Bill Pearson Pinn 6-057
 Gene Ontology 2 Function/Pathway Enrichment Biol4559 Thurs, April 12, 2018 Bill Pearson wrp@virginia.edu 4-2818 Pinn 6-057 Function/Pathway enrichment analysis do sets (subsets) of differentially expressed
SUPPLEMENTARY INFORMATION
 doi:.38/nature8975 SUPPLEMENTAL TEXT Unique association of HOTAIR with patient outcome To determine whether the expression of other HOX lincrnas in addition to HOTAIR can predict patient outcome, we measured
EPIGENOMICS PROFILING SERVICES
 EPIGENOMICS PROFILING SERVICES Chromatin analysis DNA methylation analysis RNA-seq analysis Diagenode helps you uncover the mysteries of epigenetics PAGE 3 Integrative epigenomics analysis DNA methylation
Sudin Bhattacharya Institute for Integrative Toxicology
 Beyond the AHRE: the Role of Epigenomics in Gene Regulation by the AHR (or, Varied Applications of Computational Modeling in Toxicology and Ingredient Safety) Sudin Bhattacharya Institute for Integrative
Integration of high-throughput biological data
 Integration of high-throughput biological data Jean Yang and Vivek Jayaswal School of Mathematics and Statistics University of Sydney Meeting the Challenges of High Dimension: Statistical Methodology,
Identifying Potential Prognostic Biomarkers by Analyzing Gene Expression for Different Cancers
 Identifying Potential Prognostic Biomarkers by Analyzing Gene Expression for Different Cancers Pragya Verma Department of Mathematics, Bioinformatics and Computer Applications Maulana Azad National Institute
Data analysis in microarray experiment
 16 1 004 Chinese Bulletin of Life Sciences Vol. 16, No. 1 Feb., 004 1004-0374 (004) 01-0041-08 100005 Q33 A Data analysis in microarray experiment YANG Chang, FANG Fu-De * (National Laboratory of Medical
MIR retrotransposon sequences provide insulators to the human genome
 Supplementary Information: MIR retrotransposon sequences provide insulators to the human genome Jianrong Wang, Cristina Vicente-García, Davide Seruggia, Eduardo Moltó, Ana Fernandez- Miñán, Ana Neto, Elbert
Expert-guided Visual Exploration (EVE) for patient stratification. Hamid Bolouri, Lue-Ping Zhao, Eric C. Holland
 for patient stratification. Hamid Bolouri, Lue-Ping Zhao, Eric C. Holland") Expert-guided Visual Exploration (EVE) for patient stratification Hamid Bolouri, Lue-Ping Zhao, Eric C. Holland Oncoscape.sttrcancer.org Paul Lisa Ken Jenny Desert Eric The challenge Given - patient clinical
Expert-guided Visual Exploration (EVE) for patient stratification Hamid Bolouri, Lue-Ping Zhao, Eric C. Holland Oncoscape.sttrcancer.org Paul Lisa Ken Jenny Desert Eric The challenge Given - patient clinical
A Biclustering Based Classification Framework for Cancer Diagnosis and Prognosis
 A Biclustering Based Classification Framework for Cancer Diagnosis and Prognosis Baljeet Malhotra and Guohui Lin Department of Computing Science, University of Alberta, Edmonton, Alberta, Canada T6G 2E8
Sexually-dimorphic targeting of functionally-related genes in COPD
 Sexually-dimorphic targeting of functionally-related genes in COPD The Harvard community has made this article openly available. Please share how this access benefits you. Your story matters Citation Glass,
Supplementary Information. Supplementary Figures
 Supplementary Information Supplementary Figures.8 57 essential gene density 2 1.5 LTR insert frequency diversity DEL.5 DUP.5 INV.5 TRA 1 2 3 4 5 1 2 3 4 1 2 Supplementary Figure 1. Locations and minor
Use Case 9: Coordinated Changes of Epigenomic Marks Across Tissue Types. Epigenome Informatics Workshop Bioinformatics Research Laboratory
 Use Case 9: Coordinated Changes of Epigenomic Marks Across Tissue Types Epigenome Informatics Workshop Bioinformatics Research Laboratory 1 Introduction Active or inactive states of transcription factor
Application of Artificial Neural Networks in Classification of Autism Diagnosis Based on Gene Expression Signatures
 Application of Artificial Neural Networks in Classification of Autism Diagnosis Based on Gene Expression Signatures 1 2 3 4 5 Kathleen T Quach Department of Neuroscience University of California, San Diego
Detecting gene signature activation in breast cancer in an absolute, single-patient manner
 Paquet et al. Breast Cancer Research (2017) 19:32 DOI 10.1186/s13058-017-0824-7 RESEARCH ARTICLE Detecting gene signature activation in breast cancer in an absolute, single-patient manner E. R. Paquet
Identifying Thyroid Carcinoma Subtypes and Outcomes through Gene Expression Data Kun-Hsing Yu, Wei Wang, Chung-Yu Wang
 Identifying Thyroid Carcinoma Subtypes and Outcomes through Gene Expression Data Kun-Hsing Yu, Wei Wang, Chung-Yu Wang Abstract: Unlike most cancers, thyroid cancer has an everincreasing incidence rate
Nature Structural & Molecular Biology: doi: /nsmb Supplementary Figure 1
 Supplementary Figure 1 Frequency of alternative-cassette-exon engagement with the ribosome is consistent across data from multiple human cell types and from mouse stem cells. Box plots showing AS frequency
Figure S2. Distribution of acgh probes on all ten chromosomes of the RIL M0022
 96 APPENDIX B. Supporting Information for chapter 4 "changes in genome content generated via segregation of non-allelic homologs" Figure S1. Potential de novo CNV probes and sizes of apparently de novo
Metabolomic Data Analysis with MetaboAnalyst
 Metabolomic Data Analysis with MetaboAnalyst User ID: guest6501 April 16, 2009 1 Data Processing and Normalization 1.1 Reading and Processing the Raw Data MetaboAnalyst accepts a variety of data types
RNA-Seq Preparation Comparision Summary: Lexogen, Standard, NEB
 RNA-Seq Preparation Comparision Summary: Lexogen, Standard, NEB CSF-NGS January 22, 214 Contents 1 Introduction 1 2 Experimental Details 1 3 Results And Discussion 1 3.1 ERCC spike ins............................................
Yingying Wei George Wu Hongkai Ji
 Stat Biosci (2013) 5:156 178 DOI 10.1007/s12561-012-9066-5 Global Mapping of Transcription Factor Binding Sites by Sequencing Chromatin Surrogates: a Perspective on Experimental Design, Data Analysis,
Biostatistics II
 Biostatistics II 514-5509 Course Description: Modern multivariable statistical analysis based on the concept of generalized linear models. Includes linear, logistic, and Poisson regression, survival analysis,
Supplementary Figure 1. Metabolic landscape of cancer discovery pipeline. RNAseq raw counts data of cancer and healthy tissue samples were downloaded
 Supplementary Figure 1. Metabolic landscape of cancer discovery pipeline. RNAseq raw counts data of cancer and healthy tissue samples were downloaded from TCGA and differentially expressed metabolic genes
Single SNP/Gene Analysis. Typical Results of GWAS Analysis (Single SNP Approach) Typical Results of GWAS Analysis (Single SNP Approach)
 Typical Results of GWAS Analysis (Single SNP Approach)") High-Throughput Sequencing Course Gene-Set Analysis Biostatistics and Bioinformatics Summer 28 Section Introduction What is Gene Set Analysis? Many names for gene set analysis: Pathway analysis Gene set
High-Throughput Sequencing Course Gene-Set Analysis Biostatistics and Bioinformatics Summer 28 Section Introduction What is Gene Set Analysis? Many names for gene set analysis: Pathway analysis Gene set
Supplementary Information
 Supplementary Information Modelling the Yeast Interactome Vuk Janjić, Roded Sharan 2 and Nataša Pržulj, Department of Computing, Imperial College London, London, United Kingdom 2 Blavatnik School of Computer
Statistical Assessment of the Global Regulatory Role of Histone. Acetylation in Saccharomyces cerevisiae. (Support Information)
") Statistical Assessment of the Global Regulatory Role of Histone Acetylation in Saccharomyces cerevisiae (Support Information) Authors: Guo-Cheng Yuan, Ping Ma, Wenxuan Zhong and Jun S. Liu Linear Relationship
Statistical Assessment of the Global Regulatory Role of Histone Acetylation in Saccharomyces cerevisiae (Support Information) Authors: Guo-Cheng Yuan, Ping Ma, Wenxuan Zhong and Jun S. Liu Linear Relationship
Nature Neuroscience: doi: /nn Supplementary Figure 1
 Supplementary Figure 1 Illustration of the working of network-based SVM to confidently predict a new (and now confirmed) ASD gene. Gene CTNND2 s brain network neighborhood that enabled its prediction by
Figure S1. Analysis of endo-sirna targets in different microarray datasets. The
 Supplemental Figures: Figure S1. Analysis of endo-sirna targets in different microarray datasets. The percentage of each array dataset that were predicted endo-sirna targets according to the Ambros dataset
Tutorial: RNA-Seq Analysis Part II: Non-Specific Matches and Expression Measures
 : RNA-Seq Analysis Part II: Non-Specific Matches and Expression Measures March 15, 2013 CLC bio Finlandsgade 10-12 8200 Aarhus N Denmark Telephone: +45 70 22 55 09 Fax: +45 70 22 55 19 www.clcbio.com support@clcbio.com
SubLasso:a feature selection and classification R package with a. fixed feature subset
 SubLasso:a feature selection and classification R package with a fixed feature subset Youxi Luo,3,*, Qinghan Meng,2,*, Ruiquan Ge,2, Guoqin Mai, Jikui Liu, Fengfeng Zhou,#. Shenzhen Institutes of Advanced
DNA Sequence Bioinformatics Analysis with the Galaxy Platform
 DNA Sequence Bioinformatics Analysis with the Galaxy Platform University of São Paulo, Brazil 28 July - 1 August 2014 Dave Clements Johns Hopkins University Robson Francisco de Souza University of São
Nature Structural & Molecular Biology: doi: /nsmb Supplementary Figure 1
 Supplementary Figure 1 U1 inhibition causes a shift of RNA-seq reads from exons to introns. (a) Evidence for the high purity of 4-shU-labeled RNAs used for RNA-seq. HeLa cells transfected with control
Identification of Tissue Independent Cancer Driver Genes
 Identification of Tissue Independent Cancer Driver Genes Alexandros Manolakos, Idoia Ochoa, Kartik Venkat Supervisor: Olivier Gevaert Abstract Identification of genomic patterns in tumors is an important
Table of content. -Supplementary methods. -Figure S1. -Figure S2. -Figure S3. -Table legend
 Table of content -Supplementary methods -Figure S1 -Figure S2 -Figure S3 -Table legend Supplementary methods Yeast two-hybrid bait basal transactivation test Because bait constructs sometimes self-transactivate
PathAct: a novel method for pathway analysis using gene expression profiles
 www.bioinformation.net Hypothesis Volume 9(8) PathAct: a novel method for pathway analysis using gene expression profiles Kaoru Mogushi & Hiroshi Tanaka* Department of Bioinformatics, Division of Medical