Nature Genetics: doi: /ng Supplementary Figure 1. SEER data for male and female cancer incidence from
|
|
|
- Gabriel Scott
- 5 years ago
- Views:
Transcription
1 Supplementary Figure 1 SEER data for male and female cancer incidence from (a,b) Incidence rates of oral cavity and pharynx cancer (a) and leukemia (b) are plotted, grouped by males (blue), females (green), or all patients (black).
2 Supplementary Figure 2 Male and female mutation data across cancer types. (a) Ratio of female:male (F:M) coding mutations across all 4,126 cancers with exome sequencing by chromosome. The F:M ratio for the X chromosome is approximately double that for autosomes, as expected because females have two X chromosomes. On average, there are more mutations in male cancers than in female cancers across all chromosomes. This finding makes our approach to discover male-cancer-biased mutations on the X chromosome even more stringent because, to be enriched, they must be present at an M:F ratio that statistically exceeds the already male-biased background rate of mutation. (b) Female (red) and male (blue) somatic mutation rates (per Mb of DNA) by cancer type. Each dot represents one cancer sample. The horizontal bar represents the median number of mutations in female or male cancers. Numbers across the top of the graph are the number of tumor normal pairs in each disease. Disease acronym definitions are provided in Supplementary Table 1.
3 Supplementary Figure 3 Defining copy number loss events on the X chromosome. (a) The M:F ratio of copy number loss events (y axis) in a sliding window of different lengths over the genome (x axis). The blue line represents the cutoff chosen to define focal events (Online Methods). (b) Distribution of the log 2 (copy number) in tumor as compared to paired normal samples by genomic site on the X chromosome in males (top) and females (bottom). The red line represents the cutoff below which focal copy number loss was called. (c) Distribution of estimated X-chromosome ploidy across 10,844 tumors in the Broad Institute TCGA/GDAC data set ( as determined by SNP array (left). The red line represents the cutoff used to infer loss of the whole X chromosome in female tumors in our data set. Estimated X-chromosome copy numbers for female and male tumors in our data set with concurrent LOF or LOF/CN loss mutations are shown on the right.
4 Supplementary Figure 4 Genes with higher frequencies of loss-of-function mutations in male cancers identified by a log-likelihood ratio test. (a c) Log-likelihood ratios for genes on the X chromosome across all 4,126 cancers (a), in clear cell kidney cancer (KIRC) (b), and in lower-grade glioma (LGG) (c) are shown. The log 2 (M:F ratio) of patients with mutations is plotted against the significance value. The size and color of each circle represent the number of patients with loss-of-function mutations for each gene. Genes with FDR <0.1 for male-cancer-biased mutation are identified. ATRX is also shown, as it was identified as more frequent in male cancers by the permutation analysis (Table 1 and Fig. 2a).
5 Supplementary Figure 5 Male-biased mutations are more frequent among X-chromosome genes that escape X-inactivation or have functional Y- chromosome homologs. (a) M:F ratio (left; P = by t test; each bar represents the median; +, mean; box, interquartile range; whiskers, 10th 90th percentile) and scatterplot (right; P = by Komolgorov Smirnov (K S) test; each point represents the number of males versus the number of females with a mutation in that gene; the line represents linear regression fit) of putative loss-of-function SNV, indel, or copy number loss for 46 mutated X-chromosome genes that escape X-inactivation (Escape) and the remaining 595 mutated X-chromosome genes (Non-Escape). (b) M:F ratio (left; P = by t test; plot as in a) and scatterplot (right; P = by K S test) of putative LOF mutations as above for X-chromosome genes that do (Y homolog; n = 17) or do not (Non-Y homolog; n = 624) have predicted functional Y-chromosome homologs.
6 Supplementary Figure 6 Determination of Y-chromosome loss from exome sequencing data. The relative number of reads between tumor and normal samples for females (red) and males (blue) on the Y chromosome is shown. The large blue dots represent samples called as having loss of Y chromosome, on the basis of having <25% of the mean number of reads among males.
7
8 Supplementary Figure 7 Allele-specific expression of EXITS genes in TCGA tumors. Each dot represents the average minor allele expression fraction from RNA seq at heterozygous SNP sites detected in exome sequencing in known non-escape genes on the X chromosome or EXITS genes, in tumors without mutations in the indicated gene (red cross, mean; green square, median). Non-escape genes are the non-par X-chromosome genes not defined as stringent escape genes in Supplementary Table 8. Tumor types are as follows: GBM, glioblastoma; LGG, lower-grade glioma; HNSC, head and neck squamous cell carcinoma; KIRC, clear cell kidney cancer; LUAD, lung adenocarcinoma; LUSC, lung squamous cell carcinoma. Violin plots were generated using the distributionplot.m function in MATLAB with default parameters.
9
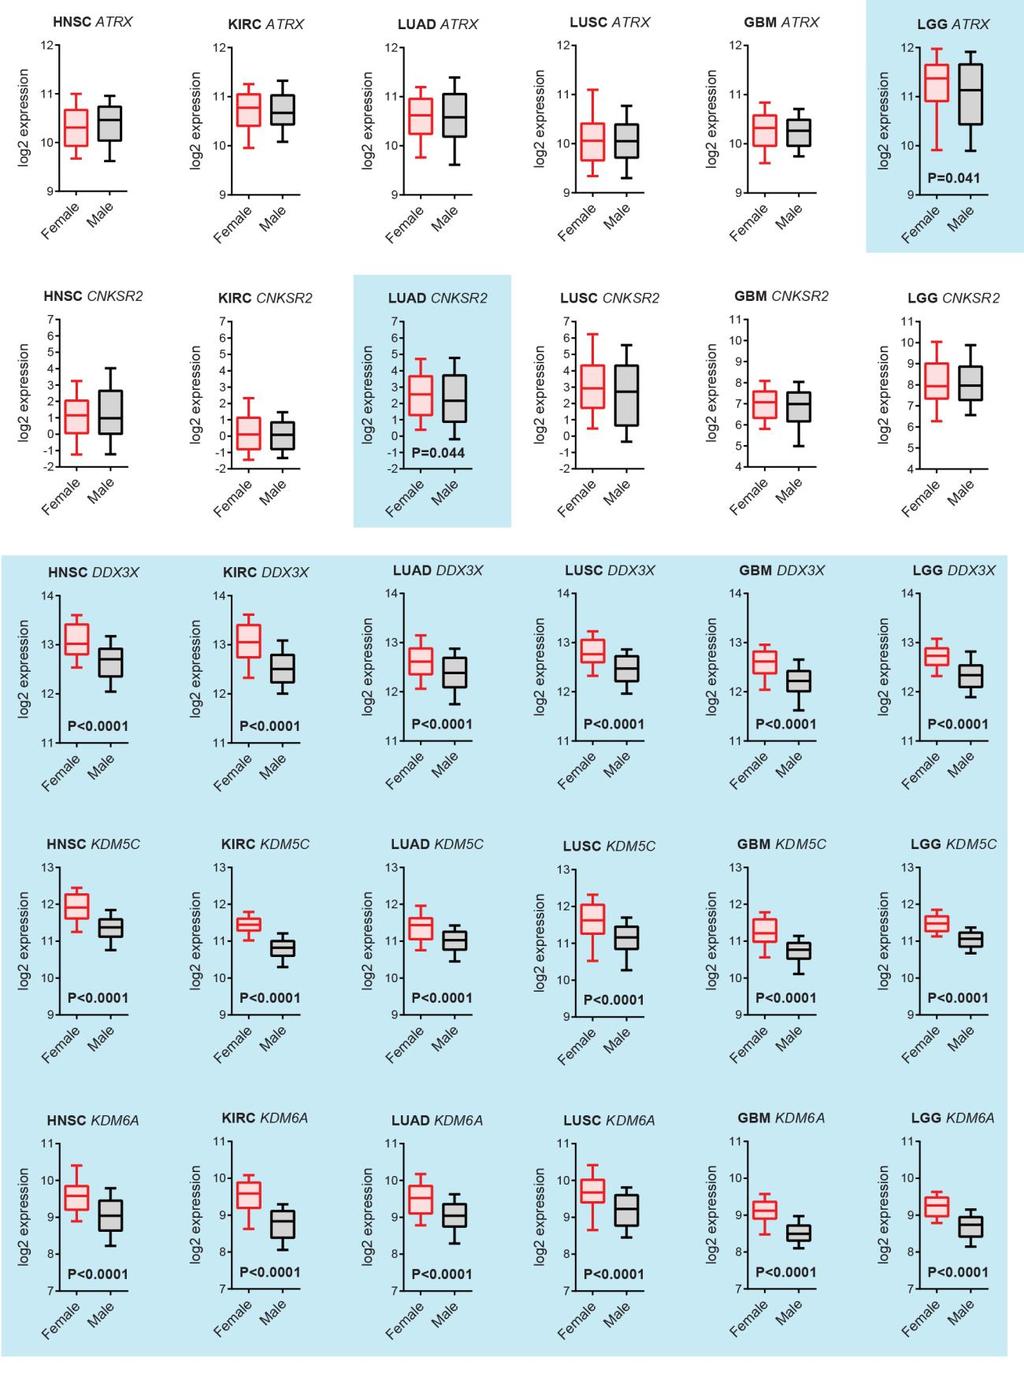
10 Supplementary Figure 8 Comparison of female and male expression levels of EXITS genes in non-mutated tumors. Female and male expression of ATRX, CNKSR2, DDX3X, KDM5C, and KDM6A in head and neck squamous cell carcinoma (HNSC), clear cell kidney cancer (KIRC), lung adenocarcinoma (LUAD), lung squamous cell carcinoma (LUSC), glioblastoma (GBM), and lowergrade glioma (LGG) are shown. Analysis is limited to tumors without mutations in the indicated genes. Each bar represents the median; box, interquartile range; whiskers, 10th 90th percentile. P values were calculated by K S test; comparisons with P < 0.05 are shaded in blue.

11 Supplementary Figure 9 Allele-specific expression of EXITS genes in female GTEx normal tissues. Each dot represents the average minor allele expression fraction from RNA seq at heterozygous SNP sites detected in exome sequencing in known non-escape genes on the X chromosome or EXITS genes, in a GTEx biopsy of the indicated normal tissue (red cross, mean; green square, median). Violin plots were generated using the distributionplot.m function in MATLAB with default parameters.
12 Supplementary Figure 10 ATRX expression in male and female tissues measured by RNA sequencing. (a) Expression of ATRX in normal male and female peripheral blood and brain in the GTEx data set is shown (distributions compared by Komolgorov Smirnov test). (b) Holzmann Volmer likelihood test of restricted (yellow) and unrestricted (transparent gray) normal mixture fits for males (left) and females (right). Top, maximum-likelihood fits with equal variance of the component mixtures; bottom, maximum-likelihood fits with unequal variance of the component mixtures. The P value of the Holzmann Vollmer likelihood-ratio test for bimodality is indicated. (c) Wilcoxon rank-sum test of significance P values for difference in EXITS gene expression between males and females in the indicated tissues in the GTEx data set.
13
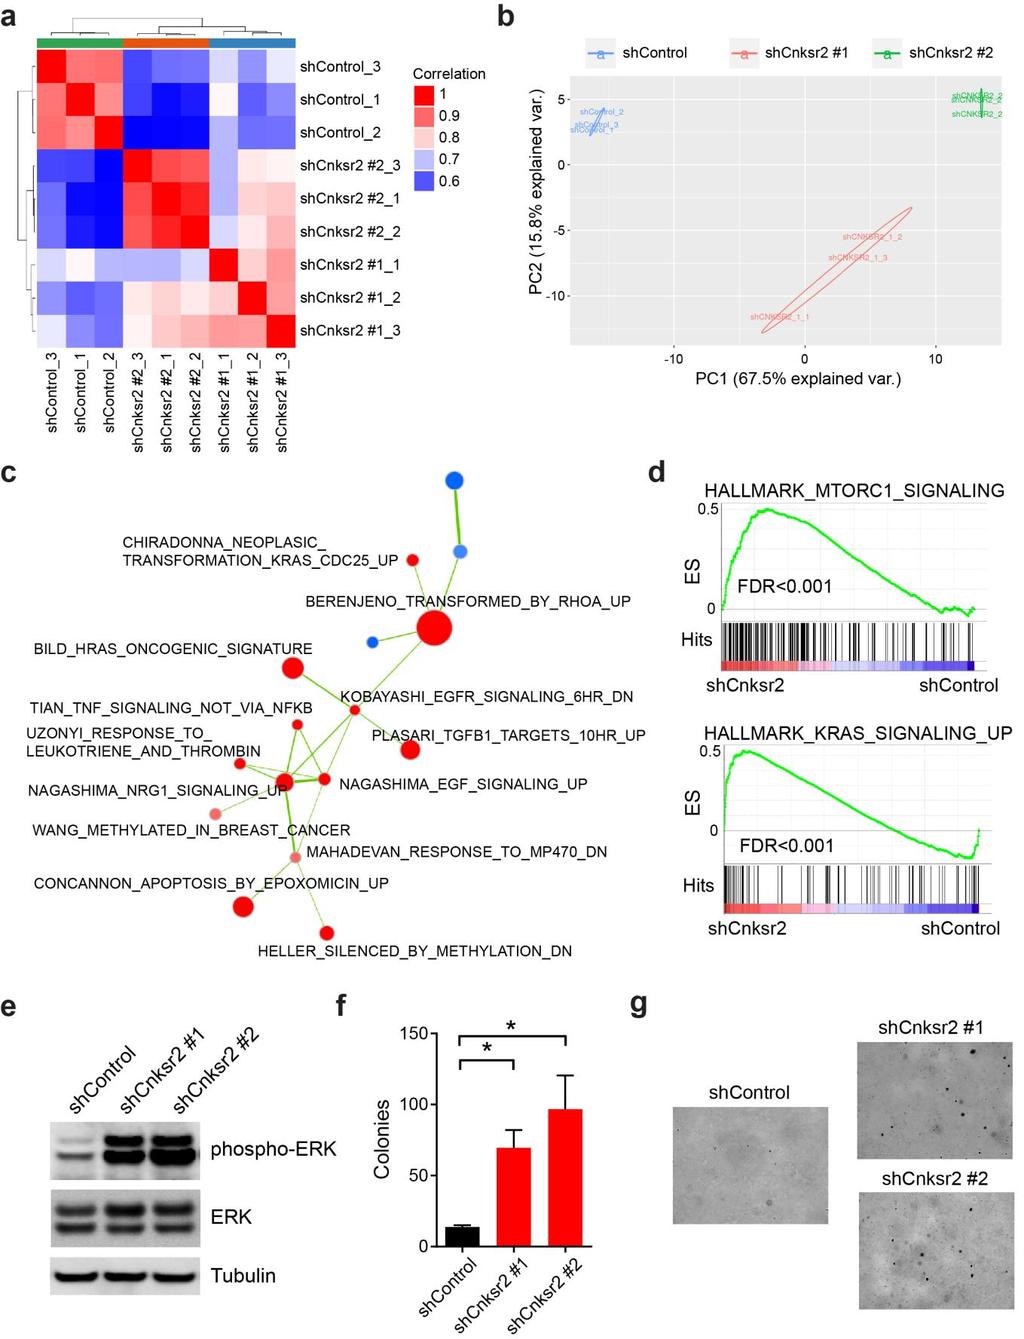
14 Supplementary Figure 11 Loss of Cnksr2 is associated with oncogenic phenotypes. (a) Unsupervised hierarchical clustering of Spearman rank correlations across nine biologically independent cultures of NIH 3T3 cells stably expressing lentiviruses with the indicated shrnas. Red blue color represents high low correlation, as shown in the legend. shcnksr2 1 and shcnksr2 2 are independent shrnas, each represented in three clones. shcontrol is a non-targeting shrna (targeting RFP, a control gene not present in these cells). (b) Principal-component analysis of expression profiles in the same cells as in a. (c) Network enrichment map of GSEA results querying the C2:CGP database of MSigDB, showing the interconnected cluster with the largest number of gene set members. Red circles are gene sets enriched in shcnksr2 cells and are labeled; blue circles are gene sets enriched in shcontrol cells. The size of each circle represents the number of genes in the gene set, and lines connect gene sets with overlapping members. (d) GSEA results querying the H1:Hallmarks database of MSigDB showing enrichment of MTORC1 and KRAS signaling pathways in shcnksr2 cells. ES, enrichment score. (e) Immunoblotting for phospho-erk, total ERK, or tubulin in NIH 3T3 cells stably expressing the indicated shrnas. (f) Automated counts of colonies per field of NIH 3T3 cells stably expressing the indicated shrnas grown in soft agar (each graph represents four fields counted in two independently transfected wells; *P < 0.05 by t test as compared to shrfp; error bars, s.e.m.). (g) Representative bright-field photomicrographs of the soft agar colony assays quantified in f.
Nature Getetics: doi: /ng.3471
 Supplementary Figure 1 Summary of exome sequencing data. ( a ) Exome tumor normal sample sizes for bladder cancer (BLCA), breast cancer (BRCA), carcinoid (CARC), chronic lymphocytic leukemia (CLLX), colorectal
Tumor suppressor genes that escape from X-inactivation contribute to cancer sex bias
 Tumor suppressor genes that escape from X-inactivation contribute to cancer sex bias The Harvard community has made this article openly available. Please share how this access benefits you. Your story
Supplementary Figure 1: LUMP Leukocytes unmethylabon to infer tumor purity
 Supplementary Figure 1: LUMP Leukocytes unmethylabon to infer tumor purity A Consistently unmethylated sites (30%) in 21 cancer types 174,696
SUPPLEMENTARY INFORMATION
 doi:10.1038/nature10866 a b 1 2 3 4 5 6 7 Match No Match 1 2 3 4 5 6 7 Turcan et al. Supplementary Fig.1 Concepts mapping H3K27 targets in EF CBX8 targets in EF H3K27 targets in ES SUZ12 targets in ES
Supplementary Materials for
 www.sciencetranslationalmedicine.org/cgi/content/full/7/283/283ra54/dc1 Supplementary Materials for Clonal status of actionable driver events and the timing of mutational processes in cancer evolution
Nature Immunology: doi: /ni Supplementary Figure 1. RNA-Seq analysis of CD8 + TILs and N-TILs.
 Supplementary Figure 1 RNA-Seq analysis of CD8 + TILs and N-TILs. (a) Schematic representation of the tumor and cell types used for the study. HNSCC, head and neck squamous cell cancer; NSCLC, non-small
Nature Genetics: doi: /ng Supplementary Figure 1. Workflow of CDR3 sequence assembly from RNA-seq data.
 Supplementary Figure 1 Workflow of CDR3 sequence assembly from RNA-seq data. Paired-end short-read RNA-seq data were mapped to human reference genome hg19, and unmapped reads in the TCR regions were extracted
Nature Genetics: doi: /ng Supplementary Figure 1. Phenotypic characterization of MES- and ADRN-type cells.
 Supplementary Figure 1 Phenotypic characterization of MES- and ADRN-type cells. (a) Bright-field images showing cellular morphology of MES-type (691-MES, 700-MES, 717-MES) and ADRN-type (691-ADRN, 700-
Supplementary Figures
 Supplementary Figures Supplementary Figure 1. Pan-cancer analysis of global and local DNA methylation variation a) Variations in global DNA methylation are shown as measured by averaging the genome-wide
OncoPPi Portal A Cancer Protein Interaction Network to Inform Therapeutic Strategies
 OncoPPi Portal A Cancer Protein Interaction Network to Inform Therapeutic Strategies 2017 Contents Datasets... 2 Protein-protein interaction dataset... 2 Set of known PPIs... 3 Domain-domain interactions...
Exploring TCGA Pan-Cancer Data at the UCSC Cancer Genomics Browser
 Exploring TCGA Pan-Cancer Data at the UCSC Cancer Genomics Browser Melissa S. Cline 1*, Brian Craft 1, Teresa Swatloski 1, Mary Goldman 1, Singer Ma 1, David Haussler 1, Jingchun Zhu 1 1 Center for Biomolecular
File Name: Supplementary Information Description: Supplementary Figures and Supplementary Tables. File Name: Peer Review File Description:
 File Name: Supplementary Information Description: Supplementary Figures and Supplementary Tables File Name: Peer Review File Description: Primer Name Sequence (5'-3') AT ( C) RT-PCR USP21 F 5'-TTCCCATGGCTCCTTCCACATGAT-3'
Nature Methods: doi: /nmeth.3115
 Supplementary Figure 1 Analysis of DNA methylation in a cancer cohort based on Infinium 450K data. RnBeads was used to rediscover a clinically distinct subgroup of glioblastoma patients characterized by
Expanded View Figures
 Molecular Systems iology Tumor CNs reflect metabolic selection Nicholas Graham et al Expanded View Figures Human primary tumors CN CN characterization by unsupervised PC Human Signature Human Signature
fl/+ KRas;Atg5 fl/+ KRas;Atg5 fl/fl KRas;Atg5 fl/fl KRas;Atg5 Supplementary Figure 1. Gene set enrichment analyses. (a) (b)
 (b)") KRas;At KRas;At KRas;At KRas;At a b Supplementary Figure 1. Gene set enrichment analyses. (a) GO gene sets (MSigDB v3. c5) enriched in KRas;Atg5 fl/+ as compared to KRas;Atg5 fl/fl tumors using gene set
KRas;At KRas;At KRas;At KRas;At a b Supplementary Figure 1. Gene set enrichment analyses. (a) GO gene sets (MSigDB v3. c5) enriched in KRas;Atg5 fl/+ as compared to KRas;Atg5 fl/fl tumors using gene set
Identification of Tissue Independent Cancer Driver Genes
 Identification of Tissue Independent Cancer Driver Genes Alexandros Manolakos, Idoia Ochoa, Kartik Venkat Supervisor: Olivier Gevaert Abstract Identification of genomic patterns in tumors is an important
Supplemental Figure legends
 Supplemental Figure legends Supplemental Figure S1 Frequently mutated genes. Frequently mutated genes (mutated in at least four patients) with information about mutation frequency, RNA-expression and copy-number.
Supplementary Figure 1: High-throughput profiling of survival after exposure to - radiation. (a) Cells were plated in at least 7 wells in a 384-well
 Cells were plated in at least 7 wells in a 384-well") Supplementary Figure 1: High-throughput profiling of survival after exposure to - radiation. (a) Cells were plated in at least 7 wells in a 384-well plate at cell densities ranging from 25-225 cells in
Supplementary Figure 1: High-throughput profiling of survival after exposure to - radiation. (a) Cells were plated in at least 7 wells in a 384-well plate at cell densities ranging from 25-225 cells in
User s Manual Version 1.0
 User s Manual Version 1.0 #639 Longmian Avenue, Jiangning District, Nanjing,211198,P.R.China. http://tcoa.cpu.edu.cn/ Contact us at xiaosheng.wang@cpu.edu.cn for technical issue and questions Catalogue
SUPPLEMENTARY FIGURES
 SUPPLEMENTARY FIGURES Figure S1. Clinical significance of ZNF322A overexpression in Caucasian lung cancer patients. (A) Representative immunohistochemistry images of ZNF322A protein expression in tissue
Nature Genetics: doi: /ng Supplementary Figure 1. HOX fusions enhance self-renewal capacity.
 Supplementary Figure 1 HOX fusions enhance self-renewal capacity. Mouse bone marrow was transduced with a retrovirus carrying one of three HOX fusion genes or the empty mcherry reporter construct as described
Expert-guided Visual Exploration (EVE) for patient stratification. Hamid Bolouri, Lue-Ping Zhao, Eric C. Holland
 for patient stratification. Hamid Bolouri, Lue-Ping Zhao, Eric C. Holland") Expert-guided Visual Exploration (EVE) for patient stratification Hamid Bolouri, Lue-Ping Zhao, Eric C. Holland Oncoscape.sttrcancer.org Paul Lisa Ken Jenny Desert Eric The challenge Given - patient clinical
Expert-guided Visual Exploration (EVE) for patient stratification Hamid Bolouri, Lue-Ping Zhao, Eric C. Holland Oncoscape.sttrcancer.org Paul Lisa Ken Jenny Desert Eric The challenge Given - patient clinical
Clustered mutations of oncogenes and tumor suppressors.
 Supplementary Figure 1 Clustered mutations of oncogenes and tumor suppressors. For each oncogene (red dots) and tumor suppressor (blue dots), the number of mutations found in an intramolecular cluster
Nature Genetics: doi: /ng Supplementary Figure 1. Somatic coding mutations identified by WES/WGS for 83 ATL cases.
 Supplementary Figure 1 Somatic coding mutations identified by WES/WGS for 83 ATL cases. (a) The percentage of targeted bases covered by at least 2, 10, 20 and 30 sequencing reads (top) and average read
Nature Genetics: doi: /ng.2995
 Supplementary Figure 1 Kaplan-Meier survival curves of patients with brainstem tumors. (a) Comparison of patients with PPM1D mutation versus wild-type PPM1D. (b) Comparison of patients with PPM1D mutation
Supplementary Figure 1: Features of IGLL5 Mutations in CLL: a) Representative IGV screenshot of first
 Representative IGV screenshot of first") Supplementary Figure 1: Features of IGLL5 Mutations in CLL: a) Representative IGV screenshot of first intron IGLL5 mutation depicting biallelic mutations. Red arrows highlight the presence of out of phase
Supplementary Figure 1: Features of IGLL5 Mutations in CLL: a) Representative IGV screenshot of first intron IGLL5 mutation depicting biallelic mutations. Red arrows highlight the presence of out of phase
Figure S2. Distribution of acgh probes on all ten chromosomes of the RIL M0022
 96 APPENDIX B. Supporting Information for chapter 4 "changes in genome content generated via segregation of non-allelic homologs" Figure S1. Potential de novo CNV probes and sizes of apparently de novo
Machine-Learning on Prediction of Inherited Genomic Susceptibility for 20 Major Cancers
 Machine-Learning on Prediction of Inherited Genomic Susceptibility for 20 Major Cancers Sung-Hou Kim University of California Berkeley, CA Global Bio Conference 2017 MFDS, Seoul, Korea June 28, 2017 Cancer
Supplementary Figure 1. Metabolic landscape of cancer discovery pipeline. RNAseq raw counts data of cancer and healthy tissue samples were downloaded
 Supplementary Figure 1. Metabolic landscape of cancer discovery pipeline. RNAseq raw counts data of cancer and healthy tissue samples were downloaded from TCGA and differentially expressed metabolic genes
Nature Immunology: doi: /ni Supplementary Figure 1. Transcriptional program of the TE and MP CD8 + T cell subsets.
 Supplementary Figure 1 Transcriptional program of the TE and MP CD8 + T cell subsets. (a) Comparison of gene expression of TE and MP CD8 + T cell subsets by microarray. Genes that are 1.5-fold upregulated
Nature Genetics: doi: /ng Supplementary Figure 1. Clinical timeline for the discovery WES cases.
 Supplementary Figure 1 Clinical timeline for the discovery WES cases. This illustrates the timeline of the disease events during the clinical course of each patient s disease, further indicating the available
EPIGENETIC RE-EXPRESSION OF HIF-2α SUPPRESSES SOFT TISSUE SARCOMA GROWTH
 EPIGENETIC RE-EXPRESSION OF HIF-2α SUPPRESSES SOFT TISSUE SARCOMA GROWTH Supplementary Figure 1. Supplementary Figure 1. Characterization of KP and KPH2 autochthonous UPS tumors. a) Genotyping of KPH2
Breeding scheme, transgenes, histological analysis and site distribution of SB-mutagenized osteosarcoma.
 Supplementary Figure 1 Breeding scheme, transgenes, histological analysis and site distribution of SB-mutagenized osteosarcoma. (a) Breeding scheme. R26-LSL-SB11 homozygous mice were bred to Trp53 LSL-R270H/+
Nature Neuroscience: doi: /nn Supplementary Figure 1
 Supplementary Figure 1 Illustration of the working of network-based SVM to confidently predict a new (and now confirmed) ASD gene. Gene CTNND2 s brain network neighborhood that enabled its prediction by
Supplementary Figures
 Supplementary Figures Supplementary Figure 1. Heatmap of GO terms for differentially expressed genes. The terms were hierarchically clustered using the GO term enrichment beta. Darker red, higher positive
Expanded View Figures
 EMO Molecular Medicine Proteomic map of squamous cell carcinomas Hanibal ohnenberger et al Expanded View Figures Figure EV1. Technical reproducibility. Pearson s correlation analysis of normalised SILC
SUPPLEMENTARY FIGURES: Supplementary Figure 1
 SUPPLEMENTARY FIGURES: Supplementary Figure 1 Supplementary Figure 1. Glioblastoma 5hmC quantified by paired BS and oxbs treated DNA hybridized to Infinium DNA methylation arrays. Workflow depicts analytic
Nature Genetics: doi: /ng Supplementary Figure 1. PCA for ancestry in SNV data.
 Supplementary Figure 1 PCA for ancestry in SNV data. (a) EIGENSTRAT principal-component analysis (PCA) of SNV genotype data on all samples. (b) PCA of only proband SNV genotype data. (c) PCA of SNV genotype
STATISTICS AND RESEARCH DESIGN
 Statistics 1 STATISTICS AND RESEARCH DESIGN These are subjects that are frequently confused. Both subjects often evoke student anxiety and avoidance. To further complicate matters, both areas appear have
Supplementary Information. Supplementary Figures
 Supplementary Information Supplementary Figures.8 57 essential gene density 2 1.5 LTR insert frequency diversity DEL.5 DUP.5 INV.5 TRA 1 2 3 4 5 1 2 3 4 1 2 Supplementary Figure 1. Locations and minor
Mosaic loss of chromosome Y in peripheral blood is associated with shorter survival and higher risk of cancer
 Supplementary Information Mosaic loss of chromosome Y in peripheral blood is associated with shorter survival and higher risk of cancer Lars A. Forsberg, Chiara Rasi, Niklas Malmqvist, Hanna Davies, Saichand
TCGA. The Cancer Genome Atlas
 TCGA The Cancer Genome Atlas TCGA: History and Goal History: Started in 2005 by the National Cancer Institute (NCI) and the National Human Genome Research Institute (NHGRI) with $110 Million to catalogue
Cancer Informatics Lecture
 Cancer Informatics Lecture Mayo-UIUC Computational Genomics Course June 22, 2018 Krishna Rani Kalari Ph.D. Associate Professor 2017 MFMER 3702274-1 Outline The Cancer Genome Atlas (TCGA) Genomic Data Commons
underlying metastasis and recurrence in HNSCC, we analyzed two groups of patients. The
 Supplementary Figures Figure S1. Patient cohorts and study design. To define and interrogate the genetic alterations underlying metastasis and recurrence in HNSCC, we analyzed two groups of patients. The
Introduction to Gene Sets Analysis
 Introduction to Svitlana Tyekucheva Dana-Farber Cancer Institute May 15, 2012 Introduction Various measurements: gene expression, copy number variation, methylation status, mutation profile, etc. Main
Supplementary Appendix
 Supplementary Appendix This appendix has been provided by the authors to give readers additional information about their work. Supplement to: Bredel M, Scholtens DM, Yadav AK, et al. NFKBIA deletion in
Supplementary Figure 1. Estimation of tumour content
 Supplementary Figure 1. Estimation of tumour content a, Approach used to estimate the tumour content in S13T1/T2, S6T1/T2, S3T1/T2 and S12T1/T2. Tissue and tumour areas were evaluated by two independent
Supplemental Figure S1. PLAG1 kidneys contain fewer glomeruli (A) Quantitative PCR for Igf2 and PLAG1 in whole kidneys taken from mice at E15.
 Quantitative PCR for Igf2 and PLAG1 in whole kidneys taken from mice at E15.") Supplemental Figure S1. PLAG1 kidneys contain fewer glomeruli (A) Quantitative PCR for Igf2 and PLAG1 in whole kidneys taken from mice at E15.5, E18.5, P4, and P8. Values shown are means from four technical
Supplemental Figure S1. PLAG1 kidneys contain fewer glomeruli (A) Quantitative PCR for Igf2 and PLAG1 in whole kidneys taken from mice at E15.5, E18.5, P4, and P8. Values shown are means from four technical
- 1 - Reviewers' comments: Reviewer #1 (Remarks to the Author):
:") Reviewers' comments: Reviewer #1 (Remarks to the Author): Summary: In this manuscript, the authors characterized cellular and transcriptional heterogeneity of breast cancer using single-cell RNA sequencing.
Reviewers' comments: Reviewer #1 (Remarks to the Author): Summary: In this manuscript, the authors characterized cellular and transcriptional heterogeneity of breast cancer using single-cell RNA sequencing.
Supplementary Figure 1
 Supplementary Figure 1 5 microns C7 B6 unclassified H19 C7 signal H19 guide signal H19 B6 signal C7 SNP spots H19 RNA spots B6 SNP spots colocalization H19 RNA classification Supplementary Figure 1. Allele-specific
DNA-seq Bioinformatics Analysis: Copy Number Variation
 DNA-seq Bioinformatics Analysis: Copy Number Variation Elodie Girard elodie.girard@curie.fr U900 institut Curie, INSERM, Mines ParisTech, PSL Research University Paris, France NGS Applications 5C HiC DNA-seq
a) List of KMTs targeted in the shrna screen. The official symbol, KMT designation,
 List of KMTs targeted in the shrna screen. The official symbol, KMT designation,") Supplementary Information Supplementary Figures Supplementary Figure 1. a) List of KMTs targeted in the shrna screen. The official symbol, KMT designation, gene ID and specifities are provided. Those highlighted
Supplementary Information Supplementary Figures Supplementary Figure 1. a) List of KMTs targeted in the shrna screen. The official symbol, KMT designation, gene ID and specifities are provided. Those highlighted
Session 4 Rebecca Poulos
 The Cancer Genome Atlas (TCGA) & International Cancer Genome Consortium (ICGC) Session 4 Rebecca Poulos Prince of Wales Clinical School Introductory bioinformatics for human genomics workshop, UNSW 20
gliomas. Fetal brain expected who each low-
 Supplementary Figure S1. Grade-specificity aberrant expression of HOXA genes in gliomas. (A) Representative RT-PCR analyses of HOXA gene expression in human astrocytomas. Exemplified glioma samples include
Relationship between genomic features and distributions of RS1 and RS3 rearrangements in breast cancer genomes.
 Supplementary Figure 1 Relationship between genomic features and distributions of RS1 and RS3 rearrangements in breast cancer genomes. (a,b) Values of coefficients associated with genomic features, separately
Supplementary. properties of. network types. randomly sampled. subsets (75%
 Supplementary Information Gene co-expression network analysis reveals common system-level prognostic genes across cancer types properties of Supplementary Figure 1 The robustness and overlap of prognostic
SSM signature genes are highly expressed in residual scar tissues after preoperative radiotherapy of rectal cancer.
 Supplementary Figure 1 SSM signature genes are highly expressed in residual scar tissues after preoperative radiotherapy of rectal cancer. Scatter plots comparing expression profiles of matched pretreatment
Supplementary Tables. Supplementary Figures
 Supplementary Files for Zehir, Benayed et al. Mutational Landscape of Metastatic Cancer Revealed from Prospective Clinical Sequencing of 10,000 Patients Supplementary Tables Supplementary Table 1: Sample
Nature Structural & Molecular Biology: doi: /nsmb.2419
 Supplementary Figure 1 Mapped sequence reads and nucleosome occupancies. (a) Distribution of sequencing reads on the mouse reference genome for chromosome 14 as an example. The number of reads in a 1 Mb
7SK ChIRP-seq is specifically RNA dependent and conserved between mice and humans.
 Supplementary Figure 1 7SK ChIRP-seq is specifically RNA dependent and conserved between mice and humans. Regions targeted by the Even and Odd ChIRP probes mapped to a secondary structure model 56 of the
Supplementary Materials for
 www.sciencemag.org/content/355/6332/eaai8478/suppl/dc1 Supplementary Materials for Decoupling genetics, lineages, and microenvironment in IDH-mutant gliomas by single-cell RNA-seq Andrew S. Venteicher,
Supplementary Figure 1. ALVAC-protein vaccines and macaque immunization. (A) Maximum likelihood
 Maximum likelihood") Supplementary Figure 1. ALVAC-protein vaccines and macaque immunization. (A) Maximum likelihood tree illustrating CRF01_AE gp120 protein sequence relationships between 107 Envs sampled in the RV144 trial
Supplementary Figure 1. ALVAC-protein vaccines and macaque immunization. (A) Maximum likelihood tree illustrating CRF01_AE gp120 protein sequence relationships between 107 Envs sampled in the RV144 trial
Nature Genetics: doi: /ng Supplementary Figure 1. Rates of different mutation types in CRC.
 Supplementary Figure 1 Rates of different mutation types in CRC. (a) Stratification by mutation type indicates that C>T mutations occur at a significantly greater rate than other types. (b) As for the
Supplementary Figure S1. Gene expression analysis of epidermal marker genes and TP63.
 Supplementary Figure Legends Supplementary Figure S1. Gene expression analysis of epidermal marker genes and TP63. A. Screenshot of the UCSC genome browser from normalized RNAPII and RNA-seq ChIP-seq data
Table of Contents. Plots. Essential Statistics for Nursing Research 1/12/2017
 Essential Statistics for Nursing Research Kristen Carlin, MPH Seattle Nursing Research Workshop January 30, 2017 Table of Contents Plots Descriptive statistics Sample size/power Correlations Hypothesis
Supplemental Figure 1. Genes showing ectopic H3K9 dimethylation in this study are DNA hypermethylated in Lister et al. study.
 mc mc mc mc SUP mc mc Supplemental Figure. Genes showing ectopic HK9 dimethylation in this study are DNA hypermethylated in Lister et al. study. Representative views of genes that gain HK9m marks in their
Nature Genetics: doi: /ng Supplementary Figure 1
 Supplementary Figure 1 Multiple samples from five patients (P4, P8, P14, P15 and P17) with Barrett s esophagus and adjacent EAC show that the poor overlap is not a result of sampling bias. Bar graphs showing
Supplemental Information. Integrated Genomic Analysis of the Ubiquitin. Pathway across Cancer Types
 Cell Reports, Volume 23 Supplemental Information Integrated Genomic Analysis of the Ubiquitin Pathway across Zhongqi Ge, Jake S. Leighton, Yumeng Wang, Xinxin Peng, Zhongyuan Chen, Hu Chen, Yutong Sun,
Supplemental Table 1 Molecular Profile of the SCLC Cell Line Panel
 Supplemental Table 1 Molecular Profile of the SCLC Cell Line Panel p53 RB Myc Cell Line Mutation A Mutation A Amplification B COR-L103 C p.y234c p.d584e L-Myc NCI-H526 p.s33_splice None N-Myc NCI-H1048
Frequency(%) KRAS G12 KRAS G13 KRAS A146 KRAS Q61 KRAS K117N PIK3CA H1047 PIK3CA E545 PIK3CA E542K PIK3CA Q546. EGFR exon19 NFS-indel EGFR L858R
 KRAS G12 KRAS G13 KRAS A146 KRAS Q61 KRAS K117N PIK3CA H1047 PIK3CA E545 PIK3CA E542K PIK3CA Q546. EGFR exon19 NFS-indel EGFR L858R") Frequency(%) 1 a b ALK FS-indel ALK R1Q HRAS Q61R HRAS G13R IDH R17K IDH R14Q MET exon14 SS-indel KIT D8Y KIT L76P KIT exon11 NFS-indel SMAD4 R361 IDH1 R13 CTNNB1 S37 CTNNB1 S4 AKT1 E17K ERBB D769H ERBB
Frequency(%) 1 a b ALK FS-indel ALK R1Q HRAS Q61R HRAS G13R IDH R17K IDH R14Q MET exon14 SS-indel KIT D8Y KIT L76P KIT exon11 NFS-indel SMAD4 R361 IDH1 R13 CTNNB1 S37 CTNNB1 S4 AKT1 E17K ERBB D769H ERBB
The 16th KJC Bioinformatics Symposium Integrative analysis identifies potential DNA methylation biomarkers for pan-cancer diagnosis and prognosis
 The 16th KJC Bioinformatics Symposium Integrative analysis identifies potential DNA methylation biomarkers for pan-cancer diagnosis and prognosis Tieliu Shi tlshi@bio.ecnu.edu.cn The Center for bioinformatics
Nature Genetics: doi: /ng Supplementary Figure 1. Mutational signatures in BCC compared to melanoma.
 Supplementary Figure 1 Mutational signatures in BCC compared to melanoma. (a) The effect of transcription-coupled repair as a function of gene expression in BCC. Tumor type specific gene expression levels
Supplementary Information
 Supplementary Information Guided Visual Exploration of Genomic Stratifications in Cancer Marc Streit 1,6, Alexander Lex 2,6, Samuel Gratzl¹, Christian Partl³, Dieter Schmalstieg³, Hanspeter Pfister², Peter
Expanded View Figures
 Solip Park & Ben Lehner Epistasis is cancer type specific Molecular Systems Biology Expanded View Figures A B G C D E F H Figure EV1. Epistatic interactions detected in a pan-cancer analysis and saturation
Supplementary Figure 1. Copy Number Alterations TP53 Mutation Type. C-class TP53 WT. TP53 mut. Nature Genetics: doi: /ng.
 Supplementary Figure a Copy Number Alterations in M-class b TP53 Mutation Type Recurrent Copy Number Alterations 8 6 4 2 TP53 WT TP53 mut TP53-mutated samples (%) 7 6 5 4 3 2 Missense Truncating M-class
Nature Genetics: doi: /ng Supplementary Figure 1. Country distribution of GME samples and designation of geographical subregions.
 Supplementary Figure 1 Country distribution of GME samples and designation of geographical subregions. GME samples collected across 20 countries and territories from the GME. Pie size corresponds to the
m 6 A mrna methylation regulates AKT activity to promote the proliferation and tumorigenicity of endometrial cancer
 SUPPLEMENTARY INFORMATION Articles https://doi.org/10.1038/s41556-018-0174-4 In the format provided by the authors and unedited. m 6 A mrna methylation regulates AKT activity to promote the proliferation
Nature Neuroscience: doi: /nn Supplementary Figure 1. Behavioral training.
 Supplementary Figure 1 Behavioral training. a, Mazes used for behavioral training. Asterisks indicate reward location. Only some example mazes are shown (for example, right choice and not left choice maze
Nature Immunology: doi: /ni Supplementary Figure 1. DNA-methylation machinery is essential for silencing of Cd4 in cytotoxic T cells.
 Supplementary Figure 1 DNA-methylation machinery is essential for silencing of Cd4 in cytotoxic T cells. (a) Scheme for the retroviral shrna screen. (b) Histogram showing CD4 expression (MFI) in WT cytotoxic
Whole Genome and Transcriptome Analysis of Anaplastic Meningioma. Patrick Tarpey Cancer Genome Project Wellcome Trust Sanger Institute
 Whole Genome and Transcriptome Analysis of Anaplastic Meningioma Patrick Tarpey Cancer Genome Project Wellcome Trust Sanger Institute Outline Anaplastic meningioma compared to other cancers Whole genomes
Plasma-Seq conducted with blood from male individuals without cancer.
 Supplementary Figures Supplementary Figure 1 Plasma-Seq conducted with blood from male individuals without cancer. Copy number patterns established from plasma samples of male individuals without cancer
Nature Genetics: doi: /ng Supplementary Figure 1. TCGA data set on HNSCCs reanalyzed in this study.
 Supplementary Figure 1 TCGA data set on HNSCCs reanalyzed in this study. Summary of the TCGA dataset on HNSCCs re-analyzed in this study and the respective numbers of samples available within each. Supplementary
Nature Neuroscience: doi: /nn Supplementary Figure 1. Lick response during the delayed Go versus No-Go task.
 Supplementary Figure 1 Lick response during the delayed Go versus No-Go task. Trial-averaged lick rate was averaged across all mice used for pyramidal cell imaging (n = 9). Different colors denote different
Supplementary Figure 1: Attenuation of association signals after conditioning for the lead SNP. a) attenuation of association signal at the 9p22.
 attenuation of association signal at the 9p22.") Supplementary Figure 1: Attenuation of association signals after conditioning for the lead SNP. a) attenuation of association signal at the 9p22.32 PCOS locus after conditioning for the lead SNP rs10993397;
Supplementary Figure 1: Attenuation of association signals after conditioning for the lead SNP. a) attenuation of association signal at the 9p22.32 PCOS locus after conditioning for the lead SNP rs10993397;
Supplementary Information Titles Journal: Nature Medicine
 Supplementary Information Titles Journal: Nature Medicine Article Title: Corresponding Author: Supplementary Item & Number Supplementary Fig.1 Fig.2 Fig.3 Fig.4 Fig.5 Fig.6 Fig.7 Fig.8 Fig.9 Fig. Fig.11
Nature Medicine: doi: /nm.3967
 Supplementary Figure 1. Network clustering. (a) Clustering performance as a function of inflation factor. The grey curve shows the median weighted Silhouette widths for varying inflation factors (f [1.6,
Supplementary Figure 1
 Supplementary Figure 1 Asymmetrical function of 5p and 3p arms of mir-181 and mir-30 families and mir-142 and mir-154. (a) Control experiments using mirna sensor vector and empty pri-mirna overexpression
Understandable Statistics
 Understandable Statistics correlated to the Advanced Placement Program Course Description for Statistics Prepared for Alabama CC2 6/2003 2003 Understandable Statistics 2003 correlated to the Advanced Placement
(a) Significant biological processes (upper panel) and disease biomarkers (lower panel)
 Significant biological processes (upper panel) and disease biomarkers (lower panel)") Supplementary Figure 1. Functional enrichment analyses of secretomic proteins. (a) Significant biological processes (upper panel) and disease biomarkers (lower panel) 2 involved by hrab37-mediated secretory
Supplementary Figure 1. Functional enrichment analyses of secretomic proteins. (a) Significant biological processes (upper panel) and disease biomarkers (lower panel) 2 involved by hrab37-mediated secretory
AD (Leave blank) TITLE: Genomic Characterization of Brain Metastasis in Non-Small Cell Lung Cancer Patients
 TITLE: Genomic Characterization of Brain Metastasis in Non-Small Cell Lung Cancer Patients") AD (Leave blank) Award Number: W81XWH-12-1-0444 TITLE: Genomic Characterization of Brain Metastasis in Non-Small Cell Lung Cancer Patients PRINCIPAL INVESTIGATOR: Mark A. Watson, MD PhD CONTRACTING ORGANIZATION:
AD (Leave blank) Award Number: W81XWH-12-1-0444 TITLE: Genomic Characterization of Brain Metastasis in Non-Small Cell Lung Cancer Patients PRINCIPAL INVESTIGATOR: Mark A. Watson, MD PhD CONTRACTING ORGANIZATION:
Genetics All somatic cells contain 23 pairs of chromosomes 22 pairs of autosomes 1 pair of sex chromosomes Genes contained in each pair of chromosomes
 Chapter 6 Genetics and Inheritance Lecture 1: Genetics and Patterns of Inheritance Asexual reproduction = daughter cells genetically identical to parent (clones) Sexual reproduction = offspring are genetic
Nature Neuroscience: doi: /nn Supplementary Figure 1. Missense damaging predictions as a function of allele frequency
 Supplementary Figure 1 Missense damaging predictions as a function of allele frequency Percentage of missense variants classified as damaging by eight different classifiers and a classifier consisting
Supplementary Figure 1
 Supplementary Figure 1 Supplementary Fig. 1: Quality assessment of formalin-fixed paraffin-embedded (FFPE)-derived DNA and nuclei. (a) Multiplex PCR analysis of unrepaired and repaired bulk FFPE gdna from
Global variation in copy number in the human genome
 Global variation in copy number in the human genome Redon et. al. Nature 444:444-454 (2006) 12.03.2007 Tarmo Puurand Study 270 individuals (HapMap collection) Affymetrix 500K Whole Genome TilePath (WGTP)
Session 4 Rebecca Poulos
 The Cancer Genome Atlas (TCGA) & International Cancer Genome Consortium (ICGC) Session 4 Rebecca Poulos Prince of Wales Clinical School Introductory bioinformatics for human genomics workshop, UNSW 28
Genetic alterations of histone lysine methyltransferases and their significance in breast cancer
 Genetic alterations of histone lysine methyltransferases and their significance in breast cancer Supplementary Materials and Methods Phylogenetic tree of the HMT superfamily The phylogeny outlined in the
SUPPLEMENTARY INFORMATION
 Supplementary text Collectively, we were able to detect ~14,000 expressed genes with RPKM (reads per kilobase per million) > 1 or ~16,000 with RPKM > 0.1 in at least one cell type from oocyte to the morula
Nature Structural and Molecular Biology: doi: /nsmb Supplementary Figure 1
 Supplementary Figure 1 Mutational analysis of the SA2-Scc1 interaction in vitro and in human cells. (a) Autoradiograph (top) and Coomassie stained gel (bottom) of 35 S-labeled Myc-SA2 proteins (input)
EXPression ANalyzer and DisplayER
 EXPression ANalyzer and DisplayER Tom Hait Aviv Steiner Igor Ulitsky Chaim Linhart Amos Tanay Seagull Shavit Rani Elkon Adi Maron-Katz Dorit Sagir Eyal David Roded Sharan Israel Steinfeld Yossi Shiloh
Lentiviral Delivery of Combinatorial mirna Expression Constructs Provides Efficient Target Gene Repression.
 Supplementary Figure 1 Lentiviral Delivery of Combinatorial mirna Expression Constructs Provides Efficient Target Gene Repression. a, Design for lentiviral combinatorial mirna expression and sensor constructs.