SUPPLEMENTARY RESULTS
|
|
|
- Lesley Ward
- 5 years ago
- Views:
Transcription
1 SUPPLEMENTARY RESULTS Supplementary Table 1. hfpr1- Flpln-CHO hfpr2-flpln-cho pec 50 E max (%) Log( /K A) Log( /K A) N pec 50 E max (%) Log( /K A) Log( /K A) n ERK1/2 phosphorylation fmlp 9.0±0.6 80±7 9.6± ± ±0.1 68±11 5.4± ±0.2 4 Cmpd17b 6.1±0.2** 82±6 6.0± ±0.2^^^ 6 5.4±0.4 66±18 5.8± ±0.3^^ 4 Cmpd43 7.2±0.2*** 61±9 7.3± ±0.4** # 95±4 7.7± Akt 1/2/3 (Thr308) phosphorylation fmlp 8.9±0.3 18±4 8.8± ± ±0.2 21±2 4.8± ±0.3 5 Cmpd17b 5.7±0.2**** 24±6 6.0± ±0.2^^ 5 4.8±0.1 21±3 5.1± ±0.2^^ 5 Cmpd43 6.9±0.3** # 15±4 6.9± ±0.2** # 27±2 7.0± Akt 1/2/3 (Ser473) phosphorylation fmlp 9.0±0.5 16±4 9.0± ± ±0.1 20±4 4.9± ±0.2 5 Cmpd17b 5.8±0.2**** 18±7 5.7± ±0.3^^ 5 5.0±0.1 20±3 5.1± ±0.2^^^ 5 Cmpd43 7.1±0.3** # 13±3 6.9± ±0.3** # 30±6 6.9± [Ca 2+ ] i mobilization fmlp 9.0±0.2 38±6 9.4± ± ±0.1 38±4 5.4± ±0.3 3 Cmpd17b 5.8±0.2**** 31±4 5.5± ± ±0.1 16±2*** 4.3± ±0.3 4 Cmpd43 8.0±0.2** ### 43±6 8.0± ±0.3** ### 51±3* #### 7. 7± Inhibition of camp accumulation fmlp 7.3±0.0 28±12 8.6± ± ±0.5 10±8 4.9± ±0.2 4 Cmpd17b 6.3±0.2 12±10 5.8± ±0.6^^ 4 4.9±0.1 47±6** 5.1± ±0.2^^^ 4 Cmpd43 7.1±0.4 27±20 7.1± ±0.1* ## 66±6*** 6.5± FPR agonist potency (pec 50), maximal agonist response (E max), transduction coefficient (Log( /K A)), and normalized transduction coefficient ( Log( /K A)) for phosphorylation of ERK1/2, Akt1/2/3(Thr308), Akt1/2/3(Ser473), intracellular Ca 2+ mobilization and inhibition of camp 1
2 accumulation in CHO cells stably expressing hfpr1 or hfpr2. Data represents percent of the mean±sem of response elicited by 10% FBS (phosphorylation), ATP (Ca 2+ mobilization) or inhibition of forskolin-induced camp accumulation, from 3-7 experiments performed in triplicate, n indicates number of independent experiments. **p<0.01, ****p< vs. fmlp; ### p<0.001, #### p< vs Cmpd17b, ^^p<0.01, ^^^p<0.001 vs Log( /K A) estimated for the corresponding agonist at intracellular Ca 2+ mobilization, one-way ANOVA followed by Tukey s post-hoc test. 2
3 Supplementary Table 2. Sham I-R I-R+ Cmpd17b I-R+Cmpd43 48 h myocardial I-R n Body Weight (BW, g) 27±1 29±1 28±1 27±1 Organ weight:bw (mg per g) heart 4.2± ±0.2 # 5.2±0.3 # 4.8±0.3 atria 0.3± ± ± ±0.1 LV 3.1± ± ± ±0.2 RV 0.8± ± ± ±0.0 lung 5.2± ± ± ±0.1 7 d myocardial I-R n BW (g) 26±1 26±1 24±1 24±1 Organ weight:bw (mg per g) heart 4.6± ± ±0.1* 5.0±0.2 Atria 0.2± ±0.0 # 0.3± ±0.0 LV 3.3± ± ±0.1* 3.7±0.1 RV 0.8± ± ± ±0.1 lung 5.8± ± ± ±0.3 Impact of I-R in the presence and absence of Cmpd17b and Cmpd43 treatment on body and organ weights 48h and 7 days following I-R injury. # P<0.05 vs sham and *P<0.05 vs vehicletreated I-R mice. One-way ANOVA with Tukey s post-hoc test. Data were represented as mean±sem, n indicates number of mice. 3
4 Supplementary Table 3. Sham MI MI+Cmpd17b n Body Weight (BW, g) 29.7± ±0.5 # 28.0±0.7 Organ weight:bw (mg per g) heart 4.5± ±0.3 #### 5.4±0.1 ## atria 0.3± ±0.0 #### 0.4±0.0 ## LV 3.3± ±0.1 #### 4.0±0.1 ### RV 0.8± ± ±0.0 lung 3.3± ±0.1 #### 4.0±0.1 ### * Echocardiographic analysis Sham MI MI+Cmpd17b HR (beats per min) 616±14 568±19 598±14 LVEDD (mm) 3.9± ±0.1 # 4.6±0.1 # LVESD (mm) 2.2± ±0.1 ### 3.0±0.2 ## LVPW (mm) 1.3± ± ±0.0* Impact of MI in the presence and absence of Cmpd17b on endpoint body and organ weights, as well as echocardiographic parameters of LV function in anesthetized mice at study endpoint, 4 weeks following permanent LAD occlusion. LVEDD, LV end-diastolic dimension; LVESD, LV end-systolic dimension; LVPW, LV posterior wall; # P<0.05 vs sham and *P<0.05 vs vehicle-treated MI mice. One-way ANOVA with Tukey s post-hoc test. Data were represented as mean±sem, n indicates number of mice. 4
5 Supplementary Table 4. Forward primer Reverse primer 18S TGTTCACCATGAGGCTGAGATC TGG TTG CCT GGG AAA ATC C mβ-mhc TCT CCT GCT GTT TCC TTA CTT GCT A GTA CTC CTC TGC TGA GGC TTC CT mctgf TGA CCC CTG CGA CCC ACA TAC ACC GAC CCA CCG AAG ACA CAG mtgfβ TGGAGCAACATGTGGAACTC GTCAGCAGCCGGTTACCA mil-1β TTGACGGACCCCAAAAGAT GAAGCTGGATGCTCTCATCCTG mfpr1 CCTTGGCTTTCTTCAACAGC GCCCGTTCTTTACATTGC AT mfpr2 ACA GCA GTT GTG GCT TCCTT CCT GGC CCA TGA AAA CAT AG mcd68 CCAATTCAGGGTGGAAGAAA CTCGGGCTCTGATGTAGGTC mtnfα CTG TAG CCC ACG TCG TAG C TTG AGA TCC ATG CCG TTG 5-3 primer sequences used for gene expression by qrt-pcr. 5
6 Supplementary Table 5. FPR1 FPR2 FPR3 Gateway entry vector 5 Stop in gateway entry vector 3 ggggacaagtttgtacaaaaaagcaggctt ccaccatggagacaaattcct CTCTCCCCACG ggggacaagtttgtacaaaaaagcaggctt ccaccatggaaaccaacttct CCACTCC ggggacaagtttgtacaaaaaagcaggctt ccaccatggaaaccaacttct CCATTC ggggaccactttgtacaagaaagctgggtctcactttg CCTGTAACTCCACCTCTGC ggggaccactttgtacaagaaagctgggtctcacattg CCTGTAACTCAGTCTCTGC ggggaccactttgtacaagaaagctgggtctcacattg CTTGTAACTCCGTCTCCTC Gateway entry vector used for generating the hfpr cell line. The capital letters reflect the FPR sequence whereas the small letters are the gateway entry vector sequence required to insert the gene into the gateway entry vector plasmid. 6
7 Supplementary Figures Cmpd17b Molecular weight: Cmpd43 Molecular weight: Supplementary Figure 1. Chemical structures of small molecule FPR agonists N-(4-bromophenyl)-2-[5-(3-methoxybenzyl)-3-methyl-6-oxo- 6H-pyridazin-1-yl]-propionamide, identified as compound-17b (Cmpd17b) and the Amgen pyrazolone derivative, identified as compound-43 (Cmpd43). 7
8 8
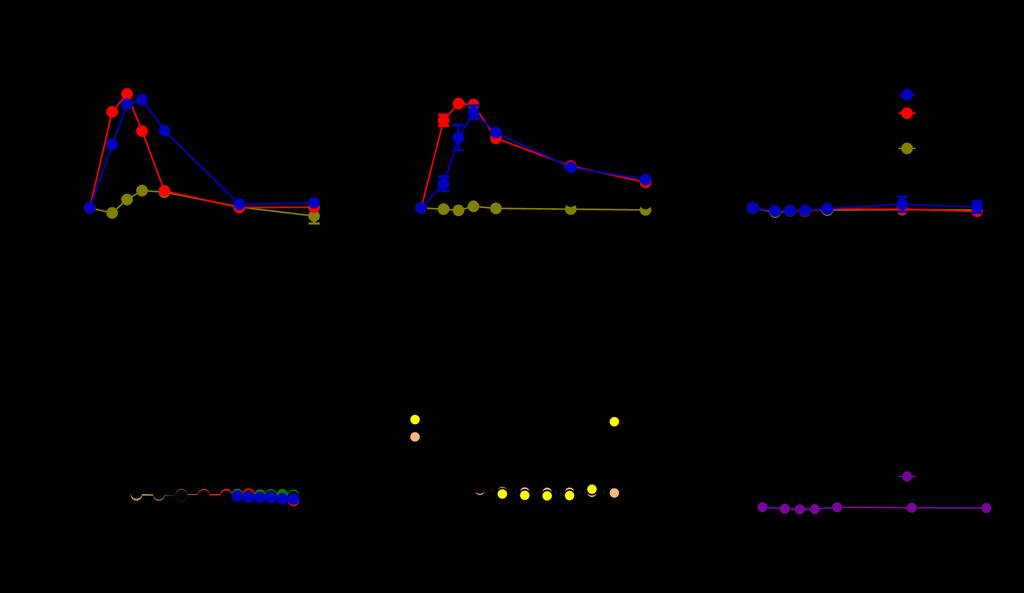
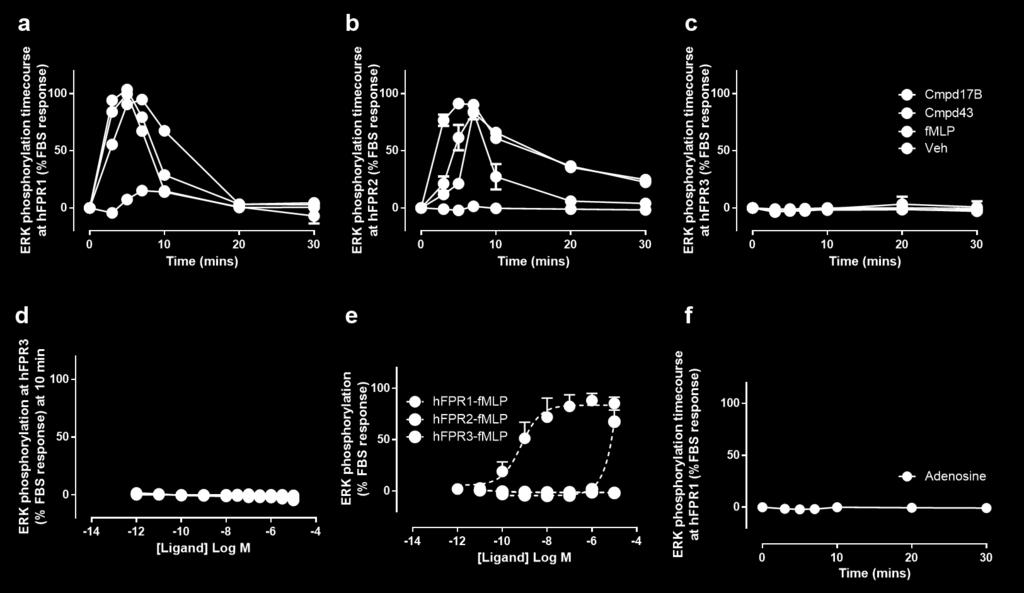
9 Supplementary Figure 2. ERK1/2 phosphorylation in hfpr-cho cells. Time-course of ERK1/2 phosphorylation in response to fmlp, Cmpd17b, and Cmpd43 (each 10 µm, n=4 separate experiments) in a hfpr1-cho, b hfpr2-cho and c FPR3-CHO cells. d Concentrationresponse curves for each FPR agonist in hfpr3-cho cells (results expressed as mean ± S.E.M. of 3-4 experiments each performed in triplicate). For panels a-d, fmlp (black symbols); Cmpd17b (blue symbols); Cmpd43 (red symbols); 10%DMSO vehicle (brown symbols). e Concentration-response curves to fmlp (dotted lines; hfpr1, hfpr2 and hfpr3 in black, yellow and beige respectively) on ERK1/2 phosphorylation in hfpr subtypes. f Concentration-response curves to the GPCR agonist adenosine in hfpr1-cho cells on ERK1/2 phosphorylation (results expressed as mean ± S.E.M. of 3 experiments each performed in triplicate). 9
10 10
11 Supplementary Figure 3. Cardiomyocyte expression of Fprs in vitro. a Relative expression of rat Fprs (rfpr1, rfpr2 and rfpr3 shown in green, yellow and beige bars, respectively), in untreated NRCM determined via real-time PCR (expressed as the threshold cycle number Ct subtracted from the maximum cycle number utilized, 40). Impact of 48 h incubation with Cmpd17b (blue symbols, 1 μm) and Cmpd43 (red symbols, 1 μm) on NRCM expression of b rfpr1 and c rfpr2, expressed as fold change vs vehicle-treated cells (black symbols). d Relative expression of mouse Fprs (mfpr1,mfpr2 and mfpr3, shown in green, yellow and beige bars, respectively) in AMCF determined via real-time PCR. Impact of 24 h incubation with TGF-β (black symbols) ± Cmpd17b (blue symbols, 10 μm) and Cmpd43 (red symbols, 10 μm) on AMCF expression of e mfpr1 and F mfpr2, fold vehicle-treated cells (open symbols). # P<0.05, ## P<0.01, ### P<0.001 and #### P< vs vehicle, *P<0.05 vs TGF-β, One-way ANOVA with Tukey s post-hoc test. Data represented as mean ± S.E.M. (n per number of separate experiments indicated below x-axis). 11
 treatment groups.")
12 Supplementary Figure 4. Impact of FPR agonist Cmpd17b on cardiac necrosis 24 h after I-R in vivo. Transverse LV slices obtained from one representative mouse per group, subjected to 40 min ischemia followed by 24 h reperfusion, in the vehicle, Cmpd17b or Cmpd43 (both 50 mg per kg i.p.) treatment groups. Three different zones were visible after staining with Evans blue and TTC. The areas stained dark blue, white and red represented non-risk zones, infarct zones and ischemic but non-infarcted zones, respectively. The risk zone was calculated as a percentage of red plus the white area over the total LV. 12
13 13
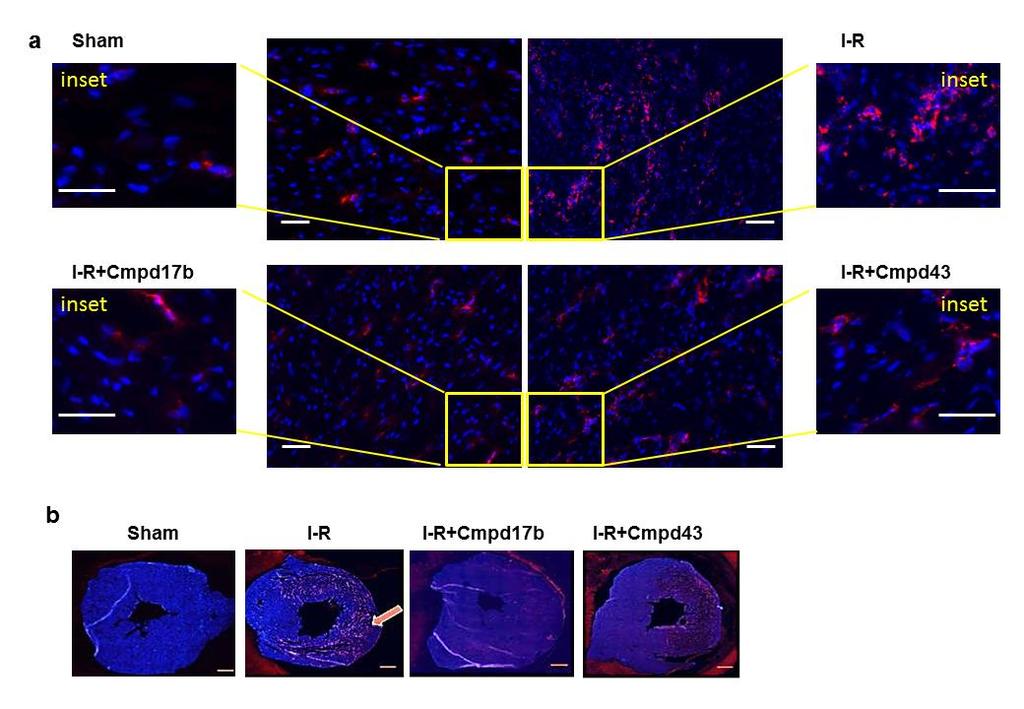
14 Supplementary Figure 5. Impact of FPR agonist Cmpd17b on cardiac neutrophil content 48 h after I-R in vivo. a Representative immunofluorescent images of LV neutrophil content, from sham, vehicle, and FPR agonist treated (Cmpd17b or Cmpd43, both 50 mg per kg per day, i.p.) mice, 48 h post I-R, detected using an anti-ly6b.2 antibody at 40x magnification; inset highlights the area at risk (one representative mouse per group, scale bars: 100 µm). b Representative immunofluorescent images of LV neutrophil content 48 h post I-R, depicting stitched 9x9 single images under 20x magnification (one representative mouse per group, scale bars: 500 µm). Arrow indicates infarct region. 14
15 15
16 Supplementary Figure 6. Impact of FPR agonist Cmpd17b on cardiac macrophage content 48 h after I-R in vivo. a Representative immunofluorescent images of LV macrophage content, from sham, vehicle, and FPR agonist treated (Cmpd17b or Cmpd43, both 50 mg per kg per day, i.p.) mice, 48 h post I-R, detected using an anti-cd68+ antibody at 40x magnification; inset highlights the area at risk (one representative mouse per group, scale bars: 100 µm). b Representative immunofluorescent images of LV macrophage content 48h post I-R, depicting stitched 9x9 single images under 20x magnification (scale bars: 500 µm; arrow indicates infarct region, one representative mouse per group). c Pooled data for LV CD68-positive immunofluorescence (determined from images under 40x magnification), from sham (open symbols), vehicle- (black symbols), and FPR agonist-treated (Cmpd17b or Cmpd43, both 50 mg per kg per day, i.p.; blue and red symbols, respectively) mice, 48 h post I-R. Results are expressed as mean ± S.E.M., with n per group indicated. ## P<0.01 and #### P< vs sham mice on one-way ANOVA with Tukey s post-hoc test. 16
17 17
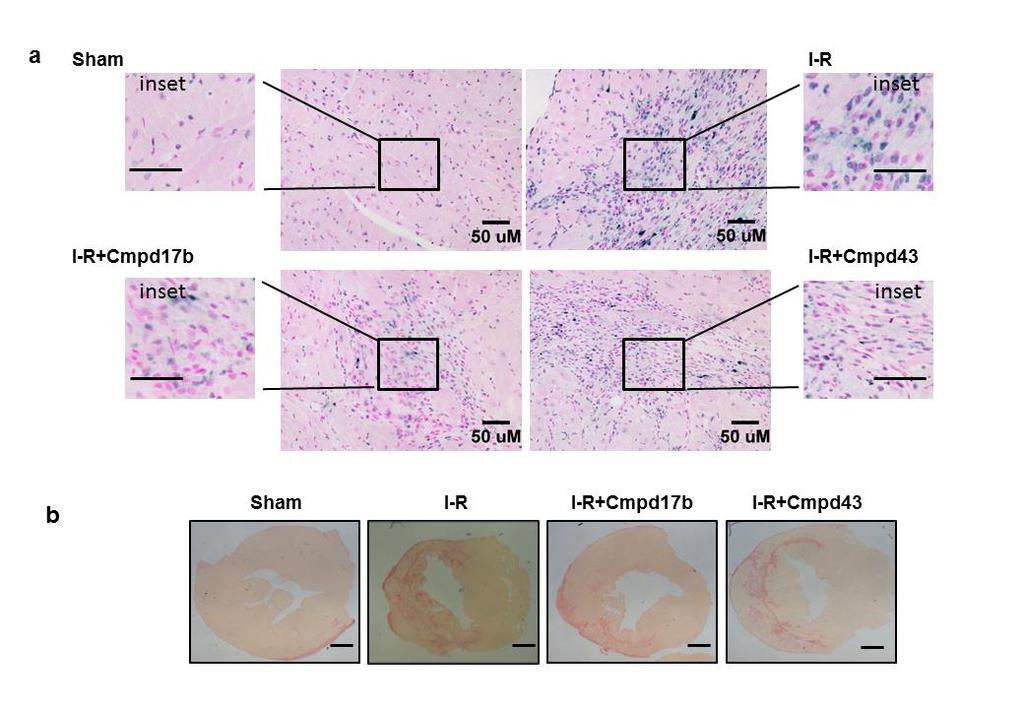
18 Supplementary Figure 7. Impact of FPR agonist Cmpd17b on cardiac injury 7-days after I-R in vivo. a Higher magnification (200x) representative CardioTAC-stained LV sections showing dead:viable cells from sham, vehicle- and FPR agonist (Cmpd17b or Cmpd43, both 50 mg per kg per day i.p.)-treated mice, 7 d post I-R (one representative mouse per group; scale bars: 100 µm). Inset highlights a region within the area at risk. b Representative picrosirius red-stained LV collagen cross-sections from sham, vehicle and FPR agonist (Cmpd17b or Cmpd43, both 50 mg per kg per day i.p.) treated mice, 7 d post I-R. Scale bars: 500 µm (magnification x12.5, one representative mouse per group. 18

 transduction coefficient")


19 Supplementary Figure 8. To quantify signalling bias, agonist concentration response curves were analysed by nonlinear regression using an operational model of agonism to define the Log( /KA) transduction coefficient for each agonist for each pathway, where Em is the maximal system response, KA denotes the functional equilibrium dissociation constant of the agonist for the receptor, and the efficiency of coupling of the receptor its subsequent cellular stimulus-response transduction mechanism, as previously described. 19
Supplementary Table 3. 3 UTR primer sequences. Primer sequences used to amplify and clone the 3 UTR of each indicated gene are listed.
 Supplemental Figure 1. DLKI-DIO3 mirna/mrna complementarity. Complementarity between the indicated DLK1-DIO3 cluster mirnas and the UTR of SOX2, SOX9, HIF1A, ZEB1, ZEB2, STAT3 and CDH1with mirsvr and PhastCons
a) Primary cultures derived from the pancreas of an 11-week-old Pdx1-Cre; K-MADM-p53
 Primary cultures derived from the pancreas of an 11-week-old Pdx1-Cre; K-MADM-p53") 1 2 3 4 5 6 7 8 9 10 Supplementary Figure 1. Induction of p53 LOH by MADM. a) Primary cultures derived from the pancreas of an 11-week-old Pdx1-Cre; K-MADM-p53 mouse revealed increased p53 KO/KO (green,
1 2 3 4 5 6 7 8 9 10 Supplementary Figure 1. Induction of p53 LOH by MADM. a) Primary cultures derived from the pancreas of an 11-week-old Pdx1-Cre; K-MADM-p53 mouse revealed increased p53 KO/KO (green,
Supplementary Materials
 Supplementary Materials 1 Supplementary Table 1. List of primers used for quantitative PCR analysis. Gene name Gene symbol Accession IDs Sequence range Product Primer sequences size (bp) β-actin Actb gi
CD31 5'-AGA GAC GGT CTT GTC GCA GT-3' 5 ' -TAC TGG GCT TCG AGA GCA GT-3'
 Table S1. The primer sets used for real-time RT-PCR analysis. Gene Forward Reverse VEGF PDGFB TGF-β MCP-1 5'-GTT GCA GCA TGA ATC TGA GG-3' 5'-GGA GAC TCT TCG AGG AGC ACT T-3' 5'-GAA TCA GGC ATC GAG AGA
c Tuj1(-) apoptotic live 1 DIV 2 DIV 1 DIV 2 DIV Tuj1(+) Tuj1/GFP/DAPI Tuj1 DAPI GFP
 apoptotic live 1 DIV 2 DIV 1 DIV 2 DIV Tuj1(+) Tuj1/GFP/DAPI Tuj1 DAPI GFP") Supplementary Figure 1 Establishment of the gain- and loss-of-function experiments and cell survival assays. a Relative expression of mature mir-484 30 20 10 0 **** **** NCP mir- 484P NCP mir- 484P b Relative
Supplementary Figure 1 Establishment of the gain- and loss-of-function experiments and cell survival assays. a Relative expression of mature mir-484 30 20 10 0 **** **** NCP mir- 484P NCP mir- 484P b Relative
Supplemental Data. Shin et al. Plant Cell. (2012) /tpc YFP N
 /tpc YFP N") MYC YFP N PIF5 YFP C N-TIC TIC Supplemental Data. Shin et al. Plant Cell. ()..5/tpc..95 Supplemental Figure. TIC interacts with MYC in the nucleus. Bimolecular fluorescence complementation assay using
MYC YFP N PIF5 YFP C N-TIC TIC Supplemental Data. Shin et al. Plant Cell. ()..5/tpc..95 Supplemental Figure. TIC interacts with MYC in the nucleus. Bimolecular fluorescence complementation assay using
Nature Structural & Molecular Biology: doi: /nsmb Supplementary Figure 1
 Supplementary Figure 1 U1 inhibition causes a shift of RNA-seq reads from exons to introns. (a) Evidence for the high purity of 4-shU-labeled RNAs used for RNA-seq. HeLa cells transfected with control
Abbreviations: P- paraffin-embedded section; C, cryosection; Bio-SA, biotin-streptavidin-conjugated fluorescein amplification.
 Supplementary Table 1. Sequence of primers for real time PCR. Gene Forward primer Reverse primer S25 5 -GTG GTC CAC ACT ACT CTC TGA GTT TC-3 5 - GAC TTT CCG GCA TCC TTC TTC-3 Mafa cds 5 -CTT CAG CAA GGA
Supplementary Figure 1 a
 Supplementary Figure a Normalized expression/tbp (A.U.).6... Trip-br transcripts Trans Trans Trans b..5. Trip-br Ctrl LPS Normalized expression/tbp (A.U.) c Trip-br transcripts. adipocytes.... Trans Trans
Figure S1. Analysis of genomic and cdna sequences of the targeted regions in WT-KI and
 Figure S1. Analysis of genomic and sequences of the targeted regions in and indicated mutant KI cells, with WT and corresponding mutant sequences underlined. (A) cells; (B) K21E-KI cells; (C) D33A-KI cells;
Supplementary Document
 Supplementary Document 1. Supplementary Table legends 2. Supplementary Figure legends 3. Supplementary Tables 4. Supplementary Figures 5. Supplementary References 1. Supplementary Table legends Suppl.
Supplementary Figure 1 MicroRNA expression in human synovial fibroblasts from different locations. MicroRNA, which were identified by RNAseq as most
 Supplementary Figure 1 MicroRNA expression in human synovial fibroblasts from different locations. MicroRNA, which were identified by RNAseq as most differentially expressed between human synovial fibroblasts
Supplementary Appendix
 Supplementary Appendix This appendix has been provided by the authors to give readers additional information about their work. Supplement to: Sherman SI, Wirth LJ, Droz J-P, et al. Motesanib diphosphate
Supplementary Figure 1. ROS induces rapid Sod1 nuclear localization in a dosagedependent manner. WT yeast cells (SZy1051) were treated with 4NQO at
 were treated with 4NQO at") Supplementary Figure 1. ROS induces rapid Sod1 nuclear localization in a dosagedependent manner. WT yeast cells (SZy1051) were treated with 4NQO at different concentrations for 30 min and analyzed for
Supplementary Figure 1. ROS induces rapid Sod1 nuclear localization in a dosagedependent manner. WT yeast cells (SZy1051) were treated with 4NQO at different concentrations for 30 min and analyzed for
Toluidin-Staining of mast cells Ear tissue was fixed with Carnoy (60% ethanol, 30% chloroform, 10% acetic acid) overnight at 4 C, afterwards
 overnight at 4 C, afterwards") Toluidin-Staining of mast cells Ear tissue was fixed with Carnoy (60% ethanol, 30% chloroform, 10% acetic acid) overnight at 4 C, afterwards incubated in 100 % ethanol overnight at 4 C and embedded in
Toluidin-Staining of mast cells Ear tissue was fixed with Carnoy (60% ethanol, 30% chloroform, 10% acetic acid) overnight at 4 C, afterwards incubated in 100 % ethanol overnight at 4 C and embedded in
SUPPLEMENTARY DATA. Supplementary Table 1. Primer sequences for qrt-pcr
 Supplementary Table 1. Primer sequences for qrt-pcr Gene PRDM16 UCP1 PGC1α Dio2 Elovl3 Cidea Cox8b PPARγ AP2 mttfam CyCs Nampt NRF1 16s-rRNA Hexokinase 2, intron 9 β-actin Primer Sequences 5'-CCA CCA GCG
Supplementary Table 2. Conserved regulatory elements in the promoters of CD36.
 Supplementary Table 1. RT-qPCR primers for CD3, PPARg and CEBP. Assay Forward Primer Reverse Primer 1A CAT TTG TGG CCT TGT GCT CTT TGA TGA GTC ACA GAA AGA ATC AAT TC 1B AGG AAA TGA ACT GAT GAG TCA CAG
Supplementary Figures
 Supplementary Figures Supplementary Figure 1. H3F3B expression in lung cancer. a. Comparison of H3F3B expression in relapsed and non-relapsed lung cancer patients. b. Prognosis of two groups of lung cancer
Citation for published version (APA): Oosterveer, M. H. (2009). Control of metabolic flux by nutrient sensors Groningen: s.n.
: Oosterveer, M. H. (2009). Control of metabolic flux by nutrient sensors Groningen: s.n.") University of Groningen Control of metabolic flux by nutrient sensors Oosterveer, Maaike IMPORTANT NOTE: You are advised to consult the publisher's version (publisher's PDF) if you wish to cite from it.
University of Groningen Control of metabolic flux by nutrient sensors Oosterveer, Maaike IMPORTANT NOTE: You are advised to consult the publisher's version (publisher's PDF) if you wish to cite from it.
Nature Immunology: doi: /ni.3836
 Supplementary Figure 1 Recombinant LIGHT-VTP induces pericyte contractility and endothelial cell activation. (a) Western blot showing purification steps for full length murine LIGHT-VTP (CGKRK) protein:
A smart acid nanosystem for ultrasensitive. live cell mrna imaging by the target-triggered intracellular self-assembly
 Electronic Supplementary Material (ESI) for Chemical Science. This journal is The Royal Society of Chemistry 2017 A smart ZnO@polydopamine-nucleic acid nanosystem for ultrasensitive live cell mrna imaging
Table S1. Oligonucleotides used for the in-house RT-PCR assays targeting the M, H7 or N9. Assay (s) Target Name Sequence (5 3 ) Comments
 Target Name Sequence (5 3 ) Comments") SUPPLEMENTAL INFORMATION 2 3 Table S. Oligonucleotides used for the in-house RT-PCR assays targeting the M, H7 or N9 genes. Assay (s) Target Name Sequence (5 3 ) Comments CDC M InfA Forward (NS), CDC M
SUPPLEMENTAL INFORMATION 2 3 Table S. Oligonucleotides used for the in-house RT-PCR assays targeting the M, H7 or N9 genes. Assay (s) Target Name Sequence (5 3 ) Comments CDC M InfA Forward (NS), CDC M
Supplementary Figure 1
 Supplementary Figure 1 3 3 3 1 1 Bregma -1.6mm 3 : Bregma Ref) Http://www.mbl.org/atlas165/atlas165_start.html Bregma -.18mm Supplementary Figure 1 Schematic representation of the utilized brain slice
Supplementary Figure 1
 Supplementary Figure 1 Supplementary Figure 1. Lats1/2 deleted ihbs and ihps showed decreased transcripts of hepatocyte related genes (a and b) Western blots (a) and recombination PCR (b) of control and
Journal of Cell Science Supplementary information. Arl8b +/- Arl8b -/- Inset B. electron density. genotype
 J. Cell Sci. : doi:.4/jcs.59: Supplementary information E9. A Arl8b /- Arl8b -/- Arl8b Arl8b non-specific band Gapdh Tbp E7.5 HE Inset B D Control al am hf C E Arl8b -/- al am hf E8.5 F low middle high
Supplementary Figure 1a
 Supplementary Figure 1a Hours: E-cadherin TGF-β On TGF-β Off 0 12 24 36 48 24 48 72 Vimentin βactin Fig. S1a. Treatment of AML12 cells with TGF-β induces EMT. Treatment of AML12 cells with TGF-β results
Supplementary Figure 1
 Metastatic melanoma Primary melanoma Healthy human skin Supplementary Figure 1 CD22 IgG4 Supplementary Figure 1: Immunohisochemical analysis of CD22+ (left) and IgG4 (right), cells (shown in red and indicated
SUPPLEMENTARY INFORMATION
 doi: 10.1038/nature05883 SUPPLEMENTARY INFORMATION Supplemental Figure 1 Prostaglandin agonists and antagonists alter runx1/cmyb expression. a-e, Embryos were exposed to (b) PGE2 and (c) PGI2 (20μM) and
Culture Density (OD600) 0.1. Culture Density (OD600) Culture Density (OD600) Culture Density (OD600) Culture Density (OD600)
 0.1. Culture Density (OD600) Culture Density (OD600) Culture Density (OD600) Culture Density (OD600)") A. B. C. D. E. PA JSRI JSRI 2 PA DSAM DSAM 2 DSAM 3 PA LNAP LNAP 2 LNAP 3 PAO Fcor Fcor 2 Fcor 3 PAO Wtho Wtho 2 Wtho 3 Wtho 4 DTSB Low Iron 2 4 6 8 2 4 6 8 2 22 DTSB Low Iron 2 4 6 8 2 4 6 8 2 22 DTSB
A. B. C. D. E. PA JSRI JSRI 2 PA DSAM DSAM 2 DSAM 3 PA LNAP LNAP 2 LNAP 3 PAO Fcor Fcor 2 Fcor 3 PAO Wtho Wtho 2 Wtho 3 Wtho 4 DTSB Low Iron 2 4 6 8 2 4 6 8 2 22 DTSB Low Iron 2 4 6 8 2 4 6 8 2 22 DTSB
BIOLOGY 621 Identification of the Snorks
 Name: Date: Block: BIOLOGY 621 Identification of the Snorks INTRODUCTION: In this simulation activity, you will examine the DNA sequence of a fictitious organism - the Snork. Snorks were discovered on
Supplemental Information. Th17 Lymphocytes Induce Neuronal. Cell Death in a Human ipsc-based. Model of Parkinson's Disease
 Cell Stem Cell, Volume 23 Supplemental Information Th17 Lymphocytes Induce Neuronal Cell Death in a Human ipsc-based Model of Parkinson's Disease Annika Sommer, Franz Maxreiter, Florian Krach, Tanja Fadler,
Phylogenetic analysis of human and chicken importins. Only five of six importins were studied because
 Supplementary Figure S1 Phylogenetic analysis of human and chicken importins. Only five of six importins were studied because importin-α6 was shown to be testis-specific. Human and chicken importin protein
Formylpeptide receptor2 contributes to colon epithelial homeostasis, inflammation, and tumorigenesis
 Supplementary Data Formylpeptide receptor2 contributes to colon epithelial homeostasis, inflammation, and tumorigenesis Keqiang Chen, Mingyong Liu, Ying Liu, Teizo Yoshimura, Wei Shen, Yingying Le, Scott
Description of Supplementary Files. File Name: Supplementary Information Description: Supplementary Figures and Supplementary Tables
 Description of Supplementary Files File Name: Supplementary Information Description: Supplementary Figures and Supplementary Tables Supplementary Figure 1: (A), HCT116 IDH1-WT and IDH1-R132H cells were
Astaxanthin prevents and reverses diet-induced insulin resistance and. steatohepatitis in mice: A comparison with vitamin E
 Supplementary Information Astaxanthin prevents and reverses diet-induced insulin resistance and steatohepatitis in mice: A comparison with vitamin E Yinhua Ni, 1,2 Mayumi Nagashimada, 1 Fen Zhuge, 1 Lili
SUPPORTING INFORMATION
 SUPPORTING INFORMATION Biology is different in small volumes: endogenous signals shape phenotype of primary hepatocytes cultured in microfluidic channels Amranul Haque, Pantea Gheibi, Yandong Gao, Elena
Cross-talk between mineralocorticoid and angiotensin II signaling for cardiac
 ONLINE SUPPLEMENT TO Crosstalk between mineralocorticoid and angiotensin II signaling for cardiac remodeling An Di ZHANG,,3, Aurelie NGUYEN DINH CAT*,,3, Christelle SOUKASEUM *,,3, Brigitte ESCOUBET, 4,
Supplemental Information. Cancer-Associated Fibroblasts Neutralize. the Anti-tumor Effect of CSF1 Receptor Blockade
 Cancer Cell, Volume 32 Supplemental Information Cancer-Associated Fibroblasts Neutralize the Anti-tumor Effect of CSF1 Receptor Blockade by Inducing PMN-MDSC Infiltration of Tumors Vinit Kumar, Laxminarasimha
Supplementary Figure 1
 Supplementary Figure 1 Supplementary Figure 1: Cryopreservation alters CD62L expression by CD4 T cells. Freshly isolated (left) or cryopreserved PBMCs (right) were stained with the mix of antibodies described
Supplementary Materials for
 www.sciencesignaling.org/cgi/content/full/10/473/eaai7696/dc1 Supplementary Materials for Astrocyte-shed extracellular vesicles regulate the peripheral leukocyte response to inflammatory brain lesions
Supplementary Information. Bamboo shoot fiber prevents obesity in mice by. modulating the gut microbiota
 Supplementary Information Bamboo shoot fiber prevents obesity in mice by modulating the gut microbiota Xiufen Li 1,2, Juan Guo 1, Kailong Ji 1,2, and Ping Zhang 1,* 1 Key Laboratory of Tropical Plant Resources
c Ischemia (30 min) Reperfusion (8 w) Supplementary Figure bp 300 bp Ischemia (30 min) Reperfusion (4 h) Dox 20 mg/kg i.p.
 Reperfusion (8 w) Supplementary Figure bp 300 bp Ischemia (30 min) Reperfusion (4 h) Dox 20 mg/kg i.p.") a Marker Ripk3 +/ 5 bp 3 bp b Ischemia (3 min) Reperfusion (4 h) d 2 mg/kg i.p. 1 w 5 w Sacrifice for IF size A subset for echocardiography and morphological analysis c Ischemia (3 min) Reperfusion (8
a Marker Ripk3 +/ 5 bp 3 bp b Ischemia (3 min) Reperfusion (4 h) d 2 mg/kg i.p. 1 w 5 w Sacrifice for IF size A subset for echocardiography and morphological analysis c Ischemia (3 min) Reperfusion (8
Supplementary Information
 Supplementary Information Remodeling of heterochromatin structure slows neuropathological progression and prolongs survival in an animal model of Huntington s disease Junghee Lee, Yu Jin Hwang, Yunha Kim,
BHP 2-7 and Nthy-ori 3-1 cells were grown in RPMI1640 medium (Hyclone) supplemented with 10% fetal bovine serum (Gibco), 2mM L-glutamine, and 100 U/mL
 supplemented with 10% fetal bovine serum (Gibco), 2mM L-glutamine, and 100 U/mL") 1 2 3 4 Materials and Methods Cell culture BHP 2-7 and Nthy-ori 3-1 cells were grown in RPMI1640 medium (Hyclone) 5 supplemented with 10% fetal bovine serum (Gibco), 2mM L-glutamine, and 100 U/mL 6 penicillin-streptomycin.
1 2 3 4 Materials and Methods Cell culture BHP 2-7 and Nthy-ori 3-1 cells were grown in RPMI1640 medium (Hyclone) 5 supplemented with 10% fetal bovine serum (Gibco), 2mM L-glutamine, and 100 U/mL 6 penicillin-streptomycin.
A basic helix loop helix transcription factor controls cell growth
 A basic helix loop helix transcription factor controls cell growth and size in root hairs Keke Yi 1,2, Benoît Menand 1,3, Elizabeth Bell 1, Liam Dolan 1,4 Supplementary note Low soil phosphate availability
ice-cold 70% ethanol with gentle vortexing, incubated at -20 C for 4 hours, and washed with PBS.
 Cell cycle analysis For cell cycle analysis, single cell suspensions of E12.5 fetal liver cells were suspended in 4 ml ice-cold 7% ethanol with gentle vortexing, incubated at -2 C for 4 hours, and washed
SUPPLEMENTARY INFORMATION
 BASELINE ISCHAEMIA a b Phd2 +/- c d Collateral growth and maintenance SMC recruitment SMC proliferation Phd2 +/- NF- B off NF- B on NF- B on NF- B on Endothelial cell Smooth muscle cell Pro-arteriogenic
 www.lessonplansinc.com Topic: Protein Synthesis - Sentence Activity Summary: Students will simulate transcription and translation by building a sentence/polypeptide from words/amino acids. Goals & Objectives:
Supplementary information
 Supplementary information Unique polypharmacology nuclear receptor modulator blocks inflammatory signaling pathways Mi Ra Chang 1, Anthony Ciesla 1, Timothy S. Strutzenberg 1, Scott J. Novick 1, Yuanjun
McAlpine PERK-GSK3 regulates foam cell formation. Supplemental Material. Supplementary Table I. Sequences of real time PCR primers.
 Mclpine PERK-GSK3 regulates foam cell formation Supplemental Material Supplementary Table I. Sequences of real time PCR primers. Primer Name Primer Sequences (5-3 ) Product Size (bp) GRP78 (human) Fwd:
Plasmids Western blot analysis and immunostaining Flow Cytometry Cell surface biotinylation RNA isolation and cdna synthesis
 Plasmids psuper-retro-s100a10 shrna1 was constructed by cloning the dsdna oligo 5 -GAT CCC CGT GGG CTT CCA GAG CTT CTT TCA AGA GAA GAA GCT CTG GAA GCC CAC TTT TTA-3 and 5 -AGC TTA AAA AGT GGG CTT CCA GAG
Resistance to Tetracycline Antibiotics by Wangrong Yang, Ian F. Moore, Kalinka P. Koteva, Donald W. Hughes, David C. Bareich and Gerard D. Wright.
 Supplementary Data for TetX is a Flavin-Dependent Monooxygenase Conferring Resistance to Tetracycline Antibiotics by Wangrong Yang, Ian F. Moore, Kalinka P. Koteva, Donald W. Hughes, David C. Bareich and
Supplementary Figure S1
 Supplementry Figure S Tissue weights (g).... Liver Hert Brin Pncres Len mss (g) 8 6 -% +% 8 6 Len mss Len mss (g) (% ody weight) Len mss (% ody weight) c Tiilis nterior weight (g).6...... Qudriceps weight
An epithelial circadian clock controls pulmonary inflammation and glucocorticoid action
 An epithelial circadian clock controls pulmonary inflammation and glucocorticoid action Supplementary Figure : Expression levels of toll-like receptor 4 (Tlr4) in muse lung does not change throughout the
Lezione 10. Sommario. Bioinformatica. Lezione 10: Sintesi proteica Synthesis of proteins Central dogma: DNA makes RNA makes proteins Genetic code
 Lezione 10 Bioinformatica Mauro Ceccanti e Alberto Paoluzzi Lezione 10: Sintesi proteica Synthesis of proteins Dip. Informatica e Automazione Università Roma Tre Dip. Medicina Clinica Università La Sapienza
PATIENTS AND METHODS. Subjects
 PATIENTS AND METHODS Subjects Twenty-nine morbidly obese subjects involved in a gastric surgery program were enrolled in the study between October 25 and March 21. Bariatric surgery was performed in patients
Supplemental Figures: Supplemental Figure 1
 Supplemental Figures: Supplemental Figure 1 Suppl. Figure 1. BM-DC infection with H. pylori does not induce cytotoxicity and treatment of BM-DCs with H. pylori sonicate, but not heat-inactivated bacteria,
CIRCRESAHA/2004/098145/R1 - ONLINE 1. Validation by Semi-quantitative Real-Time Reverse Transcription PCR
 CIRCRESAHA/2004/098145/R1 - ONLINE 1 Expanded Materials and Methods Validation by Semi-quantitative Real-Time Reverse Transcription PCR Expression patterns of 13 genes (Online Table 2), selected with respect
Supporting Information
 Supporting Information Malapeira et al. 10.1073/pnas.1217022110 SI Materials and Methods Plant Material and Growth Conditions. A. thaliana seedlings were stratified at 4 C in the dark for 3 d on Murashige
Supplemental Methods Supplemental Table 1. Supplemental Figure 1. Supplemental Figure 2. Supplemental Figure 3. Supplemental Figure 4.
 Supplemental Methods TGF-B1 ELISA Supernatants were collected from AT2 cells cultured for 1, 2, 3, or 4 days and frozen at -80 degrees C until use in the ELISA. A commercially available mouse TGF-B1 Duo
Supplementary Figure 1. Confocal immunofluorescence showing mitochondrial translocation of Drp1. Cardiomyocytes treated with H 2 O 2 were prestained
 Supplementary Figure 1. Confocal immunofluorescence showing mitochondrial translocation of Drp1. Cardiomyocytes treated with H 2 O 2 were prestained with MitoTracker (red), then were immunostained with
TetR repressor-based bioreporters for the detection of doxycycline using Escherichia
 Supplementary materials TetR repressor-based bioreporters for the detection of doxycycline using Escherichia coli and Acinetobacter oleivorans Hyerim Hong and Woojun Park * Department of Environmental
Single-Molecule Analysis of Gene Expression Using Two-Color RNA- Labeling in Live Yeast
 Supplemental Figures, Tables and Results Single-Molecule Analysis of Gene Expression Using Two-Color RNA- Labeling in Live Yeast Sami Hocine 1, Pascal Raymond 2, Daniel Zenklusen 2, Jeffrey A. Chao 1 &
Isolate Sexual Idiomorph Species
 SUPLEMENTARY TABLE 1. Isolate identification, sexual idiomorph and species of each isolate used for MAT locus distribution in Paracoccidioides species. Isolate Sexual Idiomorph Species Pb01 MAT1-1 P. lutzii
Loyer, et al. microrna-21 contributes to NASH Suppl 1/15
 Loyer, et al. microrna-21 contributes to NASH Suppl 1/15 SUPPLEMENTARY MATERIAL: Liver MicroRNA-21 is Overexpressed in Non Alcoholic Steatohepatitis and Contributes to the Disease in Experimental Models
Relationship of the APOA5/A4/C3/A1 gene cluster and APOB gene polymorphisms with dyslipidemia
 elationship of the APOA5/A4/C3/A1 gene cluster and APOB gene polymorphisms with dyslipidemia H.J. Ou 1, G. Huang 2, W. Liu 3, X.L. Ma 2, Y. Wei 4, T. Zhou 5 and Z.M. Pan 3 1 Department of Neurology, The
Supplementary Materials and Methods
 DD2 suppresses tumorigenicity of ovarian cancer cells by limiting cancer stem cell population Chunhua Han et al. Supplementary Materials and Methods Analysis of publicly available datasets: To analyze
Mechanistic and functional insights into fatty acid activation in Mycobacterium tuberculosis SUPPLEMENTARY INFORMATION
 Mechanistic and functional insights into fatty acid activation in Mycobacterium tuberculosis Pooja Arora 1, Aneesh Goyal 2, Vivek T atarajan 1, Eerappa Rajakumara 2, Priyanka Verma 1, Radhika Gupta 3,
University of Groningen. Vasoregression in incipient diabetic retinopathy Pfister, Frederick
 University of Groningen Vasoregression in incipient diabetic retinopathy Pfister, Frederick IMPORTANT NOTE: You are advised to consult the publisher's version (publisher's PDF) if you wish to cite from
Integration Solutions
 Integration Solutions (1) a) With no active glycosyltransferase of either type, an ii individual would not be able to add any sugars to the O form of the lipopolysaccharide. Thus, the only lipopolysaccharide
Viral hepatitis, which affects half a billion people
 GASTROENTEROLOGY 2006;130:435 452 BASIC LIVER, PANCREAS, AND BILIARY TRACT Natural Killer Cells Ameliorate Liver Fibrosis by Killing Activated Stellate Cells in NKG2D-Dependent and Tumor Necrosis Factor
SUPPLEMENTAL METHODS Cell culture RNA extraction and analysis Immunohistochemical analysis and laser capture microdissection (LCM)
") SUPPLEMENTAL METHODS Cell culture Human peripheral blood mononuclear cells were isolated from healthy donors by Ficoll density gradient centrifugation. Monocyte differentiation to resting macrophages ()
SUPPLEMENTAL METHODS Cell culture Human peripheral blood mononuclear cells were isolated from healthy donors by Ficoll density gradient centrifugation. Monocyte differentiation to resting macrophages ()
Nucleotide Sequence of the Australian Bluetongue Virus Serotype 1 RNA Segment 10
 J. gen. Virol. (1988), 69, 945-949. Printed in Great Britain 945 Key words: BTV/genome segment lo/nucleotide sequence Nucleotide Sequence of the Australian Bluetongue Virus Serotype 1 RNA Segment 10 By
Supporting Information. Mutational analysis of a phenazine biosynthetic gene cluster in
 Supporting Information for Mutational analysis of a phenazine biosynthetic gene cluster in Streptomyces anulatus 9663 Orwah Saleh 1, Katrin Flinspach 1, Lucia Westrich 1, Andreas Kulik 2, Bertolt Gust
Supplementary Figure 1: GPCR profiling and G q signaling in murine brown adipocytes (BA). a, Number of GPCRs with 2-fold lower expression in mature
. a, Number of GPCRs with 2-fold lower expression in mature") Supplementary Figure 1: GPCR profiling and G q signaling in murine brown adipocytes (BA). a, Number of GPCRs with 2-fold lower expression in mature BA vs. preadipocytes. b, Number of GPCRs with 2-fold
Supplementary Figure 1: GPCR profiling and G q signaling in murine brown adipocytes (BA). a, Number of GPCRs with 2-fold lower expression in mature BA vs. preadipocytes. b, Number of GPCRs with 2-fold
BNP mrna expression in DR and DS rat left ventricles (n = 5). (C) Plasma norepinephrine
. (C) Plasma norepinephrine") Kanazawa, et al. Supplementary figure legends Supplementary Figure 1 DS rats had congestive heart failure. (A) DR and DS rat hearts. (B) QRT-PCR analysis of BNP mrna expression in DR and DS rat left ventricles
Kanazawa, et al. Supplementary figure legends Supplementary Figure 1 DS rats had congestive heart failure. (A) DR and DS rat hearts. (B) QRT-PCR analysis of BNP mrna expression in DR and DS rat left ventricles
SUPPLEMENTAL FIGURE 1
 SUPPLEMENTL FIGURE 1 C Supplemental Figure 1. pproach for removal of snorns from Rpl13a gene. () Wild type Rpl13a exonintron structure is shown, with exo in black and intronic snorns in red rectangles.
Supplementary information. The proton-sensing G protein-coupled receptor T-cell death-associated gene 8
 1 Supplementary information 2 3 The proton-sensing G protein-coupled receptor T-cell death-associated gene 8 4 (TDAG8) shows cardioprotective effects against myocardial infarction 5 Akiomi Nagasaka 1+,
What do you think of when you here the word genome?
 What do you think of when you here the word genome? What do you think of when you here the word genome? Personal Genomics Outline Review of pre-lab work Genomics and Medicine Case Overview & Assignment
Beta Thalassemia Case Study Introduction to Bioinformatics
 Beta Thalassemia Case Study Sami Khuri Department of Computer Science San José State University San José, California, USA sami.khuri@sjsu.edu www.cs.sjsu.edu/faculty/khuri Outline v Hemoglobin v Alpha
Supporting Information
 Supporting Information Molecular Recognition Based DNA Nanoassemblies on the Surfaces of Nanosized Exosomes Shuo Wan,, Liqin Zhang,,, Sai Wang, Yuan Liu,, Cuichen Wu, Cheng Cui, Hao Sun, Muling Shi, Ying
Baseline clinical characteristics for the 81 CMML patients Routine diagnostic testing and statistical analyses... 3
 Next-Generation Sequencing Technology Reveals a Characteristic Pattern of Molecular Mutations in 72.8% of Chronic Myelomonocytic Leukemia (CMML) by Detecting Frequent Alterations in TET2, CBL, RAS, and
Mutation Screening and Association Studies of the Human UCP 3 Gene in Normoglycemic and NIDDM Morbidly Obese Patients
 Mutation Screening and Association Studies of the Human UCP 3 Gene in Normoglycemic and NIDDM Morbidly Obese Patients Shuichi OTABE, Karine CLEMENT, Séverine DUBOIS, Frederic LEPRETRE, Veronique PELLOUX,
Beta Thalassemia Sami Khuri Department of Computer Science San José State University Spring 2015
 Bioinformatics in Medical Product Development SMPD 287 Three Beta Thalassemia Sami Khuri Department of Computer Science San José State University Hemoglobin Outline Anatomy of a gene Hemoglobinopathies
SUPPLEMENTARY INFORMATION
 SUPPLEMENTARY INFORMATION doi:10.1038/nature10743 Supplementary Figures and Legends Supplementary Figure 1. CYP17A1 (red boxes) lies at the intersection of steroid hormone biosynthetic pathways. CYP17A1
The Clinical Performance of Primary HPV Screening, Primary HPV Screening Plus Cytology Cotesting, and Cytology Alone at a Tertiary Care Hospital
 The Clinical Performance of Primary HPV Screening, Primary HPV Screening Plus Cytology Cotesting, and Cytology Alone at a Tertiary Care Hospital Jung-Woo Choi MD, PhD; Younghye Kim MD, PhD; Ju-Han Lee
Enhanced detection and serotyping of Streptococcus pneumoniae using multiplex polymerase chain reaction
 Original article http://dx.doi.org/10.3345/kjp.2012.55.11.424 Korean J Pediatr 2012;55(11):424-429 eissn 1738-1061 pissn 2092-7258 Enhanced detection and serotyping of Streptococcus pneumoniae using multiplex
Cancer Genetics 204 (2011) 45e52
 45e52") Cancer Genetics 204 (2011) 45e52 Exon scanning by reverse transcriptaseepolymerase chain reaction for detection of known and novel EML4eALK fusion variants in nonesmall cell lung cancer Heather R. Sanders
Cancer Genetics 204 (2011) 45e52 Exon scanning by reverse transcriptaseepolymerase chain reaction for detection of known and novel EML4eALK fusion variants in nonesmall cell lung cancer Heather R. Sanders
Figure 1. Effects of FGF21 on adipose tissue. (A) Representative histological. findings of epididymal adipose tissue (B) mrna expression of
 Representative histological. findings of epididymal adipose tissue (B) mrna expression of") SUPPLEMENTAL MATERIAL EN-12-2276 Figure 1. Effects of FGF21 on adipose tissue. (A) Representative histological findings of epididymal adipose tissue (B) mrna expression of adipocytokines in adipose tissue.
SUPPLEMENTAL MATERIAL EN-12-2276 Figure 1. Effects of FGF21 on adipose tissue. (A) Representative histological findings of epididymal adipose tissue (B) mrna expression of adipocytokines in adipose tissue.
Postn MCM Smad2 fl/fl Postn MCM Smad3 fl/fl Postn MCM Smad2/3 fl/fl. Postn MCM. Tgfbr1/2 fl/fl TAC
 A Smad2 fl/fl Smad3 fl/fl Smad2/3 fl/fl Tgfbr1/2 fl/fl 1. mm B Tcf21 MCM Tcf21 MCM Smad3 fl/fl Tcf21 MCM Smad2/3 fl/fl Tcf21 MCM Tgfbr1/2 fl/fl αmhc MCM C 1. mm 1. mm D Smad2 fl/fl Smad3 fl/fl Smad2/3
Rapid blue-light mediated induction of protein interactions in living cells
 Nature Methods Rapid blue-light mediated induction of protein interactions in living cells Matthew J Kennedy, Robert M Hughes, Leslie A Peteya, Joel W Schwartz, Michael D Ehlers & Chandra L Tucker Supplementary
Supplementary Fig. 1 No relative growth advantage of Foxp3 negative cells.
 Supplementary Fig. 1 Supplementary Figure S1: No relative growth advantage of Foxp3 negative cells. itreg were induced from WT (A) or FIR (B) CD4 + T cells. FIR itregs were then removed from the TCR signal
Methodology Report Efficient Differentiation of Mouse Embryonic Stem Cells into Insulin-Producing Cells
 Experimental Diabetes Research Volume 2012, Article ID 201295, 5 pages doi:10.1155/2012/201295 Methodology Report Efficient Differentiation of Mouse Embryonic Stem Cells into Insulin-Producing Cells Szu-Hsiu
Nucleotide diversity of the TNF gene region in an African village
 (2001) 2, 343 348 2001 Nature Publishing Group All rights reserved 1466-4879/01 $15.00 www.nature.com/gene Nucleotide diversity of the TNF gene region in an African village A Richardson 1, F Sisay-Joof
Development of RT-qPCR-based molecular diagnostic assays for therapeutic target selection of breast cancer patients
 Development of RT-qPCR-based molecular diagnostic assays for therapeutic target selection of breast cancer patients Sangjung Park The Graduate School Yonsei University Department of Biomedical Laboratory
Expression of Selected Inflammatory Cytokine Genes in Bladder Biopsies
 Borneo Journal of Resource Science and Technology (2013) 3(2): 15-20 Expression of Selected Inflammatory Cytokine Genes in Bladder Biopsies EDMUND UI-HANG SIM *1, NUR DIANA ANUAR 2, TENG-AIK ONG 3, GUAN-
Mutation analysis of a Chinese family with oculocutaneous albinism
 /, 2016, Vol. 7, (No. 51), pp: 84981-84988 Mutation analysis of a Chinese family with oculocutaneous albinism Xiong Wang 1, Yaowu Zhu 1, Na Shen 1, Jing Peng 1, Chunyu Wang 1, Haiyi Liu 2, Yanjun Lu 1
mir-1202: A Primate Specific and Brain Enriched mirna Involved in Major Depression and Antidepressant Treatment. Supplementary Information
 Title: mir-1202: A Primate Specific and Brain Enriched mirna Involved in Major Depression and Antidepressant Treatment. Authors: Juan Pablo Lopez 1, Raymond Lim 3, Cristiana Cruceanu 1, Liam Crapper 1,
Engineering a polarity-sensitive biosensor for time-lapse imaging of apoptotic processes and degeneration
 nature methods Engineering a polarity-sensitive biosensor for time-lapse imaging of apoptotic processes and degeneration Yujin E Kim, Jeannie Chen, Jonah R Chan & Ralf Langen Supplementary figures and
Supplementary Material Hofko M et al., Detection of carbapenemases by real-time PCR and melt-curve analysis on the BD MAX TM System
 Supplementary Material Hofko M et al., Detection of carbapenemases by real-time PCR and melt-curve analysis on the BD MAX TM System Supplementary Material and Methods Characterization of isolates by the