From Cerebrospinal Fluid Pulsation to Noninvasive Intracranial Compliance and Pressure Measured by MRI Flow Studies
|
|
|
- Reynold Allen
- 5 years ago
- Views:
Transcription
1 This investigation is directed to using the advances in MRI data to focus on movement of blood through the arteries and veins of the brain and on the movement of CSF through certain passageways in such a way that actual volumes of fluid movement could be calculated. Noam Alprin and others at his laboratory have been developing this method over the last decade so that the MR imaging device can be used to evaluate patients with major neurological symptoms. In the course of these investigations a subject with a large skull defect due to injury was studied before having a closure plate installed and after the plate was installed. As can be seen in the open skull and closed skull data there are significant changes in the capacity of the skull system to accept a volume of the cardiac pulse. The pulse volume was reduced significantly after closure. What that means is that the cardiac pulse volume that enters into the skull system is larger when the skull is open than when closed. In this case because the skull opening is rather large the pulse volume in the open skull condition is twice that of the closed condition. This doesn t mean that the pulse pressure is greater because that would mean that the ICP is higher. Actually the skull opening allows the pulse pressure to be lower (the volume enters more easily) and the ICP to be lower along the same line as the data presented by Ohara in the Japanese study.
2
3 Current Medical Imaging Reviews, 2006, 2, From Cerebrospinal Fluid Pulsation to Noninvasive Intracranial Compliance and Pressure Measured by MRI Flow Studies Noam Alperin*,1, Monica Mazda 1,Terry Lichtor 2 and Sang H. Lee 1 1 Physiological Imaging and Modeling Lab, Department of Radiology (M/C 711), The University of Illinois at Chicago, 830 S. Wood St., Chicago, IL 60612, 2 Department of Neurosergery, Rush University Medical Center, Chicago, IL, USA Abstract: The pulsation of the cerebrospinal fluid (CSF) has fascinated investigators of the intracranial physiology since it was first documented by invasive CSF pressure measurements. Advances in dynamic Magnetic Resonance Imaging (MRI) now enable visualization of and quantitation the CSF flow dynamics and has contributed to our understanding of the origin of CSF pulsation and its relation to the pulsatile blood flow. This, in turn, has led to the development of a noninvasive method for measurement of intracranial compliance and pressure by MRI. This article reviews the neurophysiologic and hydrodynamic principles that are the basis of the method, it describes the implementation of the method and validation studies to date with a non-human primate animal model, computer simulations, healthy human subjects and patients. The article further reviews the application of this method to study the effect of body posture on the cerebral physiology in humans through the relationships between blood and CSF flow dynamics. Finally, recent results from the application of the method in Chiari Malformations (CM) are briefly presented as an example of a potential clinical application of this methodology. The application to CM provided, for the first time, evidence of the important role intracranial compliance plays in the pathophysiology of this poorly understood disorder. The potential diagnostic value of an MRI-based measurement of ICP for other neurological problems is discussed. Keywords: Cerebrospinal fluid pulsation, MRI flow studies, intracranial compliance, intracranial pressure, cerebral blood flow. EARLY INVESTIGATIONS OF CSF FLOW DYNAMICS The Cerebrospinal Fluid (CSF) flow is influenced by two separate processes; the circulation of the CSF from its formation sites to its absorption sites (i.e., bulk flow), and an oscillatory (back and forth) flow during the cardiac cycle (pulsatile flow). The first process governs the overall volume of CSF in the craniospinal space and thereby influences intracranial pressure (ICP). The second process, the oscillatory movement of the CSF within the craniospinal compartments, is caused by the pulsatile blood flow entering and leaving the intracranial compartment during the cardiac cycle. These two processes occur over different time scales. The circulation and replenishing of CSF in the craniospinal system occurs over minutes while the time scale of the pulsatile CSF flow is milliseconds. The pulsatile nature of the CSF flow has been the subject of many investigations since 1943, when the pulsatility of CSF pressure was first linked to vascular factors [1]. Simultaneous dynamic measurements of blood and CSF pressures revealed that the two pressures are synchronized and therefore related. However, the specific relationship and the origin of CSF pulsation have been debated ever since. First, it was suggested that CSF pulsations arise primarily from the large arteries at the base of the brain [2]. Bering *Address correspondence to this author at the Physiological Imaging and Modeling Lab, Department of Radiology (M/C 711), The University of Illinois at Chicago, 830 S. Wood St., Chicago, IL 60612, USA; Tel: ; Fax: , USA; alperin@uic.edu et al. [3, 4] suggested that the CSF pulsation arises entirely from the pulsation of the choroid plexus. They further noticed that CSF pulse pressure in the lumbar subarachnoid space is attenuated compared with the CSF pulse pressure in the ventricles and suggested that it is due to the elasticity of the dural envelope. Hamit et al. [5] suggested that the CSF pulse pressure follows a venous rather than an arterial pattern. Dunbar et al. [6] found similarity between CSF pulse pressure waveforms measured in the ventricles, cisterna magna and lumbar subarachnoid space, and the arterial pulse pressure wave measured in the aorta in dogs. Dardenne et al. [7] examined the effect of mean CSF pressure on the similarity between the waveforms of blood pressure in the carotid artery and the CSF pressure. They noted that the CSF pulse pressure becomes more similar to the carotid pulsations as the mean CSF pressure rises. They also noted that with reduced cardiac output CSF pulsations resembled venous pressure. The influence of systemic arterial pressure on the CSF pulsation was further studied by Dereymaeker et al. [8]. They demonstrated a tendency of the cisternal CSF pulsations to resemble arterial pulsations when the arterial pressure is low and attain a more venous like morphology at high arterial blood pressure. They argued that at high blood pressure, venous pulsation dominates the CSF pulse wave due to the reduced ability of the arterial wall to pulsate. In 1977, Hamer et al. [9] categorized the intracranial pressure pulse wave under normal and pathophysiological conditions. In normal conditions, they found that the systolic portion of the intracranial CSF pulse wave is primarily arterial in origin and the descending diastolic portion is similar to the superior /06 $ Bentham Science Publishers Ltd.
4 118 Current Medical Imaging Reviews, 2006, Vol. 2, No. 1 Alperin et al. vena cava pulse pressure. Under increased ICP, however, the descending part of the CSF pulse wave also resembled the arterial pulse. During increased central venous pressure the pulsations became more venous in shape. Based on these observations they concluded that the morphology of the CSF pulsations could be regarded as an index of the state of the intracranial elastance or compliance. Following the development of cardiac-synchronized motion-sensitive MRI techniques, in the mid 1980s, MR imaging became an important noninvasive means for detailed investigation of the CSF flow dynamics and brain motion [10-12]. Greitz et al. [13] used velocity imaging by phased contrast MR (PCMR) to document the movement of various brain regions during the cardiac cycle to elucidate the role of the brain movement on CSF flow. They postulated that arterial expansion causes brain movement and concluded that expansion of the central and lower parts of the brain acts as an expanding and retracting piston, which causes the CSF pulsation at the foramen magnum. The piston mechanism for the CSF pulsation concurs with the much earlier but similar explanation by O Connel et al. [1]. Based on observations that CSF pulse pressure varies with cardiac and respiratory cycles O Connel et al. concluded that CSF pulsation is due to changes in brain blood volume caused by arterial expansion [1]. MRI measurements of volumetric flow rates provide information about the volumes of blood and CSF that are entering and leaving the intracranial space during the cardiac cycle [14-16]. In 1993, Enzmann and Pelc [14] used PCMR to study the temporal relationship between net blood volume entering the brain (arteriovenous difference) and CSF craniospinal flow volume. The arterial inflow was measured by adding together the volumetric flow rate (VFR) through the carotid and vertebral arteries. The venous outflow was estimated from the volumetric flow through the internal jugular veins. They reported that peak arteriovenous difference waveform occurred simultaneously with the peak of the CSF VFR waveform. The arteriovenous blood volume difference was considered to be both a measure of brain expansion and the driving force behind the cranio-to-spinal CSF flow. The notion that net transcranial blood flow is driving the oscillatory CSF flow between the cranium and the spinal canal was further explored by Alperin et al. [15] who applied modulation transfer function analysis to characterize the biomechanical properties of the intracranial compartment. The analysis demonstrated that the normal intracranial biomechanical state can be approximated by an exponential impulse response function (IRF) with a time constant proportional to the product of the (intracranial) compliance and the resistance to cranio-spinal CSF flow. This implies that the CSF flow dynamics are modulated by intracranial compliance. Since intracranial compliance is inversely proportional to ICP, it also explains the dependency of the relationship between arterial, venous, and CSF flows and pulse pressures on intracranial pressure. A finite intracranial compliance dictates that peak CSF flow occurs after the peak arterial inflow. A more recent work by Baledent et al. [16] has indeed confirmed a small time delay between these two peaks. MEASUREMENT OF INTRACRANIAL COMPLIANCE AND PRESSURE BY MRI Although MRI CSF flow studies provide quantitative measures of the CSF flow dynamics, clinical utilization of these studies has been limited due to the difficulty in interpreting these measurements and due to large interindividual variability, even among healthy subjects. Establishing a relationship between CSF pulsation and important clinical physiological parameters such as intracranial compliance and pressure may therefore enhance the clinical role of CSF flow studies. A noninvasive method for characterization of the intracranial physiology through measurements of blood and CSF flow has been recently described [17-19]. This method provides simultaneous measurements of total cerebral blood flow (TCBF), intracranial compliance, and intracranial pressure (ICP). These physiological parameters characterize the hemodynamic and hydrodynamic states of the craniospinal system, i.e., the craniospinal biomechanical state. The craniospinal biomechanical state changes with normal activities (e.g., change in body posture), with aging, and with head trauma and diseases (e.g., strokes, intracranial hemorrhages, hydrocephalous, Chiari Malformations, etc.). A noninvasive assessment of cerebral blood flow and intracranial pressure would make these important parameters more accessible and therefore it may improve our understanding of the normal intracranial physiology and of the pathophysiology in related diseases. 1. The Neurophysiology Basis of the MR-ICP Method The MRI-based method integrates human neurophysiology and fluid dynamic principles with dynamic MRI techniques to measure intracranial elastance (inverse of compliance) and ICP. The method utilizes the small fluctuations in intracranial volume and pressure that occur with each heartbeat. The intracranial elastance, i.e., a change in pressure due to a small change in volume, is derived from the ratio of these changes. A mean ICP value is then derived from the linear relationship between intracranial pressure and elastance. In a closed system such as the cranium, the pressure and volume are related. Ryder et al. [20] and others [21-23] studied the pressure-volume relationship by injecting fluid into the CSF space. The degree of the change in pressure resulting from an injection of a known volume permitted characterization of the intracranial pressure-volume dependence. Marmarou et al. [21] proposed the following expression for the pressure-volume curve P = P 1 e E 1V where E 1 is a constant elastance coefficient (unitsvolume -1 ), P 1 is a pressure coefficient related to the exponential shape of the curve, and V is the intracranial volume (CSF + blood + brain tissue). The mono-exponential elastance curve, shown in Fig. (1) illustrates the dependence of the ratio of pressure and volume changes, dp/dv, on the mean pressure. The change in pressure with each heartbeat (1)

5 A Review of Wavelet Denoising in MRI and Ultrasound Brain Imaging Current Medical Imaging Reviews, 2006, Vol. 2, No Fig. (1). The monoexponential curve depicting the relation between the intracranial pressure and volume. Note that at low pressures the ratio of dp/dv (elastance) is small while at a high pressure the ratio is large. (i.e., the amplitude of the pulse pressure) due to a change in the intracranial volume is determined by the elastance of the system. At a low pressure, this ratio is small, while at a high pressure, this ratio is large. Since the pressure-volume curve is mono-exponential intracranial elastance is a linear function of ICP. The pressure-volume relationship was not determined from a direct measurement of the volume of the intracranial space; there was no in vivo means of measuring that volume. Instead, it was inferred from the linear relationship between elastance and pressure [21-23]. The elastance was measured with a volume-pressure response test. In this test, shown in Fig. (2) (from Marmarou et al., 1975), the total intracranial volume is rapidly increased by injecting a known amount of fluid into the ventricles. The elastance is then derived from the ratio of the resultant pressure change (P p -P 0 ) and the amount of injected volume, V. Fig. (2). (From Marmarou et al. 1975). The volume-pressure response test for invasive measurement of compliance). The pressure trace showing the increase in pressure following injection of a volume of fluid, V. The elastance is then derived from the ratio of the resultant pressure change (Pp-P 0 ) to the amount of injected volume, DV. Similarly, MR-ICP measures the elastance from the ratio of pressure and volume changes that occur naturally with each cardiac cycle. Intracranial pressure is then derived through the linear relationship between elastance and pressure. The small volume change that occurs with each cardiac cycle is analogous to the injected volume used in the volume-pressure response test. Volume and pressure changes occur because of the pulsatile nature of blood flow. During systole, more volume flows into the cranial vault (arterial inflow exceeds venous and CSF outflows) while during diastole, the outflow is larger. The MRI method measures the arterial, venous, and CSF flows into and out of the cranial vault. A small volume change, on the order of one milliliter, is derived from the differences between inflow and outflow at each time points in the cardiac cycle. The pressure change is derived from the CSF velocities using fluid dynamics principles. The derivation of these quantities with MRI is described in following sections. 2. Intracranial Volume Change During the Cardiac Cycle In a compartment with inlets and outlets, a change in the volume of that compartment can be determined from the instantaneous difference between volumetric flows entering and leaving the compartment as long as the flowing fluid and the content inside are incompressible. The Monro-Kellie doctrine makes this observation [24]. This doctrine also assumes that the volume of the intracranial space is constant. Today, we know that a small periodic change in the intracranial volume occurs with each cardiac cycle. The mean intracranial volume, however, is constant. The change in the intracranial volume during the cardiac cycle is calculated from measurements of volumes of blood and CSF that are entering and leaving the cranial vault, as described in equation 2 and from the condition described by equation 3, ICV(t) = [Q A (t) - Q v (t) - Q CSF (t)] t 0<t<T (2) ICV(T) = [Q A (t) Q v (t) Q CSF (t) ] t = 0 (3) card. cycle where Q A (t) is the total arterial volumetric flow rate, Q V (t) is the total venous volumetric outflow rate, Q CSF (t) is the rate of CSF volumetric outflows through the foramen magnum, and T is the time period of the cardiac cycle. Equation 3 is equivalent to the Monro-Kellie doctrine assumption of constant intracranial volume averaged over the cardiac cycle. The MRI method measures the small intracranial volume change ( ICV) during the cardiac cycle using a previously described craniospinal flow-volume model [15]. The model, shown in Fig. (3), includes the intracranial and spinal canal compartments, as well as the following inputs and outputs: arterial inflow, venous outflow, and CSF oscillatory flow between the cranium and the spinal canal. During the systolic phase of the cardiac cycle, arterial blood inflow is greater than venous outflow; thus, the intracranial blood volume increases. This produces a rise in pressure that, in turn, forces CSF to flow from the cranium into the spinal canal. During the diastolic phase, blood volume decreases and the CSF flow is reversed. Motion-sensitive MRI
![120 Current Medical Imaging Reviews, 2006, Vol. 2, No. 1 Alperin et al. Fig. (3). The craniospinal flow-volume-pressure model proposed by Alperin et al. [15].](/docs-images/85/92538121/images/6-0.jpg "This model shows the arterial inflow, the venous outflow and the CSF flow that oscillates between the cranium and spinal canal.")

6 120 Current Medical Imaging Reviews, 2006, Vol. 2, No. 1 Alperin et al. Fig. (3). The craniospinal flow-volume-pressure model proposed by Alperin et al. [15]. This model shows the arterial inflow, the venous outflow and the CSF flow that oscillates between the cranium and spinal canal. During systole arterial blood inflow is greater than the venous outflow which is accommodated by the CSF movement to the spinal canal. The CSF moves to the cranium during diastole as the venous outflow becomes greater. techniques allow for direct imaging and quantitation of these flow dynamics. 3. Measurements of CSF Flow, Total Cerebral Blood Flow, and Volume Change During the Cardiac Cycle by MRI Flow measurements with dynamic velocity-encoded phase contrast can be reliably and accurately made [25, 26]. The reported accuracy of the MR velocity and volumetric flow measurements in non-steady (pulsatile) flow are within 7.5% and 2.8%, respectively [25]. The cine PCMR technique provides a series of images with values of picture elements proportional to the velocity at that location (velocity maps). The phase contrast MRI technique is based on the principle that the precession frequency of the protons is proportional to the magnetic field strength. Therefore, velocity can be phased-encoded by application of magnetic field gradients. Fig. (4) demonstrates the principle of the velocity encoding phase contrast technique. When a gradient field is applied along an axis for a short time, the proton s phase will change based on its location along that axis. When a bipolar (positive and then negative) gradient field is applied, the phase of the stationary protons (located at +x) will increase during the positive portion (lobe) of the bipolar gradient and then will decrease during the negative lobe. If the lobes were of equal area, no net phase change would occur. However, moving protons, such as those in the blood or CSF, will experience different field strength during each lobe due to Fig. (4). A schematic representation of the effect a magnetic field gradient has on stationary protons. Left: Protons at different locations along the x-axis accumulate a different phase when a magnetic field gradient is applied. Right: Time evolution of the phase of a stationary proton located at +x that is experiencing a bipolar field gradient. The positive phase shift caused by the positive lobe is canceled after the application of the negative lobe resulting with no phase shift for a stationary proton. A moving proton will accumulate a phase shift that is proportional to its velocity.
 and Fig.")

 depicts inflow (black pixels) during the diastolic phase. Fig (5d) depicts a 3D plot of the velocities in a region of interest containing the CSF space and an epidural vein.")
 and a velocity encoded image of blood flow is shown in Fig. (6b).")
7 A Review of Wavelet Denoising in MRI and Ultrasound Brain Imaging Current Medical Imaging Reviews, 2006, Vol. 2, No their change in position; this will result in a net phase change proportional to the proton velocity. Examples of MRI phase contrast images of CSF and blood flow are shown in Fig. (5) and Fig. (6), respectively. The oscillatory CSF flow between the cranial and the spinal compartments is visualized in images taken in a transverse anatomical orientation through the upper cervical spinal canal. The location of this plane is indicated on a midsagittal T1 weighted MR image shown in Fig. (5a). Fig. (5b) depicts outflow (white pixels) during the systolic phase and Fig. (5c) depicts inflow (black pixels) during the diastolic phase. Fig (5d) depicts a 3D plot of the velocities in a region of interest containing the CSF space and an epidural vein. The CSF flow is imaged with a low velocity encoding and the faster blood flow through the neck arteries and veins is imaged using high velocity encoding. The location of the imaging plane used for blood flow measurement is shown in Fig. (6a) and a velocity encoded image of blood flow is shown in Fig. (6b). Fig (6c) depicts a 3D plot of the velocities in a region of interest containing the internal carotid and vertebral arteries and the jugular vein. Volumetric flow rates are obtained by integration of the velocities throughout a lumen cross-sectional area. An automated method for delineation of the lumen boundaries, Pulsatility Based Segmentation [26], has been applied to improve the reliability of the CSF and blood flow volumetric flow rate measurements. Velocity waveforms inside a lumen are similar to each other while those outside the lumen region are different. Pixels with velocity waveform similar to a reference velocity waveform selected from inside a lumen of interest are segmented and identified as the lumen region. The degree of similarity between waveforms is utilized to differentiate between lumen and background pixels. The method incorporates computation of an unbiased threshold to increase measurement reproducibility. The total volumetric arterial flow rate -that is, total cerebral blood flow (TCBF) - is calculated directly from the sum of the volumetric flow through the four vessels carrying A B C D Fig. (5). A. Anatomical mid-sagittal T1 weighted MR image showing the location of the axial plane used for CSF flow measurement (dark line). B and C are Phase-contrast MRI images of CSF flow in the spinal canal. B. CSF flow during systole. C. CSF flow during diastole. The pixel values in these images are proportional to velocities in a direction perpendicular to the image plane. Gray- static tissue, white- outward flow (caudal direction), and black- inward flow (cranial direction). D. a 3D plot of the CSF velocities during systole.


.")
8 122 Current Medical Imaging Reviews, 2006, Vol. 2, No. 1 Alperin et al. A B C Fig. (6). a. A blood vessel MRI scout image showing the location of the axial plane for blood flow measurement (dash line). B. A Phase Contrast MRI image of blood flow through that location. Black pixels indicate arterial inflow and white are venous outflow. C. A 3D plot of the blood flow velocities. In the right carotid artery, vertebral artery and jugular vein. blood to the brain (internal carotid and vertebral arteries) over one cardiac cycle. The venous blood outflow is derived by summation of the flow through the jugular veins, and the epidural, vertebral and deep cervical veins when present. The later veins are parts of the cervical venous plexus, which is a secondary venous outflow pathway. Flows through the jugular veins do not always represent the entire venous outflow. Infact, we found that the measured total venous flow can be lower than the total measured arterial inflow. This may be due to some venous outflow through additional secondary channels (e.g., cervical plexus, ophthalmic veins). This unmeasured venous flow is accounted for by the constraint of no mean net change in the intracranial volume over one cardiac cycle as formulated in equation 3. An example of the volumetric flow waveforms for CSF, arterial inflow, and venous outflow measured in a healthy volunteer is shown in Fig. (7). The rate of the time-varying intracranial volume change (net transcranial volumetric flow rate) is obtained by subtracting outflow rates from inflow rates at each time point. The intracranial volume change (delta of volume from a given reference point) is obtained by integrating that waveform with respect to time. The net transcranial volumetric flow rate and the ICV waveforms, obtained from the CSF and blood flow waveforms shown in Fig. (7), are shown in Fig. (8a) and Fig. (8b), respectively. The maximum volume change in this example is close to 0.5 ml. 4. MRI Measurements of the ICP Change During the Cardiac Cycle The change in intracranial pressure during the cardiac cycle is derived from the change in the CSF pressure gradient. A method to measure pressure gradient of pulsatile flow in tubes with MRI was reported by Urchuk and Plewes
9 A Review of Wavelet Denoising in MRI and Ultrasound Brain Imaging Current Medical Imaging Reviews, 2006, Vol. 2, No Fig. (7). The volumetric flows into and out of the cranial vault during the cardiac cycle derived from the MRI phase contrast scans. Total arterial inflow (filled circles), venous outflow (open) and the cranial-to-spinal CSF volumetric flow rate (diamonds) during the cardiac cycle. Note that arterial inflow is greater than venous outflow during systole. [27]. Pulsatile pressure gradients are derived from the MRI velocity encoded phase contrast images using the Navier- Stokes relationship between pressure gradient and temporal and spatial derivatives of the fluid velocity for incompressible fluid in a rigid tube [28]. This relationship is shown in equation 4 P = ρ ( V t +V V) +µ 2 V where ρ is the fluid density, µ is the fluid viscosity, and V and P are the velocity vector and pressure, respectively. This equation is essentially a momentum balance, which states that a small volume element moving with the fluid is accelerated because of the forces acting upon it. The first and second terms on the right-hand side represent momentum changes due to transient (pulsatile) and convective accelerations, respectively. Transient accelerations are those related to velocity changes during a period of time (i.e. blood accelerates during systolic phase of the cardiac cycle). (4) Convective accelerations are those related to velocity changes with a change in position (i.e. fluid with constant flow rate accelerates as the conduit s cross-sectional area decreases). The third term is momentum loss due to viscous effects. Our lab has adapted this method to calculate CSF pulsatile pressure gradients in the upper cervical spine [17]. The assumptions of a rigid conduit and incompressible fluid are justified in the case of CSF flow in the cervical spinal canal. The CSF pressure gradient waveform is calculated from the velocity-encoded MRI images of the CSF pulsatile flow. The inertia component of the pressure gradient is approximated by the first order central difference templates of the time series images. The shear (viscous) component is derived by using a pair of second-order central difference operators. The shear and inertia components are summed to obtain a pressure gradient value for each time point of the cardiac cycle. Fig. (9) shows the MRI-derived CSF pressure gradient waveform from a healthy subject. The open circle curve shows the contribution of the viscous term to the total pressure gradient. It is important to note that the overall contribution of the viscous term is negligible. Several pathologies, particularly the inflammatory process, are associated with a change in the viscosity of the CSF. Because of the negligible contribution of the viscous term, a pathologic change in CSF viscosity is not expected to affect the CSF pressure gradient waveform. VALIDATION STUDIES 1. Validation Accuracy and Reproducibility of the ICV Measurement The volume of the entire intracranial space is on the order of 1500mL, the change in that volume during the cardiac cycle is on the order of 1 ml, less than 0.1%. Therefore, reproducible and accurate ICV measurement poses a challenge. The validity of the ICV measurement was assessed from studies in patients with pathologies that affect the ICV in a predictable manner, and the inherent accuracy was assessed with a specially designed craniospinal flow phantom [29]. These studies were necessary since currently there is no alternative method that could be used as a reference. Fig. (8). Left: The MRI derived Net transcranial volumetric flow rate waveform. Right: The Intra Cranial Volume Change during the cardiac cycle derived by integrating the net transcranial volumetric flow waveform on the left. Note that the maximal volume change in this subject is 0.5 ml.
.")
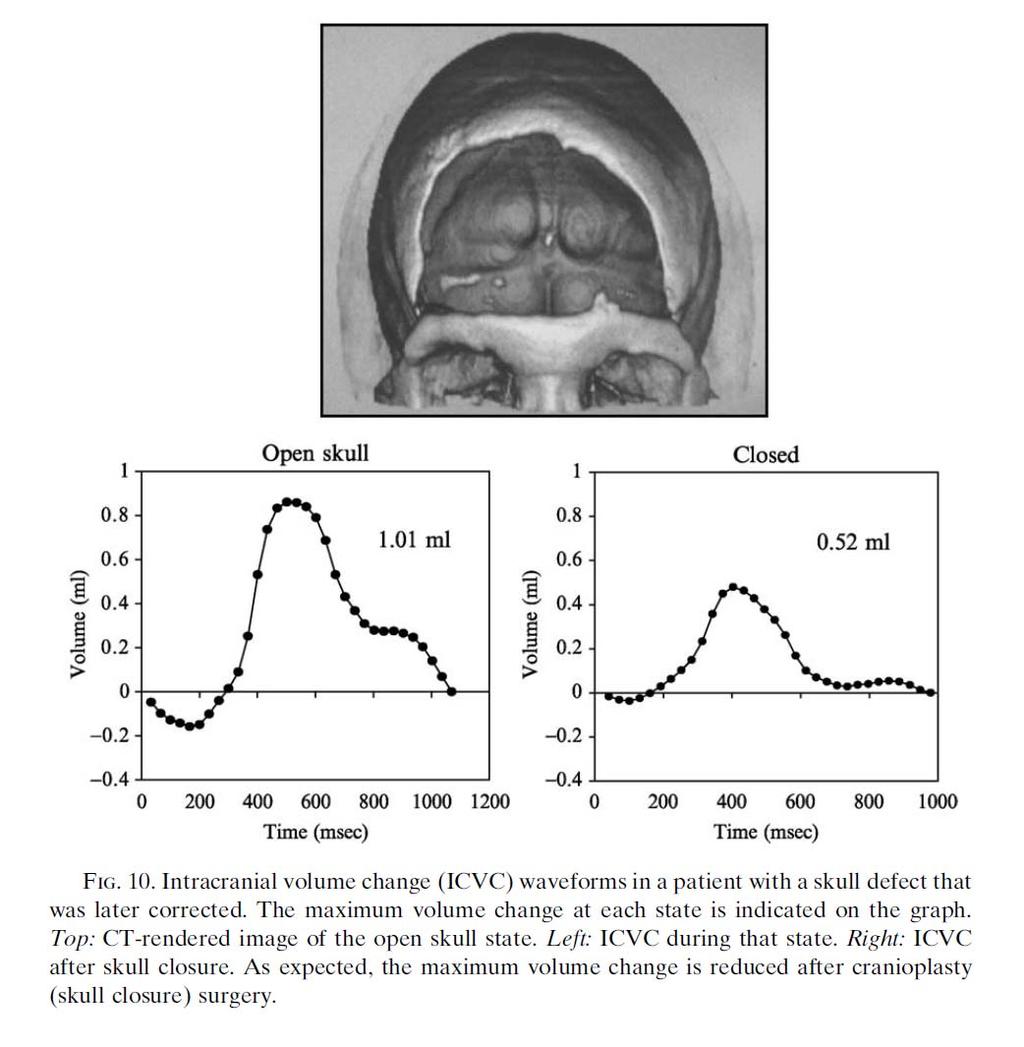
10 124 Current Medical Imaging Reviews, 2006, Vol. 2, No. 1 Alperin et al. Fig. (9). A. The MRI-derived CSF pressure gradient waveform from a healthy volunteer (filled). The open circles show the small contribution of the viscous term in the Navier-Stokes equation (eq. 1). Measurements in patients with a skull defect before and after corrective surgical procedure (cranioplasty) offered an opportunity to test the validity of the ICV measurement by MRI as a larger volume change is expected during the open skull state. In all 3 patients studied, a larger maximum ICV was measured before cranioplasty, as expected. The ICV waveforms measured before and after cranioplasty in one of these patients are shown in Fig. (10). The systolic ICV before and after surgery were 1.01 ml and 0.52 ml, respectively. Measurement results obtained in the cranioplasty patients supported the validity of the method but can not be used for assessment of the method accuracy since the true ICV value at the two states is unknown. Instead, the inherent accuracy of the method was determined using a specially built craniospinal flow phantom where the ICV value could be determined independently of the MRI-based method. A flow phantom composed of a nearly rigid container and tubes leading to and from the container were constructed to simulate the intracranial space and the arterial and venous flow channels [29]. The average, ICV, and oscillatory CSF volume (the volume that moves back and forth between the cranium and the spinal canal) were calculated and compared with independent measurements of these quantities. The intracranial volume change was measured independently of the MRI measurement by blocking the arterial and venous channels and deflecting the syringe to produce a pressure value equal to the pulse pressure recorded while the channels are open. Results from these measurements are summarized in Table 1. The average maximum ICV value measured by MRI was within 5% of the ICV value measured independently. The high reliability by which ICV is measured by MRI is attributed to the excellent temporal response of non-steady flow measurement with the cine phase contrast technique. The phantom experiments demonstrated high intrinsic accuracy and reproducibility of the method. In contrast to the phantom studies, early evaluation of measurement reproducibility in human subjects demonstrated a much larger measurement variability of 18% [17]. This rather large variability needed to be improved before the method could become clinically viable. The source of this variability was found to be a change in heart rate that often occurred between the two separate cine phase contrast scans used for imaging of the fast blood flow and the slow CSF flow. Two separate scans were used because scanning parameters needed to be adjusted for the measured velocity range. This problem was solved by the development of a new MRI data acquisition scheme, the dual velocity encoding scheme, which allows for simultaneous acquisition of fast and slow flow in an interleaved fashion [30]. With this technique, the CSF and the blood flow measurements are always synchronized-- regardless of a change in the patient s heart Fig. (10). Intracranial Volume change waveforms in a patient with a skull defect that was later corrected. The maximum volume change at each state is indicated on the graph. Left: CT rendered image of the open skull state. Middle: ICV during that state. Right: ICV after skull closure. As expected the maximum volume change is reduced after cranioplasty (skull closure) surgery.
 Std. Dev.")
11 A Review of Wavelet Denoising in MRI and Ultrasound Brain Imaging Current Medical Imaging Reviews, 2006, Vol. 2, No Table 1. Results from the Flow Phantom Study for the Validation of the IC Volume Change Measurement Accuracy and Reproducibility Mean Value (ml/cardiac cycle) Std. Dev. ml % SD Independent Measurement Intracranial Volume Change (5%) 2.0 +/- 0.1 Oscillatory CSF Volume (8%) /- 0.1 rate. A study comparing the ICV measurement variability in human subjects with the new and the previous MRI data acquisition techniques demonstrated overall improvement of 2.7 times in the reproducibility of the ICV measurement with the dual VENC MRI acquisition technique [30]. The current ICV measurement reproducibility in humans. 2. Validation Accuracy and Reproducibility of the ICP Change Measurement The intracranial pressure change during the cardiac cycle is derived from the change in the CSF pressure gradient. The relationship between time varying change in pressure and in pressure gradient was evaluated experimentally with a nonhuman primate [17] and theoretically with computational fluid dynamics (CFD) [31]. The experimental validation required the use of a large nonhuman primate (baboon) because hydrodynamics is scale-dependent and important fluid dynamic parameters such as the size of the spinal canal and heart rate in baboons are similar to those of humans. A MRI image of the cervical spine anatomy of a baboon demonstrating this similarity is shown in Fig. (11). Fig. (11). Anatomical sagittal 2D T1-weighted MR images of the cervical spine region of a baboon (left) and a human (right). The similarity between the cervical spinal anatomy of the baboon and the human is demonstrated. In the baboon validation study, pressures and CSF flow velocities were measured at three different ICP values (baseline, elevated, and reduced pressure) achieved by either addition or by withdrawal of fluid from the CSF space. The relationship between the amplitudes of the CSF pressure gradient measured by MRI, and the amplitude of the invasively measured pulse pressure at the three different values of absolute ICP was found to be close to a linear relationship. The relationship between the pulse pressure and the amplitude of the pressure gradient was also studied with CFD simulation [31]. In these simulations the spinal canal geometry was represented with two concentric cylinders and the calculations were based on the finite volume method to solve the Navier-Stokes equations. A nearly linear relationship was demonstrated between the pulse pressure and pulse pressure gradient calculated for two different boundary conditions, high and low flow rate, which correspond to high and low pulse pressure values. The reproducibility of the pressure change measurement by MRI is therefore determined by the reproducibility of the peak-to-peak amplitude of the CSF pressure gradient measurement. The CSF pressure gradient measurement reproducibility was assessed from repeated MRI scans of healthy subjects. A measurement variability of 8% was found in these studies [17]. The MRI-derived intracranial compliance and pressure (MR-ICP) are derived from the ratio of the pressure and volume changes. Therefore the overall MR-ICP measurement reproducibility is the square root of the sum of the square of individual fractional standard deviations, i.e., the fractional SD of the volume and the pressure change measurements, which are currently approximately 8% each. Therefore the overall MR-ICP measurement variability is approximately 10%. 3. Early Assessment of the MR-ICP Method Performance in Humans Direct comparison between MRI derived elastance index (the ratio of the pressure change to volume change) and mean ICP value measured invasively at the time of the MRI study in 5 patients demonstrated a linear relationship, as expected, with high degree of correlation (R 2 = 0.96) [17]. This linear relationship allows for expression of the MRIderived elastance index in units of absolute ICP value. The false positive rate of the method was determined by measurements in healthy subjects. A total of 71 simultaneous measurements of total CBF and ICP were performed in twenty three young adults (20 males, range 20 to 39, mean age 25 +/- 5 years) with no known neurological problems. The distribution of the MR-derived ICP values (MR-ICP) and TCBF measurements are shown in Fig. (12). ICP values range from 3.5 to 17.1 mmhg; most measurements were between 7 and 9 mmhg. Wide distribution of ICP values measured invasively in normal human subjects has been previously reported: from 2 to 16 mmhg in one study [32] and up to 18 mmhg in another [33]. Based on the current view that an ICP value of 20 mmhg is a critical threshold for

![elevated ICP [34], no false positives were measured with MRI (i.e., a zero-false positive rate). The distribution of MRI-derived TCBF measurements in the same subjects ranged from 514 to 956 ml/min.](/docs-images/85/92538121/images/12-1.jpg "It is interesting to note that the relative range of TCBF values span a much more narrow range than ICP. The percentage SD of the ICP and TCBF measurements are 31% and 13% respectively.")
12 126 Current Medical Imaging Reviews, 2006, Vol. 2, No. 1 Alperin et al. Fig. (12). The distribution of the MRI-derived ICP (MR-ICP) measurements (left) and the total CBF (right). The mean value and the relative standard deviation were and 9.6 ±31%, and 700 ml/min ±13%, respectively. Note that the ICP values are distributed over a wider range relative to the CBF values. elevated ICP [34], no false positives were measured with MRI (i.e., a zero-false positive rate). The distribution of MRI-derived TCBF measurements in the same subjects ranged from 514 to 956 ml/min. It is interesting to note that the relative range of TCBF values span a much more narrow range than ICP. The percentage SD of the ICP and TCBF measurements are 31% and 13% respectively. It is known that the blood flow to the brain is tightly regulated; a more narrow distribution of TCBF may reflect that degree of regulation. STUDYING THE EFFECT OF BODY POSTURE ON INTRACRANIAL PRESSURE AND CBF WITH MRI The cerebral biomechanical state is different in the upright and supine postures. The application of the MR-ICP methodology to study healthy subjects in supine and upright postures provides an insight into the coupling that exists between CSF and blood flow and the way by which intracranial compliance and pressure affect CSF and blood flow dynamics [35]. Ten healthy volunteers with no history of neurological problems or head trauma were imaged in both upright and supine positions in a vertical gap MRI scanner (Signa SP/i 0.5T, GE Healthcare, Milwaukee). The vertical gap allows the subject to be positioned seated upright. The MR-ICP scanning protocol was applied in both postures. An MR angiography technique (2D Time of Flight) was added to the MR-ICP protocol to visualize the cerebral venous drainage at the two postures. Representative 3D MR images of the neck veins at the two postures are shown in Fig. (13). These images demonstrate a different pattern of venous drainage between the supine and sitting postures. In the supine posture, the flow is primarily through the internal jugular veins (IJV) while in the upright posture, the IJV partially or fully collapse and the main pathway for venous outflow is the cervical venous plexus. Plots of the total arterial inflow and venous outflow waveforms from one of the subjects are shown in Fig. (14). Arterial inflow (open circles) and venous outflow (filled circles) during the cardiac cycle in the supine position are shown on the left and in the sitting position on the right. While the arterial volumetric flow rates are slightly lower in the sitting posture the overall shape (dynamics) and amplitude (the difference between the maximum and the minimum) in the two postures are similar. In contrast, the shape and the amplitude of the venous flow were different between the two postures; the venous flow is much less pulsatile in the upright position. Fig. (13). The 2DTOF MR images of the Veins (MRV) in the neck from one of the healthy subjects obtained in the upright (right) and supine (left) postures. Both jugular veins are visualized in the supine position while in the upright posture these veins are collapsed. The redistribution of the venous drainage in the upright posture to the epidural and vertebral veins is clearly demonstrated.
 and venous outflow (filled circles) volumetric flow waveforms during the cardiac cycle in a supine (left) and sitting (right) postures.")
13 A Review of Wavelet Denoising in MRI and Ultrasound Brain Imaging Current Medical Imaging Reviews, 2006, Vol. 2, No Fig. (14). MRI-based measurements of the arterial inflow (open circles) and venous outflow (filled circles) volumetric flow waveforms during the cardiac cycle in a supine (left) and sitting (right) postures. Note the slightly lower arterial flow rates in the sitting position. While the amplitude of the arterial waveform at the two postures are similar, the amplitude of the venous flow in significantly smaller (less pulsatile flow) at the upright posture, suggestive of higher cerebral vascular compliance. Plots of the measured CSF flow waveforms at the two postures are shown in Fig. (15). The CSF flow waveforms are plotted together with the net transcranial blood flow (arterial - venous) to demonstrate how the net blood flow drives the CSF flow. Note that the in the supine position, the CSF flow waveform follows the A-V flow waveform more closely - an indication of a lower intracranial compliance. The mean and SD of the derived measurements in the two postures are summarized in (Table 2). The differences in the measured parameters between the two postures are statistically significant. They include a 2-fold increase in the ICV, a 2-fold reduction in the CSF volume that moves in and out of the cranium, and a large increase (almost 3-fold) in the intracranial compliance with a corresponding decrease in pressure. All these changes are consistent with a more compliant intracranial compartment caused by a smaller mean volume of blood and CSF residing in the intracranial space in the sitting position. Another parameter strongly affected by posture is the net transcranial blood flow (A-V). The amplitude of the net transcranial blood flow is much larger in the sitting position than in the supine position. This is the result of the reduced pulsatility of venous outflow together with relatively unchanged arterial inflow dynamics. A larger net transcranial blood flow results in a larger volume of blood entering the cranium during systole. However, because the overall mean intracranial volume is smaller in the sitting position, the blood entering the cranium can be easily accommodated even with less CSF being displaced into the spinal canal. The combination of smaller amount of CSF that leaves the cranium with each cardiac cycle, and larger net transcranial inflow explains the larger ICV measured in the sitting position. Fig. (15). Graphs depicting the A-V and CSF flow waveforms in the supine (Left) and upright (Right) postures. Note that the CSF follows the A-V less closely in the upright posture compared to the supine posture.
14 128 Current Medical Imaging Reviews, 2006, Vol. 2, No. 1 Alperin et al. Table 2. Mean and SD of Main MRI-Derived Physiologic Parameters Measured in Supine and Upright Postures Supine (Mean +/- SD) Upright (Mean +/- SD) TCBF (ml/min) 825 +/ /- 127 Venous Flow in IJV (ml/min) 614 +/ /- 261 Osc. CSF Volume (ml) / /-.11 Max. ICV (ml) / /-.44 Compliance Index 7.3 +/ / ICP (mmhg) / / * All differences are statically significant with a P value of or smaller A commonly accepted explanation for a lower ICP in an upright posture argues that venous flow is increased in that position and this avoids compression of the jugular veins [36]. This explanation is clearly inaccurate since venous flow in the jugular veins is considerably lower in an upright posture [37]. The lower ICP is therefore, most likely, the result of the increased intracranial compliance due to a lower mean volume of the intracranial compartment caused by the reduced volume of CSF and blood. The shift of blood and CSF volume out of the cranium occurs during the transition from the supine to the upright posture. APPLICATION OF MR-ICP TO STUDY THE EFFECT OF DECOMPRESSION SURGERY IN CHIARI MALFORMATIONS Chiari I malformation is characterized by displacement of the cerebellar tonsils more than 5 mm caudally through the foramen magnum [38]. However, since no direct correlation has been observed between symptoms and the anatomical severity of the herniation the pathophysiology of the disease cannot be explained by the abnormal anatomy of the craniospinal junction alone. Even though the disease process is not well understood, decompression surgery is now commonly offered as a treatment of choice for patients with Chiari malformation. In order to better understand the effect of the decompression surgery on the intracranial physiology the MR method for measurement of intracranial compliance was applied to study 12 Chiari Malformation patients before and after decompression surgeries. Changes in CSF flow and cord motion in the upper cervical spine and in the overall intracranial compliance were measured and were evaluated for their significance [39]. Following surgery, changes were found, both, in the local CSF flow and cord motion and in intracranial compliance (ICC). However, only the change in ICC, an average increase of more than 60%, was statistically significant. An increased ICC, associated with improved outcome, was measured in 10 of the 12 patients, no significant change was found in one patient, and decreased ICC was measured in one patient whose symptoms persisted following surgery. Intracranial compliance was the most sensitive measure for the effect of the surgery and was the only parameter that reached statistical significance. The study provided evidence that intracranial compliance plays an important role in the pathophysiology of this disorder. OTHER POTENTIAL CLINICAL ROLES FOR THE MR-ICP METHOD Physiological parameters measured by the MRI-based method, e.g., total cerebral blood flow, intracranial compliance, and pressure, are potentially important for many neurological problems. They are especially important in traumatic brain injury (TBI) because it has been shown that TCBF and ICP are important markers for the progression of head trauma to secondary brain injury [40, 41]. The MRI method provides these parameters noninvasively. The role of MRI-based ICP measurement would be different from that of the invasive technique. While invasive monitoring provides continuous ICP measurements, the MRI study provides a single time point measurement and therefore it is a diagnostic test. There are several clinical settings in which a snapshot of ICP may be beneficial. Complementing neurological and CT exams in intermediate severity of head trauma may be one. Placement of an invasive monitor to track ICP continuously is recommended for patients with severe head injuries, defined as Glasgow Coma Scale (GCS) score = 3-8. However, the necessity of ICP monitoring for patients with intermediate GCS scores (9-12) and in particular, those with a normal CT scan on presentation has been the subject of much debate [42, 43]. Ten to thirty percent of these patients will develop increased ICP over the first few days after injury [44-46]. Invasive monitoring techniques are not routinely employed in this population. Yet, at the same time, it is not clear which of these patients will progress to an increased pressure state. Likewise, patients with diffuse axonal injury (DAI) may demonstrate a GCS score in the severe injury range but be found to have normal ICP upon placement of an invasive monitor. In these settings, noninvasive MR-ICP measurement would provide a means of objective assessment of the need for an invasive monitor without incurring the potential morbidities. MR-ICP may also play an important role in diagnosis and serial evaluation of several chronic disorders that may be associated with changes in ICP. Such processes include hydrocephalus, pseudotumor cerebri, intracranial mass lesions, and toxic-metabolic encephalopathy (where a depressed level of consciousness may or may not correspond to an increased ICP). Single time measurement of ICP may be helpful in the evaluation of patients with possible ventriculoperitoneal shunt malfunction particularly, young children who present with nonspecific complaints and/ or who are unable to communicate their symptoms. ACKNOWLEDGEMENTS Supported in part by the NIH/NIRR (RR ) and the Dana Foundation s Clinical Hypotheses Program in Imaging. REFERENCES [1] O Connel JEA. Vascular factor in intracranial pressure and maintenance of cerebrospinal fluid circulation. Brain 1943; 66: [2] Antoni N. Pressure curves from the cerebrospinal fluid. Acta Med Scand 1946; suppl 170: [3] Bering EA, Ingraham FD. Arterial pulsation of the cerebrospinal fluid. Trans Amer Neurol Assoc 1953; [4] Bering EA. Choroid plexus and arterial pulsations of cerebrospinal fluid. Arch Neurol Psychiat 1955; 73:
MRI MEASUREMENTS OF CRANIOSPINAL AND INTRACRANIAL VOLUME CHANGE IN HEALTHY AND HEAD TRAUMA CASES
 1of 4 MRI MEASUREMENTS OF CRANIOSPINAL AND INTRACRANIAL VOLUME CHANGE IN HEALTHY AND HEAD TRAUMA CASES N. Alperin, Y. Kadkhodayan, B. Varadarajalu, C. Fisher, B. Roitberg Department of Radiology and Neurosurgery,
Estimation of CSF Flow Resistance in the Upper Cervical Spine
 NRJ Digital - The Neuroradiology Journal 3: 49-53, 2013 www.centauro.it Estimation of CSF Flow Resistance in the Upper Cervical Spine K-A. MARDAL 1, G. RUTKOWSKA 1, S. LINGE 1.2, V. HAUGHTON 3 1 Center
MR Advance Techniques. Vascular Imaging. Class II
 MR Advance Techniques Vascular Imaging Class II 1 Vascular Imaging There are several methods that can be used to evaluate the cardiovascular systems with the use of MRI. MRI will aloud to evaluate morphology
Non-Newtonian pulsatile blood flow in a modeled artery with a stenosis and an aneurysm
 Non-Newtonian pulsatile blood flow in a modeled artery with a stenosis and an aneurysm I. Husain, C. Langdon and J. Schwark Department of Mathematics Luther College University of Regina Regina, Saskatchewan
Mechanisms of Headache in Intracranial Hypotension
 Mechanisms of Headache in Intracranial Hypotension Stephen D Silberstein, MD Jefferson Headache Center Thomas Jefferson University Hospital Philadelphia, PA Stephen D. Silberstein, MD, FACP Director, Jefferson
CFD Challenge: Simulation of Hemodynamics in a Patient-Specific Aortic Coarctation Model
 CFD Challenge: Simulation of Hemodynamics in a Patient-Specific Aortic Coarctation Model Background Coarctation of the aorta (CoA) accounts for 8%-11% of congenital heart defects, affecting tens of thousands
Computer simulations created with CFD demonstrate
 Published April 26, 2012 as 10.3174/ajnr.A3047 ORIGINAL RESEARCH G. Rutkowska V. Haughton S. Linge K.-A. Mardal Patient-Specific 3D Simulation of Cyclic CSF Flow at the Craniocervical Region BACKGROUND
Mathematical Modeling of Craniospinal Hydrodynamics: Investigation of CSF Dynamics and Compliance Function
 University of Miami Scholarly Repository Open Access Dissertations Electronic Theses and Dissertations 202-0-03 Mathematical Modeling of Craniospinal Hydrodynamics: Investigation of CSF Dynamics and Compliance
Measurements of Intracranial Pressure and Compliance Index Using 1.5-T Clinical MRI Machine
 Tokai J Exp Clin Med., Vol. 39, No. 1, pp. 34-43, 214 Measurements of tracranial Pressure and Compliance dex Using 1.5-T Clinical MRI Machine Hideki ATSUMI *1, Mitsunori MATSUMAE *1, Akihiro HIRAYAMA *1
Body position and eerebrospinal fluid pressure. Part 2' Clinical studies on orthostatic pressure and the hydrostatic indifferent point
 Body position and eerebrospinal fluid pressure Part 2' Clinical studies on orthostatic pressure and the hydrostatic indifferent point BJORN MAGNAES, M.D. Department of Neurosurgery, Rikshospitalet, Oslo
Previous talks. Clinical applications for spiral flow imaging. Clinical applications. Clinical applications. Coronary flow: Motivation
 for spiral flow imaging Joao L. A. Carvalho Previous talks Non-Cartesian reconstruction (2005) Spiral FVE (Spring 2006) Aortic flow Carotid flow Accelerated spiral FVE (Fall 2006) 2007? Department of Electrical
Medical Management of Intracranial Hypertension. Joao A. Gomes, MD FAHA Head, Neurointensive Care Unit Cerebrovascular Center
 Medical Management of Intracranial Hypertension Joao A. Gomes, MD FAHA Head, Neurointensive Care Unit Cerebrovascular Center Anatomic and Physiologic Principles Intracranial compartments Brain 80% (1,400
Enhancement of Cranial US: Utility of Supplementary Acoustic Windows and Doppler Harriet J. Paltiel, MD
 Enhancement of Cranial US: Utility of Supplementary Acoustic Windows and Doppler Harriet J. Paltiel, MD Boston Children s Hospital Harvard Medical School None Disclosures Conventional US Anterior fontanelle
HEAD AND NECK IMAGING. James Chen (MS IV)
") HEAD AND NECK IMAGING James Chen (MS IV) Anatomy Course Johns Hopkins School of Medicine Sept. 27, 2011 OBJECTIVES Introduce cross sectional imaging of head and neck Computed tomography (CT) Review head
HEAD AND NECK IMAGING James Chen (MS IV) Anatomy Course Johns Hopkins School of Medicine Sept. 27, 2011 OBJECTIVES Introduce cross sectional imaging of head and neck Computed tomography (CT) Review head
Key personnel: Principal investigator: Francis Loth, Ph.D., Department of Mechanical Engineering, University of Akron, Akron, OH
 American Syringomyelia Alliance Project - Project Report Project Title: Importance of the Mechanical Forces in the Pathogenesis of Syringomyelia Key personnel: Principal investigator: Francis Loth, Ph.D.,
CEREBRO SPINAL FLUID ANALYSIS IN BRAIN TUMOUR
 CEREBRO SPINAL FLUID ANALYSIS IN BRAIN TUMOUR Sankar K 1, Shankar N 2, Anushya 3, ShymalaDevi 4, Purvaja 5 3,4,5 III Biomedical Student, Alpha college of Engineering, Chennai. kssankar10@yahoo.co.in 1,
Cerebrospinal fluid flow in the upper cervical canal in patients with the Chiari I malformation
 Cerebrospinal fluid flow in the upper cervical canal in patients with the Chiari I malformation Kent-Andre Mardal K. H. Støverud, S. Linge, G. Rutkowska, I. Drøsdal, H.P. Langtangen, V. Haughton Outline
A MODEL OF CEREBRAL BLOOD FLOW DURING SUSTAINED ACCELERATION. S. Cirovic 1 C. Walsh 2 W. D. Fraser 3
 16-l A MODEL OF CEREBRAL BLOOD FLOW DURING SUSTAINED ACCELERATION S. Cirovic 1 C. Walsh 2 W. D. Fraser 3 1. Institute for Aerospace Studies, University of Toronto, Ontario, Canada 2. Department of Mechanical
INTRACRANIAL PRESSURE -!!
 INTRACRANIAL PRESSURE - Significance raised ICP main cause of death in severe head injury main cause of morbidity in moderate and mild head injury main target and prognostic indicator in the ITU setting
MR Imaging with the CCSVI or Haacke protocol
 MR Imaging with the CCSVI or Haacke protocol Reports from the Haacke protocol are often made available to the patients. The report consists of four major components: 1. anatomical images of major neck
1 Normal Anatomy and Variants
 1 Normal Anatomy and Variants 1.1 Normal Anatomy MR Technique. e standard MR protocol for a routine evaluation of the spine always comprises imaging in sagittal and axial planes, while coronal images are
Cerebrospinal fluid hydrodynamics in type I Chari malformation
 Cerebrospinal fluid hydrodynamics in type I Chari malformation Nicholas Shaffer 1, Bryn Martin 2, Francis Loth 1 1 Departments of Mechanical Engineering and Biomedical Engineering, University of Akron,
Magnetic Resonance Angiography
 Magnetic Resonance Angiography 1 Magnetic Resonance Angiography exploits flow enhancement of GR sequences saturation of venous flow allows arterial visualization saturation of arterial flow allows venous
The influence of breathing on cerebrospinal fluid movement in the brain
 The influence of breathing on cerebrospinal fluid movement in the brain A computational study based on in vivo pressure measurements Vegard Vinje Simula Research Laboratory GA Ringstad ME Rognes PK Eide
1Pulse sequences for non CE MRA
 MRI: Principles and Applications, Friday, 8.30 9.20 am Pulse sequences for non CE MRA S. I. Gonçalves, PhD Radiology Department University Hospital Coimbra Autumn Semester, 2011 1 Magnetic resonance angiography
Neuro Quiz 29 Transcranial Doppler Monitoring
 Verghese Cherian, MD, FFARCSI Penn State Hershey Medical Center, Hershey Quiz Team Shobana Rajan, M.D Suneeta Gollapudy, M.D Angele Marie Theard, M.D Neuro Quiz 29 Transcranial Doppler Monitoring This
Medical University of Gdansk, Gdansk, Poland
 Increased inspiratory resistance alters the cardiac contribution to the dynamic relationship between blood pressure and pial artery pulsation oscillations in healthy subjects Pawel J. Winklewski 1, Jacek
A quantitative analysis of cerebrospinal fluid flow in post-traumatic syringomyelia
 Paraplegia (1995) 33, 203-207 1995 International Medical Society of Paraplegia All rights reserved 0031-1758/95 $9.00 A quantitative analysis of cerebrospinal fluid flow in post-traumatic syringomyelia
CNS pathology Third year medical students. Dr Heyam Awad 2018 Lecture 5: disturbed fluid balance and increased intracranial pressure
 CNS pathology Third year medical students Dr Heyam Awad 2018 Lecture 5: disturbed fluid balance and increased intracranial pressure ILOs Understand causes and symptoms of increased intracranial pressure.
A Magnetic Resonance Imaging Method for
 Journal of Cardiovascular Magnetic Resonance, 1(1), 59-64 (1999) INVITED PAPER Use of MRI in ASD Asessment A Magnetic Resonance Imaging Method for Evaluating Atrial Septa1 Defects Godtfred Holmvang Cardiac
CSF. Cerebrospinal Fluid(CSF) System
 System") Cerebrospinal Fluid(CSF) System By the end of the lecture, students must be able to describe Physiological Anatomy of CSF Compartments Composition Formation Circulation Reabsorption CSF Pressure Functions
Cerebrospinal Fluid(CSF) System By the end of the lecture, students must be able to describe Physiological Anatomy of CSF Compartments Composition Formation Circulation Reabsorption CSF Pressure Functions
CFD Analysis of Pulsatile Flow and Non-Newtonian Behavior of Blood in Arteries
 Copyright 2015 Tech Science Press MCB, vol.12, no.1, pp.37-47, 2015 CFD Analysis of Pulsatile Flow and Non-Newtonian Behavior of Blood in Arteries P. Jhunjhunwala,, P.M. Padole, and S.B. Thombre, Abstract:
ISSUES ON COMPUTATIONAL MODELING FOR COMPUTATION-AIDED DIAGNOSIS 臨床診断支援ツールのための計算力学モデリング
 ISSUES ON COMPUTATIONAL MODELING FOR COMPUTATION-AIDED DIAGNOSIS 臨床診断支援ツールのための計算力学モデリング Hao LIU Advanced Computer and Information Division, RIKEN 2-1, Hirosawa, Wako-shi, Saitama 351-0198 JAPAN e-mail:
Idiopathic intracranial hypertension, or pseudotumor cerebri, is
 ORIGINAL RESEARCH BRAIN MRI Evidence of Impaired CSF Homeostasis in Obesity- Associated Idiopathic Intracranial Hypertension N. Alperin, S. Ranganathan, A.M. Bagci, D.J. Adams, B. Ertl-Wagner, E. Saraf-Lavi,
Applicable Neuroradiology
 For the Clinical Neurology Clerkship LSU Medical School New Orleans Amy W Voigt, MD Clerkship Director Introduction The field of Radiology first developed following the discovery of X-Rays by Wilhelm Roentgen
Arteriovenous Graft Modeling and Hemodynamic Interpretation
 Open Journal of Fluid Dynamics, 2012, 2, 324-330 http://dx.doi.org/10.4236/ojfd.2012.24a040 Published Online December 2012 (http://www.scirp.org/journal/ojfd) Arteriovenous Graft Modeling and Hemodynamic
CPM Specifications Document Aortic Coarctation: Exercise
 CPM Specifications Document Aortic Coarctation: Exercise OSMSC 0091_2000 0102_2000 0107_0000 0111_0000 May 29, 2013 Version 1 Open Source Medical Software Corporation 2013 Open Source Medical Software
Meninges and Ventricles
 Meninges and Ventricles Irene Yu, class of 2019 LEARNING OBJECTIVES Describe the meningeal layers, the dural infolds, and the spaces they create. Name the contents of the subarachnoid space. Describe the
Introduction. Cardiac Imaging Modalities MRI. Overview. MRI (Continued) MRI (Continued) Arnaud Bistoquet 12/19/03
 MRI (Continued) Arnaud Bistoquet 12/19/03") Introduction Cardiac Imaging Modalities Arnaud Bistoquet 12/19/03 Coronary heart disease: the vessels that supply oxygen-carrying blood to the heart, become narrowed and unable to carry a normal amount
Introduction Cardiac Imaging Modalities Arnaud Bistoquet 12/19/03 Coronary heart disease: the vessels that supply oxygen-carrying blood to the heart, become narrowed and unable to carry a normal amount
PTA 106 Unit 1 Lecture 3
 PTA 106 Unit 1 Lecture 3 The Basics Arteries: Carry blood away from the heart toward tissues. They typically have thicker vessels walls to handle increased pressure. Contain internal and external elastic
Refinements in Mathematical Models to Predict Aneurysm Growth and Rupture
 Refinements in Mathematical Models to Predict Aneurysm Growth and Rupture RAMON BERGUER, a,b JOSEPH L. BULL, a,b AND KHALIL KHANAFER a a Vascular Mechanics Laboratory, Department of Biomedical Engineering,
In the spinal canal, oscillatory CSF flow results primarily from
 Published July 10, 2014 as 10.3174/ajnr.A4023 REVIEW ARTICLE Spinal Fluid Biomechanics and Imaging: An Update for Neuroradiologists V. Haughton and K.-A. Mardal ABSTRACT SUMMARY: Flow imaging with cardiac-gated
CVS Hemodynamics. Change in blood pressure:
 CVS Hemodynamics -The distribution of blood inside the circulation: The major part of blood volume is found in the venous system 60% (2/3), that s why veins are called the capacitance vessels. -Arteries
CPM Specifications Document Aortofemoral Normal:
 CPM Specifications Document Aortofemoral Normal: OSMSC 0110_0000 May 27, 2013 Version 1 Open Source Medical Software Corporation 2013 Open Source Medical Software Corporation. All Rights Reserved. 1. Clinical
Blood flow in vessels with artificial or pathological geometrical changes
 Blood flow in vessels with artificial or pathological geometrical changes P. Tibaut 1, B. Wiesler 1, M. Mayer 2 & R. Wegenkittel 3 1 AVL LIST GmbH, Graz, Austria 2 VRVIs, Vienna, Austria 3 Tiani Medgraph
Chiari Malformations. Google. Objectives Seventh Annual NKY TBI Conference 3/22/13. Kerry R. Crone, M.D.
 Chiari Malformations Kerry R. Crone, M.D. Professor of Neurosurgery and Pediatrics University of Cincinnati College of Medicine University of Cincinnati Medical Center Cincinnati Children s Hospital Medical
Brain Meninges, Ventricles and CSF
 Brain Meninges, Ventricles and CSF Lecture Objectives Describe the arrangement of the meninges and their relationship to brain and spinal cord. Explain the occurrence of epidural, subdural and subarachnoid
Intracranial Blood Pressure and Brain Vasculature
 Intracranial Blood Pressure and Brain Vasculature Sukruti Ponkshe Final Presentation REU Program, Summer 2006 August 3, 2006 Advisors: Professor Linninger Dr. Michalis Xenos Dr. Libin Zhang Laboratory
Using Computational Fluid Dynamics Model to Predict Changes in Velocity properties in Stented Carotid Artery
 Excerpt from the Proceedings of the COMSOL Conference 2010 Paris (COMSOL Conference) Using Computational Fluid Dynamics Model to Predict Changes in Velocity properties in Stented Carotid Artery Vaidehi
INCREASED INTRACRANIAL PRESSURE
 INCREASED INTRACRANIAL PRESSURE Sheba Medical Center, Acute Medicine Department Irene Frantzis P-Year student SGUL 2013 Normal Values Normal intracranial volume: 1700 ml Volume of brain: 1200-1400 ml CSF:
MR Flow Imaging in Vascular Malformations Using Gradient Recalled Acquisition
 637 MR Flow Imaging in Vascular Malformations Using Gradient Recalled Acquisition William M. Needell 1 Kenneth R. Maravilla Twenty patients with known or suspected intracranial vascular lesions were evaluated
Codes Requiring Authorization from MedSolutions (MSI): Updated 3/2014
: Updated 3/2014") s Requiring Authorization from MedSolutions (): Updated 3/2014 0042T Cerebral Perfusion Analysis using CT with contrast 0159T CAD, including computer algorithm analysis, BREAST MRI 0195T prepare interspace,
s Requiring Authorization from MedSolutions (): Updated 3/2014 0042T Cerebral Perfusion Analysis using CT with contrast 0159T CAD, including computer algorithm analysis, BREAST MRI 0195T prepare interspace,
Local Pulse Wave Velocity Estimation in the Carotids Using Dynamic MR Sequences
 J. Biomedical Science and Engineering, 25, 8, 227-236 Published Online April 25 in SciRes. http://www.scirp.org/journal/jbise http://dx.doi.org/.4236/jbise.25.8422 Local Pulse Wave Velocity Estimation
CVS Hemodynamics. Faisal I. Mohammed, MD,PhD.
 CVS Hemodynamics Faisal I. Mohammed, MD,PhD. Objectives point out the physical characteristics of the circulation: distribution of blood volume total cross sectional area velocity blood pressure List the
Head CT Scan Interpretation: A Five-Step Approach to Seeing Inside the Head Lawrence B. Stack, MD
 Head CT Scan Interpretation: A Five-Step Approach to Seeing Inside the Head Lawrence B. Stack, MD Five Step Approach 1. Adequate study 2. Bone windows 3. Ventricles 4. Quadrigeminal cistern 5. Parenchyma
Time-Spatial Labeling Inversion
 White Paper Time-Spatial Labeling Inversion Cerebrospinal Fluid Flow Evaluation Erin Kelly, PhD Clinical Marketing Scientist, MR Canon Medical Systems INTRODUCTION Impairment to the natural flow of cerebrospinal
Normal and Abnormal Cerebrospinal Fluid Dynamics Evaluated by Optimized Cine Phase-contrast MR Imaging
 Chin J Radiol 2000; 25: 191-195 191 ORIGINAL ARTICLE Normal and Abnormal Cerebrospinal Fluid Dynamics Evaluated by Optimized Cine Phase-contrast MR Imaging LUNG-HUI GIIANG 1,3 CHENG-YU CHEN 1 MING-YEN
Blood Flow Simulation toward Actual Application at Hospital
 THE 5 TH ASIAN COMPUTAITIONAL FLUID DYNAMICS BUSAN, KOREA, OCTOBER 27 ~ OCTOBER 30, 2003 Blood Flow Simulation toward Actual Application at Hospital Abstract R. Himeno 1 1. Advanced Center for Computing
CRITICAL THINKING QUESTIONS AND ANSWERS AND CYCLE 2 LAB EXAM TEMPLATE. There are two main mechanisms that work in conjunction to return the blood
 CRITICAL THINKING QUESTIONS AND ANSWERS AND CYCLE 2 LAB EXAM TEMPLATE There are two main mechanisms that work in conjunction to return the blood THE CARDIAC PUMP 1) The forward pull(vis a fronte) This
The Monro-Kellie hypothesis states that the sum of the
 ORIGINAL RESEARCH J. Kim N.A. Thacker P.A. Bromiley A. Jackson Prediction of the Jugular Venous Waveform Using a Model of CSF Dynamics BACKGROUND AND PURPOSE: We have previously reported a model of cerebral
Risk of Spaceflight-Induced Intracranial Hypertension / Vision Alterations
 Risk of Spaceflight-Induced Intracranial Hypertension / Vision Alterations Michael A. Williams The Sandra and Malcolm Berman Brain & Spine Institute, Baltimore, MD Adult Hydrocephalus Center Disclosures
Papers Arising from the Vertebral Artery Study
 Papers Arising from the Vertebral Artery Study 1. Brief Introduction to quaternions and framed vectors and their application to the description of anatomical movements. The mathematical description of
Hemodynamic Assessment. Assessment of Systolic Function Doppler Hemodynamics
 Hemodynamic Assessment Matt M. Umland, RDCS, FASE Aurora Medical Group Milwaukee, WI Assessment of Systolic Function Doppler Hemodynamics Stroke Volume Cardiac Output Cardiac Index Tei Index/Index of myocardial
Essentials of Clinical MR, 2 nd edition. 99. MRA Principles and Carotid MRA
 99. MRA Principles and Carotid MRA As described in Chapter 12, time of flight (TOF) magnetic resonance angiography (MRA) is commonly utilized in the evaluation of the circle of Willis. TOF MRA allows depiction
Design and Simulation of Blocked Blood Vessel for Early Detection of Heart Diseases
 Proceedings of the 215 2nd International Symposium on Physics and Technology of Sensors, 8-1th March, 215, Pune, India Design and Simulation of Blocked Blood Vessel for Early Detection of Heart Diseases
8th Annual NKY TBI Conference 3/28/2014
 Closed Head Injury: Headache to Herniation A N T H O N Y T. K R A M E R U N I V E R S I T Y O F C I N C I N N A T I B L U E A S H E M S T E C H N O L O G Y P R O G R A M Objectives Describe the pathological
The Chiari I malformation, defined by the aberrant position
 METHODOLOGIC PERSPECTIVES S. Hentschel K.-A. Mardal A.E. Løvgren S. Linge V. Haughton Characterization of Cyclic CSF Flow in the Foramen Magnum and Upper Cervical Spinal Canal with MR Flow Imaging and
The Arterial and Venous Systems Roland Pittman, Ph.D.
 The Arterial and Venous Systems Roland Pittman, Ph.D. OBJECTIVES: 1. State the primary characteristics of the arterial and venous systems. 2. Describe the elastic properties of arteries in terms of pressure,
COMPUTER SIMULATION OF BLOOD FLOW IN ARTERIES AFFECTED BY MULTIPLE ANEURYSM
 COMPUTER SIMULATION OF BLOOD FLOW IN ARTERIES AFFECTED BY MULTIPLE ANEURYSM H. GIRIJA BAI 1 and K.B. NAIDU 2 Department of Mathematics, Sathyabama University, Chennai-600 119, Tamil Nadu, India 1 girijanameprakash@gmail.com
Principles Arteries & Veins of the CNS LO14
 Principles Arteries & Veins of the CNS LO14 14. Identify (on cadaver specimens, models and diagrams) and name the principal arteries and veins of the CNS: Why is it important to understand blood supply
How I do it: Non Contrast-Enhanced MR Angiography (syngo NATIVE)
") Clinical How-I-do-it Cardiovascular How I do it: Non Contrast-Enhanced MR Angiography (syngo NATIVE) Manuela Rick, Nina Kaarmann, Peter Weale, Peter Schmitt Siemens Healthcare, Erlangen, Germany Introduction
Clinical How-I-do-it Cardiovascular How I do it: Non Contrast-Enhanced MR Angiography (syngo NATIVE) Manuela Rick, Nina Kaarmann, Peter Weale, Peter Schmitt Siemens Healthcare, Erlangen, Germany Introduction
Optimising your Doppler settings for an accurate PI. Alison McGuinness Mid Yorks Hospitals
 Optimising your Doppler settings for an accurate PI Alison McGuinness Mid Yorks Hospitals Applications Both maternal uterine and fetal circulations can be studied with doppler sonography Uterine arteries
Influence of Velocity Encoding and Position of Image Plane in Patients with Aortic Valve Insufficiency Using 2D Phase Contrast MRI
 Influence of Velocity Encoding and Position of Image Plane in Patients with Aortic Valve Insufficiency Using 2D Phase Contrast MRI M. Sc. Thesis Frida Svensson gussvefrh@student.gu.se Supervisors: Kerstin
Non Contrast MRA. Mayil Krishnam. Director, Cardiovascular and Thoracic Imaging University of California, Irvine
 Non Contrast MRA Mayil Krishnam Director, Cardiovascular and Thoracic Imaging University of California, Irvine No disclosures Non contrast MRA-Why? Limitations of CTA Radiation exposure Iodinated contrast
Guide to Small Animal Vascular Imaging using the Vevo 770 Micro-Ultrasound System
 Guide to Small Animal Vascular Imaging using the Vevo 770 Micro-Ultrasound System January 2007 Objectives: After completion of this module, the participant will be able to accomplish the following: Understand
Effects of Chiari Malformation on Cerebrospinal Fluid within the Spinal Canal
 Effects of Chiari Malformation on Cerebrospinal Fluid within the Spinal Canal BY WOJCIECH KALATA B.S., University of Illinois at Chicago, 1999 M.S., University of Illinois at Chicago, 2002 THESIS Submitted
A NONINVASIVE METHOD FOR CHARACTERIZING VENTRICULAR DIASTOLIC FILLING DYNAMICS
 A NONINVASIVE METHOD FOR CHARACTERIZING VENTRICULAR DIASTOLIC FILLING DYNAMICS R. Mukkamala, R. G. Mark, R. J. Cohen Haard-MIT Division of Health Sciences and Technology, Cambridge, MA, USA Abstract We
MOLINA HEALTHCARE OF MICHIGAN PRIOR AUTHORIZATION / PRE-SERVICE REVIEW GUIDE IMAGING CODES REQUIRING PRIOR AUTHORIZATION EFFECTIVE 1/1/2014
 70336 MRI MRI, temporomandibular joint(s) 70450 CT/CTA CT, head or brain; without contrast material 70460 CT/CTA CT, head or brain; with contrast material(s) 70470 CT/CTA CT, head or brain; without contrast
Which method is better to measure arterial stiffness; augmentation index, pulse wave velocity, carotid distensibility? 전북의대내과 김원호
 Which method is better to measure arterial stiffness; augmentation index, pulse wave velocity, carotid distensibility? 전북의대내과 김원호 Arterial stiffness Arterial stiffness is inversely related to arterial
CSF flow patterns have a relationship to the anatomy of the
 ORIGINAL RESEARCH S.O. Linge V. Haughton A.E. Løvgren K.A. Mardal H.P. Langtangen CSF Flow Dynamics at the Craniovertebral Junction Studied with an Idealized Model of the Subarachnoid Space and Computational
JlntSocPlastination, Vol4:16-22,
 JlntSocPlastination, Vol4:16-22, 1990 16 SECTIONAL ANATOMY: STANDARDIZED METHODOLOGY Alexander Lane, Coordinator of Anatomy and Physiology, Triton College, Visiting Associate Professor, University of Illinois
IN 1976, Hakim [1] proposed an important model of the
![IN 1976, Hakim [1] proposed an important model of the](/thumbs/81/84196360.jpg "IN 1976, Hakim [1] proposed an important model of the") IEEE TRANSACTIONS ON BIOMEDICAL ENGINEERING, VOL. 52, NO. 4, APRIL 2005 557 Pulsatile Cerebrospinal Fluid Dynamics in the Human Brain Andreas A. Linninger*, Cristian Tsakiris, David C. Zhu, Michalis Xenos,
IEEE TRANSACTIONS ON BIOMEDICAL ENGINEERING, VOL. 52, NO. 4, APRIL 2005 557 Pulsatile Cerebrospinal Fluid Dynamics in the Human Brain Andreas A. Linninger*, Cristian Tsakiris, David C. Zhu, Michalis Xenos,
Medical Neuroscience Tutorial Notes
 Medical Neuroscience Tutorial Notes Blood Supply to the Brain MAP TO NEUROSCIENCE CORE CONCEPTS 1 NCC1. The brain is the body's most complex organ. LEARNING OBJECTIVES After study of the assigned learning
Contents 1 Computational Haemodynamics An Introduction 2 The Human Cardiovascular System
 Contents 1 Computational Haemodynamics An Introduction... 1 1.1 What is Computational Haemodynamics (CHD)... 1 1.2 Advantages of CHD... 3 1.3 Applications in the Cardiovascular System... 4 1.3.1 CHD as
Project 1: Circulation
 Project 1: Circulation This project refers to the matlab files located at: http://www.math.nyu.edu/faculty/peskin/modsimprograms/ch1/. Model of the systemic arteries. The first thing to do is adjust the
Numerical simulations of fluid mechanical interactions between two abdominal aortic branches
 Korea-Australia Rheology Journal Vol. 16, No. 2, June 2004 pp. 75-83 Numerical simulations of fluid mechanical interactions between two abdominal aortic branches Taedong Kim, Taewon Seo* 1,2 and Abdul.I.
Simulations of the blood flow in the arterio-venous fistula for haemodialysis
 Acta of Bioengineering and Biomechanics Vol. 16, No. 1, 2014 Original paper DOI: 10.5277/abb140109 Simulations of the blood flow in the arterio-venous fistula for haemodialysis DANIEL JODKO*, DAMIAN OBIDOWSKI,
screening; including image post processing CT, heart; without contrast material; with Requires authorization
 0042T Cerebral perfusion analysis using CT; with ; including of parametric maps with determination of cerebral blood flow, cerebral blood volume, and mean transit time 74263 Computed tomographic (CT) colonography,
Magnetic Resonance Imaging. Basics of MRI in practice. Generation of MR signal. Generation of MR signal. Spin echo imaging. Generation of MR signal
 Magnetic Resonance Imaging Protons aligned with B0 magnetic filed Longitudinal magnetization - T1 relaxation Transverse magnetization - T2 relaxation Signal measured in the transverse plane Basics of MRI
Brain AVM with Accompanying Venous Aneurysm with Intracerebral and Intraventricular Hemorrhage
 Cronicon OPEN ACCESS EC PAEDIATRICS Case Report Brain AVM with Accompanying Venous Aneurysm with Intracerebral and Intraventricular Hemorrhage Dimitrios Panagopoulos* Neurosurgical Department, University
Modeling the Interaction between Intracranial Pressure and Cerebral Hemodynamics
 Modeling the Interaction between Intracranial Pressure and Cerebral Hemodynamics Master s Thesis in Biomedical Engineering Zhaleh Pirzadeh Department of Signals and Systems Division of Signal Processing
The Effect of Craniotomy on the Intracranial Hemodynamics and Cerebrospinal Fluid Dynamics in Humans
 ISSN 362-1197, Human Physiology, 28, Vol. 34, No. 3, pp. 299 35. Pleiades Publishing, Inc., 28. Original Russian Text Yu.E. Moskalenko, G.B. Weinstein, T.I. Kravchenko, S.V. Mozhaev, V.N. Semernya, A.
A computational fluid dynamics simulation study of coronary blood flow affected by graft placement
 Interactive CardioVascular and Thoracic Surgery 19 (2014) 16 20 doi:10.1093/icvts/ivu034 Advance Access publication 22 April 2014 ORIGINAL ARTICLE ADULTCARDIAC A computational fluid dynamics simulation
Diagnosis of Middle Cerebral Artery Occlusion with Transcranial Color-Coded Real-Time Sonography
 Diagnosis of Middle Cerebral Artery Occlusion with Transcranial Color-Coded Real-Time Sonography Kazumi Kimura, Yoichiro Hashimoto, Teruyuki Hirano, Makoto Uchino, and Masayuki Ando PURPOSE: To determine
Numerical Simulation of Blood Flow through Asymmetric and Symmetric Occlusion in Carotid Artery
 Proceedings of the 3 rd International Conference on Fluid Flow, Heat and Mass Transfer (FFHMT 16) Ottawa, Canada May 2 3, 2016 Paper No. 170 Numerical Simulation of Blood Flow through Asymmetric and Symmetric
Stroke & Neurovascular Center of New Jersey. Jawad F. Kirmani, MD Director, Stroke and Neurovascular Center
 Stroke & Neurovascular Center of New Jersey Jawad F. Kirmani, MD Director, Stroke and Neurovascular Center Past, present and future Past, present and future Cerebral Blood Flow Past, present and future
Simulating the Motion of Heart Valves Under Fluid Flows Induced by Cardiac Contraction
 Simulating the Motion of Heart Valves Under Fluid Flows Induced by Cardiac Contraction Eann A. Patterson Department of Mechanical Engineering, The University of Sheffield Mappin Street, Sheffield, S1 3JD
NANOS Patient Brochure
 NANOS Patient Brochure Pseudotumor Cerebri Copyright 2016. North American Neuro-Ophthalmology Society. All rights reserved. These brochures are produced and made available as is without warranty and for
Adult Echocardiography Examination Content Outline
 Adult Echocardiography Examination Content Outline (Outline Summary) # Domain Subdomain Percentage 1 2 3 4 5 Anatomy and Physiology Pathology Clinical Care and Safety Measurement Techniques, Maneuvers,
A Lumped-parameter Model of the Cerebrospinal System for Simulating. syringomyelia.
 A Lumped-parameter Model of the Cerebrospinal System for Simulating Syringomyelia Novak S. J. ELLIOTT 1,*, Duncan A. LOCKERBY 2, Andrew R. BRODBELT 3 * Corresponding author: Tel.: +61 (0)8 9266 3926; Fax: