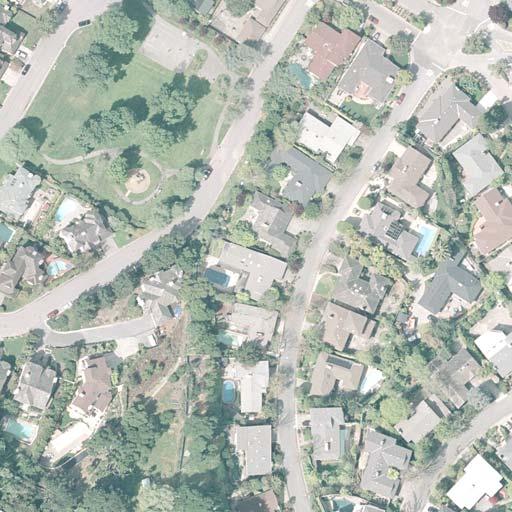
DRAFT. Figure 5.15: San Rafael Basin Workers, 2008
|
|
|
- Theresa Gibbs
- 5 years ago
- Views:
Transcription

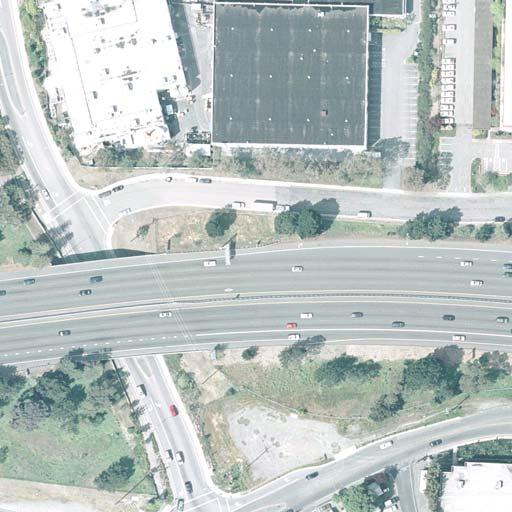
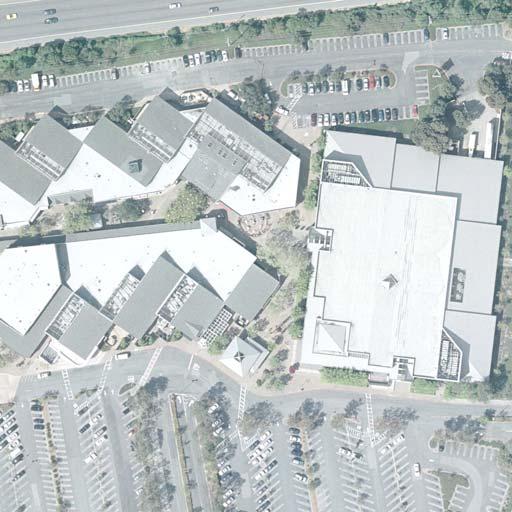
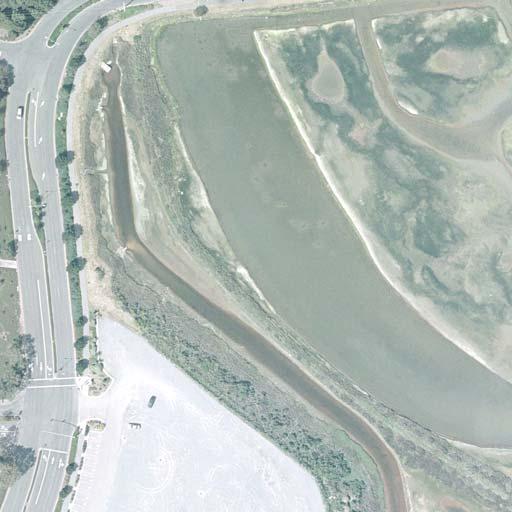
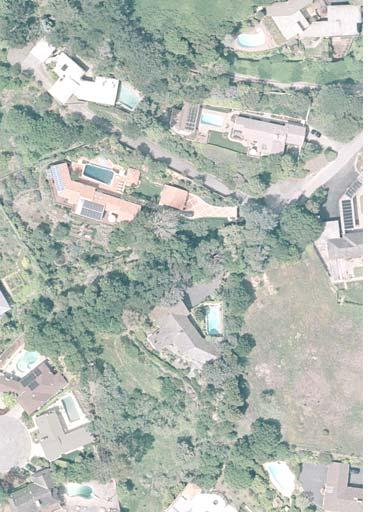
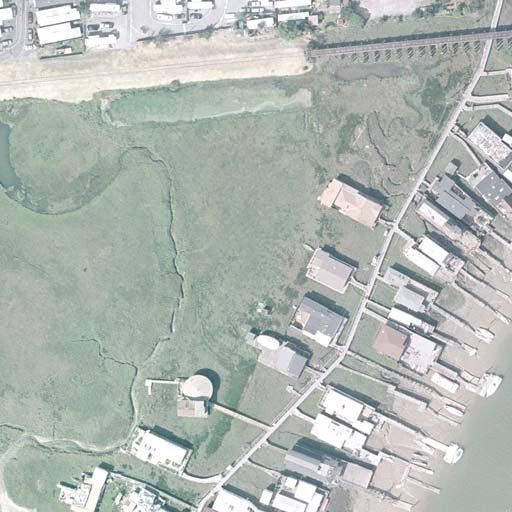
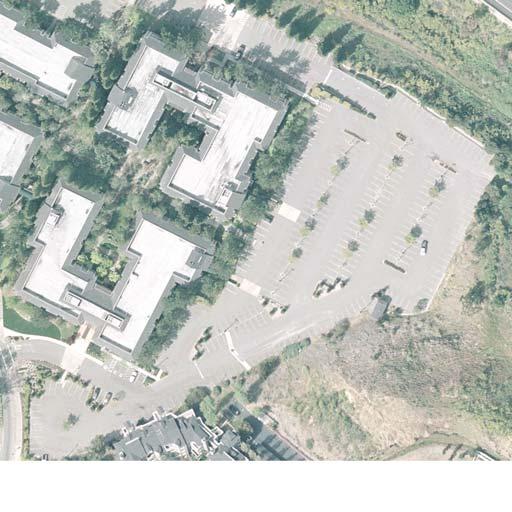
1 Figure 5.15: San Rafael Basin Workers, 2008 Central and Southern Marin Transit Study Page 67 of 87 Task 2: Existing Conditions Analysis Report v.7 12/23/08
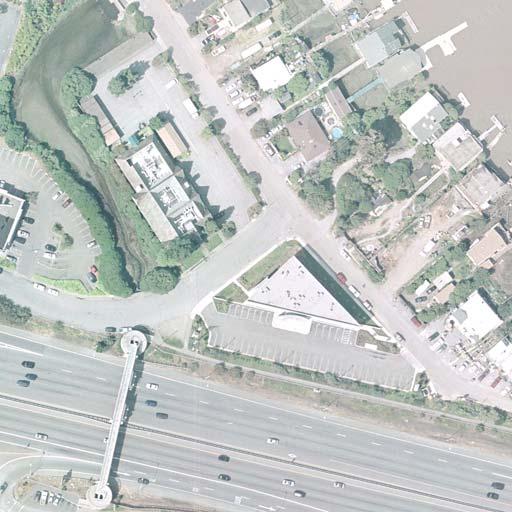
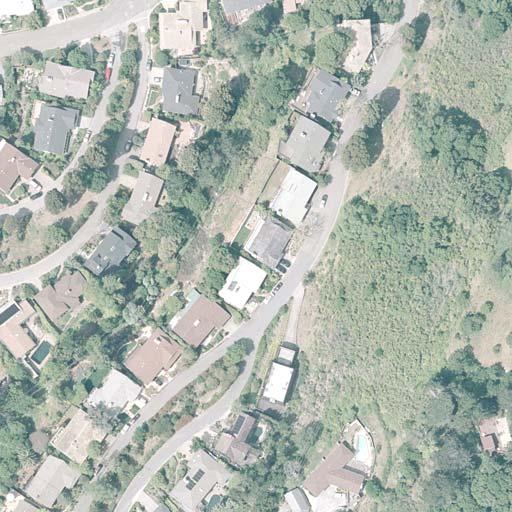
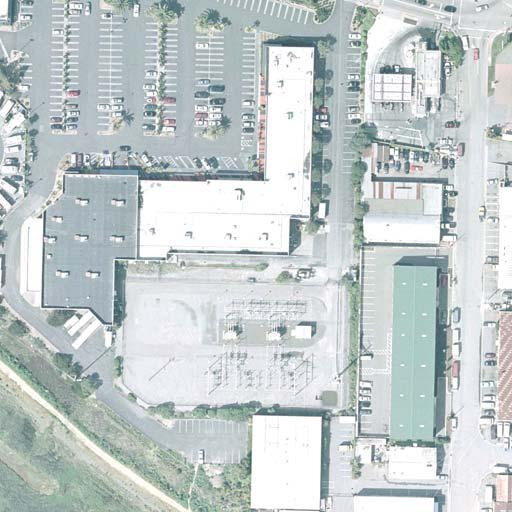
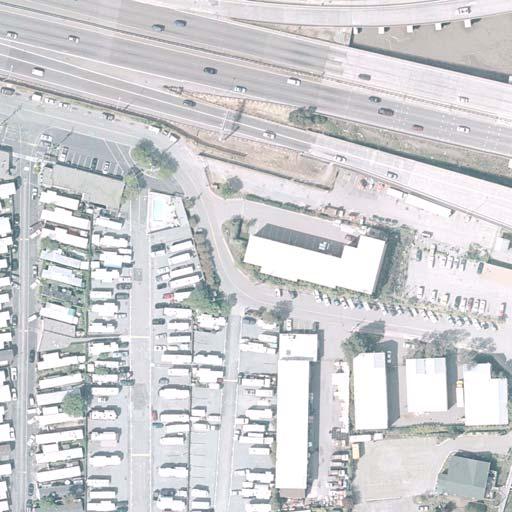
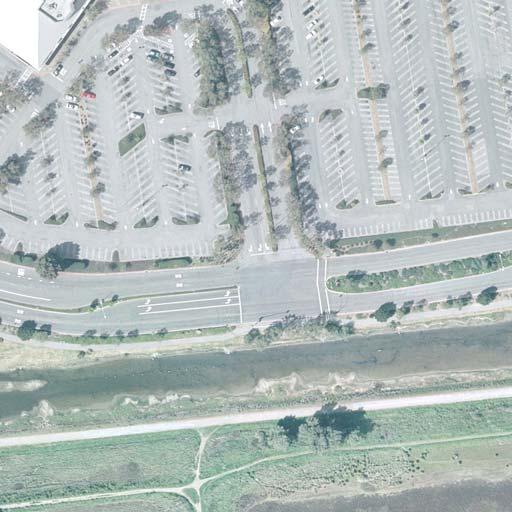
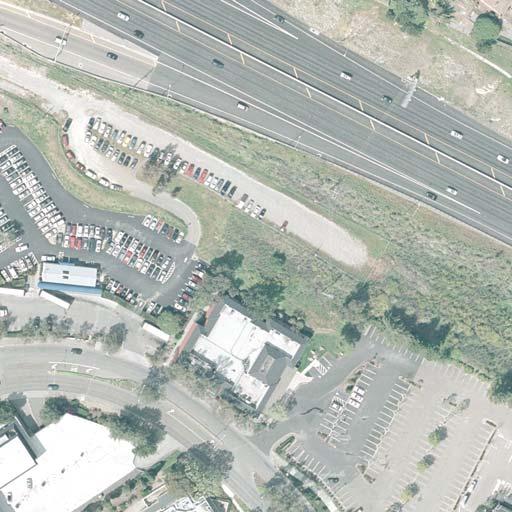
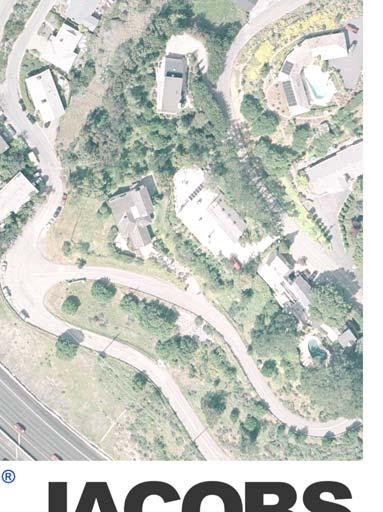
2 Figure 5.16: San Rafael Basin Workers, 2018 Central and Southern Marin Transit Study Page 68 of 87 Task 2: Existing Conditions Analysis Report v.7 12/23/08
3 The role of the Central San Rafael basin as the County s hub tends to result in a high proportion of trips remaining in the immediate area, as shown in Table 5.8. About 50 percent of the resident trips today are estimated to be doing this. The proportion of non-resident trip ends in this area is somewhat lower (38 percent for 2008) because of the role that this area plays as a major activity hub within Marin County. Central and Southern Marin Transit Study Page 69 of 87 Task 2: Existing Conditions Analysis Report v.7 12/23/08
4 Estimated Transit Trip Patterns and Mode Shares (To be inserted in final draft, following review of Rider Survey data available December 2008) Central and Southern Marin Transit Study Page 70 of 87 Task 2: Existing Conditions Analysis Report v.7 12/23/08
5 CHAPTER 6: SUMMARY OF TRANSIT RIDER PROFILES (TO BE PROVIDED UPON RIDER SURVEY COMPLETION) (To be inserted in final draft) Central and Southern Marin Transit Study Page 71 of 87 Task 2: Existing Conditions Analysis Report v.7 12/23/08
6 CHAPTER 7: KEY EXISTING CONDITIONS FINDINGS This chapter represents an initial summary of the key findings from the Task 2 Existing Conditions analysis. Some of the conclusions may be modified following input from the Management Steering Committee and feedback from individual agencies. The availability of the rider survey data will shape the analysis and conclusions of the transit hub and transfer needs, although important findings are already emerging in relation to park and ride/bus pad activity. EXISTING TRANSIT SERVICES: Golden Gate Transit 1. Majority of GGT bus routes serving Central and Southern Marin have experienced a decrease in annual ridership between 2004 and This trend may be explained by a ridership switch to ferry service, (ridership in AM peak has increased by 12 % between 2005 and 2007 and in the pm peak by 15% for the same period), by a general reduction in commute travel between Marin County and San Francisco, and a possible mode shift back to auto usage. 3. Recent ridership data collected in the last nine months suggests that ridership on GGT basic and Commute Routes is beginning to increase. 4. GGT bus on-time performance has improved in recent years, achieving the desired performance standard of 90% of all trips running on-time as scheduled. Schedules were adjusted with additional running time. Marin Transit 1. Only one Marin Transit route serving Central and Southern Marin is not achieving a desired productivity goal of 20 passengers per revenue hour. Route 19 carried 12 passengers per revenue hour in FY 2007/ Marin Transit local service on time performance has improved significantly in recent years. On time performance has increased from a 56% on time performance level reported in the 2006 Marin Transit Short Range Transit Plan to 95.3% reported in July and August Central and Southern Marin Transit Study Page 72 of 87 Task 2: Existing Conditions Analysis Report v.7 12/23/08
7 Planning Implications for Study The significance of transit in the service area will become more apparent when mode share data and transfer data becomes available. The latter will be available in the recent onboard passenger survey findings. From the initial findings of the existing conditions transit service overview: 1. Congestion along the Highway 101 Trunk and east/west corridors will continue to create on time performance challenges for both GGT and Marin Transit. Enhancements along the Highway 101 Trunk and east/west corridors should focus on improving bus running times to increase the attractiveness and travel time advantage of GGT Basic and Commute Routes. Running time enhancements will facilitate good on time performance without investing additional revenue hours. 2. Improved on time performance along the east/west corridors will become increasingly important to ensure good connectivity between local and commute services if BRT-type service is introduced along selected east/west corridors. TRANSIT HUB AND CORRIDOR FACILITIES: Hwy 101 facilities: 1. Current park and ride capacity, with the exception of Smith Ranch north of the Study Area, shows significant excess demand. 2. Locations with no formal parking especially bus pads in the Lucky Drive/Paradise and also at Shoreline/Manzanita generate significant overflow demand on adjacent surface streets. 3. Park and ride facilities are currently configured for the southbound commute, but in thefuture, demand forecasts suggest some provision for the northbound commute should be considered (applicable both to Golden Gate Transit and SMART) Key conclusions will also be finalized in the draft Task 2 report in relation to: transit center bus capacity East-West arterial corridor bus stops, and programmed/approved transit improvements TRAVEL FORECASTS AND TRANSIT DEMAND PROJECTIONS: 1. There is no significant slow-down in freeway travel time in the southbound AM peak period direction. This is partly the result of the traffic being restricted upstream in Central San Rafael. 2. There is an anticipated benefit on transit travel time in the northbound PM peak period with the completion of the gap closure project in January Today, there is at least a 7-minute delay for all northbound buses that cannot use the HOV lane. Central and Southern Marin Transit Study Page 73 of 87 Task 2: Existing Conditions Analysis Report v.7 12/23/08
8 3. The aggregate demand for travel is forecast as "slower growth" in the next decade. The total number of trip ends increases by less than 15 percent for both residents and for non-resident trip attractions in all cases. The reason is that much of the area has been "built out", with only small sites available for redevelopment. 4. The increases in demand tend to be to the north. While some growth is forecast to occur to/from San Francisco, the overall trend is to have more trips traveling northward in the future. Even with this shift, the overall demand of travel is not going to shift significantly. CORRIDOR PROFILES: 1. The five East-West Study Corridors all show stable population and employment levels over the next ten years, with growth of less than 3% over the entire decade. 2. Corridor population densities are broadly in line with, or somewhat below, the current level of local service provision (30-minute peak/60 minute off-peak fixed route service). 3. Regional and local mobility needs exist to destinations beyond each corridor, and beyond the County, on all travel corridors: these may require transit service in future, irrespective of low residential or employment densities and land uses which support local transit services. 4. Opportunities for significant land use change towards densities, which might support higher capacity transit (such as streetcar), appear limited in the next ten years; this is especially apparent in the Mill Valley-Sausalito corridor. 5. The regional commute demand in the non-traditional direction (northbound, Sonoma employment destinations) suggests a need to better define in the subsequent tasks of the Study, the optimal transit connections between the East West corridors and the 101 trunk line/smart services northwards, in addition to the primary southbound/san Francisco direction. Central and Southern Marin Transit Study Page 74 of 87 Task 2: Existing Conditions Analysis Report v.7 12/23/08
9 APPENDIX A: EXHIBITS AND TABLES Central and Southern Marin Transit Study Page 75 of 87 Task 2: Existing Conditions Analysis Report v.7 12/23/08
10 Figure 1: Highway 101 Greenbrae/Twin Cities Corridor Improvements: Southbound Option C Northbound Option E Central and Southern Marin Transit Study Page 56 of 59 Task 2: Existing Conditions Analysis Report Working v.1 12/1/08


11 T R AF D
12 Table 5.1 Work Trip Patterns of Richardson Bay Communities Richardson Bay Residents going to work in: San Mateo 1,083 2% 1,129 2% 46 4% Santa Clara 413 1% 430 1% 17 4% Alameda County 1,959 4% 2,044 4% 85 4% Contra Costa 1,134 2% 1,184 2% 50 4% Solano County 584 1% 622 1% 38 7% Napa County 334 1% 356 1% 21 6% Embarcadero/Financial District 8,900 18% 9,198 17% 298 3% Marina/ Van Ness/Civic Center 545 1% 581 1% 36 7% Richmond/Sunset 937 2% 980 2% 43 5% Mission/ Bay View/ Excelsior 2,347 5% 2,534 5% 187 8% Petaluma 21 0% 90 0% % Rest of Sonoma County 77 0% 334 1% % Sonoma Hwy 101 Corridor 89 0% 384 1% % Richardson Bay Communities 4,630 9% 4,785 9% 156 3% Lower Ross Valley 5,862 12% 5,712 10% % San Rafael Basin 7,807 15% 8,602 16% % West Marin 1,065 2% 1,145 2% 80 8% Las Gallinas Valley 5,124 10% 5,367 10% 243 5% Novato 6,671 13% 8,203 15% 1,532 23% Upper Ross Valley 1,261 2% 1,229 2% -31-2% Total % Richardson Bay Employees coming from their homes in: San Mateo 202 1% 187 1% -14-7% Santa Clara 147 1% 131 0% % Alameda County 811 3% 849 3% 38 5% Contra Costa 1,539 6% 1,644 6% 104 7% Solano County 735 3% 1,032 4% % Napa County 15 0% 17 0% 2 10% Embarcadero/Financial District 445 2% 461 2% 16 4% Marina/ Van Ness/Civic Center 180 1% 181 1% 0 0% Richmond/Sunset 309 1% 307 1% -2-1% Mission/ Bay View/ Excelsior 490 2% 532 2% 41 8% Petaluma 402 2% 496 2% 94 23% Rest of Sonoma County 1,997 7% 2,680 9% % Sonoma Hwy 101 Corridor 1,192 4% 1,237 4% 46 4% Richardson Bay Communities 4,630 17% 4,785 16% 156 3% Lower Ross Valley 2,415 9% 2,487 8% 71 3% San Rafael Basin 2,870 11% 3,257 11% % West Marin 1,023 4% 1,083 4% 60 6% Las Gallinas Valley 2,141 8% 2,341 8% 200 9% Novato 3,369 13% 3,787 13% % Upper Ross Valley 1,744 7% 1,773 6% 30 2% Total 26,658 29,266 26,09 10% Source: Marin County Travel Model Central and Southern Marin Transit Study Page 77 of 87 Task 2: Existing Conditions Analysis Report v.7 12/23/08
13 Table 5.2 Aggregate Trip Patterns of Richardson Bay Communities Richardson Bay Residence Trips Going to: San Mateo 3,023 2% 3,847 2% % Santa Clara 901 0% 1,306 1% % Alameda County 2,624 1% 3,052 2% % Contra Costa 1,576 1% 1,868 1% % Solano County 1,015 1% 1,308 1% % Napa County 559 0% 627 0% 68 12% Embarcadero/Financial District 17,599 9% 20,385 10% 2,786 16% Marina/ Van Ness/Civic Center 3,593 2% 4,452 2% % Richmond/Sunset 2,715 1% 3,307 2% % Mission/ Bay View/ Excelsior 3,667 2% 4,303 2% % Petaluma 5,135 3% 7,915 4% 2,780 54% Rest of Sonoma County 160 0% 422 0% % Sonoma Hwy 101 Corridor 126 0% 423 0% % Richardson Bay Communities 86,338 46% 88,609 44% 2,271 3% Lower Ross Valley 21,571 11% 19,612 10% -1,959-9% San Rafael Basin 17,089 9% 18,049 9% 960 6% West Marin 2,429 1% 2,674 1% % Las Gallinas Valley 7,234 4% 7,446 4% 212 3% Novato 8,376 4% 9,748 5% 1,372 16% Upper Ross Valley 2,505 1% 2,446 1% -60-2% Total 188, ,799 13,563 7% Richardson Bay Non-Residence Trips Coming from: San Mateo 1,856 1% 1,471 1% % Santa Clara 370 0% 302 0% % Alameda County 1,208 1% 1,179 1% -30-2% Contra Costa 1,822 1% 1,874 1% 52 3% Solano County 1,152 1% 1,355 1% % Napa County 27 0% 27 0% 0 0% Embarcadero/Financial District 3,004 2% 2,525 2% % Marina/ Van Ness/Civic Center 2,988 2% 2,464 2% % Richmond/Sunset 2,165 2% 1,800 1% % Mission/ Bay View/ Excelsior 1,451 1% 1,323 1% % Petaluma 456 0% 538 0% 82 18% Rest of Sonoma County 2,032 1% 2,707 2% % Sonoma Hwy 101 Corridor 1,196 1% 1,241 1% 44 4% Richardson Bay Communities 86,338 62% 88,609 62% 2,271 3% Lower Ross Valley 9,821 7% 10,486 7% 666 7% San Rafael Basin 7,298 5% 8,150 6% % West Marin 3,051 2% 3,026 2% -25-1% Las Gallinas Valley 3,939 3% 4,107 3% 169 4% Novato 5,407 4% 5,735 4% 328 6% Upper Ross Valley 3,323 2% 3,445 2% 122 4% Total 138, ,364 3,459 2% Source: Marin County Travel Model Central and Southern Marin Transit Study Page 78 of 87 Task 2: Existing Conditions Analysis Report v.7 12/23/08
14 Table 5.3 Work Trip Patterns of Lower Ross Valley Lower Ross Valley Residents going to work in: San Mateo 566 2% 588 2% 21 4% Santa Clara 213 1% 222 1% 9 4% Alameda County 1,022 4% 1,062 4% 40 4% Contra Costa 591 2% 615 2% 24 4% Solano County 159 1% 173 1% 14 9% Napa County 108 0% 117 0% 10 9% Embarcadero/Financial District 4,642 18% 4,778 17% 136 3% Marina/ Van Ness/Civic Center 284 1% 302 1% 18 6% Richmond/Sunset 489 2% 509 2% 20 4% Mission/ Bay View/ Excelsior 1,224 5% 1,316 5% 92 7% Petaluma 11 0% 47 0% % Rest of Sonoma County 40 0% 173 1% % Sonoma Hwy 101 Corridor 46 0% 199 1% % Richardson Bay Communities 2,415 9% 2,487 9% 71 3% Lower Ross Valley 3,056 12% 2,968 10% -89-3% San Rafael Basin 4,072 15% 4,468 16% % West Marin 557 2% 595 2% 39 7% Las Gallinas Valley 2,675 10% 2,789 10% 114 4% Novato 3,476 13% 4,257 15% % Upper Ross Valley 658 3% 639 2% -19-3% Total 26,305 28,303 1,998 8% Lower Ross Valley Employees coming from their homes in: San Mateo 257 1% 226 1% % Santa Clara 198 1% 164 0% % Alameda County 1,028 3% 1,013 3% -15-1% Contra Costa 2,018 6% 1,996 6% -22-1% Solano County 1,052 3% 1,055 3% 3 0% Napa County 251 1% 251 1% 0 0% Embarcadero/Financial District 560 2% 548 2% -12-2% Marina/ Van Ness/Civic Center 228 1% 216 1% -12-5% Richmond/Sunset 393 1% 368 1% -25-6% Mission/ Bay View/ Excelsior 620 2% 632 2% 12 2% Petaluma 747 2% 715 2% -32-4% Rest of Sonoma County 3,279 9% 3,558 10% 279 9% Sonoma Hwy 101 Corridor 1,464 4% 1,452 4% -12-1% Richardson Bay Communities 5,862 17% 5,712 16% % Lower Ross Valley 3,056 9% 2,968 8% -89-3% San Rafael Basin 3,618 10% 3,856 11% 238 7% West Marin 1,294 4% 1,290 4% -4 0% Las Gallinas Valley 2,703 8% 2,780 8% 77 3% Novato 4,248 12% 4,486 13% 238 6% Upper Ross Valley 2,214 6% 2,122 6% -91-4% Total 35,092 35, % Source: Marin County Travel Model Central and Southern Marin Transit Study Page 79 of 87 Task 2: Existing Conditions Analysis Report v.7 12/23/08
15 Table 5.4 Aggregate Trip Patterns of Lower Ross Valley Lower Ross Valley Residence Trips Going to: San Mateo 948 1% 1,156 1% % Santa Clara 391 0% 562 1% % Alameda County 1,454 1% 1,780 2% % Contra Costa 833 1% 1,028 1% % Solano County 661 1% 1,114 1% % Napa County 343 0% 421 0% 78 23% Embarcadero/Financial District 6,062 6% 6,733 6% % Marina/ Van Ness/Civic Center 753 1% 943 1% % Richmond/Sunset 783 1% 924 1% % Mission/ Bay View/ Excelsior 1,449 1% 1,633 2% % Petaluma 992 1% 1,697 2% % Rest of Sonoma County 94 0% 236 0% % Sonoma Hwy 101 Corridor 69 0% 224 0% % Richardson Bay Communities 9,821 10% 10,486 10% 666 7% Lower Ross Valley 39,121 40% 38,993 37% % San Rafael Basin 19,331 20% 20,606 20% 1,275 7% West Marin 1,106 1% 1,240 1% % Las Gallinas Valley 4,908 5% 5,082 5% 174 4% Novato 4,928 5% 5,613 5% % Upper Ross Valley 4,029 4% 4,108 4% 80 2% Total 98, ,578 6,503 7% Lower Ross Valley Non-Residence Trips Coming from: San Mateo 1,000 1% 772 1% % Santa Clara 410 0% 322 0% % Alameda County 1,633 1% 1,481 1% % Contra Costa 2,382 2% 2,272 2% % Solano County 1,444 1% 1,359 1% -85-6% Napa County 366 0% 351 0% -14-4% Embarcadero/Financial District 1,516 1% 1,271 1% % Marina/ Van Ness/Civic Center 1,239 1% 988 1% % Richmond/Sunset 1,099 1% 902 1% % Mission/ Bay View/ Excelsior 996 1% 921 1% -76-8% Petaluma 829 1% 774 1% -56-7% Rest of Sonoma County 3,332 3% 3,596 3% 264 8% Sonoma Hwy 101 Corridor 1,472 1% 1,457 1% -15-1% Richardson Bay Communities 21,571 18% 19,612 17% -1,959-9% Lower Ross Valley 39,121 33% 38,993 34% % San Rafael Basin 16,786 14% 16,854 15% 68 0% West Marin 2,542 2% 2,451 2% -90-4% Las Gallinas Valley 6,754 6% 6,329 5% % Novato 7,949 7% 7,653 7% % Upper Ross Valley 7,348 6% 7,161 6% % Total 119, ,520-4,270-4% Source: Marin County Travel Model Central and Southern Marin Transit Study Page 80 of 87 Task 2: Existing Conditions Analysis Report v.7 12/23/08
16 Table 5.5 Work Trip Patterns of Upper Ross Valley Upper Ross Valley Residents going to work in: San Mateo 670 2% 768 2% 99 15% Santa Clara 258 1% 294 1% 36 14% Alameda County 1,214 4% 1,392 4% % Contra Costa 703 2% 807 2% % Solano County 48 0% 56 0% 9 18% Napa County 31 0% 38 0% 7 23% Embarcadero/Financial District 5,518 17% 6,262 17% % Marina/ Van Ness/Civic Center 339 1% 397 1% 59 17% Richmond/Sunset 581 2% 668 2% 87 15% Mission/ Bay View/ Excelsior 1,460 5% 1,735 5% % Petaluma 16 0% 68 0% % Rest of Sonoma County 1,197 4% 871 2% % Sonoma Hwy 101 Corridor 241 1% 383 1% % Richardson Bay Communities 2,870 9% 3,257 9% % Lower Ross Valley 3,618 11% 3,856 10% 238 7% San Rafael Basin 4,860 15% 5,903 16% 1,043 21% West Marin 662 2% 784 2% % Las Gallinas Valley 3,179 10% 3,660 10% % Novato 4,184 13% 5,699 15% 1,516 36% Upper Ross Valley 777 2% 829 2% 52 7% Total 32,426 37,729 5,303 16% Upper Ross Valley Employees coming from their homes in: San Mateo 54 1% 48 1% -6-11% Santa Clara 32 0% 30 0% -2-7% Alameda County 225 3% 220 3% -5-2% Contra Costa 369 5% 394 5% 25 7% Solano County 205 3% 330 4% % Napa County 8 0% 10 0% 2 26% Embarcadero/Financial District 119 2% 117 2% -2-2% Marina/ Van Ness/Civic Center 50 1% 47 1% -3-6% Richmond/Sunset 85 1% 80 1% -6-7% Mission/ Bay View/ Excelsior 135 2% 137 2% 2 1% Petaluma 59 1% 98 1% 40 67% Rest of Sonoma County 465 7% 635 9% % Sonoma Hwy 101 Corridor 140 2% 217 3% 77 55% Richardson Bay Communities 1,261 18% 1,229 17% -31-2% Lower Ross Valley % 639 9% -19-3% San Rafael Basin % % 52 7% West Marin 279 4% 278 4% -1 0% Las Gallinas Valley 579 8% 597 8% 18 3% Novato % % 53 6% Upper Ross Valley 473 7% 455 6% -18-4% Total 6,884 7, % Source: Marin County Travel Model Central and Southern Marin Transit Study Page 81 of 87 Task 2: Existing Conditions Analysis Report v.7 12/23/08
17 Table 5.6 Aggregate Trip Patterns of Upper Ross Valley Upper Ross Valley Residence Trips Going to: San Mateo 601 1% 702 1% % Santa Clara 260 0% 355 0% 94 36% Alameda County 957 1% 1,117 1% % Contra Costa 583 1% 701 1% % Solano County 396 1% 577 1% % Napa County 215 0% 250 0% 35 16% Embarcadero/Financial District 3,884 5% 4,128 5% 244 6% Marina/ Van Ness/Civic Center 362 0% 427 1% 65 18% Richmond/Sunset 463 1% 516 1% 53 11% Mission/ Bay View/ Excelsior 974 1% 1,065 1% 91 9% Petaluma 454 1% 772 1% % Rest of Sonoma County 67 0% 165 0% % Sonoma Hwy 101 Corridor 49 0% 158 0% % Richardson Bay Communities 3,323 5% 3,445 5% 122 4% Lower Ross Valley 7,348 10% 7,161 9% % San Rafael Basin 13,226 18% 13,915 18% 689 5% West Marin 3,744 5% 4,337 6% % Las Gallinas Valley 2,979 4% 3,051 4% 72 2% Novato 3,230 4% 3,714 5% % Upper Ross Valley 29,608 41% 29,916 39% 308 1% Total 72,722 76,473 3,750 5% Upper Ross Valley Non-Residence Trips Coming from: San Mateo 214 0% 172 0% % Santa Clara 93 0% 76 0% % Alameda County 373 1% 340 1% -33-9% Contra Costa 484 1% 485 1% 1 0% Solano County 363 1% 449 1% 86 24% Napa County 52 0% 47 0% -5-9% Embarcadero/Financial District 247 0% 219 0% % Marina/ Van Ness/Civic Center 175 0% 149 0% % Richmond/Sunset 185 0% 160 0% % Mission/ Bay View/ Excelsior 192 0% 184 0% -9-5% Petaluma 82 0% 116 0% 34 41% Rest of Sonoma County 479 1% 646 1% % Sonoma Hwy 101 Corridor 141 0% 218 0% 77 54% Richardson Bay Communities 2,505 5% 2,446 5% -60-2% Lower Ross Valley 4,029 8% 4,108 8% 80 2% San Rafael Basin 5,907 11% 6,133 12% 226 4% West Marin 3,905 7% 4,083 8% 178 5% Las Gallinas Valley 1,448 3% 1,413 3% -35-2% Novato 1,815 3% 1,798 3% -17-1% Upper Ross Valley 29,608 57% 29,916 56% 308 1% Total 52,296 53, % Source: Marin County Travel Model Central and Southern Marin Transit Study Page 82 of 87 Task 2: Existing Conditions Analysis Report v.7 12/23/08
18 Table 5.7 Work Trip Patterns of San Rafael Basin San Rafael Basin Residents going to work in: San Mateo 408 2% 419 2% 10 3% Santa Clara 157 1% 160 1% 3 2% Alameda County 740 4% 758 4% 19 3% Contra Costa 428 2% 440 2% 11 3% Solano County 153 1% 162 1% 10 6% Napa County 94 0% 99 0% 6 6% Embarcadero/Financial District 3,357 18% 3,412 17% 54 2% Marina/ Van Ness/Civic Center 206 1% 215 1% 10 5% Richmond/Sunset 354 2% 363 2% 10 3% Mission/ Bay View/ Excelsior 885 5% 939 5% 54 6% Petaluma 8 0% 33 0% % Rest of Sonoma County 28 0% 122 1% % Sonoma Hwy 101 Corridor 32 0% 140 1% % Richardson Bay Communities 1,744 9% 1,773 9% 30 2% Lower Ross Valley 2,214 12% 2,122 10% -91-4% San Rafael Basin 2,943 15% 3,186 16% 243 8% West Marin 403 2% 425 2% 22 6% Las Gallinas Valley 1,931 10% 1,989 10% 58 3% Novato 2,511 13% 3,031 15% % Upper Ross Valley 473 2% 455 2% -18-4% Total 19,068 20,245 1,177 6% San Rafael Basin Employees coming from their homes in: San Mateo 339 1% 333 1% -6-2% Santa Clara 272 1% 245 0% % Alameda County 1,370 3% 1,528 3% % Contra Costa 2,674 6% 3,005 5% % Solano County 742 2% 1,035 2% % Napa County 1,094 2% 1,197 2% 103 9% Embarcadero/Financial District 750 2% 828 2% 79 11% Marina/ Van Ness/Civic Center 304 1% 324 1% 20 7% Richmond/Sunset 522 1% 550 1% 28 5% Mission/ Bay View/ Excelsior 829 2% 960 2% % Petaluma 1,130 2% 1,148 2% 18 2% Rest of Sonoma County 5,123 11% 5,851 11% % Sonoma Hwy 101 Corridor 2,489 5% 2,486 5% -3 0% Richardson Bay Communities 7,807 16% 8,602 16% % Lower Ross Valley 4,072 8% 4,468 8% % San Rafael Basin 4,860 10% 5,903 11% 1,043 21% West Marin 1,726 4% 1,950 4% % Las Gallinas Valley 3,621 7% 4,230 8% % Novato 5,702 12% 6,857 13% 1,156 20% Upper Ross Valley 2,943 6% 3,186 6% 243 8% Total 48,368 54,688 6,320 13% Source: Marin County Travel Model Central and Southern Marin Transit Study Page 83 of 87 Task 2: Existing Conditions Analysis Report v.7 12/23/08
19 Table 5.8 Aggregate Trip Patterns of San Rafael Basin San Rafael Basin Residence Trips Going to: Area Change Percent Change San Mateo 1,046 1% 1,344 1% % Santa Clara 530 0% 845 1% % Alameda County 1,924 1% 2,646 2% % Contra Costa 1,149 1% 1,607 1% % Solano County 486 0% 1,098 1% % Napa County 205 0% 290 0% 86 42% Embarcadero/Financial District 6,634 5% 7,858 5% 1,224 18% Marina/ Van Ness/Civic Center 691 1% 899 1% % Richmond/Sunset 816 1% 1,011 1% % Mission/ Bay View/ Excelsior 1,644 1% 2,005 1% % Petaluma 948 1% 1,686 1% % Rest of Sonoma County 1,352 1% 1,074 1% % Sonoma Hwy 101 Corridor 304 0% 475 0% % Richardson Bay Communities 7,298 6% 8,150 5% % Lower Ross Valley 16,786 13% 16,854 11% 68 0% San Rafael Basin 65,942 50% 73,923 49% 7,981 12% West Marin 1,349 1% 1,600 1% % Las Gallinas Valley 10,508 8% 11,313 8% 806 8% Novato 6,783 5% 9,746 6% 2,963 44% Upper Ross Valley 5,907 4% 6,133 4% 226 4% Total 132, ,556 18,252 14% San Rafael Basin Non-Residence Trips Coming from: San Mateo 1,168 1% 1,009 1% % Santa Clara 696 0% 584 0% % Alameda County 2,629 2% 2,601 1% -29-1% Contra Costa 3,411 2% 3,616 2% 206 6% Solano County 1,047 1% 1,302 1% % Napa County 1,178 1% 1,273 1% 94 8% Embarcadero/Financial District 1,518 1% 1,480 1% -38-2% Marina/ Van Ness/Civic Center 1,085 1% 993 1% -91-8% Richmond/Sunset 1,106 1% 1,045 1% -60-5% Mission/ Bay View/ Excelsior 1,156 1% 1,242 1% 86 7% Petaluma 1,309 1% 1,288 1% -20-2% Rest of Sonoma County 5,247 3% 5,952 3% % Sonoma Hwy 101 Corridor 2,508 1% 2,500 1% -8 0% Richardson Bay Communities 17,089 10% 18,049 10% 960 6% Lower Ross Valley 19,331 11% 20,606 11% 1,275 7% San Rafael Basin 65,942 38% 73,923 40% 7,981 12% West Marin 3,456 2% 3,756 2% 300 9% Las Gallinas Valley 15,951 9% 16,246 9% 294 2% Novato 14,769 8% 15,507 8% 739 5% Upper Ross Valley 13,226 8% 13,915 7% 689 5% Total 173, ,888 13,066 8% Source: Marin County Travel Model Central and Southern Marin Transit Study Page 84 of 87 Task 2: Existing Conditions Analysis Report v.7 12/23/08
Northern Rivers Public Transport Commuter Bus Plan
 Lismore Sustainable Transport Group Commuter Bus Plan 2016 TRANSPORT DEVELOPMENT PROJECT REPORT Northern Rivers Public Transport Commuter Bus Plan Northern Rivers Social Development Council ABN: 77 398
Public Workshop. June 5, Halton Region Transportation Master Plan 2031 The Road to Change December 1,
 Public Workshop June 5, 2010 Halton Region Transportation Master Plan 2031 The Road to Change December 1, 2009 1 1 What We Want to Achieve Today Obtain feedback on opportunities to move people and goods
Policy Research CENTER
 TRANSPORTATION Policy Research CENTER Value of Travel Time Knowingly or not, people generally place economic value on their time. Wage workers are paid a rate per hour, and service providers may charge
Subject G. DEVELOPMENTS IN DREDGING TECHNOLOGY. 1. Dredging Equipment 2. Disposal Equipment
 Section VI VII VIII Subject b. Scheme II - Closest Aquatic Seaward (Table VI-lO) c. Scheme III - Ocean Dusposal (Table VI-II) d. Scheme IV - Land Disposal (Table VI-12) e. Scheme V - Delta Island Reclamation
Update on the Transit Proposals
 Update on the Transit Proposals Trent Lethco, Arup MTTF MEETING #9 2013-09-20 1 Agenda Short-Term Transit Proposal Ongoing analyses Recap Feedback Mid/Long-Term Transit Proposal Recap Feedback Next Steps
Most recently amended on January 12, 2010 by resolution 10-R Originally adopted on September 6, 1977, by Resolution No. 77-R-5705.
 CIRCULATION Most recently amended on January 12, 2010 by resolution 10-R-12725. Originally adopted on September 6, 1977, by Resolution No. 77-R-5705. Table of Contents Overview... 103... 113 CIR 1 Circulation
Corte Madera Sales Tax Measure B
 Corte Madera Sales Tax Measure B JANUARY 16, 2018 PRESENTED BY: TODD CUSIMANO, TOWN MANAGER DARIA CARRILLO, FINANCE DIRECTOR PETER BROWN, PUBLIC WORKS DIRECTOR SALES TAX MEASURE BACKGROUND In 2013, the
MARIN CLEAN ENERGY ADDENDUM NO. 5 TO THE REVISED COMMUNITY CHOICE AGGREGATION IMPLEMENTATION PLAN AND STATEMENT OF INTENT
 MARIN CLEAN ENERGY ADDENDUM NO. 5 TO THE REVISED COMMUNITY CHOICE AGGREGATION IMPLEMENTATION PLAN AND STATEMENT OF INTENT TO ADDRESS MCE EXPANSION TO CONTRA COSTA COUNTY; THE CITIES OF CONCORD, MARTINEZ,
Attachment E, Exhibit 1 Los Vaqueros Reservoir Recreation Model
 Attachment E, Exhibit 1 Los Vaqueros Reservoir Recreation Model Proposition 1 February 2018 This page is intentionally left blank. LOS VAQUEROS RESERVOIR EXISTING DAY-USE FACILITIES Parking Equestrian/
The Home Stretch: Issues and Areas of Agreement MTTF MEETING #
 The Home Stretch: Issues and Areas of Agreement MTTF MEETING #11 2013-11-22 1 Agenda MTTF Work Program Status Outstanding Issues Areas of Agreement Next Steps 2 Work Program Status MTTF Meeting #11 2013-11-22
Congestion Management Process 2013 Update
 CORRIDOR ANALYSIS AND STRATEGY IDENTIFICATION Corridor Analysis Process The CMP recommends an action of conducting an inventory of the corridor system to identify availability of existing options. To achieve
Matrix of Strong Local Smokefree Multi-Unit Housing Ordinances
 Matrix of Strong Local Smokefree Multi-Unit Housing Ordinances February 2019 Cities and counties in California have led the way on many secondhand smoke issues throughout the years by passing groundbreaking
Halton Region Transportation Master Plan 2031 The Road to Change December 1,
 Halton Region Transportation Master Plan 2031 The Road to Change December 1, 2009 1 1 Public Information Centre No. 1 March 2010 Halton Region Transportation Master Plan 2031 The Road to Change December
Matrix of Strong Local Smokefree Multi-Unit Housing
 Matrix of Strong Local Smokefree Multi-Unit Housing April 2017 Cities and counties in California have led the way on many secondhand smoke issues throughout the years by passing groundbreaking local ordinances
MERA NEXT GEN SYSTEM
 1 MERA NEXT GEN SYSTEM SUBSEQUENT ENVIRONMENTAL IMPACT REPORT SCOPING MEETING May 31, 2018 2 MERA Member Agencies City of Belvedere Town of Corte Madera Town of Fairfax City of Larkspur City of Mill Valley
Public Hearing Summary Report
 Public Hearing Summary Report SH 288 Direct Connectors To the Texas Medical Center Area City of Houston Harris County, Texas CSJ: 0598-01-095 Prepared for Texas Department of Transportation- Houston District
Michigan Avenue Corridor Study. Joint Policy / Technical Committee Meeting Wednesday, May 11, 2016
 Michigan Avenue Corridor Study Joint Policy / Technical Committee Meeting Wednesday, May 11, 2016 Agenda 1. Welcome and Introductions 2. Project Update 3. Recap from April Joint Committee Meetings 4. Public
PURSUING A WAYNE-WASHTENAW TRANSIT STRATEGY
 PURSUING A WAYNE-WASHTENAW TRANSIT STRATEGY Drafted by Motor City Freedom Riders Design & Illustration by Idrees Mutahr www.motorcityfreedomriders.org March 2018 WHY WAYNE-WASHTENAW? In the November 2016
IH 820 SOUTHEAST CORRIDOR STUDY
 IH 820 SOUTHEAST CORRIDOR STUDY IH 820 from IH 20 to Meadowbrook Drive IH 20 from Forest Hill Drive to Kelly Elliott Road US 287 from Bishop Street to Sublett Road February 2017 Project Study Area IH 820
Sonoma County. Measures Up INDICATORS. Sonoma County. Economic Development Board. An Index of Sonoma County s Community and Economic Vitality
 Sonoma County Economic Development Board INDICATORS Sonoma County Measures Up 23 An Index of Sonoma County s Community and Economic Vitality Presented in partnership with the Sonoma County Workforce Investment
SCOPE OF WORK TASK 1 BASE MAPPING
 SCOPE OF WORK TASK 1 BASE MAPPING Kittelson & Associates, Inc. (KAI) data collection and mapping efforts will be seamlessly linked to the analysis performed in the subsequent tasks. The KAI team will conduct
Photo by Tom Cochran
 Photo by Tom Cochran 2006 Kick-off meeting Outreach to Partners Growing the Network Acterra Alameda County Department of Agriculture Audubon California Audubon Canyon Ranch BAELIN Inc. Bay Area Open Space
The Great Recession 1-2 Punch of Credit Crisis and Consumer Retrenchment
 San Mateo County: Economy and Labor Supply Jon Haveman Chief Economist, BAC Economic Ins2tute May, 2012 The Great Recession 1-2 Punch of Credit Crisis and Consumer Retrenchment 6 GDP Growth (SAAR) and
Proposed Foxborough Service Pilot
 Proposed Foxborough Service Pilot Need and Opportunity Presented by Town of Foxborough Fiscal Management and Control Board July 31, 2017 1 Why the Foxborough Service Pilot? Transportation options in Foxborough
Taking on the Climate Change Challenge
 Taking on the Climate Change Challenge Tools Supporting Local Government Climate Action R. Alden Feldon Regional Projects Manager ICLEI - Local Governments for Sustainability www.iclei-usa.org May 15,
Lessons learned in multi-objective urban detention basin projects
 Lessons learned in multi-objective urban detention basin projects Raymond Wong, PhD, PE, LEED AP Patrick Sullivan, PE Bill Silva, PE Floodplain Management Association Conference September 6, 2017 Urban
Brian Bresolin Regional Analyst July 2014
 Brian Bresolin Regional Analyst www.sbcag.org State of the Commute Overview Existing Conditions Summary Commute Flows In/out-Commuting and Resident Worker Comparisons Daytime Population Mode of Transportation
CROSS VALLEY CONNECTOR GAP CLOSURE: I-5 to COPPER HILL DR. - FULL IMPROVEMENTS
 CROSS VALLEY CONNECTOR GAP CLOSURE: I-5 to COPPER HILL DR. - FULL IMPROVEMENTS Project Number: S11 Newhall Ranch Road from I-5 to Copper Hill Drive. This project will design and construct an extension
M E M O R A N D U M. Members of the Castro Valley Municipal Advisory Council
 M E M O R A N D U M October 4, 2016 TO: FROM: Members of the Castro Valley Municipal Advisory Council Medical Cannabis Interdepartmental Work Group MEETING DATE: October 10, 2016 SUBJECT: Medical Cannabis
Silicon Valley Housing and Economic Outlook
 White Paper Silicon Valley Housing and Economic Outlook Santa Clara County, San Mateo County Prepared by John Burns Real Estate Consulting for Pacific Union 11.5.2014 Santa Clara County The booming tech
APPENDIX B: REFERENCE LIST
 APPENDIX B: REFERENCE LIST 1 Arroyo Corte Madera del Presidio Corte Madera Creek Miller Creek Novato Creek Storm Water Pollution Prevention Program (MCSTOPPP) 1999 Ambient Monitoring Program 2 Corte Madera
CITY OF EL CERRITO HOUSING ELEMENT UPDATE. Community Workshop #1
 CITY OF EL CERRITO 2015 2023 HOUSING ELEMENT UPDATE Community Workshop #1 July 19, 2014 Agenda Introductions Presentation 1. Housing Element Overview 2. Regional Housing Needs Allocation (RHNA) 3. Key
Fee Study. Comparisons with other Bay Area Counties
 Fee Study Comparisons with other Bay Area Counties Fee Comparison Issues Comparisons between jurisdictions are limited or problematic, even if staff costs are equal, because: Fee structures vary Restaurant
Proposed Foxborough Service Pilot
 Proposed Foxborough Service Pilot Service Pilot Evaluation Recap and Additional Information MBTAFiscal Management and Control Board August 14, 2017 1 Proposed Foxborough Service Pilot: Background March
C/CAG. City/County Association of Governments Annual Report
 C/CAG City/County Association of Governments of San Mateo County 2006 Annual Report C/CAG CITY/COUNTY ASSOCIATION OF GOVERNMENTS OF SAN MATEO COUNTY Atherton Belmont Brisbane Burlingame Colma Daly City
Drug Policy Update. Misdemeanor marijuana arrests are skyrocketing. and other California marijuana enforcement disparities
 CENTER ON JUVENILE AND CRIMINAL JUSTICE Drug Policy Update NOVEMBER 2011 www.cjcj.org Misdemeanor marijuana arrests are skyrocketing and other California marijuana enforcement disparities by Mike Males,
Safeguarding Minority Civil Rights and Environmental Justice in Service Delivery and Reductions
 Safeguarding Minority Civil Rights and Environmental Justice in Service Delivery and Reductions Alla Reddy Thomas Chennadu, Alex Lu System Data & Research Operations Planning Presented at the 89 th Annual
 UNIVERSITY OF CALIFORNIA, BERKELEY 2020 LRDP FINAL EIR 11.2B REGIONAL & LOCAL AGENCY COMMENTS 11.2B.6 RESPONSE TO COMMENT LETTER B6 RESPONSE TO COMMENTS B6-1 THRU B6-3 See Thematic Response 8 for a comprehensive
PARSONS PHARMACY REDEVELOPMENT
 FOR SALE PARSONS PHARMACY REDEVELOPMENT 294 NW 2nd Avenue, Canby, OR 97013 RYAN IMBRIE MANAGING DIRECTOR ryan.imbrie@svn.com O: 503.28.9403 M: 503.705.7352 The information listed above has been obtained
North Tarrant Express Segments 2-4. Draft List of Facilities
 MASTER DEVELOPMENT PLAN NORTH TARRANT EXPRESS, SEGMENTS 2-4 North Tarrant Express Segments 2-4 Copyright 2010, NTE Mobility Partners 2-4, LLC Revision: 0 Revisions Effective Date: 3/30/10 Number Date Prepared
TECHNICAL APPENDIX. E. PMT Meeting #5
 TECHNICAL APPENDIX E. PMT Meeting #5 PMT Meeting #5 Agenda INT GLENWOOD ST & STATE ST STUDY, BOISE ITD PN A020(049), Key No. 20049 / ACHD PN 317045 October 26, 2017-10:00 AM to 12:00 PM ITD District 3
Transportation Sustainability Program
 Transportation Sustainability Program Photo: Sergio Ruiz Keeping people moving as our City grows ENHANCE TRANSPORTATION TO SUPPORT GROWTH November 2015 MODERNIZE ENVIRONMENTAL REVIEW March 2016 ENCOURAGE
California Department of Finance Demographic Research Unit
 Report E-5 Population and Housing Estimates for Cities, Counties, and the State, January 1, 2011-2014, with 2010 Benchmark Released: May 1, 2014 Table of Contents (links to internal worksheets) Counties
CREATED WITH LIFE IN MIND
 CREATED WITH LIFE IN MIND 2 3 Just across the Golden Gate Bridge and nestled in the lush green hills of Marin County California, Town Center Corte Madera reflects the natural beauty, affluence and lifestyle
WCCTAC BOARD September,
 WCCTAC BOARD September, 23 2016 I-80 SMART CORRIDOR RIBBON CUTTING SEPTEMBER 19, 2016 1 STATUS AND UPCOMING SCHEDULE Sequenced Activation (Go Live) July 13: Traffic Information Boards - Announcement Message
ParkScore. Youth Physical Activity. Outdoor Spaces & Buildings
 ParkScore Borrowed from the Trust for Public Land's framework, this index measures how well cities are meeting the community s park needs. Higher scores indicate better availability of and access to quality
Precursor Systems Analyses of Automated Highway Systems. Impact of AHS on Surrounding Non-AHS Roadways. DELCO Task I Page 1 RESOURCE MATERIALS
 DELCO Task I Page 1 Precursor Systems Analyses of Automated Highway Systems RESOURCE MATERIALS Impact of AHS on Surrounding Non-AHS Roadways U.S. Department of Transportation Federal Highway Administration
The Proposed Pilot Extension of MBTA Commuter Rail Service to Foxborough Response to Questions Posed by the Fiscal & Management Control Board
 The Proposed Pilot Extension of MBTA Commuter Rail Service to Foxborough Response to Questions Posed by the Fiscal & Management Control Board 1. Please provide the documents regarding the Fairmont Line
COMMUNITY OUTREACH. Chapter 7
 Chapter 7 COMMUNITY OUTREACH Community outreach has been considered an integral component of this project. While trauma care is a valued public good in San Francisco, it is also essential to provide information
Tuberculosis in Alameda County, 2009
 Tuberculosis in Alameda County, 29 Alameda County Public Health Department Tuberculosis Overview Tuberculosis (TB) is a communicable disease caused by the bacteria Mycobacterium tuberculosis. TB is spread
California 2,287, % Greater Bay Area 393, % Greater Bay Area adults 18 years and older, 2007
 Mental Health Whites were more likely to report taking prescription medicines for emotional/mental health issues than the county as a whole. There are many possible indicators for mental health and mental
C ALAMEDA D ALAMEDA D ALAMO C ALBANY D ALVISO E AMERICAN CANYON F ANTIOCH F ANTIOCH G APTOS G
 C 94501 ALAMEDA D 94502 ALAMEDA D 94507 ALAMO C 94706 ALBANY D 95002 ALVISO E 94503 AMERICAN CANYON F 94509 ANTIOCH F 94531 ANTIOCH G 95001 APTOS G 95003 APTOS B 94002 BELMONT D 94920 BELVEDERE TIBURON
Table of Contents. 2 P age. Susan G. Komen
 CALIFORNIA Table of Contents Table of Contents... 2 Introduction... 3 About... 3 Susan G. Komen Affiliate Network... 3 Purpose of the State Community Profile Report... 5 Quantitative Data: Measuring Breast
Measuring Variations in Private School Enrollment Rates Using ACS Estimates
 Measuring Variations in Private School Enrollment Rates Using ACS Estimates Magali Barbieri, Shelley Lapkoff, Jeanne Gobalet Lapkoff & Gobalet Demographic Research, Inc. www.demographers.com May 30, 2014
938 SAN PABLO AVENUE, ALBANY
 938 SAN PABLO AVENUE, ALBANY For Sale: Mixed-Use Property in High-Traffic Location LEASED INVESTMENT WITH OPPORTUNITY FOR OWNER OCCUPANCY PRICE: $1,300,000 (price/sqft: $326) CONTACT: Robert Loebl 510
State of the Region: A Broad Overview for Community Planning
 State of the Region: A Broad Overview for Community Planning Manuel Pastor, Director Center for Justice, Tolerance, and Community University of California, Santa Cruz Presented at: NII Cross-site sponsored
San Mateo North - Coastal
 San Mateo North - Coastal The San Mateo North Coastal planning area covers the northwest portion of San Mateo County outside the cities of Half Moon Bay, El Granada and Moss Beach. The eastern boundary
10 Noise 10.1 MEASUREMENT OF NOISE
 10 Noise The purpose of San Ramon s Noise Element is to set forth policies that regulate the ambient noise environment and protect residents from exposure to unacceptable noise levels. Noises vary widely
The Host Family Model in THP-Plus
 The Host Family Model in THP-Plus Web Seminar April 4, 2007,10 a.m. PST To hear the audio, dial: (605) 772-3434 And enter passcode: 214-505-209 THP-Plus Statewide Implementation Project CDSS John Burton
Proposed changes to immigration laws could cost California jobs, harm public health: Data tables
 December 2018 Proposed changes to immigration laws could cost California jobs, harm public health: Data tables Ninez A. Ponce, Laurel Lucia and Tia Shimada The following data tables contain state, regional
TRANSPORTATION MANAGEMENT ASSOCIATIONS CAN HELP YOU WITH OUTREACH DURING CONSTRUCTION MANAGEMENT
 TRANSPORTATION MANAGEMENT ASSOCIATIONS CAN HELP YOU WITH OUTREACH DURING CONSTRUCTION MANAGEMENT Penn State Transportation Engineering & Safety Conference December 7, 2017 What is a TMA? Non-profit organization
Cities and Counties on the Rise
 Every year, we see cities and counties across the state adopt policies to improve the health and wellness of their residents. These residents and their stories represent the real, tangible impact that
California Influenza Surveillance Project California Department of Public Health. Influenza Update
 California Influenza Surveillance Project California Department of Public Health 2008-2009 Influenza Update Influenza Surveillance for August 6 August 12, 2009 As the current H1N1 pandemic unfolds, CDPH
INTRODUCTION AND TABLE OF CONTENTS... Page 1
 1 California Gonorrhea Surveillance System (CGSS) Quarterly Summary Data Tables for Cases Diagnosed January 1 - December 31, 2009 and Graphs of Trends from 2007-09 for Selected Risk Factors and Subpopulations
SAN MATEO COUNTY CITY SELECTION COMMITTEE
 SAN MATEO COUNTY CITY SELECTION COMMITTEE Mary Ann Nihart, Chairperson Elizabeth Lewis, Vice Chairperson Mina Lim, Acting Secretary 400 County Center Redwood City, 94063 650-363-4124 TO: FROM: SUBJECT:
ATTITUDES, BELIEFS, AND TRANSPORTATION BEHAVIOR
 CHAPTER 6 ATTITUDES, BELIEFS, AND TRANSPORTATION BEHAVIOR Several studies were done as part of the UTDFP that were based substantially on subjective data, reflecting travelers beliefs, attitudes, and intentions.
The association of the built environment with how people travelled to work in Halton Region in 2006:
 The association of the built environment with how people travelled to work in Halton Region in 2006: a geographical area level analysis Halton Region Health Department September 25 2014 Author Fabio Cabarcas,
Comparison of Urban Transit Planning Responses to Pandemic Influenza. Rahul Gupta, MPA David Abramson, PhD MPH
 Comparison of Urban Transit Planning Responses to Pandemic Influenza Rahul Gupta, MPA David Abramson, PhD MPH NCDP Research Brief Vol 2007 Issue 1 Release Date: May 15, 2007 Comparison of Urban Transit
ALAMEDA COUNTY COMMUNITY DEVELOPMENT AGENCY PLANNING DEPARTMENT
 ALAMEDA COUNTY COMMUNITY DEVELOPMENT AGENCY PLANNING DEPARTMENT STAFF REPORT TO: Members of the Castro Valley Municipal Advisory Council MEETING DATE: September 12, 2016 RE: Draft Medical Cannabis Dispensary
HarGroup Management Consultants DRAFT SUB-REGIONAL TRANSIT FEASIBILITY STUDY SURVEY OF COMMUNITY RESIDENTS
 Sub-Regional Feasibility Study Survey of Community Residents DRAFT SUB-REGIONAL TRANSIT FEASIBILITY STUDY SURVEY OF COMMUNITY RESIDENTS (BLACK DIAMOND, NANTON, OKOTOKS, & TURNER VALLEY) 2014 HarGroup Management
ENHANCE YOUR FOCUS & RESILIENCE
 ENHANCE YOUR FOCUS & RESILIENCE A One-Day, Optimal Health Retreat SUNDAY, JULY 12, 2015 8:30 AM 4:30 PM Dr. Brad shares state-of-the-art science on mental focus and resilience, plus engaging exercises.
City of Mesquite, Texas
 City Council Monday, 2:00 PM City Hall Council Chamber 757 N. Galloway Mesquite, Texas Present: Mayor John Monaco and Councilmembers Shirley Roberts, Al Forsythe, Bill Porter, Stan Pickett, Greg Noschese
California s Acute Psychiatric Bed Loss January 11, 2018
 California s Acute Psychiatric Bed Loss January 11, 2018 As of 2015, California had 29 hospitals licensed as freestanding Acute Psychiatric Hospitals (APH) and 28 county-based Psychiatric Health Facilities
Butte County Board of Supervisors Agenda Transmittal
 Butte County Board of Supervisors Agenda Transmittal Clerk of the Board Use Only Agenda Item: 5.06 Subject: Update on Commercial Cannabis Activities in California Department: County Administration Meeting
Cotton Belt Regional Rail Corridor Project. DART Board Committee of the Whole Briefing November 1, 2017
 Cotton Belt Regional Rail Corridor Project DART Board Committee of the Whole Briefing November 1, 2017 0 Agenda Schedule Project Overview Noise Methodology and Impact Analysis Mitigation and Discussion
Northern Nevada DMV Service Center. Serving the Washoe County Population
 Northern Nevada DMV Service Center Serving the Washoe County Population 1 The Current Standard On Saturday, March 4th, the Reno DMV on Galletti Way opened at 8:00 AM with 430 customers already in line.
APRIL 2018 PERFORMANCE REPORT
 APRIL PERFORMANCE REPORT I-66 Express Lanes Inside the Beltway HIGHLIGHTS Morning and afternoon commutes were faster on average and travel times more reliable compared to April. Travel speeds on I-66 averaged
San Mateo County Emergency Services Joint Powers Authority
 San Mateo County Emergency Services Joint Powers Authority Attachment A Attachment A SMC Alert Notifications Since The June Meeting 83 Notifications SMC Alert continues to grow Jurisdiction Subscribers
Healthcare Hot Spotting: Variation in Quality and Resource Use in California. September 2015
 Healthcare Hot Spotting: Variation in Quality and Resource Use in California September 2015 Overview Goal Present healthcare quality and utilization data by geographic region and product line. Create an
Resolution in Support of Measure A, Santa Clara County Park Charter Fund Extension
 R-16-44 Meeting 16-08 April 13, 2016 AGENDA ITEM AGENDA ITEM 12 Resolution in Support of Measure A, Santa Clara County Park Charter Fund Extension GENERAL MANAGER S RECOMMENDATION Adopt a resolution in
Office Report. Bay Area Fourth Quarter 2015
 Office Report Bay Area Fourth Quarter 2015 Office Market Summary Area Building Available Space Rate Avg Asking Sq.Ft. Direct Sublease Total Q4-15 Q4-14 Rate (FS) Marin County 10,440,183 847,312 104,996
Personal Cannabis Cultivation Ordinances. Napa County Board of Supervisors 6/19/18
 Personal Cannabis Cultivation Ordinances Napa County Board of Supervisors 6/19/18 Today s Item Adoption of two ordinances: Adoption of draft ordinance amending Ch. 8.10 allowing outdoor cultivation of
Report created on: 7/19/01 Page 1
 HIV Counseling, Testing, Referral and Partner Counseling and Referral Services (CTR/PCRS) Report January 2000 through December 2000 Data by HIV Test Type The HIV Counseling, Testing, Referral and Partner
Cache Valley Transit District
 Cache Valley Transit District Limited English Proficiency Plan (LEP Plan) Page 1 of 5 Introduction This Limited English Proficiency (LEP) Plan has been prepared to address the responsibilities of the Cache
INFORMATION SUBJECT: UPDATE ON REGIONAL GRAND NEXUS STUDIES FOR COMMERCIAL IMPACT FEES USED TO FUND AFFORDABLE HOUSING
 CITY OF SAN TOSE CAPITAL OF SILICON VALLEY TO: HONORABLE MAYOR AND CITY COUNCIL SUBJECT: SEE BELOW Memorandum FROM: Jacky Morales-Ferrand Kim Walesh DATE: Approved Date INFORMATION SUBJECT: UPDATE ON REGIONAL
Transportation Sustainability Program
 Transportation Sustainability Program Photo: Sergio Ruiz San Francisco 2016 Roads and public transit nearing capacity Increase in cycling and walking despite less than ideal conditions 2 San Francisco
Dr. Hopkins, what are combined built environment intervention approaches?
 Audio Clip: Improving the Built Environment to Increase Physical Activity Speakers: Shiriki Kumanyika, David Hopkins, Chris Kochtitzky Moderator: John Anderton Recording date: June 12, 2018 [John Anderton]
JUMPSTART THE NEW YEAR
 JUMPSTART THE NEW YEAR One-Day Optimal Health Retreat SATURDAY, JANUARY 9, 2016 8:30 AM 4:30 PM Dr. Brad, Founder and Director of BlueWave Medicine, and Medical Director of Integrative Medicine at Cavallo
UCSF Benioff Children s Hospital Helipad Residential Sound Reduction Program. July 30, 2015
 UCSF Benioff Children s Hospital Helipad Residential Sound Reduction Program July 30, 2015 Agenda 1. Agenda Overview 2. Welcome - UCSF Medical Center at Mission Bay 4. Helipad Operations 5. Sound Analysis
2.1 Key Contacts for Self-Funded Member Inquiries. Help or Information Available from this Department Self-Funded Customer Service
 2. Key Contacts 2.1 Key Contacts for Self-Funded Member Inquiries Department Contact information Help or Information Available from this Department Self-Funded Customer Service Customer service representatives
CITY COUNCIL CITY MANAGER. It is recommended that the City Council:
 TO: CITY COUNCIL DATE: April 7,2008 THROUGH: PUBLIC SAFETY FROM: CITY MANAGER SUBJECT: RECOMMENDATION: It is recommended that the City Council: 1. Find that the amendments to Chapter 9.36 of the PMC (Noise
Matrix of Strong Local Tobacco Retailer Licensing Ordinances
 Matrix of Strong Local Tobacco Retailer Licensing Ordinances @ 2013 California of Public JUNE 2017 In order to reduce illegal sales of tobacco products to minors, many cities and counties in California
MARIN COUNTY HAZARDOUS & SOLID WASTE MANAGEMENT JOINT POWERS AUTHORITY
 MARIN COUNTY HAZARDOUS & SOLID WASTE MANAGEMENT JOINT POWERS AUTHORITY Board of Directors Meeting & Public Hearing February 23, 2017 Central Marin Police Authority 250 Doherty Drive, Larkspur, CA 9:00
TABLE OF CONTENTS. County Grades
 TABLE OF CONTENTS EXECUTIVE SUMMARY... 3 TOP TEN CALIFORNIA CITIES BY POPULATION... 5 TOP OF THE CLASS... 6 CITIES AND COUNTIES ON THE RISE... 9 CALIFORNIA TOBACCO CONTROL BY THE NUMBERS... 11 RAISE YOUR
Transportation Committee. March 2018 Committee Reports. Committee Members: Christo Brehm and Sabina Urdes. Contact:
 Lents Neighborhood Association lentsneighborhood@gmail.com (503) 823-4550 1017 NE 117th Avenue Portland, Oregon 97220 lentsneighborhoodassociation.com facebook.com/lentsna March 2018 Committee Reports
Industrial Report. Bay Area Fourth Quarter 2015
 Industrial Report Bay Area Fourth Quarter 2015 Market Summary Submarket Building Available Space Avg. Asking Asking Rate Base Direct Sublease Total Q4-15 Q4-14 Rate (NNN) Range (NNN) San Francisco County
FREESTANDING RESTAURANT PAD BUILDING OF 11,200 SF AVAILABLE FOR LEASE
 FOR LEASE (DO NOT DISTURB TENANT) RESTAURANT OPPORTUNITY FREESTANDING RESTAURANT PAD BUILDING OF 11,200 SF AVAILABLE FOR LEASE 29540 RANCHO CALIFORNIA ROAD, TEMECULA CA The Promenade Abbot Vascular (164,000
Project Background and Need
 Date: May 31, 2018 To: Robert McHaney, AICP; Susan Maclay, MBA From: Roma Stevens, P.E., PTOE Subject: Operational Analysis for Extending Palomino Lane to Grissom Road Project Background and Need The proposed
The San Francisco Cancer Initiative SF-CAN
 The San Francisco Cancer Initiative SF-CAN Robert A. Hiatt, MD, PhD UCSF 10/19/2016 SF CAN 1 An Epidemiologic Perspective Cancer prevention has for many decades been a important target for making a very