SUPPLEMENTARY INFORMATION
|
|
|
- Derek King
- 5 years ago
- Views:
Transcription
1 Somatic ERCC2 Mutations Are Associated with a Distinct Genomic Signature in Urothelial Tumors Jaegil Kim, Kent W Mouw, Paz Polak, Lior Z Braunstein, Atanas Kamburov, Grace Tiao, David J Kwiatkowski, Jonathan E Rosenberg, Eliezer M Van Allen, Alan D Andrea, Gad Getz SUPPLEMENTARY INFORMATION Contents Supplementary Figures 1-18 Supplementary Tables 1-5 (see separate files) Supplementary References

2 Supplementary Figure 1a Signature 5* C>T CpG AA APOBEC2 APOBEC1
3 Supplementary Figure 1b Signature 5* C>T CpG AA APOBEC2 APOBEC1
4 Supplementary Figure 1 Unsupervised hierarchical clustering of signatures identified in three urothelial tumor cohorts (TCGA-130, DFCI/MSK-50, and BGI-99) and the 30 signatures described by COSMIC.[1, 2] COMB-279 is the combined cohort including all tumors from the TCGA-130, DFCI/MSK-50, and BGI-99 cohorts. COMB-MI-242 are all muscle-invasive tumors from the three cohorts. AA: Aristolochic acid. (a) Cosine similarity. (b) Pearson correlation.
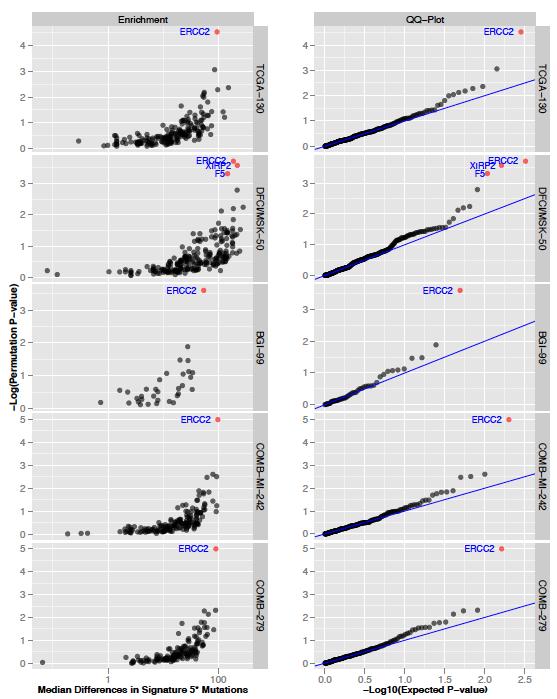
5 Supplementary Figure 2
6 Supplementary Figure 2 Summary of mutation enrichment analyses for signature 5* across cohorts. All genes mutated in >5% of tumors in the cohort were included in the analysis. A permutation-based method was applied to account for the overall number of non-silent mutations per sample and per gene (Methods).[3] Q-Q plots show observed versus expected p- values for each of the analyses. Genes with Benjamini-Hochberg False Discovery Rate Q<0.1 are shown in red and labeled. ERCC2 was the only gene that was significant in each of the cohorts. COMB-279: all 279 tumors across the 3 cohorts. COMB-MI-242: all 242 muscle-invasive tumors across the 3 cohorts.

7 Supplementary Figure 3 a. b.
8 Supplementary Figure 3 Mutational signature analysis of the DFCI/MSK-50 cohort. (a) The spectrum of base changes identified in the DFCI/MSK-50 cohort displayed as the mutated pyrimidine and the adjacent 3 and 5 bases. ssnv: somatic single nucleotide variations. (b) A Bayesian non-negative matrix factorization algorithm was applied to identify signatures from the overall mutation spectrum. Four distinct mutational processes were identified that closely resemble the signatures identified in the TCGA-130 cohort in Figure 1b.
9 Supplementary Figure 4 DFCI/MSK-50 BGI-99 COMB-279
10 Supplementary Figure 4 Comparison of signature 5* activity in tumors with mutant versus WT ERCC2 in the DFCI/MSK-50, BGI-99, and combined (COMB-279 = TCGA DFCI/MSK-50 + BGI-99) cohorts. The median estimated number of mutations is shown in parentheses. Onesided p-values were calculated using a permutation-based method that maintains the overall number of non-silent mutations per sample and per gene (Methods).[3] Note that the BGI-99 signature includes a contribution from the C>T CpG signature.
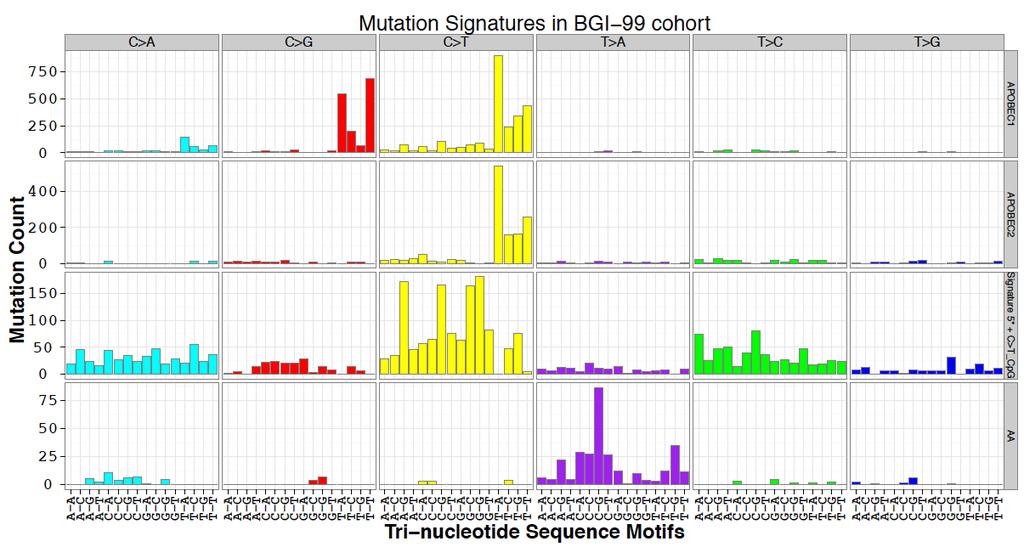
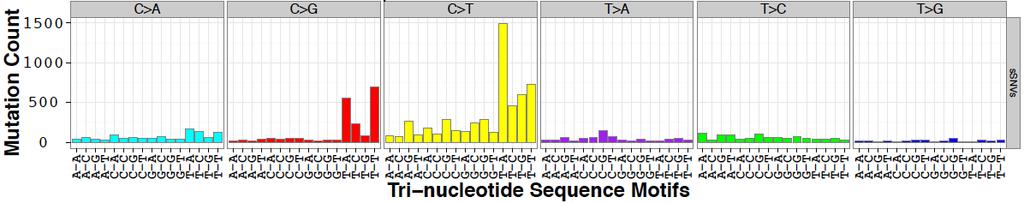
11 Supplementary Figure 5 a. b.
12 Supplementary Figure 5 Mutational signature analysis of the BGI-99 cohort. (a) The spectrum of base changes identified in the BGI-99 cohort displayed as the mutated pyrimidine and the adjacent 3 and 5 bases. (b) A Bayesian non-negative matrix factorization algorithm was applied to identify signatures from the overall mutation spectrum. Four distinct mutational signatures were identified: two signatures resembling those attributed to APOBEC activity (also seen in the TCGA-130 and DFCI/MSK-50 cohorts), a signature attributed to aristolochic acid (AA) exposure, and a signature representing the superposition of the C>T CpG signature and signature 5*.
13 Supplementary Figure 6a Combined Cohort (COMB 279) # of Signature 5* mutations TCGA: Clonal ERCC2 TCGA: Subclonal ERCC2 DFCI/MSKCC & BGI: ERCC2 Smoking Status Cohorts Clusters TCGA DFCI BGI MI Smoker Never Smoker Not Available C>T C>A C>G T>A T>C T>G TTT GTT CTT ATT TTG GTG CTG ATG TTC GTC CTC ATC TTA GTA CTA ATA TTT GTT CTT ATT TTG GTG CTG ATG TTC GTC CTC ATC TTA GTA CTA ATA TTT GTT CTT ATT TTG GTG CTG ATG TTC GTC CTC ATC TTA GTA CTA ATA ACA ACC ACG ACT CCA CCC CCG CCT GCA GCC GCG GCT TCA TCC TCG TCT ACA ACC ACG ACT CCA CCC CCG CCT GCA GCC GCG GCT TCA TCC TCG TCT ACA ACC ACG ACT CCA CCC CCG CCT GCA GCC GCG GCT TCA TCC TCG TCT
14 Supplementary Figure 6b Muscle Invasive Combined Cohort (COMB MI 242) # of Signature 5* mutations TCGA: Clonal ERCC2 TCGA: Subclonal ERCC2 DFCI/MSKCC & BGI: ERCC2 Smoking Status Cohorts Clusters TCGA DFCI BGI MI Smoker Never Smoker Not Available C>T C>A C>G T>A T>C T>G TTT GTT CTT ATT TTG GTG CTG ATG TTC GTC CTC ATC TTA GTA CTA ATA TTT GTT CTT ATT TTG GTG CTG ATG TTC GTC CTC ATC TTA GTA CTA ATA TTT GTT CTT ATT TTG GTG CTG ATG TTC GTC CTC ATC TTA GTA CTA ATA ACA ACC ACG ACT CCA CCC CCG CCT GCA GCC GCG GCT TCA TCC TCG TCT ACA ACC ACG ACT CCA CCC CCG CCT GCA GCC GCG GCT TCA TCC TCG TCT ACA ACC ACG ACT CCA CCC CCG CCT GCA GCC GCG GCT TCA TCC TCG TCT
15 Supplementary Figure 6c Combined Cohort (COMB 279) Numer of Total SNVs TCGA: Clonal ERCC2 TCGA: Subclonal ERCC2 DFCI/MSKCC & BGI: ERCC2 Smoking Status Cohorts Clusters TCGA DFCI BGI MI Smoker Never Smoker Not Available C>T C>A C>G T>A T>C T>G TTT GTT CTT ATT TTG GTG CTG ATG TTC GTC CTC ATC TTA GTA CTA ATA TTT GTT CTT ATT TTG GTG CTG ATG TTC GTC CTC ATC TTA GTA CTA ATA TTT GTT CTT ATT TTG GTG CTG ATG TTC GTC CTC ATC TTA GTA CTA ATA ACA ACC ACG ACT CCA CCC CCG CCT GCA GCC GCG GCT TCA TCC TCG TCT ACA ACC ACG ACT CCA CCC CCG CCT GCA GCC GCG GCT TCA TCC TCG TCT ACA ACC ACG ACT CCA CCC CCG CCT GCA GCC GCG GCT TCA TCC TCG TCT
16 Supplementary Figure 6d Muscle Invasive Combined Cohort (COMB MI 242) Numer of Total SNVs TCGA: Clonal ERCC2 TCGA: Subclonal ERCC2 DFCI/MSKCC & BGI: ERCC2 Smoking Status Cohorts Clusters TCGA DFCI BGI MI Smoker Never Smoker Not Available C>T C>A C>G T>A T>C T>G TTT GTT CTT ATT TTG GTG CTG ATG TTC GTC CTC ATC TTA GTA CTA ATA TTT GTT CTT ATT TTG GTG CTG ATG TTC GTC CTC ATC TTA GTA CTA ATA TTT GTT CTT ATT TTG GTG CTG ATG TTC GTC CTC ATC TTA GTA CTA ATA ACA ACC ACG ACT CCA CCC CCG CCT GCA GCC GCG GCT TCA TCC TCG TCT ACA ACC ACG ACT CCA CCC CCG CCT GCA GCC GCG GCT TCA TCC TCG TCT ACA ACC ACG ACT CCA CCC CCG CCT GCA GCC GCG GCT TCA TCC TCG TCT
17 Supplementary Figure 6 Unsupervised hierarchical clustering analyses. (a) Clustering of signature 5* activity (as 96 trinucleotide mutational contexts) in the combined (COMB-279) cohort. Separate tracks are included for clonal (defined as probability[cancer cell fraction 0.95] >0.5) and subclonal ERCC2 mutations for the TCGA-130 cohort. Tumors segregated into two clusters of 222 (shown in red) and 57 (shown in blue) tumors. Twenty-five of the 35 ERCC2 mutated tumors belonged to the second (blue) cluster (P=1.7x10⁻¹², two-tailed Fisher s exact test). (b) Clustering of signature 5* activity was also performed for all 242 muscle-invasive tumors from the combined cohort (COMB-MI-242). Tumors segregated into two clusters of 162 (red) and 80 (blue) tumors. Twenty-nine of 32 ERCC2 mutated tumors belonged to the second (blue) cluster (P=4.4x10⁻¹⁴ ). (c) Clustering of all non-silent SNVs in the COMB-279 cohort segregated tumors into clusters of 172 (red) and 107 (blue) tumors. Eighteen of 35 ERCC2 mutated tumors belonged to the second (blue) cluster (P=0.1). (d) Clustering of all non-silent SNVs in the COMB-MI-242 cohort segregated tumors into clusters of 25 (red) and 217 (blue) tumors. Twenty-four of 32 ERCC2 mutated tumors belonged to the second (blue) cluster (P=0.008).
18 Supplementary Figure 7a Conversed helicase moif Cohort: DFCI/MSK-50 BGI-99 TCGA Smoking status: Never-smoker Former Smoker Current Smoker Smoking status not available No. esimated signature 5* mutaions: >

19 Supplementary Figure 7b No. Estimated Signature 5* Mutations p= Helicase Non-Helicase
20 Supplementary Figure 7 Location and properties of ERCC2 missense mutations. (a) The location of all missense mutations observed across cohorts are plotted along the length of the ERCC2 gene (760 amino acids) by cohort, smoking status, and signature 5* activity. Mutations cluster within, or adjacent to, conserved helicase motifs (shown in green). One splice site mutation was present in a tumor from the BGI-99 cohort and is not shown here; all other mutations were missense mutations. (b) ERCC2 missense mutations mapped to their predicted equivalent location on an archaeabacterial ERCC2 crystal structure (PDB ID: 3CRV) and colorcoded by estimated number of signature 5* mutations (Methods). For amino acids mutated in more than one tumor, the average number of signature 5* mutations is shown. Helicase domains are shaded in pink and green. Mutations located within or adjacent to ( 10 amino acids) the conserved helicase motifs were associated with a significantly higher number of signature 5* mutations compared to mutations located elsewhere in the protein (P=0.037). CLUMPS analysis revealed significant spatial clustering of mutations within the 3D structure (P=0.0026).[4]
21 Supplementary Figure 8 DFCI/MSK-50: BGI-99: COMB-MI-242: COMB-279:
22 Supplementary Figure 8 Activities of other mutational signatures in mutant versus WT ERCC2 tumors across cohorts. The median estimated number of mutations are shown in parentheses and one-sided p-values were computed using a permutation-based method that maintains the overall number of non-silent mutations per sample and per gene (Methods).[3] COMB-279: all cases across the three cohorts. COMB-MI-242: all muscle-invasive cases across the three cohorts. The C>T CpG signature is not shown for the BGI-99 cohort because this signature did not separate from signature 5* in the NMF analysis.

23 Supplementary Figure 9
24 Supplementary Figure 9 Enrichment analysis for the APOBEC2 signature across genes. Although the p-value for ERCC2 was <0.05 in each of the three cohorts, the Benjamini-Hochberg False Discovery Rate Q-value was <0.1 (shown in red) only in the combined cohorts (COMB-MI- 242 and COMB-279).
25 Supplementary Figure 10 Signature 5* APOBEC2 C>T_CpG APOBEC1 TCGA DFCI BGI Smoker Non Smoker Muscle Invasive Non muscle Invasive Not Available Observed mutations Estimated mutations Cohorts Tobacco Histology SNV INDEL ERCC2 (13%) ERCC6 (3%) DDB2 (3%) CUL4B (2%) CUL4A (1%) DDB1 (1%) XPC (1%) CDK7 (1%) ERCC3 (1%) ERCC5 (1%) ERCC4 (1%) GTF2H1 (1%) RAD23A (1%) RAD23B (1%) LIG1 (1%) MNAT1 (1%) CETN2 (1%) GTF2H3 (0%) ERCC1 (0%) XPA (0%) UVSSA (0%) Germline_NER (63%) # events Silent In frame indel Other Nonsyn. Missense Splice site Frame shift Nonsense Germline Not Available
26 Supplementary Figure 10 Association of somatic and germline NER pathway events with signature 5* activity in the combined cohort (TCGA DFCI/MSK-50 +BGI-99). The figure is arranged similar to Figure 4 in the main text, but provides additional detail regarding events in NER pathway genes (see Methods for full list of NER pathway genes). Somatic mutations in non- ERCC2 NER genes are rare, and there is no significant enrichment of mutations in any individual non-ercc2 NER gene or of the pathway as a whole (when ERCC2 is excluded) among tumors with increased signature 5* activity. Rare germline NER variants (frequency <2% in the TCGA DFCI/MSK-50 cohort; see Methods) are displayed in a single track at the bottom of the figure.
27 Supplementary Figure 11a Cumulative Distributions (CDF) and Enrichment Scores Germline NER Somatic ERCC2 Enrichment of ERCC2 somatic and NER germline mutations in TCGA+DFCI Cohort Samples in descending order of Signature 5* CDF of ERCC2 Mut CDF of ERCC2 WT Enrichment Score
28 Supplementary Figure 11b Enrichment in ERCC2 WT Samples ERCC4 p.i706t (3) Log(Rank Sum P value) XPA p.l252v (2) ERCC4 p.p379s LIG1 p.v753m (2) (2) ERCC6.PGBD3 p.v851a LIG1 p.k845n (2) (2) RAD23A p.t131a (3) ERCC8 p.t280k (2) MMS19 p.g1029d (2) BIVM.ERCC5 p.r741w MMS19 p.a558v XPC p.k481n (2) ERCC4 p.s662p ERCC4 p.e875g (2) (2) (2) (3) ERCC5 p.n879s (2) ERCC6 p.i1021v (2) BIVM.ERCC5 p.a435t (3) ERCC4 p.r576t (2) LIG1 p.r409h (2) ERCC6 p.d425a (2) Mean Differences in Signature 5* Mutations
29 Supplementary Figure 11 Enrichment analyses for somatic and germline NER events. (a) Cumulative distributions and enrichment scores for somatic ERCC2 mutations and germline NER pathway events. The dashed vertical line denotes the maximum enrichment score for somatic ERCC2 mutations. Among the 32 WT ERCC2 tumors with highest signature 5* activity (i.e., left of the dashed line), 19 (59%) had a germline NER variant, whereas among the 123 tumors with lower signature 5* activity (i.e., right of the dashed line), only 54 (44%) had a NER germline variant (p=0.086, Fisher s exact test). (b) Association of NER germline variants with signature 5* activity among WT ERCC2 tumors from the TCGA-130 and DFCI-MSK-50 cohorts (germline data not available for BGI-99 cohort). Variant alleles present in >1 case but <2% of the population are shown (number of cases shown in parentheses), and alleles associated with significant enrichment (FDR<0.1) in signature 5* mutations are highlighted in red. Summary of the four significantly enriched alleles (annotations taken from ExAC [5]): Variant Polyphen2 SIFT Population frequency ERCC4-p.I706T probably damaging deleterious ERCC4-p.R576T benign deleterious LIG1-p.R409H possibly damaging deleterious BIVM-ERCC5-p.A435T no annotation

30 Supplementary Figure 12 a. b. c.
31 Supplementary Figure 12 Effect of current smoking status and smoking intensity on signature 5* activity in the combined TCGA DFCI/MSK-50 cohort. (a) There was no difference in the estimated number of signature 5* mutations in current versus former smokers. The estimated number of signature 5* mutations is shown in parentheses. P-values were calculated using the Wilcoxon rank-sum test. (b) There was also no difference in estimated number of signature 5* mutations in current versus former smokers when only WT ERCC2 cases were considered. (c) There was a correlation between smoking intensity (measured in pack-years exposure) and signature 5* activity for ERCC2 mutated cases but not WT ERCC2 cases.
32 Supplementary Figure 13
33 Supplementary Figure 13 Association of smoking with other mutational signatures in the combined TCGA DFCI/MSK-50 cohort. There was no association between smoking status and activity of any of the other mutational signatures identified in the cohorts.

34 Supplementary Figure 14 a. b.
35 Supplementary Figure 14 Relationship between signature 5* and COSMIC signatures 4 and 5. The contributions of COSMIC signatures 4 and 5 to signature 5* were determined by deconvoluting signature 5* mutations into COSMIC signature 4 and COSMIC signature 5 components (Methods). (a) Nearly all signature 5* activity is attributable to activity of COSMIC signature 5, with only a small contribution from COSMIC signature 4. The two samples with strongest contribution from COSMIC signature 4 were WT ERCC2 cases. (b) The difference in signature 5* activity between smokers and non-smokers is due to differences in activity of COSMIC signature 5 rather than COSMIC signature 4.

36 Supplementary Figure 15a b.
37 Supplementary Figure 15b

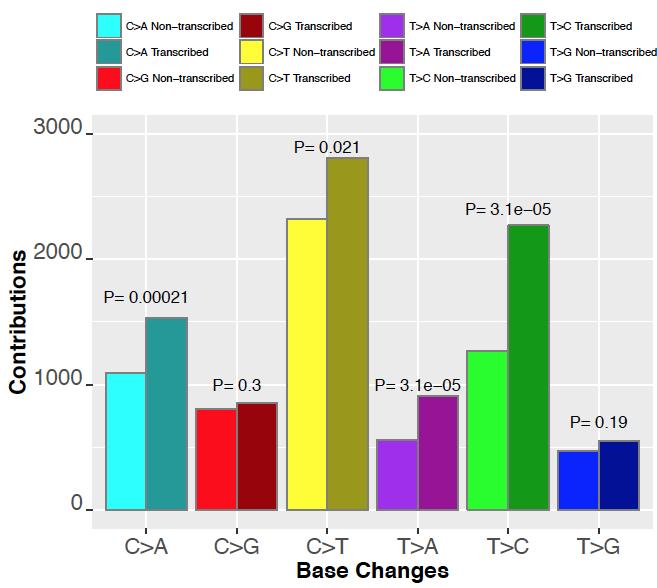
38 Supplementary Figure 15c
39 Supplementary Figure 15 Strand asymmetry analysis. For all muscle-invasive tumors across the three cohorts (COMB-MI-242), the Bayesian NMF analysis was repeated while considering mutations on the transcribed and non-transcribed strands separately (i.e., 192 rather than 96 trinucleotide mutational contexts). (a) Estimated number of mutations on transcribed (shaded colors) and non-transcribed strands (non-shaded colors) for each of the four signatures. (b) Summary of single base changes on the transcribed versus non-transcribed strand. P-values were computed using the pair-wise Wilcoxon rank-sum test. (c) The activity on the transcribed versus non-transcribed strand is displayed for each of the six possible base pair changes. Signature 5* exhibits a transcriptional strand bias that is strongest for T>C and C>A changes.

40 Supplementary Figure 16
41 Supplementary Figure 16 Association between patient age and signature 5* activity in tumors from the TCGA-130 and DFCI/MSK-50 cohorts (the two cohorts with available age data). As has been previously described for COSMIC signature 5 in urothelial cancer, there was no association between age at diagnosis and signature 5* activity in the urothelial tumors analyzed here (P=0.65).[6]
42 Supplementary Figure 17 a. b. c.
43 Supplementary Figure 17 Clonality of signature 5* mutations in WT versus mutant ERCC2 tumors. For each tumor with an ERCC2 mutation, the number of clonal (defined as probability [cancer cell fraction 0.95]>0.5) and subclonal signature 5* mutations are shown. Gray lines connect counts from the same tumor. (a) Tumors with a clonal ERCC2 mutation have significantly more clonal than subclonal signature 5* mutations. (b) There is no significant difference in the number of clonal versus subclonal signature 5* mutations in tumors with a subclonal ERCC2 mutation. (c) There is also no significant difference in the number of clonal versus subclonal signature 5* mutations in tumors with WT ERCC2. P-values were calculated using the pairwise Mann-Whitney test.
44 Supplementary Figure 18
45 Supplementary Figure 18 Association between signature 5* activity and cisplatin response in the DFCI/MSK-50 cohort (the only cohort with cisplatin response data available). Median estimated number of signature 5* mutations are shown in parentheses and p-values were calculated using the Wilcoxon rank-sum test. There were a significantly higher number of signature 5* mutations in cisplatin responders versus non-responders; however, this difference was not significant when only WT ERCC2 tumors were considered.
46 Supplementary Tables (see separate files) Supplementary Table 1 Summary of Urothelial Cancer Cohorts. Supplementary Table 2 Numerical Representation of Signature 5* Across Cohorts. Supplementary Table 3 Summary of Mutational Signature Contributions, ERCC2 Mutational Status, and Smoking Status for All Cases. Supplementary Table 4 Comparison of Mutational Signatures in Urothelial Tumor Cohorts to COSMIC Mutational Signatures. Supplementary Table 5 Comparison of Signature 5* Among Urothelial Tumor Cohorts.
47 Supplementary References 1. COSMIC: Catalogue of Somatic Mutations in Cancer. [cited 2015 October 25]; Available from: 2. Alexandrov, LB, Nik-Zainal, S, Wedge, DC, Aparicio, SA, et al. Signatures of mutational processes in human cancer. Nature 2013;500: Strona, G, Nappo, D, Boccacci, F, Fattorini, S, San-Miguel-Ayanz, J. A fast and unbiased procedure to randomize ecological binary matrices with fixed row and column totals. Nat Commun 2014;5: Kamburov, A, Lawrence, MS, Polak, P, Leshchiner, I, et al. Comprehensive assessment of cancer missense mutation clustering in protein structures. Proc Natl Acad Sci U S A 2015;112:E Consortium, EA. Analysis of protein-coding genetic variation in 60,706 humans. BioRx 2015; 6. Alexandrov, LB, Jones, PH, Wedge, DC, Sale, JE, et al. Clock-like mutational processes in human somatic cells. Nat Genet 2015;
Supplementary Table 3. 3 UTR primer sequences. Primer sequences used to amplify and clone the 3 UTR of each indicated gene are listed.
 Supplemental Figure 1. DLKI-DIO3 mirna/mrna complementarity. Complementarity between the indicated DLK1-DIO3 cluster mirnas and the UTR of SOX2, SOX9, HIF1A, ZEB1, ZEB2, STAT3 and CDH1with mirsvr and PhastCons
a) Primary cultures derived from the pancreas of an 11-week-old Pdx1-Cre; K-MADM-p53
 Primary cultures derived from the pancreas of an 11-week-old Pdx1-Cre; K-MADM-p53") 1 2 3 4 5 6 7 8 9 10 Supplementary Figure 1. Induction of p53 LOH by MADM. a) Primary cultures derived from the pancreas of an 11-week-old Pdx1-Cre; K-MADM-p53 mouse revealed increased p53 KO/KO (green,
1 2 3 4 5 6 7 8 9 10 Supplementary Figure 1. Induction of p53 LOH by MADM. a) Primary cultures derived from the pancreas of an 11-week-old Pdx1-Cre; K-MADM-p53 mouse revealed increased p53 KO/KO (green,
Nature Structural & Molecular Biology: doi: /nsmb Supplementary Figure 1
 Supplementary Figure 1 U1 inhibition causes a shift of RNA-seq reads from exons to introns. (a) Evidence for the high purity of 4-shU-labeled RNAs used for RNA-seq. HeLa cells transfected with control
c Tuj1(-) apoptotic live 1 DIV 2 DIV 1 DIV 2 DIV Tuj1(+) Tuj1/GFP/DAPI Tuj1 DAPI GFP
 apoptotic live 1 DIV 2 DIV 1 DIV 2 DIV Tuj1(+) Tuj1/GFP/DAPI Tuj1 DAPI GFP") Supplementary Figure 1 Establishment of the gain- and loss-of-function experiments and cell survival assays. a Relative expression of mature mir-484 30 20 10 0 **** **** NCP mir- 484P NCP mir- 484P b Relative
Supplementary Figure 1 Establishment of the gain- and loss-of-function experiments and cell survival assays. a Relative expression of mature mir-484 30 20 10 0 **** **** NCP mir- 484P NCP mir- 484P b Relative
Cancer Genomics. Nic Waddell. Winter School in Mathematical and Computational Biology. July th
 Cancer Genomics Nic Waddell Winter School in Mathematical and Computational Biology 6th July 2015 Time Line of Key Events in Cancer Genomics Michael R. Stratton Science 2011;331:1553-1558 The Cancer Genome
Supplementary Document
 Supplementary Document 1. Supplementary Table legends 2. Supplementary Figure legends 3. Supplementary Tables 4. Supplementary Figures 5. Supplementary References 1. Supplementary Table legends Suppl.
Supplementary Figure 1 MicroRNA expression in human synovial fibroblasts from different locations. MicroRNA, which were identified by RNAseq as most
 Supplementary Figure 1 MicroRNA expression in human synovial fibroblasts from different locations. MicroRNA, which were identified by RNAseq as most differentially expressed between human synovial fibroblasts
ERCC2mutations as predictors of response to cisplatinin bladder cancer
 ERCC2mutations as predictors of response to cisplatinin bladder cancer Eliezer (Eli) Van Allen, MD Instructor, Harvard Medical School Dana-Farber Cancer Institute Broad Institute of MIT and Harvard August
ARTICLE RESEARCH. Macmillan Publishers Limited. All rights reserved
 Extended Data Figure 6 Annotation of drivers based on clinical characteristics and co-occurrence patterns. a, Putative drivers affecting greater than 10 patients were assessed for enrichment in IGHV mutated
Supplementary Figure 1 a
 Supplementary Figure a Normalized expression/tbp (A.U.).6... Trip-br transcripts Trans Trans Trans b..5. Trip-br Ctrl LPS Normalized expression/tbp (A.U.) c Trip-br transcripts. adipocytes.... Trans Trans
Supplementary Appendix
 Supplementary Appendix This appendix has been provided by the authors to give readers additional information about their work. Supplement to: Sherman SI, Wirth LJ, Droz J-P, et al. Motesanib diphosphate
Supplemental Data. Shin et al. Plant Cell. (2012) /tpc YFP N
 /tpc YFP N") MYC YFP N PIF5 YFP C N-TIC TIC Supplemental Data. Shin et al. Plant Cell. ()..5/tpc..95 Supplemental Figure. TIC interacts with MYC in the nucleus. Bimolecular fluorescence complementation assay using
MYC YFP N PIF5 YFP C N-TIC TIC Supplemental Data. Shin et al. Plant Cell. ()..5/tpc..95 Supplemental Figure. TIC interacts with MYC in the nucleus. Bimolecular fluorescence complementation assay using
Supplementary Figure 1. ROS induces rapid Sod1 nuclear localization in a dosagedependent manner. WT yeast cells (SZy1051) were treated with 4NQO at
 were treated with 4NQO at") Supplementary Figure 1. ROS induces rapid Sod1 nuclear localization in a dosagedependent manner. WT yeast cells (SZy1051) were treated with 4NQO at different concentrations for 30 min and analyzed for
Supplementary Figure 1. ROS induces rapid Sod1 nuclear localization in a dosagedependent manner. WT yeast cells (SZy1051) were treated with 4NQO at different concentrations for 30 min and analyzed for
Supplementary Materials
 Supplementary Materials 1 Supplementary Table 1. List of primers used for quantitative PCR analysis. Gene name Gene symbol Accession IDs Sequence range Product Primer sequences size (bp) β-actin Actb gi
Supplementary Figure 1: Features of IGLL5 Mutations in CLL: a) Representative IGV screenshot of first
 Representative IGV screenshot of first") Supplementary Figure 1: Features of IGLL5 Mutations in CLL: a) Representative IGV screenshot of first intron IGLL5 mutation depicting biallelic mutations. Red arrows highlight the presence of out of phase
Supplementary Figure 1: Features of IGLL5 Mutations in CLL: a) Representative IGV screenshot of first intron IGLL5 mutation depicting biallelic mutations. Red arrows highlight the presence of out of phase
Figure S1. Analysis of genomic and cdna sequences of the targeted regions in WT-KI and
 Figure S1. Analysis of genomic and sequences of the targeted regions in and indicated mutant KI cells, with WT and corresponding mutant sequences underlined. (A) cells; (B) K21E-KI cells; (C) D33A-KI cells;
Abbreviations: P- paraffin-embedded section; C, cryosection; Bio-SA, biotin-streptavidin-conjugated fluorescein amplification.
 Supplementary Table 1. Sequence of primers for real time PCR. Gene Forward primer Reverse primer S25 5 -GTG GTC CAC ACT ACT CTC TGA GTT TC-3 5 - GAC TTT CCG GCA TCC TTC TTC-3 Mafa cds 5 -CTT CAG CAA GGA
BIOLOGY 621 Identification of the Snorks
 Name: Date: Block: BIOLOGY 621 Identification of the Snorks INTRODUCTION: In this simulation activity, you will examine the DNA sequence of a fictitious organism - the Snork. Snorks were discovered on
Citation for published version (APA): Oosterveer, M. H. (2009). Control of metabolic flux by nutrient sensors Groningen: s.n.
: Oosterveer, M. H. (2009). Control of metabolic flux by nutrient sensors Groningen: s.n.") University of Groningen Control of metabolic flux by nutrient sensors Oosterveer, Maaike IMPORTANT NOTE: You are advised to consult the publisher's version (publisher's PDF) if you wish to cite from it.
University of Groningen Control of metabolic flux by nutrient sensors Oosterveer, Maaike IMPORTANT NOTE: You are advised to consult the publisher's version (publisher's PDF) if you wish to cite from it.
Supplementary Figures
 Supplementary Figures Supplementary Figure 1. H3F3B expression in lung cancer. a. Comparison of H3F3B expression in relapsed and non-relapsed lung cancer patients. b. Prognosis of two groups of lung cancer
CD31 5'-AGA GAC GGT CTT GTC GCA GT-3' 5 ' -TAC TGG GCT TCG AGA GCA GT-3'
 Table S1. The primer sets used for real-time RT-PCR analysis. Gene Forward Reverse VEGF PDGFB TGF-β MCP-1 5'-GTT GCA GCA TGA ATC TGA GG-3' 5'-GGA GAC TCT TCG AGG AGC ACT T-3' 5'-GAA TCA GGC ATC GAG AGA
Toluidin-Staining of mast cells Ear tissue was fixed with Carnoy (60% ethanol, 30% chloroform, 10% acetic acid) overnight at 4 C, afterwards
 overnight at 4 C, afterwards") Toluidin-Staining of mast cells Ear tissue was fixed with Carnoy (60% ethanol, 30% chloroform, 10% acetic acid) overnight at 4 C, afterwards incubated in 100 % ethanol overnight at 4 C and embedded in
Toluidin-Staining of mast cells Ear tissue was fixed with Carnoy (60% ethanol, 30% chloroform, 10% acetic acid) overnight at 4 C, afterwards incubated in 100 % ethanol overnight at 4 C and embedded in
Table S1. Oligonucleotides used for the in-house RT-PCR assays targeting the M, H7 or N9. Assay (s) Target Name Sequence (5 3 ) Comments
 Target Name Sequence (5 3 ) Comments") SUPPLEMENTAL INFORMATION 2 3 Table S. Oligonucleotides used for the in-house RT-PCR assays targeting the M, H7 or N9 genes. Assay (s) Target Name Sequence (5 3 ) Comments CDC M InfA Forward (NS), CDC M
SUPPLEMENTAL INFORMATION 2 3 Table S. Oligonucleotides used for the in-house RT-PCR assays targeting the M, H7 or N9 genes. Assay (s) Target Name Sequence (5 3 ) Comments CDC M InfA Forward (NS), CDC M
Supplementary Table 2. Conserved regulatory elements in the promoters of CD36.
 Supplementary Table 1. RT-qPCR primers for CD3, PPARg and CEBP. Assay Forward Primer Reverse Primer 1A CAT TTG TGG CCT TGT GCT CTT TGA TGA GTC ACA GAA AGA ATC AAT TC 1B AGG AAA TGA ACT GAT GAG TCA CAG
Culture Density (OD600) 0.1. Culture Density (OD600) Culture Density (OD600) Culture Density (OD600) Culture Density (OD600)
 0.1. Culture Density (OD600) Culture Density (OD600) Culture Density (OD600) Culture Density (OD600)") A. B. C. D. E. PA JSRI JSRI 2 PA DSAM DSAM 2 DSAM 3 PA LNAP LNAP 2 LNAP 3 PAO Fcor Fcor 2 Fcor 3 PAO Wtho Wtho 2 Wtho 3 Wtho 4 DTSB Low Iron 2 4 6 8 2 4 6 8 2 22 DTSB Low Iron 2 4 6 8 2 4 6 8 2 22 DTSB
A. B. C. D. E. PA JSRI JSRI 2 PA DSAM DSAM 2 DSAM 3 PA LNAP LNAP 2 LNAP 3 PAO Fcor Fcor 2 Fcor 3 PAO Wtho Wtho 2 Wtho 3 Wtho 4 DTSB Low Iron 2 4 6 8 2 4 6 8 2 22 DTSB Low Iron 2 4 6 8 2 4 6 8 2 22 DTSB
A comprehensive survey of the mutagenic impact of common cancer cytotoxics
 Szikriszt et al. Genome Biology (216) 17:99 DOI 1.1186/s1359-16-963-7 RESEARCH Open Access A comprehensive survey of the mutagenic impact of common cancer cytotoxics Bernadett Szikriszt 1, Ádám Póti 1,
Beta Thalassemia Case Study Introduction to Bioinformatics
 Beta Thalassemia Case Study Sami Khuri Department of Computer Science San José State University San José, California, USA sami.khuri@sjsu.edu www.cs.sjsu.edu/faculty/khuri Outline v Hemoglobin v Alpha
Package ClusteredMutations
 Package ClusteredMutations April 29, 2016 Version 1.0.1 Date 2016-04-28 Title Location and Visualization of Clustered Somatic Mutations Depends seriation Description Identification and visualization of
Supplementary Figure 1: Classification scheme for non-synonymous and nonsense germline MC1R variants. The common variants with previously established
 Supplementary Figure 1: Classification scheme for nonsynonymous and nonsense germline MC1R variants. The common variants with previously established classifications 1 3 are shown. The effect of novel missense
Supplementary Figure 1
 Metastatic melanoma Primary melanoma Healthy human skin Supplementary Figure 1 CD22 IgG4 Supplementary Figure 1: Immunohisochemical analysis of CD22+ (left) and IgG4 (right), cells (shown in red and indicated
Description of Supplementary Files. File Name: Supplementary Information Description: Supplementary Figures and Supplementary Tables
 Description of Supplementary Files File Name: Supplementary Information Description: Supplementary Figures and Supplementary Tables Supplementary Figure 1: (A), HCT116 IDH1-WT and IDH1-R132H cells were
Nature Immunology: doi: /ni.3836
 Supplementary Figure 1 Recombinant LIGHT-VTP induces pericyte contractility and endothelial cell activation. (a) Western blot showing purification steps for full length murine LIGHT-VTP (CGKRK) protein:
Supplementary Materials for
 www.sciencetranslationalmedicine.org/cgi/content/full/7/283/283ra54/dc1 Supplementary Materials for Clonal status of actionable driver events and the timing of mutational processes in cancer evolution
Supplementary Figure 1a
 Supplementary Figure 1a Hours: E-cadherin TGF-β On TGF-β Off 0 12 24 36 48 24 48 72 Vimentin βactin Fig. S1a. Treatment of AML12 cells with TGF-β induces EMT. Treatment of AML12 cells with TGF-β results
SUPPLEMENTARY INFORMATION
 doi: 10.1038/nature05883 SUPPLEMENTARY INFORMATION Supplemental Figure 1 Prostaglandin agonists and antagonists alter runx1/cmyb expression. a-e, Embryos were exposed to (b) PGE2 and (c) PGI2 (20μM) and
Resistance to Tetracycline Antibiotics by Wangrong Yang, Ian F. Moore, Kalinka P. Koteva, Donald W. Hughes, David C. Bareich and Gerard D. Wright.
 Supplementary Data for TetX is a Flavin-Dependent Monooxygenase Conferring Resistance to Tetracycline Antibiotics by Wangrong Yang, Ian F. Moore, Kalinka P. Koteva, Donald W. Hughes, David C. Bareich and
Journal of Cell Science Supplementary information. Arl8b +/- Arl8b -/- Inset B. electron density. genotype
 J. Cell Sci. : doi:.4/jcs.59: Supplementary information E9. A Arl8b /- Arl8b -/- Arl8b Arl8b non-specific band Gapdh Tbp E7.5 HE Inset B D Control al am hf C E Arl8b -/- al am hf E8.5 F low middle high
Supplementary Figure 1
 Supplementary Figure 1 Supplementary Figure 1. Lats1/2 deleted ihbs and ihps showed decreased transcripts of hepatocyte related genes (a and b) Western blots (a) and recombination PCR (b) of control and
A smart acid nanosystem for ultrasensitive. live cell mrna imaging by the target-triggered intracellular self-assembly
 Electronic Supplementary Material (ESI) for Chemical Science. This journal is The Royal Society of Chemistry 2017 A smart ZnO@polydopamine-nucleic acid nanosystem for ultrasensitive live cell mrna imaging
Nucleotide Sequence of the Australian Bluetongue Virus Serotype 1 RNA Segment 10
 J. gen. Virol. (1988), 69, 945-949. Printed in Great Britain 945 Key words: BTV/genome segment lo/nucleotide sequence Nucleotide Sequence of the Australian Bluetongue Virus Serotype 1 RNA Segment 10 By
SUPPLEMENTARY DATA. Supplementary Table 1. Primer sequences for qrt-pcr
 Supplementary Table 1. Primer sequences for qrt-pcr Gene PRDM16 UCP1 PGC1α Dio2 Elovl3 Cidea Cox8b PPARγ AP2 mttfam CyCs Nampt NRF1 16s-rRNA Hexokinase 2, intron 9 β-actin Primer Sequences 5'-CCA CCA GCG
Astaxanthin prevents and reverses diet-induced insulin resistance and. steatohepatitis in mice: A comparison with vitamin E
 Supplementary Information Astaxanthin prevents and reverses diet-induced insulin resistance and steatohepatitis in mice: A comparison with vitamin E Yinhua Ni, 1,2 Mayumi Nagashimada, 1 Fen Zhuge, 1 Lili
Relationship of the APOA5/A4/C3/A1 gene cluster and APOB gene polymorphisms with dyslipidemia
 elationship of the APOA5/A4/C3/A1 gene cluster and APOB gene polymorphisms with dyslipidemia H.J. Ou 1, G. Huang 2, W. Liu 3, X.L. Ma 2, Y. Wei 4, T. Zhou 5 and Z.M. Pan 3 1 Department of Neurology, The
SUPPORTING INFORMATION
 SUPPORTING INFORMATION Biology is different in small volumes: endogenous signals shape phenotype of primary hepatocytes cultured in microfluidic channels Amranul Haque, Pantea Gheibi, Yandong Gao, Elena
Mutation Screening and Association Studies of the Human UCP 3 Gene in Normoglycemic and NIDDM Morbidly Obese Patients
 Mutation Screening and Association Studies of the Human UCP 3 Gene in Normoglycemic and NIDDM Morbidly Obese Patients Shuichi OTABE, Karine CLEMENT, Séverine DUBOIS, Frederic LEPRETRE, Veronique PELLOUX,
Finding protein sites where resistance has evolved
 Finding protein sites where resistance has evolved The amino acid (Ka) and synonymous (Ks) substitution rates Please sit in row K or forward The Berlin patient: first person cured of HIV Contracted HIV
Nature Getetics: doi: /ng.3471
 Supplementary Figure 1 Summary of exome sequencing data. ( a ) Exome tumor normal sample sizes for bladder cancer (BLCA), breast cancer (BRCA), carcinoid (CARC), chronic lymphocytic leukemia (CLLX), colorectal
Lezione 10. Sommario. Bioinformatica. Lezione 10: Sintesi proteica Synthesis of proteins Central dogma: DNA makes RNA makes proteins Genetic code
 Lezione 10 Bioinformatica Mauro Ceccanti e Alberto Paoluzzi Lezione 10: Sintesi proteica Synthesis of proteins Dip. Informatica e Automazione Università Roma Tre Dip. Medicina Clinica Università La Sapienza
A basic helix loop helix transcription factor controls cell growth
 A basic helix loop helix transcription factor controls cell growth and size in root hairs Keke Yi 1,2, Benoît Menand 1,3, Elizabeth Bell 1, Liam Dolan 1,4 Supplementary note Low soil phosphate availability
Supplemental Information. Cancer-Associated Fibroblasts Neutralize. the Anti-tumor Effect of CSF1 Receptor Blockade
 Cancer Cell, Volume 32 Supplemental Information Cancer-Associated Fibroblasts Neutralize the Anti-tumor Effect of CSF1 Receptor Blockade by Inducing PMN-MDSC Infiltration of Tumors Vinit Kumar, Laxminarasimha
What do you think of when you here the word genome?
 What do you think of when you here the word genome? What do you think of when you here the word genome? Personal Genomics Outline Review of pre-lab work Genomics and Medicine Case Overview & Assignment
Frequency of mosaicism points towards mutation prone early cleavage cell divisions.
 Frequency of mosaicism points towards mutation prone early cleavage cell divisions. Chad Harland, Wouter Coppieters, Latifa Karim, Carole Charlier, Michel Georges Germ-line de novo mutations Definition:
Beta Thalassemia Sami Khuri Department of Computer Science San José State University Spring 2015
 Bioinformatics in Medical Product Development SMPD 287 Three Beta Thalassemia Sami Khuri Department of Computer Science San José State University Hemoglobin Outline Anatomy of a gene Hemoglobinopathies
Cross-talk between mineralocorticoid and angiotensin II signaling for cardiac
 ONLINE SUPPLEMENT TO Crosstalk between mineralocorticoid and angiotensin II signaling for cardiac remodeling An Di ZHANG,,3, Aurelie NGUYEN DINH CAT*,,3, Christelle SOUKASEUM *,,3, Brigitte ESCOUBET, 4,
Mapping by recurrence and modelling the mutation rate
 Mapping by recurrence and modelling the mutation rate Shamil Sunyaev Broad Institute of M.I.T. and Harvard Current knowledge is from Comparative genomics Experimental systems: yeast reporter assays Potential
Supplemental Information. Th17 Lymphocytes Induce Neuronal. Cell Death in a Human ipsc-based. Model of Parkinson's Disease
 Cell Stem Cell, Volume 23 Supplemental Information Th17 Lymphocytes Induce Neuronal Cell Death in a Human ipsc-based Model of Parkinson's Disease Annika Sommer, Franz Maxreiter, Florian Krach, Tanja Fadler,
Supplementary Information. Bamboo shoot fiber prevents obesity in mice by. modulating the gut microbiota
 Supplementary Information Bamboo shoot fiber prevents obesity in mice by modulating the gut microbiota Xiufen Li 1,2, Juan Guo 1, Kailong Ji 1,2, and Ping Zhang 1,* 1 Key Laboratory of Tropical Plant Resources
Supporting Information
 Supporting Information Malapeira et al. 10.1073/pnas.1217022110 SI Materials and Methods Plant Material and Growth Conditions. A. thaliana seedlings were stratified at 4 C in the dark for 3 d on Murashige
Single-Molecule Analysis of Gene Expression Using Two-Color RNA- Labeling in Live Yeast
 Supplemental Figures, Tables and Results Single-Molecule Analysis of Gene Expression Using Two-Color RNA- Labeling in Live Yeast Sami Hocine 1, Pascal Raymond 2, Daniel Zenklusen 2, Jeffrey A. Chao 1 &
SUPPLEMENTARY INFORMATION
 SUPPLEMENTARY INFORMATION doi:10.1038/nature10743 Supplementary Figures and Legends Supplementary Figure 1. CYP17A1 (red boxes) lies at the intersection of steroid hormone biosynthetic pathways. CYP17A1
Whole Exome Sequenced Characteristics
 Supplementary Tables Supplementary Table 1: Patient characteristics of 45 whole exome sequenced HNSCC tumors Whole Exome Sequenced Characteristics Tumors (n=45) Age, years Median (range) 61.0 (19-90) Sex,
Nature Methods: doi: /nmeth.3115
 Supplementary Figure 1 Analysis of DNA methylation in a cancer cohort based on Infinium 450K data. RnBeads was used to rediscover a clinically distinct subgroup of glioblastoma patients characterized by
SUPPLEMENTARY RESULTS
 SUPPLEMENTARY RESULTS Supplementary Table 1. hfpr1- Flpln-CHO hfpr2-flpln-cho pec 50 E max (%) Log( /K A) Log( /K A) N pec 50 E max (%) Log( /K A) Log( /K A) n ERK1/2 phosphorylation fmlp 9.0±0.6 80±7
Baseline clinical characteristics for the 81 CMML patients Routine diagnostic testing and statistical analyses... 3
 Next-Generation Sequencing Technology Reveals a Characteristic Pattern of Molecular Mutations in 72.8% of Chronic Myelomonocytic Leukemia (CMML) by Detecting Frequent Alterations in TET2, CBL, RAS, and
SUPPLEMENTARY INFORMATION
 doi:10.1038/nature10866 a b 1 2 3 4 5 6 7 Match No Match 1 2 3 4 5 6 7 Turcan et al. Supplementary Fig.1 Concepts mapping H3K27 targets in EF CBX8 targets in EF H3K27 targets in ES SUZ12 targets in ES
Supplementary Materials and Methods
 DD2 suppresses tumorigenicity of ovarian cancer cells by limiting cancer stem cell population Chunhua Han et al. Supplementary Materials and Methods Analysis of publicly available datasets: To analyze
 www.lessonplansinc.com Topic: Protein Synthesis - Sentence Activity Summary: Students will simulate transcription and translation by building a sentence/polypeptide from words/amino acids. Goals & Objectives:
SUPPLEMENTAL FIGURE 1
 SUPPLEMENTL FIGURE 1 C Supplemental Figure 1. pproach for removal of snorns from Rpl13a gene. () Wild type Rpl13a exonintron structure is shown, with exo in black and intronic snorns in red rectangles.
Reporting TP53 gene analysis results in CLL
 Reporting TP53 gene analysis results in CLL Mutations in TP53 - From discovery to clinical practice in CLL Discovery Validation Clinical practice Variant diversity *Leroy at al, Cancer Research Review
SUPPLEMENTAL METHODS Cell culture RNA extraction and analysis Immunohistochemical analysis and laser capture microdissection (LCM)
") SUPPLEMENTAL METHODS Cell culture Human peripheral blood mononuclear cells were isolated from healthy donors by Ficoll density gradient centrifugation. Monocyte differentiation to resting macrophages ()
SUPPLEMENTAL METHODS Cell culture Human peripheral blood mononuclear cells were isolated from healthy donors by Ficoll density gradient centrifugation. Monocyte differentiation to resting macrophages ()
NSAID use and somatic exomic mutations in Barrett s esophagus
 Galipeau et al. Genome Medicine (2018) 10:17 https://doi.org/10.1186/s13073-018-0520-y RESEARCH Open Access NSAID use and somatic exomic mutations in Barrett s esophagus Patricia C. Galipeau 1, Kenji M.
Nucleotide diversity of the TNF gene region in an African village
 (2001) 2, 343 348 2001 Nature Publishing Group All rights reserved 1466-4879/01 $15.00 www.nature.com/gene Nucleotide diversity of the TNF gene region in an African village A Richardson 1, F Sisay-Joof
Integration Solutions
 Integration Solutions (1) a) With no active glycosyltransferase of either type, an ii individual would not be able to add any sugars to the O form of the lipopolysaccharide. Thus, the only lipopolysaccharide
Exons from 137 genes were targeted for hybrid selection and massively parallel sequencing.
 SUPPLEMENTARY TABLES Supplementary Table 1. Targeted Genes ABL1 ABL2 AKT1 AKT2 AKT3 ALK APC ATM AURKA BCL2 BRAF BRCA1 BRCA2 CCND1 CCNE1 CDC73 CDH1 CDK4 CDK6 CDK8 CDKN1A CDKN2A CEBPA CHEK1 CHEK2 CREBBP
Identification of heritable genetic risk factors for bladder cancer through genome-wide association studies (GWAS)
") BCAN 2014 August 9, 2014 Identification of heritable genetic risk factors for bladder cancer through genome-wide association studies (GWAS) Ludmila Prokunina-Olsson, PhD Investigator Laboratory of Translational
BCAN 2014 August 9, 2014 Identification of heritable genetic risk factors for bladder cancer through genome-wide association studies (GWAS) Ludmila Prokunina-Olsson, PhD Investigator Laboratory of Translational
McAlpine PERK-GSK3 regulates foam cell formation. Supplemental Material. Supplementary Table I. Sequences of real time PCR primers.
 Mclpine PERK-GSK3 regulates foam cell formation Supplemental Material Supplementary Table I. Sequences of real time PCR primers. Primer Name Primer Sequences (5-3 ) Product Size (bp) GRP78 (human) Fwd:
Supplementary Figure 1
 Supplementary Figure 1 3 3 3 1 1 Bregma -1.6mm 3 : Bregma Ref) Http://www.mbl.org/atlas165/atlas165_start.html Bregma -.18mm Supplementary Figure 1 Schematic representation of the utilized brain slice
Deciphering the Clinical Significance of BRCA Variants. A Senior Honors Thesis
 Deciphering the Clinical Significance of BRCA Variants A Senior Honors Thesis Presented in Partial Fulfillment of the Requirements for graduation with research distinction in Biology in the undergraduate
Supplemental Figure legends
 Supplemental Figure legends Supplemental Figure S1 Frequently mutated genes. Frequently mutated genes (mutated in at least four patients) with information about mutation frequency, RNA-expression and copy-number.
SUPPLEMENTARY FIGURES: Supplementary Figure 1
 SUPPLEMENTARY FIGURES: Supplementary Figure 1 Supplementary Figure 1. Glioblastoma 5hmC quantified by paired BS and oxbs treated DNA hybridized to Infinium DNA methylation arrays. Workflow depicts analytic
Isolate Sexual Idiomorph Species
 SUPLEMENTARY TABLE 1. Isolate identification, sexual idiomorph and species of each isolate used for MAT locus distribution in Paracoccidioides species. Isolate Sexual Idiomorph Species Pb01 MAT1-1 P. lutzii
Supplementary Figure 1. Estimation of tumour content
 Supplementary Figure 1. Estimation of tumour content a, Approach used to estimate the tumour content in S13T1/T2, S6T1/T2, S3T1/T2 and S12T1/T2. Tissue and tumour areas were evaluated by two independent
Detection of 549 new HLA alleles in potential stem cell donors from the United States, Poland and Germany
 HLA ISSN 2059-2302 BRIEF COMMUNICATION Detection of 549 new HLA alleles in potential stem cell donors from the United States, Poland and Germany C. J. Hernández-Frederick 1, N. Cereb 2,A.S.Giani 1, J.
Supplementary Figure 1
 Supplementary Figure 1 Supplementary Figure 1: Cryopreservation alters CD62L expression by CD4 T cells. Freshly isolated (left) or cryopreserved PBMCs (right) were stained with the mix of antibodies described
Supporting Information. Mutational analysis of a phenazine biosynthetic gene cluster in
 Supporting Information for Mutational analysis of a phenazine biosynthetic gene cluster in Streptomyces anulatus 9663 Orwah Saleh 1, Katrin Flinspach 1, Lucia Westrich 1, Andreas Kulik 2, Bertolt Gust
Cancer Genetics 204 (2011) 45e52
 45e52") Cancer Genetics 204 (2011) 45e52 Exon scanning by reverse transcriptaseepolymerase chain reaction for detection of known and novel EML4eALK fusion variants in nonesmall cell lung cancer Heather R. Sanders
Cancer Genetics 204 (2011) 45e52 Exon scanning by reverse transcriptaseepolymerase chain reaction for detection of known and novel EML4eALK fusion variants in nonesmall cell lung cancer Heather R. Sanders
TetR repressor-based bioreporters for the detection of doxycycline using Escherichia
 Supplementary materials TetR repressor-based bioreporters for the detection of doxycycline using Escherichia coli and Acinetobacter oleivorans Hyerim Hong and Woojun Park * Department of Environmental
SUPPLEMENTARY INFORMATION
 BASELINE ISCHAEMIA a b Phd2 +/- c d Collateral growth and maintenance SMC recruitment SMC proliferation Phd2 +/- NF- B off NF- B on NF- B on NF- B on Endothelial cell Smooth muscle cell Pro-arteriogenic
PATIENTS AND METHODS. Subjects
 PATIENTS AND METHODS Subjects Twenty-nine morbidly obese subjects involved in a gastric surgery program were enrolled in the study between October 25 and March 21. Bariatric surgery was performed in patients
Mechanistic and functional insights into fatty acid activation in Mycobacterium tuberculosis SUPPLEMENTARY INFORMATION
 Mechanistic and functional insights into fatty acid activation in Mycobacterium tuberculosis Pooja Arora 1, Aneesh Goyal 2, Vivek T atarajan 1, Eerappa Rajakumara 2, Priyanka Verma 1, Radhika Gupta 3,
Nature Genetics: doi: /ng Supplementary Figure 1. Rates of different mutation types in CRC.
 Supplementary Figure 1 Rates of different mutation types in CRC. (a) Stratification by mutation type indicates that C>T mutations occur at a significantly greater rate than other types. (b) As for the
Supplementary Information
 Supplementary Information Remodeling of heterochromatin structure slows neuropathological progression and prolongs survival in an animal model of Huntington s disease Junghee Lee, Yu Jin Hwang, Yunha Kim,
Supplementary information
 Supplementary information Unique polypharmacology nuclear receptor modulator blocks inflammatory signaling pathways Mi Ra Chang 1, Anthony Ciesla 1, Timothy S. Strutzenberg 1, Scott J. Novick 1, Yuanjun
Phylogenetic analysis of human and chicken importins. Only five of six importins were studied because
 Supplementary Figure S1 Phylogenetic analysis of human and chicken importins. Only five of six importins were studied because importin-α6 was shown to be testis-specific. Human and chicken importin protein
Journal: Nature Methods
 Journal: Nature Methods Article Title: Network-based stratification of tumor mutations Corresponding Author: Trey Ideker Supplementary Item Supplementary Figure 1 Supplementary Figure 2 Supplementary Figure
SUPPLEMENTARY INFORMATION
 SUPPLEMENTARY INFORMATION Autonomous Multistep Organic Synthesis in a Single Isothermal Solution Mediated by a DNA Walker Yu He and David R. Liu* Supplementary Methods General Methods. DNA oligonucleotides
Supplementary Figure 1: GPCR profiling and G q signaling in murine brown adipocytes (BA). a, Number of GPCRs with 2-fold lower expression in mature
. a, Number of GPCRs with 2-fold lower expression in mature") Supplementary Figure 1: GPCR profiling and G q signaling in murine brown adipocytes (BA). a, Number of GPCRs with 2-fold lower expression in mature BA vs. preadipocytes. b, Number of GPCRs with 2-fold
Supplementary Figure 1: GPCR profiling and G q signaling in murine brown adipocytes (BA). a, Number of GPCRs with 2-fold lower expression in mature BA vs. preadipocytes. b, Number of GPCRs with 2-fold
Nature Genetics: doi: /ng Supplementary Figure 1. SEER data for male and female cancer incidence from
 Supplementary Figure 1 SEER data for male and female cancer incidence from 1975 2013. (a,b) Incidence rates of oral cavity and pharynx cancer (a) and leukemia (b) are plotted, grouped by males (blue),
CIRCRESAHA/2004/098145/R1 - ONLINE 1. Validation by Semi-quantitative Real-Time Reverse Transcription PCR
 CIRCRESAHA/2004/098145/R1 - ONLINE 1 Expanded Materials and Methods Validation by Semi-quantitative Real-Time Reverse Transcription PCR Expression patterns of 13 genes (Online Table 2), selected with respect
Nature Genetics: doi: /ng Supplementary Figure 1. Country distribution of GME samples and designation of geographical subregions.
 Supplementary Figure 1 Country distribution of GME samples and designation of geographical subregions. GME samples collected across 20 countries and territories from the GME. Pie size corresponds to the