Species-specific kinetics and zonation of hepatic DNA synthesis induced by ligands of PPAR
|
|
|
- Shannon Shields
- 5 years ago
- Views:
Transcription
1 Species-specific kinetics and zonation of hepatic DNA synthesis induced by ligands of PPAR Abdullah Al Kholaifi *, Abeer Amer *, Brett Jeffery *, Tim J B Gray, Ruth A Roberts, David R Bell * * School of Biology, University of Nottingham, University Park, Nottingham NG7 2RD, UK Sanofi-Aventis, Willowburn Avenue, Alnwick, Northumberland NE66 2JH, UK AstraZeneca Pharmaceuticals plc, Alderley Park, Nr Macclesfield, Cheshire SK10 4TJ, UK to whom correspondence should be addressed. Phone (44) david.bell@nottingham.ac.uk Fax (44) Short Title: Peroxisome proliferator-induced liver growth 21/2/09 Page 1
2 Abstract PPAR ligands evoke a profound mitogenic response in rodent liver, and the aim of this study was to characterise the kinetics of induction of DNA synthesis. The CAR ligand, 1,4-bis[2-(3,5- dichoropyridyloxy)]benzene, caused induction of hepatocyte DNA synthesis within 48 hours in 129S4/SvJae mice, but the potent PPAR ligand, ciprofibrate, induced hepatocyte DNA synthesis only after 3 or 4 days dosing; higher or lower doses did not hasten the DNA synthesis response. This contrasted with the rapid induction (24 hours) reported by Styles et al. (Carcinogenesis 9: ). C57BL/6 and DBA/2J mice showed significant induction of DNA synthesis after 4, but not 2, days ciprofibrate treatment. Alderley Park and 129S4/SvJae mice dosed with methylclofenapate induced hepatocyte DNA synthesis at 4, but not 2, days after dosing, and proved that inconsistency with prior work was not due to a difference in mouse strain or PPAR ligand. Ciprofibrate-induced liver DNA synthesis and growth was absent in PPAR null mice, and are PPAR -dependent. In the Fisher344 rat, hepatocyte DNA synthesis was induced at 24 hours after dosing, with a second peak at 48 hours. Lobular localisation of hepatocyte DNA synthesis showed preferential periportal induction of DNA synthesis in rat, but panlobular zonation of hepatocyte DNA synthesis in mouse. These results characterise a markedly later hepatic induction of panlobular DNA synthesis by PPAR ligands in mouse, compared to rapid induction of periportal DNA synthesis in rat. Keywords: liver growth, hepatocyte, PPAR, peroxisome proliferation, DNA synthesis 21/2/09 Page 2
3 Introduction The peroxisome proliferators were originally characterised as a class of structurally diverse compounds that caused liver cancer in rodents {Reddy, 1980 #81}, and induced substantial changes in liver ultrastructure, including proliferation of endoplasmic reticulum and peroxisomes. This class of agents is now known to act through activation of the Peroxisome Proliferator-Activated Receptor (PPAR ) {Issemann, 1990 #70}, and it is clear that this class of carcinogen has a non-genotoxic mode of action {Ashby, 1994 #55; Peters, 1997 #40}. The potent carcinogenicity of this class is shown by the fact that Wy-14,643 can induce 100% multifocal liver cancer in rodents after one year {Cattley, 1991 #68}. Ciprofibrate and methylclofenapate are potent PPAR ligands {Mukherjee, 2002 #219} that are also potent hepatocarcinogens {Meyer, 2003 #235; Tucker, 1995 #241}. The mechanism whereby PPAR ligands cause cancer is still largely unclear {Ashby, 1994 #55; Klaunig, 2003 #242; Peters, 2005 #243}. It is clear that DNA synthesis plays an important role in carcinogenesis, and peroxisome proliferators induce hepatic DNA synthesis which is related to carcinogenesis {Marsman, 1988 #77}. It is therefore desirable to understand the mechanisms controlling the induction of DNA synthesis by ligands of the PPAR, particularly since these ligands augment normal liver size, in contrast to the regenerative growth pathways induced by partial hepatectomy {Mangnall, 2003 #245}. The mechanisms underlying PPAR ligand-induced augmentative liver growth are poorly understood {Menegazzi, 1997 #124; Peters, 2005 #243}, beyond noting that DNA synthesis is dependent upon the PPAR {Peters, 1997 #40}. The availability of mouse genetic tools {Ledda-Columbano, 2002 #112; Lee, 1995 #53} combined with the potent liver growth effect of PPAR ligands in the mouse {Peters, 1997 #40}, provides a compelling reason for using the mouse to characterise the kinetics and mechanisms of induction of hepatocyte DNA synthesis. It is important to characterise the kinetics of induction of DNA synthesis by PPAR ligands in the mouse, as this information is essential for understanding the relationship with genes that regulate the induction of DNA synthesis. The early kinetics of induction of DNA synthesis by PPAR ligands were characterised using flow cytometry to characterise DNA synthesis in rodent liver {Styles, 1987 #80}. Methylclofenapate (MCP) induced high levels of DNA synthesis by as early as 24 hours after dosing in the Alderley Park (AP) mouse {Styles, 1988 #78}, and the kinetics of induction were confirmed by another study in C57BL/6 mice {Styles, 1990 #73}. However, there is one report using immunohisto- 21/2/09 Page 3
4 chemical detection of BromodeoxyUridine (BrdU) incorporation in the CD-1 mouse that shows induction of DNA synthesis only after three/ four days of dosing with the potent PPAR ligand, ciprofibrate, {Ledda-Columbano, 2003 #88}, and so this area is in dispute. Characterisation of the kinetics of induction of DNA synthesis is crucial for understanding the relationship with induced genes that might regulate this response, and so we have examined the time course of induction of hepatocyte DNA synthesis by PPAR ligands in several mouse strains, and in the rat. In contrast to previous reports, we show that there are species-specific kinetics of induction of DNA synthesis, and that the zonation of PPAR ligand-induced DNA synthesis is different between mouse and rat. 21/2/09 Page 4
5 Materials And Methods All the chemicals were of the highest quality available. Ciprofibrate was a kind gift of Sanofi- Aventis, and methylclofenapate (MCP), a kind gift of Dr C R Elcombe (CXR Biosciences, Dundee) was synthesised by Lancaster synthesis Ltd, Morecambe, Lancs, UK. TCPOBOP was obtained from Sigma (Poole, UK). 129S4/SvJae mice, and their PPAR null congenic strain (129S4/Jae-Ppara tm1gonz/tm1gonz ) {Lee, 1995 #53} were a kind gift of Frank Gonzalez (NIH, MD, USA), and were maintained as a colony in house. C57BL/6J:CRL and DBA/2J mice were obtained from Charles River Laboratories, Alderley Park (AP) mice from AstraZeneca Pharmaceuticals, and male Fischer 344 rats (F344/NHsd) were purchased from Harlan UK Ltd (Bicester, UK). Chronic treatment protocol. Mice (8-9 weeks old) or rats (14-15 weeks old) were randomised to treatment groups (normally n=6), then acclimatised to 10% orange juice in tap water as their sole source of drinking water for one week. Bromodeoxyuridine (BrdU) was then added to the 10% orange juice (0.8 mg ml -1 final concentration), and after one day of exposure to the BrdU, animals were dosed by gavage with xenobiotic in corn oil (20 ml kg -1 bodyweight), then dosed as indicated until killed by pentobarbital overdose. Body weight was determined daily throughout the procedure. Acute rat treatment protocol. Rats (14-15 weeks old) were randomised to treatment group, then dosed with peroxisome proliferator (in corn oil, 20 ml kg -1 bodyweight) by gavage. At the indicated time after treatment, animals were dosed i.p. with 100 mg kg -1 bodyweight of BrdU in sterile phosphate-buffered saline. Animals were killed by i.p. pentobarbital overdose 2 hours after BrdU administration. Immunohistochemistry. A blood sample was taken at necropsy, and serum prepared, followed by storage at -80 C until determination of alanine aminotransferase activity (ALT). The liver was weighed, and a section of left lobe and small intestine were fixed in 10% neutral buffered formalin overnight at room temperature. Fixed tissues were used to prepare blocks, then heat induced epitope retrieval used with the Amersham mouse anti-brdu labelling system to visualise BrdU; the specific nuclear staining required both primary and secondary antibodies, and administration of BrdU (data not shown). Slides were counterstained with Harris haemotoxylin, then mounted with distyrene, plasticiser and xylene. For each animal, 2000 hepatocyte nuclei were scored in random fields, and the labelling index is (BrdU labelled hepatocyte nuclei/ total hepatocyte nuclei)*100. Hepatocytes were identified morphologically. A sample of small intes- 21/2/09 Page 5
6 tine from each animal was tested as a positive control. For the determination of zonal distribution of labelled hepatocytes, the method was essentially as described {Barrass, 1993 #92}. Briefly, a field was defined as a radius of five to seven cells around either the portal space (the periportal region) or the central vein (the perivenous region), using small vessels of similar size. Five fields were counted for each of the periportal and centrilobular zones for each animal, and the total number of labelled nuclei was recorded. Statistics. Students t-test was used for comparison of two groups, and a paired t-test for examining body weight loss. ANOVA followed by a post-hoc test (Dunnett s, Newman-Keuls) was used for multiple comparisons. For time-course studies, the control group timepoints were tested to determine if they were significantly different from each other. If not, the control group values were pooled, and the pooled values used for comparisons against the treated groups (Fig. 2A, C, Fig. 3, Fig. 4, Fig. 5A). 21/2/09 Page 6
7 Results Experiments were undertaken to determine whether PPAR ligands induce hepatic DNA synthesis in mice at 24 hours after dosing {Styles, 1990 #73; Styles, 1988 #78}. Male 129S4/SvJae mice were administered the potent PPAR ligand, ciprofibrate, and hepatocytes labelled with BrdU, essentially as described for the rat acute dosing protocol (Materials and Methods), except with i.p. administration of ciprofibrate. This protocol yielded satisfactory staining of intestinal nuclei for BrdU as a positive control for labelling, but showed no significant induction of hepatocyte DNA synthesis over hours, over a dose range of mg ciprofibrate kg -1 bodyweight (unpublished data). Administration of BrdU at 2 hours before death limits the window for detection of DNA synthesis to two hours, and so BrdU was administered continuously in the drinking water to ensure that there was continuous exposure to BrdU. Continuous exposure to BrdU is known to be more sensitive for detecting low levels of DNA synthesis, or where DNA synthesis occurs over a period of days {Eldridge, 1990 #226}. Although BrdU has been administered in the drinking water at doses of 1 mg ml -1, e.g. {Ledda-Columbano, 2003 #88}, administration of BrdU at 0.8 mg ml -1 in the drinking water led to significant body weight loss in Balb/ c or 129S4/SvJae mice (data not shown); several studies show body weight loss with BrdU in the drinking water {Reome, 2000 #238; Jecker, 1997 #240}, attributed to the bitter taste of the BrdU. Therefore, 129S4/SvJae mice were acclimatised to 10% orange juice as the sole source of drinking water for one week, before adding the BrdU (0.8 mg ml -1 ) to the 10% orange juice; the hypothesis was that the orange juice would mask the taste of the BrdU. This protocol yields stable mouse body weights (Fig. 1A), and effective labelling of a positive control tissue, the small intestine (Supplementary Figure 1): note that the nuclear labelling of intestinal cells is uniform throughout the length of villus stained, showing that there is consistent BrdU-staining, and suggesting consistent bioavailability of BrdU, throughout the period of dosing with BrdU. A single dose of mg kg -1 ciprofibrate did not increase serum ALT levels, demonstrating that these doses of ciprofibrate did not cause hepatotoxicity, and regenerative regrowth in the liver (Fig. 1A). These doses did increase liver weight at 48 hours after dosing, which was statistically significant (Fig. 1A), but failed to cause a statistically significant increase in labelling of hepatocyte labelling index (Fig. 1A). In order to verify that the chronic BrdU labelling protocol leads to efficient incorporation of BrdU label in liver, as well as intestine, animals were treated with the CAR agonist, 1,4-bis[2- (3,5-dichoropyridyloxy)]benzene (TCPOBOP), at 3 mg kg -1, which is characterised to cause 21/2/09 Page 7
8 rapid induction of DNA synthesis in CD-1 mice {Ledda-Columbano, 2003 #88}. There was a statistically significant three-fold increase in ALT in male, but not female, mice (data not shown), showing a small effect on liver cell damage. The liver to body weight ratio was significantly increased in both male and female mice (Fig. 1B), and the hepatocyte labelling index was induced by TCPOBOP treatment to 25-50% (Fig. 1B,C,D). Thus the BrdU dosing methodology leads to effective labelling of hepatocyte DNA synthesis that has been induced within 48 hours of xenobiotic (TCPOBOP) treatment in 129S4/SvJae mice; consequently an artefact of dosing methodology can be excluded as a reason for the failure to detect induction of hepatic DNA synthesis in mouse by PPAR ligands (Fig. 1). The time course of the hepatic response to ciprofibrate was examined, to determine if the DNA synthesis response occurs at a later stage than in the first two days after dosing. Fig. 2 shows that liver weight is significantly increased as early as 2 days after dosing, and that liver weight has increased by ~100% at 6 days after dosing commenced. The DNA synthesis response was later than the liver growth, with significant induction after three days of administration of ciprofibrate (although with large variation) and subsequently (Fig. 2A). In order to ensure that the kinetics of induction of DNA synthesis was not an artefact of too high or low a dose, the hepatocyte DNA synthesis response was examined after three or four days of dosing with ciprofibrate (Fig. 2B). As little as 10 mg kg -1 day -1 of ciprofibrate caused a significant increase in liver to body weight ratio, and there was a tendency for the increase in weight to be larger after four days, compared to three days (Fig. 2B). In this experiment, the induction of DNA synthesis was lower at three days than in the previous experiment (Fig. 2A,B), but the induction of DNA synthesis was statistically signficant. At four days after dosing, there was a robust induction of hepatocyte DNA synthesis at 30, or 100 mg kg -1 day -1 of ciprofibrate (Fig. 2B), and this latter dose was demonstrated to give the highest induction of DNA synthesis. The hepatic effects of ciprofibrate were examined in female mice to determine if there was a sex difference in response. The liver to body weight ratio was significantly induced after three or four days of dosing (Fig. 2C), but hepatocyte DNA synthesis was only significantly increased after four (but not three) days of dosing (Fig. 2C), comparable with the male, showing that there is no marked sex difference in induction of hepatocyte DNA synthesis by PPAR ligands. Thus ciprofibrate induced hepatocyte DNA synthesis only after three/ four days of dosing, and the dose giving the highest induction of DNA synthesis has been defined. 21/2/09 Page 8
9 These studies had used the 129S4/SvJae mouse, and strain differences were one explanation for the fact that the response seen in (Fig. 2) is much later than that reported by Styles {Styles, 1988 #78; Styles, 1990 #73}. Therefore, we investigated the induction of hepatocyte DNA synthesis in C57BL/6J mice; however the results are essentially similar to those seen in 129S4/SvJae mice, with significant induction of hepatocyte DNA synthesis after four (but not two) days of dosing with ciprofibrate (Fig. 3A). DBA/2J mice were also dosed using a similar protocol (Fig. 3B); liver: body weight ratio is significantly induced at two days after dosing, but the hepatic labelling index is not significantly increased at two days after dosing, but is significantly increased at four and six days after dosing commenced. It is therefore less likely that the discrepancy between this study, and the work of Styles {Styles, 1988 #78; Styles, 1990 #73}, is simply due to an idiosyncracy of the 129S4/SvJae mouse strain, since these workers had shown that methylclofenapate induces hepatocyte DNA synthesis by 24 hours in C57BL/6 mice {Styles, 1990 #73}. In order to exclude the possibility that ciprofibrate may have some effect that is not mediated by the PPAR, the effects of ciprofibrate were tested in congenic 129S4/ SvJae mice which are nullizygous for the PPAR (unpublished data). These data showed that ciprofibrate at 100 mg kg -1 day -1 had no significant effect on liver to body weight ratio, nor on the hepatocyte labelling index, or ALT (data not shown), consistent with the work of Peters et al. {Peters, 1997 #40}. This proves that the induction of liver growth and hepatic DNA synthesis by ciprofibrate requires PPAR, and given that ciprofibrate is a known PPAR ligand and peroxisome proliferator{meyer, 2003 #235; Mukherjee, 2002 #219}, this constitutes proof that these effects are caused by a direct action of ciprofibrate on the PPAR. Styles showed rapid induction of hepatic DNA synthesis in Alderley Park (AP) mice, using MCP, and given the importance of this report, we undertook a direct comparison between 129S4/SvJae and AP mice using the same dose of the same peroxisome proliferator (MCP) used by Styles {Styles, 1988 #78}. MCP caused a significant induction of liver growth at days two to four after dosing commenced (Fig. 4A) in 129S4/SvJae mice, and showed significant induction of hepatocyte DNA synthesis after three or four (but not two) days of dosing (Fig. 4A); this is consistent with previous data using the PPAR ligand, ciprofibrate (Fig. 1-Fig. 3). When this experiment was repeated using AP mice, similar results were obtained (Fig. 4B): hepatic growth was statistically significant after 2-4 days of dosing, but labelling index was not significantly increased after one, two or three days dosing, and was only statistically significantly increased after four days of dosing with MCP. These data exclude mouse strain or peroxisome proliferator as a cause of the delayed hepatic DNA synthesis response seen with our data, as compared to 21/2/09 Page 9
10 the results of Styles {Styles, 1988 #78; Styles, 1990 #73}, and provide strong evidence that the induction of hepatic DNA synthesis by PPAR ligands is delayed until after three/ four days in the mouse. A direct comparison was made with the induction of hepatic DNA synthesis by ciprofibrate in the Fisher 344 rat. Hepatocyte DNA synthesis was significantly increased at 24, 48 and 96 hours after dosing when using the chronic BrdU dosing protocol, attaining a 38% labelling index (Fig. 5A). The labelling index at the 24 hour time point was significantly different from control (control 1.33 ± 0.37% (mean and SD) versus ciprofibrate 4.4 ± 2.3%) on a t-test. Chronic dosing with BrdU involves exposing animals to the labelling agent for a period of days, thereby leading to a high background value for DNA synthesis in the control group as a result of DNA synthesis over the whole of this period. Therefore, the experiment was repeated using an acute i.p. dose of BrdU at two hours before killing the animals, to characterise the DNA synthesis response within the shorter time frame of the first 48 hours after dosing. The liver weight was slightly, but significantly, increased at 30 and 36 hours after dosing, with a larger increase at 48 hours after dosing with ciprofibrate (Fig. 5A). In contrast to the mouse (Fig. 1-Fig. 4), ciprofibrate significantly induced hepatocyte DNA synthesis as early as 24 hours after dosing, with levels falling back to background before a second wave of DNA synthesis at 48 hours after the first dose (Fig. 5B). The induction of hepatocyte DNA synthesis at 24 hours was examined by varying the dose of ciprofibrate, confirming an early induction of hepatocyte DNA synthesis at 24 hours, and further showing that mg ciprofibrate kg -1 bodyweight are optimal doses for inducing hepatocyte DNA synthesis (Fig. 5C). At 300 mg ciprofibrate kg -1 bodyweight, there is no significant induction of liver to bodyweight ratio, and no induction of hepatocyte DNA synthesis; the diminished nature of these responses, compared with lower doses, suggests that 300 mg kg -1 bodyweight is overtly toxic and is suppressing the liver growth response. These results demonstrate that there is a species difference between mouse and rat in the kinetics of induction of hepatocyte DNA synthesis by PPAR ligands. Given these distinct results in mouse and rat, the lobular zonation of induction of hepatocyte DNA synthesis in liver was examined, as previously described {Barrass, 1993 #92}. Fig. 6A shows that there is marked periportal distribution of labelled hepatocyte nuclei in the rat, whereas the mouse shows a pan-lobular distribution of labelled cells. Quantification of these data (Fig. 6B) shows that there is a difference in the zonation of induced hepatocyte DNA synthesis between the rat and mouse, with statistically significant preferential periportal induction of 21/2/09 Page 10
11 DNA synthesis by PPAR ligands in the Fisher344 rat, and no significant difference between periportal and centrilobular induction of DNA synthesis in the 129S4/SvJae mouse. The data in Fig. 6B are typical of data from 129S4/SvJae mice treated with mg ciprofibrate kg -1 day - 1 for three or four days, 100 mg ciprofibrate kg -1 day -1 for three to 6 days, 25 mg kg -1 day -1 methylclofenapate for three or four days, or C57BL/6 mice treated with 100 mg ciprofibrate kg - 1 day -1 for four days (Data not shown). Likewise, the preferential periportal distribution of induced DNA synthesis in rat hepatocytes is consistent over a dose range of mg ciprofibrate kg -1, and when using a chronic BrdU administration regime (data not shown). 21/2/09 Page 11
12 Discussion The mouse and rat show differential kinetics of induction of hepatocyte DNA synthesis after exposure to PPAR ligands, with the mouse response being delayed to three days after dosing. Given that these results differ from previous work {Styles, 1988 #78; Styles, 1990 #73}, it was necessary to to undertake extensive controls. Immunohistochemical detection of incorporated BrdU has been extensively validated for detection of replicating hepatocytes (e.g. {Eldridge, 1990 #226; Ledda-Columbano, 2003 #88}), and positive controls include labelling of intestine, labelling in liver from mice treated with the CAR ligand, TCPOBOP and that results obtained using acute and chronic BrdU-dosing protocols were comparable. Hence the labelling regime and immunohistochemical detection system were robustly validated for detecting early induction of DNA synthesis. BrdU treatment can decrease body weight (unpublished data), and so mouse body weight was measured, although this elementary control is not often described in the literature; mouse body weight was found to be unaffected by BrdU in all experiments shown. PPAR ligands can cause (focal) necrosis (e.g. {Woods, 2007 #212}), thereby leading to regenerative growth; therefore serum ALT (a marker of liver cell damage) was shown to be unaffected by the doses of PPAR ligands used in this study, and there was no evidence of necrosis detected by examination of histological sections (not shown). These control experiments prove unambiguously that ciprofibrate fails to induce hepatocyte DNA synthesis within two days after dosing. Styles found rapid induction of hepatocyte DNA synthesis by PPAR ligands in Alderley Park (AP) {Styles, 1988 #78} and heterozygous Snell dwarf mice on C57BL/6 {Styles, 1990 #73}, whereas our results were obtained in 129S4/SvJae mice, suggesting a strain difference in response. Mouse strain can affect liver function {Akiyama, 2001 #221; Manenti, 1994 #223}, but published evidence that strain differences affect peroxisome proliferation is inconclusive {Budroe, 1992 #63; Dwivedi, 1989 #250; Jones, 1995 #50}. C57BL/6 and DBA/2J mice were treated with ciprofibrate, showing that the kinetics of induction of liver growth and DNA synthesis were similar to that in 129S4/SvJae mice. AP mice are an outbred stock of Swiss origin {Beck, 2000 #224; Chia, 2005 #225}, and so we directly tested in AP mice using the same dose of the same PPAR ligand described in {Styles, 1988 #78}. The induction of hepatocyte DNA synthesis response was delayed to three/ four days after administration of MCP in 129S4/SvJae and in AP mice, thus showing remarkably little effect of strain difference in the response of the mouse to PPAR ligands in three different mouse strains. Thus, we have been unable to repli- 21/2/09 Page 12
13 cate the results of Styles in both mouse strains; while it is possible that the AP mice, being outbred, may have undergone strain drift, the C57BL/6 mice are inbred, and are unlikely to show significant strain drift. Moreover, the concordance between the results obtained in 129S4/SvJae, AP, C57BL/6J and DBA/2J mice in our hands excludes the possibility that the discordance between our data, and those of Styles {Styles, 1988 #78; Styles, 1990 #73}, arises from mouse strain differences. The possibility that ciprofibrate had off-target (i.e. non-ppar mediated) effects that confounded its liver growth function was also considered. Ciprofibrate is a potent PPAR ligand {Mukherjee, 2002 #219}, has similar effects to another potent {Bell, 1991 #67; Bell, 1991 #65} PPAR ligand, MCP, and the use of PPAR -nullizygous mice provides compelling evidence that the liver growth and DNA synthesis effects of ciprofibrate are mediated by the PPAR. It is difficult to explain the difference in kinetics of induction of DNA synthesis reported by Styles {Styles, 1988 #78; Styles, 1990 #73}, and in this study. Table 1 compares the methodolgy used by Styles et al and in this paper, and the principal remaining variable is that this study used immunohistochemical detection of incorporated BrdU, whereas Styles detected incorporated BrdU by isolation of hepatocytes, and flow cytometry of the isolated hepatocytes {Styles, 1987 #80}. PPAR ligands cause an increase in liver size, and the consequent increase in hepatocyte size (unpublished data) could cause differential recovery of liver cells during the hepatocyte isolation procedure between control and treated animals, or alternatively may differentially affect the propidium iodide staining. There are no controls to determine whether this is so; and both of these issues could introduce artefactual error into the determination of the proportion of labelled hepatocytes by flow cytometry. Miller et al. were unable to replicate the results of Styles on rat hepatocyte ploidy {Miller, 1996 #46; Styles, 1987 #80}, which shows difficulty in reproducing results obtained by the flow cytometry methodology. The reason for the difference in results remains obscure, but we have excluded the choice of PPAR ligand, dose, sex and strain differences as possible variables. Further, our results are consistent with other reports {Ledda-Columbano, 2003 #88}, and so we conclude that the induction of hepatocyte DNA synthesis is delayed until three days after administration of PPAR ligand, and we propose that the results obtained by Styles are an artefact arising from the cell isolation and flow cytometric analysis of liver cells. 21/2/09 Page 13
14 The delayed induction of hepatocyte DNA synthesis in the mouse is distinct from the rapid induction of DNA synthesis in the rat. Our results in the rat are consistent with our previous demonstration that PPAR ligands cause rapid (ca. 24 hours) induction of DNA synthesis in rat hepatocytes in vitro {Plant, 1998 #35; Plant, 1998 #39}, and the finding that the PPAR ligands, nafenopin and Wyeth-14,643, causes induction of hepatic DNA synthesis at 24 hours after dosing in Wistar and Fisher344 rats, respectively {Menegazzi, 1997 #124; Miller, 1996 #46}. However, it is essential to use the same methodology in the same laboratory to obtain a reliable comparison of mouse and rat. This delayed response of the mouse to induction of hepatocyte DNA synthesis is reminiscent of the response to partial hepatectomy, where mouse hepatocyte DNA synthesis commences hours later than in the rat; after partial hepatectomy, it has been shown that the faster response of the rat hepatocyte is cell autonomous {Weglarz, 2000 #229}. However, the delayed induction of DNA synthesis in mouse does not reflect an intrinsic lack of capability in the mouse hepatocyte, as TCPOBOP triggers a fast DNA synthesis response, signalling via the CAR receptor. Thus the kinetics of induction of hepatocyte DNA synthesis are specific to the signalling pathway initiating DNA synthesis. The delayed induction of DNA synthesis response in mouse by PPAR ligands is unlikely to be due to a species difference in the amount of the PPAR, since the receptor is present at high levels in mouse, compared to other rodents {Bell, 1998 #36; Choudhury, 2000 #31; Choudhury, 2004 #12}. The distinct species-specific kinetics of induction of hepatocyte DNA synthesis is associated with altered zonation of induced DNA synthesis, where the rat shows preferential induction of DNA synthesis in the periportal region, and the mouse shows pan-lobular induction of DNA synthesis. The zonation of induction of enzymes by various xenobiotics has been extensively demonstrated {Bars, 1992 #64; Oinonen, 1994 #232}, but the zonal induction of DNA synthesis is much less well characterised, although reliable methods have been established {Barrass, 1993 #92}. Our results confirm and extend the findings of Barrass et al., by showing that a distinct PPAR ligand, ciprofibrate, also induces zonal induction of hepatocyte DNA synthesis in rat, and by showing that DNA synthesis does not show zonal distribution in several mouse strains. The periportal distribution of induced hepatocyte DNA synthesis in rat is distinct from the preferentially centrilobular induction of cytochrome P450 and peroxisomal enzymes induced by PPAR -ligands {Bars, 1993 #60; Bell, 1991 #67}, yet the induction of both DNA synthesis and enzymes are PPAR -dependent. This suggests that PPAR -independent mechanism must be responsible for the distinct zonation of DNA synthesis and peroxisomal enzymes. Characterisation of the zonal distribution of the PPAR - associated coactivators, or micrornas that are 21/2/09 Page 14
15 known to be required for induction of DNA synthesis {Matsumoto, 2007 #3}{Shah, 2007 #2}, are obvious candidates for mediating these PPAR -independent effects. While it is known that Apc is the zonation-keeper in mouse liver {Benhamouche, 2006 #251}, it is not clear that exactly the same pathway applies in rat liver. Given the complex web of interactions between Apc and -catenin, and that -catenin signalling regulates liver growth pathways {Tan, 2006 #252}, it can be hypothesised that species differences in regulation of the -catenin signalling pathway mediate PPAR -ligand induced hyperplasia and lobular localisation. Given the availability of liver-specific knockouts of -catenin {Tan, 2006 #252}, this hypothesis is partly experimentally tractable. The definition of the rapid induction of hepatocyte DNA synthesis in rat by PPAR ligands opens up opportunities for investigating the mechanism of induction of the growth response, by relating the early gene induction events to subsequent hyperplasia. There is evidence that the liver growth programme induced by PPAR ligands is quite distinct from that seen during regeneration or after treatment with growth factors e.g. {Menegazzi, 1997 #124; Plant, 1998 #35; Plant, 1998 #39}: the PPAR -ligand induced growth defined in this paper offers a tractable system for investigating how augmentative liver growth is regulated. 21/2/09 Page 15
16 Acknowledgements The authors wish to thank Declan Brady for expert technical assistance, Professor J.M. Behnke for provision of facilities for histological analysis, and Dr Sandy Brown for help with ALT assays and analysis. BRJ received a studentship from Sanofi-Synthelabo, and AAK wishes to acknowledge receipt of a scholarship from the Saudi Arabian government. We wish to thank Frank Gonzalez (NIH, Bethesda, MD, USA) and Jeff Peters (Pennsylvania State, PA, USA) for the kind gift of 129S4/SvJae and PPAR -null mice, and Professor Brian G. Lake for critical review of the manuscript. 21/2/09 Page 16
17 TABLE 1: Comparison Of Studies Of Induction Of Liver Hyperplasia Study Styles A This study This study Styles A Styles B This study This study This study This study This study Species Rat Mouse Strain AP F344/NHsd F344/NHsd AP B6.DW- Pou1f1 dw /J heterozygotes AP C57BL/6J 129S4/ SvJae 129S4/ SvJae DBA/2J PPAR agonist MCP Cip Cip MCP MCP MCP Cip MCP Cip Cip Dose 5, 12, 25 mg 50, 100,200, kg -1 day mg kg -1 day mg kg -1 day -1 5, 12, 25 mg kg -1 day mg kg -1 day mg kg -1 day mg kg -1 day mg kg -1 day -1 10,30, 100, 200, 300 mg kg -1 day mg kg -1 day -1 Route of administration gavage in corn oil gavage in corn oil gavage in corn oil gavage in corn oil gavage in corn oil gavage in corn oil gavage in corn oil gavage in corn oil gavage in corn oil gavage in corn oil Dose of BrdU 25 Mol 326 Mol kg mm 25 Mol 25 Mol 2.61 mm 2.61 mm 2.61 mm 2.61 mm 2.61 mm Route of administration i.p. injection 6 hours before kill i.p. injection 2 hours before kill In drinking water from one day before Cip i.p. injection 6 hours before kill i.p. injection 6 hours before kill In drinking water from one day before MCP In drinking water from one day before Cip In drinking water from one day before MCP In drinking water from one day before Cip In drinking water from one day before Cip Assessment of labelling index Flow Cytometry IHC IHC Flow Cytometry Flow Cytometry IHC IHC IHC IHC IHC A comparison of the methods used to measure hepatic DNA synthesis by Styles et al in publications A {Styles, 1988 #78} or B {Styles, 1990 #73}, and this study. MCP is methylclofenapate, Cip is ciprofibrate, i.p. is intraperitoneal, and IHC is immunohistochemistry. In this study, BrdU was present continuously in the drinking water, beginning one day before administration of PPAR agonist.
18 Figure Legends FIG. 1. Ciprofibrate does not induce hepatic DNA synthesis within 48 hours in mice. A, Groups of six male 129S4/SvJae mice (8-9 weeks old) were acclimatised to 10% orange juice as sole source of drinking water for one week, then BrdU added to the orange juice at a final concentration of 0.08%(w/v). After one day on BrdU, animals were dosed by gavage with corn oil vehicle (Control), or the indicated dose of ciprofibrate; animals were killed two days after dosing with ciprofibrate. The top left panel shows relative bodyweight of animals in each group (each animal is normalised to day 0, which is set at 1). Results are shown as mean ± Standard Deviation. The period where BrdU was administered is shown by a horizontal line, labelled BrdU, and the time of administration of ciprofibrate by a vertical arrow labelled Ciprofibrate. Body weight was tested with a paired t-test, and there were no significant differences from the time of initial treatment with BrdU. The top right panel shows serum ALT in this experiment; there are no significant differences. Bottom left panel shows the liver-to-bodyweight ratio is shown as a percentage; values marked with a * are significantly different at P<0.05 (Dunnett s multiple comparison test). The bottom right panel shows labelling indices determined for liver sections; all animals were shown to have labelling in intestinal samples (data not shown). There were no significant differences from control at P<0.05. B, groups of male or female mice were treated (as in A), but with a single gavage dose of 3 mg of TCPOBOP kg -1 of bodyweight, dissolved in corn oil. The left panel shows body weight, and the right panel shows hepatocyte labelling index. An asterisk denotes P<0.05 (t-test versus control). There was no effect on body weight in this experiment, but TCPOBOP caused a statistically-significant three-fold increase in serum ALT in male (but not female) mice (not shown). C and D, show typical liver sections labelled with an anti-brdu antibody (black nuclei) and counterstained with haemotoxylin, for male control and TCPOBOP-treated animals, respectively. The scale bar is 50 m. FIG. 2. Kinetics of hepatic response to ciprofibrate in male and female mice. A, Groups of male 129S4/SvJae mice were treated with BrdU, as described in A, and ciprofibrate at 100 mg kg -1 day -1, with the exception that animals were killed at 2-6 days after starting dosing with ciprofibrate. There was no significant effect on relative bodyweight, or serum ALT (Data not shown). The left panel shows the liver to bodyweight ratio, and the right panel shows the hepatocyte labelling index; graphs show the number of days after dosing with corn oil/ ciprofibrate on the X-axis. B, Groups of male 129S4/SvJae mice were dosed with the indicated daily dose of ciprofibrate or vehicle control, and killed after three or four days (the three and four day ex- 21/2/09 Page 18
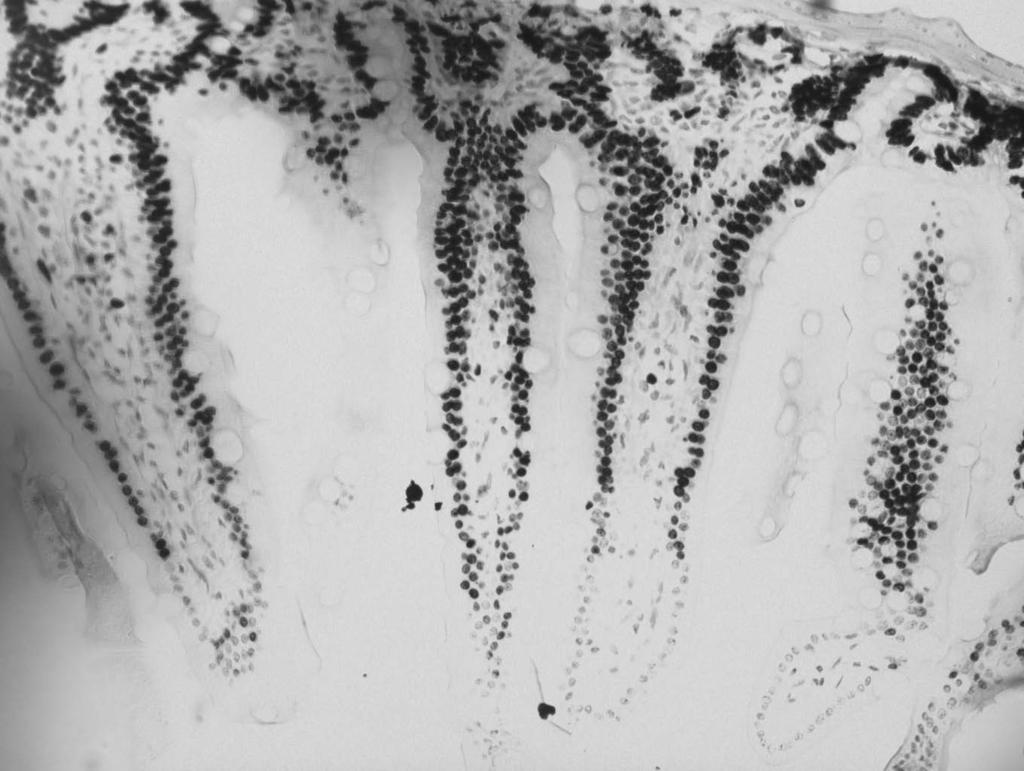
19 periments were not contemporaneous), essentially as described in A. There was no significant effect on relative bodyweight, or serum ALT (Data not shown). The left panel shows the liver to bodyweight ratio, and the right panel shows the hepatocyte labelling index. C, groups of female 129S4/SvJae mice were treated daily with 100 mg kg -1 ciprofibrate or vehicle, as in panel B. There was no significant effect on relative bodyweight, or serum ALT (Data not shown). FIG. 3. Effect of strain and PPAR on hepatic response to ciprofibrate. A, Groups of six C57BL/6J mice were dosed with 100 mg kg -1 day -1 ciprofibrate, or vehicle control, essentially as described for Fig. 2, and killed on days 2 and 4. The left panel shows liver to body weight ratio, and the right panel shows hepatocyte labelling index. B, Groups of six DBA/2J mice were dosed with with ciprofibrate as for A above, and killed on days 2, 4 and 6. The left panel shows liver to body weight ratio, and the right panel shows hepatocyte labelling index. Statisticallysignificant difference from the control group is indicated by an asterisk (P<0.05). FIG. 4. Hepatic response to methylclofenapate in 129 and AP mice. A, Groups of six 129S4/SvJae mice were dosed with 25 mg kg-1 day-1 methylclofenapate essentially as described for Fig. 2. The left panel shows liver to body weight ratio, and the right panel shows hepatocyte labelling index, where * =P<0.05 (Dunnett s multiple comparison test). B, As for A, but using Alderley Park (AP) mice. FIG. 5. Ciprofibrate induces hepatic DNA synthesis in F344 rats. A, Groups of six Fisher 344 rats were acclimatised to 10% orange juice, and then 0.08% BrdU in the 10% orange juice, essentially as described for Figure 1. Animals were then dosed with corn oil vehicle or 50 mg kg -1 day -1 ciprofibrate, and killed on the indicated day for determination of liver weight and labelling index. B, Groups of six Fisher 344 rats were dosed by gavage with 50 mg kg -1 day -1 ciprofibrate, or corn oil vehicle, and injected with 100 mg kg -1 BrdU at 2 hours before termination, as described in the acute labelling protocol in materials and methods. The left panel shows liver to bodyweight ratio at the indicated time, and the right panel shows hepatocyte labelling index. *=P<0.05 (Dunnett s multiple comparison test). C, essentially as described in B, rats were dosed with the indicated dose of vehicle or ciprofibrate, dosed with BrdU i.p. at 22 hours, and killed after 24 hours. Liver to bodyweight ratio is shown in the left panel, and hepatocyte labelling index in the right panel. FIG. 6. Zonation of ciprofibrate-induced hepatocyte DNA synthesis.a, representative photomicrographs of ciprofibrate induced mouse (left) or rat (right) liver sections, after staining for 21/2/09 Page 19
20 BrdU incorporation. B, the left panel shows quantification of zonal distribution of periportal (PS) and centrilobular (CV) hepatocyte DNA synthesis in 129S4/SvJae mice treated with 100 mg kg -1 day -1 ciprofibrate for four or six days. Individual animal values are shown, and the mean and Standard Deviation are superimposed as a cross with error bar. There was no significant difference between periportal and centrilobular DNA synthesis. B, as for A, but with Fisher 344 rat after two or four days administration. An asterisk indicates that the periportal values are significantly different from the centrilobular values at P<0.05 (t-test). 21/2/09 Page 20
21 References 21/2/09 Page 21


22 A BrdU Ciprofibrate B C Control D TCPOBOP Figure 1
23 A B C Figure 2
24 A * * B Figure 3
25 A B Figure 4

26 A B * * * * * Figure 5


27 A Mouse Rat Centrilobular Periportal B * * Figure 6
28
Mass Histology Service
 Mass Histology Service A complete anatomical pathology laboratory www.masshistology.com Telephone: (877) 286-6004 Report on Pathology A Time Course Study of the Local Effects of Intramuscular XXXXXXX Injection
Supplementary Information
 Supplementary Information Distinct bone marrow-derived and tissue resident macrophage lineages proliferate at key stages during inflammation. 1 Luke C. Davies, 1 Marcela Rosas, 2 Stephen J. Jenkins, 1
Interpretation of the liver hypertrophy in the toxicological evaluation of veterinary medicinal products
 Provisional translation The Food Safety Commission Final decision on September 7, 2017 This English version of the Commission Decision is intended to be reference material to provide convenience for users.
Supplementary Figure S1. Effect of Glucose on Energy Balance in WT and KHK A/C KO
 Supplementary Figure S1. Effect of Glucose on Energy Balance in WT and KHK A/C KO Mice. WT mice and KHK-A/C KO mice were provided drinking water containing 10% glucose or tap water with normal chow ad
SUPPLEMENTARY INFORMATION
 DOI: 10.1038/ncb3461 In the format provided by the authors and unedited. Supplementary Figure 1 (associated to Figure 1). Cpeb4 gene-targeted mice develop liver steatosis. a, Immunoblot displaying CPEB4
To determine the effect of over-expression and/or ligand activation of. PPAR / on cell cycle, cell lines were cultured as described above until ~80%
 Supplementary Materials and Methods Cell cycle analysis To determine the effect of over-expression and/or ligand activation of PPAR / on cell cycle, cell lines were cultured as described above until ~80%
Report of a Workshop on Dose-Response Approaches for Nuclear Receptor- Mediated Modes of Action
 Report of a Workshop on Dose-Response Approaches for Nuclear Receptor- Mediated Modes of Action The 2010 Society of Risk Analysis Meeting Salt Lake City, Utah Robert Budinsky The Dow Chemical Company Outline
Supplementary Table. Overview of IPCS requirements for analyzing cancer mode of action. Metofluthrin 1 Momfluorothrin 2
 Electronic Supplementary Material (ESI) for Toxicology Research. This journal is The Royal Society of Chemistry 2018 T. Yamada Page 1 of 6. Overview of IPCS requirements for analyzing cancer mode of action
Supplementary Figure 1
 Supplementary Figure 1 Genetic labeling of microglia Male and female 2-3 month-old CreERT2;R26-tdTomato mice or CreERT2;R26-tdTomato;Iba1-eGFP transgenic mice were treated with 1x, 2x (48 h apart), or
Dose Response Approaches for Nuclear Receptor Mediated Modes of Action Workshop Preliminary Report
 Dose Response Approaches for Nuclear Receptor Mediated Modes of Action Workshop Preliminary Report Workshop Organizing Committee 2 Major Goals of the Workshop Determine whether the biology of nuclear receptors
Hepatocarcinogenesis: chemical models
 Hepatocarcinogenesis: chemical models Introduction Earliest observations that human exposure to certain chemicals is related to an increased incidence of cancer John Hill 1761 Nasal cancer in snuff users
Expert Statement on Metofluthrin (CLH Report, Version 2 of May 2015). Professor Brian G. Lake, Centre for Toxicology, University of Surrey,
. Professor Brian G. Lake, Centre for Toxicology, University of Surrey,") Expert Statement on Metofluthrin (CLH Report, Version 2 of May 2015). Professor Brian G. Lake, Centre for Toxicology, University of Surrey, Guildford, Surrey, UK Comments on the mode of action (MOA) for
Expert Statement on Metofluthrin (CLH Report, Version 2 of May 2015). Professor Brian G. Lake, Centre for Toxicology, University of Surrey, Guildford, Surrey, UK Comments on the mode of action (MOA) for
Supporting Information. Calculation of the relative contributions of myocyte proliferation, stem cell. Supporting Information Fig 1 (page 9)
") Supporting Information Table of contents Calculation of the relative contributions of myocyte proliferation, stem cell differentiation and cardioprotection (page 2) Supporting Information Fig 1 (page 9)
Supporting Information Table of contents Calculation of the relative contributions of myocyte proliferation, stem cell differentiation and cardioprotection (page 2) Supporting Information Fig 1 (page 9)
Dr/ Sherein Saeid AbdElgayed, ph.d
 هللامسب Dr/ Sherein Saeid AbdElgayed, ph.d Professor of Veterinary Pathology, Cairo University, Giza, Egypt. Chairman of the Editorial Board of Arab Journal of Science & Research Publishing (AJSRP) http://www.ajsrp.com
Supplementary Figure 1. Nature Neuroscience: doi: /nn.4547
 Supplementary Figure 1 Characterization of the Microfetti mouse model. (a) Gating strategy for 8-color flow analysis of peripheral Ly-6C + monocytes from Microfetti mice 5-7 days after TAM treatment. Living
Supplementary Figure 1: Neuregulin 1 increases the growth of mammary organoids compared to EGF. (a) Mammary epithelial cells were freshly isolated,
 Mammary epithelial cells were freshly isolated,") 1 2 3 4 5 6 7 8 9 10 Supplementary Figure 1: Neuregulin 1 increases the growth of mammary organoids compared to EGF. (a) Mammary epithelial cells were freshly isolated, embedded in matrigel and exposed
1 2 3 4 5 6 7 8 9 10 Supplementary Figure 1: Neuregulin 1 increases the growth of mammary organoids compared to EGF. (a) Mammary epithelial cells were freshly isolated, embedded in matrigel and exposed
A263 A352 A204. Pan CK. pstat STAT3 pstat3 STAT3 pstat3. Columns Columns 1-6 Positive control. Omentum. Rectosigmoid A195.
 pstat3 75 Pan CK A A263 A352 A24 B Columns 1-6 Positive control A195 A22 A24 A183 Rectal Nodule STAT3 pstat3 STAT3 pstat3 Columns 7-12 Omentum Rectosigmoid Left Ovary Right Ovary Omentum Uterus Uterus
Supplemental Data Tamoxifen administration to Vil-Scap- mice.
 Supplemental Data FIGURE S1. Tamoxifen administration to Vil-Scap - mice. In the experiments shown in Fig. 1 to Fig. 5, tamoxifen (2 mg per dose) was dissolved in corn oil and administered by orogastric
(A) PCR primers (arrows) designed to distinguish wild type (P1+P2), targeted (P1+P2) and excised (P1+P3)14-
 PCR primers (arrows) designed to distinguish wild type (P1+P2), targeted (P1+P2) and excised (P1+P3)14-") 1 Supplemental Figure Legends Figure S1. Mammary tumors of ErbB2 KI mice with 14-3-3σ ablation have elevated ErbB2 transcript levels and cell proliferation (A) PCR primers (arrows) designed to distinguish
1 Supplemental Figure Legends Figure S1. Mammary tumors of ErbB2 KI mice with 14-3-3σ ablation have elevated ErbB2 transcript levels and cell proliferation (A) PCR primers (arrows) designed to distinguish
Supplemental Table 1. Primer sequences for transcript analysis
 Supplemental Table 1. Primer sequences for transcript analysis Primer Sequence (5 3 ) Primer Sequence (5 3 ) Mmp2 Forward CCCGTGTGGCCCTC Mmp15 Forward CGGGGCTGGCT Reverse GCTCTCCCGGTTTC Reverse CCTGGTGTGCCTGCTC
Opinion on. Classification of Musk ketone
 EUROPEAN COMMISSION HEALTH & CONSUMER PROTECTION DIRECTORATE-GENERAL Directorate C - Public Health and Risk Assessment C7 - Risk assessment SCIENTIFIC COMMITTEE ON HEALTH AND ENVIRONMENTAL RISKS SCHER
Supplementary Figure 1. Repression of hepcidin expression in the liver of mice treated with
 Supplementary Figure 1. Repression of hepcidin expression in the liver of mice treated with DMN Immunohistochemistry for hepcidin and H&E staining (left). qrt-pcr assays for hepcidin in the liver (right).
RCPA Research Award Final Progress Review
 RCPA Research Award 2010-2011 Final Progress Review Name: Dr Craig Wallington-Beddoe Degree/Institution/Year: PhD, The University of Sydney, Year 2 Research Project Title: New Therapeutic Strategies for
APPENDIX AVAILABLE ON THE HEI WEB SITE
 APPENDIX AVAILABLE ON THE HEI WEB SITE Research Report 166 Advanced Collaborative Emissions Study (ACES) Subchronic Exposure Results: Biologic Responses in Rats and Mice and Assessment of Genotoxicity
Quantification of early stage lesions for loss of p53 should be shown in the main figures.
 Reviewer #1 (Remarks to the Author): Expert in prostate cancer The manuscript "Clonal dynamics following p53 loss of heterozygosity in Kras-driven cancers" uses a number of novel genetically engineered
Reviewers' comments: Reviewer #1 (Remarks to the Author):
:") Reviewers' comments: Reviewer #1 (Remarks to the Author): The manuscript by Sun et al., provide data showing that short-chain fatty acids produced by intestinal microbiota act through GPR43 to induced
Reviewers' comments: Reviewer #1 (Remarks to the Author): The manuscript by Sun et al., provide data showing that short-chain fatty acids produced by intestinal microbiota act through GPR43 to induced
(A) RT-PCR for components of the Shh/Gli pathway in normal fetus cell (MRC-5) and a
 RT-PCR for components of the Shh/Gli pathway in normal fetus cell (MRC-5) and a") Supplementary figure legends Supplementary Figure 1. Expression of Shh signaling components in a panel of gastric cancer. (A) RT-PCR for components of the Shh/Gli pathway in normal fetus cell (MRC-5) and
Supplementary figure legends Supplementary Figure 1. Expression of Shh signaling components in a panel of gastric cancer. (A) RT-PCR for components of the Shh/Gli pathway in normal fetus cell (MRC-5) and
Supplemental Figure 1. Western blot analysis indicated that MIF was detected in the fractions of
 Supplemental Figure Legends Supplemental Figure 1. Western blot analysis indicated that was detected in the fractions of plasma membrane and cytosol but not in nuclear fraction isolated from Pkd1 null
Lentiviral Delivery of Combinatorial mirna Expression Constructs Provides Efficient Target Gene Repression.
 Supplementary Figure 1 Lentiviral Delivery of Combinatorial mirna Expression Constructs Provides Efficient Target Gene Repression. a, Design for lentiviral combinatorial mirna expression and sensor constructs.
Supplementary Figure 1. Genotyping strategies for Mcm3 +/+, Mcm3 +/Lox and Mcm3 +/- mice and luciferase activity in Mcm3 +/Lox mice. A.
 Supplementary Figure 1. Genotyping strategies for Mcm3 +/+, Mcm3 +/Lox and Mcm3 +/- mice and luciferase activity in Mcm3 +/Lox mice. A. Upper part, three-primer PCR strategy at the Mcm3 locus yielding
Supplementary Materials for
 www.sciencesignaling.org/cgi/content/full/6/305/ra106/dc1 Supplementary Materials for Controlling Long-Term Signaling: Receptor Dynamics Determine Attenuation and Refractory Behavior of the TGF-β Pathway
ab Hepatic Lipid Accumulation/ Steatosis Assay Kit
 ab133131 Hepatic Lipid Accumulation/ Steatosis Assay Kit Instructions for Use For evaluating steatosis risk of drug candidates using Oil Red O to stain neutral lipids in hepatocytes. This product is for
HISTOPL4THOLOG1CAL STUDY OF LIVER
 HISTOPL4THOLOG1CAL STUDY OF LIVER 6.1 Inti-oduction The structural and functional organization of the liver has been described by hepatic lobule and hepatic acinus models, respectively (Jarvelainen, 2000).
Supplemental figure 1. PDGFRα is expressed dominantly by stromal cells surrounding mammary ducts and alveoli. A) IHC staining of PDGFRα in
 IHC staining of PDGFRα in") Supplemental figure 1. PDGFRα is expressed dominantly by stromal cells surrounding mammary ducts and alveoli. A) IHC staining of PDGFRα in nulliparous (left panel) and InvD6 mouse mammary glands (right
Supplemental figure 1. PDGFRα is expressed dominantly by stromal cells surrounding mammary ducts and alveoli. A) IHC staining of PDGFRα in nulliparous (left panel) and InvD6 mouse mammary glands (right
AP VP DLP H&E. p-akt DLP
 A B AP VP DLP H&E AP AP VP DLP p-akt wild-type prostate PTEN-null prostate Supplementary Fig. 1. Targeted deletion of PTEN in prostate epithelium resulted in HG-PIN in all three lobes. (A) The anatomy
A genetically targeted optical sensor to monitor calcium signals in astrocyte processes
 A genetically targeted optical sensor to monitor calcium signals in astrocyte processes 1 Eiji Shigetomi, 1 Sebastian Kracun, 2 Michael V. Sofroniew & 1,2 *Baljit S. Khakh Ψ 1 Departments of Physiology
Postn MCM Smad2 fl/fl Postn MCM Smad3 fl/fl Postn MCM Smad2/3 fl/fl. Postn MCM. Tgfbr1/2 fl/fl TAC
 A Smad2 fl/fl Smad3 fl/fl Smad2/3 fl/fl Tgfbr1/2 fl/fl 1. mm B Tcf21 MCM Tcf21 MCM Smad3 fl/fl Tcf21 MCM Smad2/3 fl/fl Tcf21 MCM Tgfbr1/2 fl/fl αmhc MCM C 1. mm 1. mm D Smad2 fl/fl Smad3 fl/fl Smad2/3
HEPATIC CELL INJURY BY ETHINYL OESTRADIOL ESTROGEN Pandey Govind a*, Pandey S.P. b and Madhuri S. c
 Research Article HEPATIC CELL INJURY BY ETHINYL OESTRADIOL ESTROGEN Pandey Govind a*, Pandey S.P. b and Madhuri S. c a* Ex-Professor & Head of Pharmacology (Pharmacy), presently Officer-In-Charge of Rinder
LDL Uptake Flow Cytometry Assay Kit
 LDL Uptake Flow Cytometry Assay Kit Item No. 601470 www.caymanchem.com Customer Service 800.364.9897 Technical Support 888.526.5351 1180 E. Ellsworth Rd Ann Arbor, MI USA TABLE OF CONTENTS GENERAL INFORMATION
PREPARED FOR: U.S. Army Medical Research and Materiel Command Fort Detrick, Maryland
 AD Award Number: W81XWH-4-1-82 TITLE: Effect of Saw Palmetto on the Development and Progression of Prostate Carcinoma in TRAMP Mice PRINCIPAL INVESTIGATOR: Charles E. Roselli CONTRACTING ORGANIZATION:
Supplemental Information. Memory-Relevant Mushroom Body. Output Synapses Are Cholinergic
 Neuron, Volume 89 Supplemental Information Memory-Relevant Mushroom Body Output Synapses Are Cholinergic Oliver Barnstedt, David Owald, Johannes Felsenberg, Ruth Brain, John-Paul Moszynski, Clifford B.
ICH Topic S1B Carcinogenicity: Testing for Carcinogenicity of Pharmaceuticals. Step 5
 European Medicines Agency March 1998 CPMP/ICH/299/95 ICH Topic S1B Carcinogenicity: Testing for Carcinogenicity of Pharmaceuticals Step 5 NOTE FOR GUIDANCE ON CARCINOGENICITY: TESTING FOR CARCINOGENICITY
Nature Neuroscience: doi: /nn Supplementary Figure 1. Trial structure for go/no-go behavior
 Supplementary Figure 1 Trial structure for go/no-go behavior a, Overall timeline of experiments. Day 1: A1 mapping, injection of AAV1-SYN-GCAMP6s, cranial window and headpost implantation. Water restriction
Lai et al 2008 JCI RG-Revision 2
 Lai et al 2008 JCI 36612-RG-Revision 2 Suppmentary Table 1. Epitope specific dystrophin antibodies Name Epitope Dilution Source Dys-3* Hinge 1 1:20 Novocastra Dys-1 Repeats 6-8 1:100 Novocastra Mandys8
TITLE: A PSCA Promoter Based Avian Retroviral Transgene Model of Normal and Malignant Prostate
 AD Award Number: DAMD17-03-1-0163 TITLE: A PSCA Promoter Based Avian Retroviral Transgene Model of Normal and Malignant Prostate PRINCIPAL INVESTIGATOR: Robert Reiter, M.D. CONTRACTING ORGANIZATION: The
Supplementary Figure 1
 Supplementary Figure 1 Miniature microdrive, spike sorting and sleep stage detection. a, A movable recording probe with 8-tetrodes (32-channels). It weighs ~1g. b, A mouse implanted with 8 tetrodes in
The Effects of Chemotherapy on Cognitive Behavior and Neurogenesis in an Animal Model of Pre- and Post- Menopausal Females
 The Effects of Chemotherapy on Cognitive Behavior and Neurogenesis in an Animal Model of Pre- and Post- Menopausal Females Samantha Pavlock (Medical Student) Pradeep Bhide and Deirdre McCarthy (Faculty
SUPPLEMENTARY MATERIAL. Sample preparation for light microscopy
 SUPPLEMENTARY MATERIAL Sample preparation for light microscopy To characterize the granulocytes and melanomacrophage centers, cross sections were prepared for light microscopy, as described in Material
WHO/SDE/WSH/04.08/64s. Trihalomethanes in drinking-water Summary statement
 WHO/SDE/WSH/04.08/64s Trihalomethanes in drinking-water Summary statement World Health Organization September 2004 WHO information products on water, sanitation, hygiene and health can be freely downloaded
Formaldehyde scavengers function as novel antigen retrieval agents
 Supplementary Information Formaldehyde scavengers function as novel antigen retrieval agents Craig T Vollert 1, Wilna J Moree 2, Steven Gregory 1, Steven J Bark 2, & Jason L Eriksen* 1 1 Department of
TGF-β Signaling Regulates Neuronal C1q Expression and Developmental Synaptic Refinement
 Supplementary Information Title: TGF-β Signaling Regulates Neuronal C1q Expression and Developmental Synaptic Refinement Authors: Allison R. Bialas and Beth Stevens Supplemental Figure 1. In vitro characterization
Nature Neuroscience: doi: /nn Supplementary Figure 1
 Supplementary Figure 1 Relative expression of K IR2.1 transcript to enos was reduced 29-fold in capillaries from knockout animals. Relative expression of K IR2.1 transcript to enos was reduced 29-fold
The role of Hepatitis C Virus in hepatocarcinogenesis
 The role of Hepatitis C Virus in hepatocarcinogenesis Laura Beretta Fred Hutchinson Cancer Research Center l8 Incidence and mortality of the five most common cancers worldwide, 2000 Incidence Lung Breast
chapter 1 - fig. 2 Mechanism of transcriptional control by ppar agonists.
 chapter 1 - fig. 1 The -omics subdisciplines. chapter 1 - fig. 2 Mechanism of transcriptional control by ppar agonists. 201 figures chapter 1 chapter 2 - fig. 1 Schematic overview of the different steps
Supplementary Information
 Supplementary Information Title Degeneration and impaired regeneration of gray matter oligodendrocytes in amyotrophic lateral sclerosis Authors Shin H. Kang, Ying Li, Masahiro Fukaya, Ileana Lorenzini,
SUPPLEMENTARY INFORMATION
 1. Supplementary Figures and Legends Supplementary Fig. 1. S1P-mediated transcriptional regulation of integrins expressed in OP/monocytoid cells. Real-time quantitative PCR analyses of mrna for two integrins,
Nature Neuroscience: doi: /nn Supplementary Figure 1. Lick response during the delayed Go versus No-Go task.
 Supplementary Figure 1 Lick response during the delayed Go versus No-Go task. Trial-averaged lick rate was averaged across all mice used for pyramidal cell imaging (n = 9). Different colors denote different
GFP/Iba1/GFAP. Brain. Liver. Kidney. Lung. Hoechst/Iba1/TLR9!
 Supplementary information a +KA Relative expression d! Tlr9 5!! 5! NSC Neuron Astrocyte Microglia! 5! Tlr7!!!! NSC Neuron Astrocyte! GFP/Sβ/! Iba/Hoechst Microglia e Hoechst/Iba/TLR9! GFP/Iba/GFAP f Brain
Supplementary Figure 1. DNA methylation of the adiponectin promoter R1, Pparg2, and Tnfa promoter in adipocytes is not affected by obesity.
 Supplementary Figure 1. DNA methylation of the adiponectin promoter R1, Pparg2, and Tnfa promoter in adipocytes is not affected by obesity. (a) Relative amounts of adiponectin, Ppar 2, C/ebp, and Tnf mrna
CONTRACTING ORGANIZATION: Children s Hospital Los Angeles Los Angeles, CA 90027
 AD Award Number: TITLE: Studies of the Tumor Microenvironment in Pathogenesis of Neuroblastoma PRINCIPAL INVESTIGATOR: Shahab Asgharzadeh, M D CONTRACTING ORGANIZATION: Children s Hospital Los Angeles
B220 CD4 CD8. Figure 1. Confocal Image of Sensitized HLN. Representative image of a sensitized HLN
 B220 CD4 CD8 Natarajan et al., unpublished data Figure 1. Confocal Image of Sensitized HLN. Representative image of a sensitized HLN showing B cell follicles and T cell areas. 20 µm thick. Image of magnification
Nature Neuroscience: doi: /nn Supplementary Figure 1. Large-scale calcium imaging in vivo.
 Supplementary Figure 1 Large-scale calcium imaging in vivo. (a) Schematic illustration of the in vivo camera imaging set-up for large-scale calcium imaging. (b) High-magnification two-photon image from
Supplementary Figure 1. Western blot of hippocampal lysates from WT and Adcy1 KO mice demonstrates the specificity of the ADCY1 antibody.
 ADCY1 13 kda β-actin 45 kda Supplementary Figure 1. Western blot of hippocampal lysates from and mice demonstrates the specificity of the ADCY1 antibody. a DHPG perk1/2 ERK1/2 Relative level min 1.6 *
The Importance of ADME/PK to Inform Human Safety Assessments Based on Animal Studies: Example with Furan. Gregory L. Kedderis, PhD Chapel Hill, NC
 The Importance of ADME/PK to Inform Human Safety Assessments Based on Animal Studies: Example with Furan Gregory L. Kedderis, PhD Chapel Hill, NC Conflict of Interest None This research was conducted at
SUPPLEMENTAL INFORMATION FOR. PAX7 expression defines germline stem cells in the adult testis
 SUPPLEMENTAL INFORMATION FOR PAX7 expression defines germline stem cells in the adult testis Gina M. Aloisio, Yuji Nakada, Hatice D. Saatcioglu, Christopher G. Peña, Michael D. Baker, Edward D. Tarnawa,
The Annexin V Apoptosis Assay
 The Annexin V Apoptosis Assay Development of the Annexin V Apoptosis Assay: 1990 Andree at al. found that a protein, Vascular Anticoagulant α, bound to phospholipid bilayers in a calcium dependent manner.
EVALUATION OF THE CHANGES RESULTING FROM TAMOXIFEN ADMINISTRATION. A COMBINED DNA FLOWCYTOMETRIC AND HISTOPATHOLOGICAL STUDY
 EVALUATION OF THE CHANGES RESULTING FROM TAMOXIFEN ADMINISTRATION. A COMBINED DNA FLOWCYTOMETRIC AND HISTOPATHOLOGICAL STUDY Tamoxifen Tamoxifen is a non steroidal tiphenylethylene y first synthesized
Fitting a Single-Phase Model to the Post-Exercise Changes in Heart Rate and Oxygen Uptake
 Fitting a Single-Phase Model to the Post-Exercise Changes in Heart Rate and Oxygen Uptake R. STUPNICKI, T. GABRYŚ, U. SZMATLAN-GABRYŚ, P. TOMASZEWSKI University of Physical Education, Warsaw, Poland Summary
Julia H. Carter, 1 Harry W. Carter, 1 James A. Deddens, 2 Bernadette M. Hurst, 1 Michael H. George, 3 and Anthony B. DeAngelo 3
 Articles A 2-Year Dose Response Study of Lesion Sequences during Hepatocellular Carcinogenesis in the Male B6C3F 1 Mouse Given the Drinking Water Chemical Dichloroacetic Acid Julia H. Carter, 1 Harry W.
Dietary glycine inhibits the growth of B16 melanoma tumors in mice
 Carcinogenesis vol.20 no.5 pp.793 798, 1999 Dietary glycine inhibits the growth of B16 melanoma tumors in mice Michelle L.Rose 1,2, Johnathan Madren 2, Hartwig Bunzendahl 3 and Ronald G.Thurman 1,2,4 1
SUPPLEMENTARY INFORMATION
 doi:10.1038/nature10188 Supplementary Figure 1. Embryonic epicardial genes are down-regulated from midgestation stages and barely detectable post-natally. Real time qrt-pcr revealed a significant down-regulation
Title: A robustness study of parametric and non-parametric tests in Model-Based Multifactor Dimensionality Reduction for epistasis detection
 Author's response to reviews Title: A robustness study of parametric and non-parametric tests in Model-Based Multifactor Dimensionality Reduction for epistasis detection Authors: Jestinah M Mahachie John
Nature Medicine: doi: /nm.3922
 Title: Glucocorticoid-induced tumor necrosis factor receptor-related protein co-stimulation facilitates tumor regression by inducing IL-9-producing helper T cells Authors: Il-Kyu Kim, Byung-Seok Kim, Choong-Hyun
Supplementary Figure 1. Characterization of basophils after reconstitution of SCID mice
 Supplementary figure legends Supplementary Figure 1. Characterization of after reconstitution of SCID mice with CD4 + CD62L + T cells. (A-C) SCID mice (n = 6 / group) were reconstituted with 2 x 1 6 CD4
INFLUENCE OF INGESTED FOODS ON THE ORAL TOXICITY IN MICE OF
 INFLUENCE OF INGESTED FOODS ON THE ORAL TOXICITY IN MICE OF CRYSTALLINE BOTULINAL TYPE A TOXIN' CARL LAMANNA AND CHARLES E. MEYERS The Naval Biological Laboratory, School of Public Health, University of
Receptor-interacting Protein Kinases Mediate Necroptosis In Neural Tissue Damage After Spinal Cord Injury
 Receptor-interacting Protein Kinases Mediate Necroptosis In Neural Tissue Damage After Spinal Cord Injury Haruo Kanno, M.D., Ph.D., Hiroshi Ozawa, M.D., Ph.D., Satoshi Tateda, M.D., Kenichiro Yahata, M.D.,
Take-Home Exam Distributed: October 16, 2013, at 1:30 p.m. Due: October 21, 2013, at 10:00 a.m.
 20.201 Take-Home Exam Distributed: October 16, 2013, at 1:30 p.m. Due: October 21, 2013, at 10:00 a.m. Directions: This take-home exam is to be completed without help from any other individual except:
Supplementary Information. Preferential associations between co-regulated genes reveal a. transcriptional interactome in erythroid cells
 Supplementary Information Preferential associations between co-regulated genes reveal a transcriptional interactome in erythroid cells Stefan Schoenfelder, * Tom Sexton, * Lyubomira Chakalova, * Nathan
5. Summary of Data Reported and Evaluation
 326 5. Summary of Data Reported and Evaluation 5.1 Exposure data Combined estrogen progestogen menopausal therapy involves the co-administration of an estrogen and a progestogen to peri- or postmenopausal
Liver Pathology Lab 1. Shannon Martinson, 2017
 Liver Pathology Lab 1 Shannon Martinson, 2017 http://people.upei.ca/smartinson/ Case 1 Signalment: 10 year old MC DSH cat History: Inappetence and weight loss Fluid in the abdomen noted on US Esophageal
PREPARED FOR: U.S. Army Medical Research and Materiel Command Fort Detrick, Maryland
 Page 1 09/10/2013 AD Award Number: W81XWH-12-1-0453 TITLE: The cytoplasm translocation of the androgen receptor cofactor p44 as a target for prostate cancer treatment PRINCIPAL INVESTIGATOR: Zhengxin Wang
Peer review correspondence
 Highly polarized Th17 cells induce EAE via a T-bet-independent mechanism Heather M. Grifka-Walk, Stephen J. Lalor and Benjamin M. Segal Corresponding author: Benjamin Segal, Holtom-Garrett Program in Neuroimmunology
Supplementary Figure 1.TRIM33 binds β-catenin in the nucleus. a & b, Co-IP of endogenous TRIM33 with β-catenin in HT-29 cells (a) and HEK 293T cells
 and HEK 293T cells") Supplementary Figure 1.TRIM33 binds β-catenin in the nucleus. a & b, Co-IP of endogenous TRIM33 with β-catenin in HT-29 cells (a) and HEK 293T cells (b). TRIM33 was immunoprecipitated, and the amount of
Supplementary Figure 1.TRIM33 binds β-catenin in the nucleus. a & b, Co-IP of endogenous TRIM33 with β-catenin in HT-29 cells (a) and HEK 293T cells (b). TRIM33 was immunoprecipitated, and the amount of
SUPPLEMENTARY INFORMATION
 Supplementary Figures Supplementary Figure S1. Binding of full-length OGT and deletion mutants to PIP strips (Echelon Biosciences). Supplementary Figure S2. Binding of the OGT (919-1036) fragments with
ORIGIN OF LEUKEMIC CELLS IN MOUSE LEUKEMIA INDUCED BY N-BUTYLNITROSOUREA*1. ed by cytotoxicity tests. Cells from leukemia without thymus involvement
 [Gann, 66, 37-42; February, 1975] ORIGIN OF LEUKEMIC CELLS IN MOUSE LEUKEMIA INDUCED BY N-BUTYLNITROSOUREA*1 Hayase SHISA, Yasue MATSUDAIRA, Hiroshi HIAI, and Yasuaki NISHIZUKA Laboratory of Experimental
Effective Targeting of Quiescent Chronic Myelogenous
 Cancer Cell, Volume 7 Supplemental Information Effective Targeting of Quiescent Chronic Myelogenous Leukemia Stem Cells by Histone Deacetylase Inhibitors in Combination with Imatinib Mesylate Bin Zhang,
Inhibition of 11β-hydroxysteroid dehydrogenase type 1 reduces food intake and weight gain but maintains energy expenditure in diet-induced obese mice
 Diabetologia (2006) 49: 1333 1337 DOI 10.1007/s00125-006-0239-y SHORT COMMUNICATION S. J. Y. Wang. S. Birtles. J. de Schoolmeester. J. Swales. G. Moody. D. Hislop. J. O Dowd. D. M. Smith. A. V. Turnbull.
3. Studies of Cancer in Experimental Animals
 364 IARC MONOGRAPHS VOLUME 94 3. Studies of Cancer in Experimental Animals 3.1 Pure microcystin-lr (see Table 3.1) 3.1.1 Mouse A group of 13 male ICR mice, 5 weeks of age, received 100 intraperitoneal
Suppl Video: Tumor cells (green) and monocytes (white) are seeded on a confluent endothelial
 and monocytes (white) are seeded on a confluent endothelial") Supplementary Information Häuselmann et al. Monocyte induction of E-selectin-mediated endothelial activation releases VE-cadherin junctions to promote tumor cell extravasation in the metastasis cascade
Supplementary Information Häuselmann et al. Monocyte induction of E-selectin-mediated endothelial activation releases VE-cadherin junctions to promote tumor cell extravasation in the metastasis cascade
SUPPLEMENTARY INFORMATION
 Complete but curtailed T-cell response to very-low-affinity antigen Dietmar Zehn, Sarah Y. Lee & Michael J. Bevan Supp. Fig. 1: TCR chain usage among endogenous K b /Ova reactive T cells. C57BL/6 mice
Perceptual Learning in Flavor Aversion: Evidence for Learned Changes in Stimulus Effectiveness
 Journal of Experimental Psychology: Animal Behavior Processes 2003, Vol. 29, No. 1, 39 48 Copyright 2003 by the American Psychological Association, Inc. 0097-7403/03/$12.00 DOI: 10.1037/0097-7403.29.1.39
Interpreting Therapeutic Response on Immune Cell Number and Spatial Distribution within the Tumor Microenvironment. Lorcan Sherry, CSO OracleBio
 Interpreting Therapeutic Response on Immune Cell Number and Spatial Distribution within the Tumor Microenvironment Lorcan Sherry, CSO OracleBio Company Overview OracleBio is a specialised CRO providing
INFLUENCES OF DIFFERENT PHASES OF TRAINING ON AEROBIC CAPACITY OF MALE HANDBALL PLAYERS
 INFLUENCES OF DIFFERENT PHASES OF TRAINING ON AEROBIC CAPACITY OF MALE HANDBALL PLAYERS Dr. B. Chittibabu Assistant Professor, Department of Physical Education and Sports Sciences, Annamalai University,
SUPPLEMENTARY INFORMATION. Supplementary Figure 1
 SUPPLEMENTARY INFORMATION Supplementary Figure 1 The supralinear events evoked in CA3 pyramidal cells fulfill the criteria for NMDA spikes, exhibiting a threshold, sensitivity to NMDAR blockade, and all-or-none
Supplemental Material
 Supplemental Material Supplementary Fig. 1. EETs stimulate primary tumor growth. a) Schematic presentation of genetic and pharmacological tools used to manipulate endogenous EET levels. b) Endothelial
Supplementary Figure 1. Expression of CUGBP1 in non-parenchymal liver cells treated with TGF-β
 Supplementary Figures Supplementary Figure 1. Expression of CUGBP1 in non-parenchymal liver cells treated with TGF-β and LPS. Non-parenchymal liver cells were isolated and treated with or without TGF-β
HSP72 HSP90. Quadriceps Muscle. MEF2c MyoD1 MyoG Myf5 Hsf1 Hsp GLUT4/GAPDH (AU)
") Supplementary Figure 1. Impaired insulin action in HSP72 deficient muscle and myotubes in culture cannot be explained by altered myogenesis or reduced total GLUT4 expression. Genes associated with myogenesis
Supplementary Figure 1. Impaired insulin action in HSP72 deficient muscle and myotubes in culture cannot be explained by altered myogenesis or reduced total GLUT4 expression. Genes associated with myogenesis
Exploring a Link Between Spy1 and Hepatocellular Carcinoma Progression
 University of Windsor Scholarship at UWindsor UWill Discover Undergraduate Conference UWill Discover 2016 Mar 29th, 4:00 PM - 5:00 PM Exploring a Link Between Spy1 and Hepatocellular Carcinoma Progression
Hormonal gain control of a medial preoptic area social reward circuit
 CORRECTION NOTICE Nat. Neurosci. 20, 449 458 (2017) Hormonal gain control of a medial preoptic area social reward circuit Jenna A McHenry, James M Otis, Mark A Rossi, J Elliott Robinson, Oksana Kosyk,