Supplementary Figure 1 Overall study design
|
|
|
- Carmel Barker
- 5 years ago
- Views:
Transcription
 tissue (IC; represented by blue men).")
1 Supplementary Figure 1 Overall study design We obtained 19 tumour specimens from 14 men with prostate cancer who harboured pathogenic germline BRCA2-mutations. Germline DNA was available for five patients and for 11/14 patients, we obtained isolated invasive carcinoma (IC) tissue (IC; represented by blue men). Intraductal carcinoma (IDC) was micro-dissected from five of these 11 patient specimens (represented as asterisks). For the remaining 3/14 patients, specimens were obtained from mixed IC and IDC pathologies (represented as the green men). We subjected 18/19 specimens to copy number profiling (one specimen failed QC) and 12/19 specimens were subjected to whole genome sequencing (WGS; plus germline DNA from five patients). Further, 10/19 specimens had methylome interrogation (5 IC, 5 IDC). In addition, IC and IDC were also microdissected from six men with sporadic (i.e. non-familial) PCa (orange). These additional 12 sporadic PCa specimens (in addition to blood-derived germline DNA) were also subjected to whole-genome sequencing and CNA analysis. We conducted analyses and comparisons to publically available data from localized, sporadic prostate cancers. For CNAs, we compared 18 BRCA2 mutant PCa specimens (14 IC, 4 IDC) to 284 sporadic PCa. For mutational signatures, we compared 18 BRCA2-mutant PCa specimens (14 IC, 4 IDC) to 200 sporadic PCa specimens. For single nucleotide variant analysis in gene coding regions, we compared nine BRCA2-mutant PCa specimens (5 IC, 4 IDC) to 477 sporadic PCa. For chromothripsis and kataegis analysis, we compared 11 BRCA2-mutant PCa specimens (3 IDC, 8 IC) to 186 and 200 sporadic PCa specimens, respectively. For genomic rearrangements, we compared 12 (7 IC, 5 IDC) BRCA2- mutant PCa specimens to 200 sporadic PCa specimens.
2 a b

3 c d

4 e f g
5 h i j k
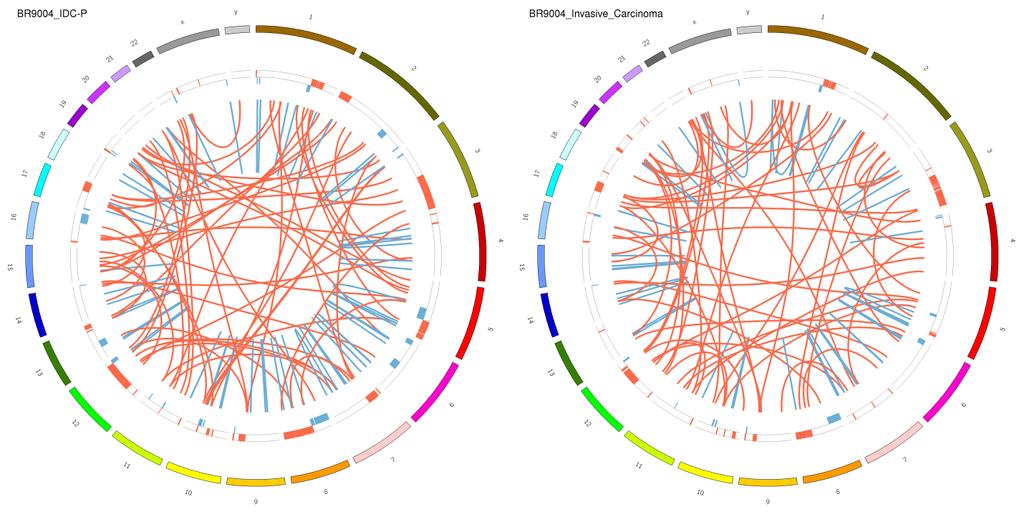
6 l m Supplementary Figure 2 Overall mutation profile of each tumour (a-m) Circos plots indicate (from outside-in): chromosome number, scatterplot of SNV intermutational distance (distance of each somatic variant to the somatic variant adjacent to it), kataegis events (black indicates a significant hypermutation region, orange indicates that the hypermutation contains a C/TAG enrichment), CNAs (red indicates amplifications, blue indicates deletions), chromothripsis events (purple triangles), inter-chromosomal translocation (orange lines) and inversions (blue lines).
7 Supplementary Figure 3 SNV mutation density SNV mutation density (somatic SNVs per mega-basepair of DNA sequenced) is compared between BRCA2 mutant PCa and sporadic PCa. Sporadic PCa are stratified by patient age at initial treatment. P-values were calculated using a Mann-Whitney U-test. Whiskers indicate the maximum and minimum values, the box outline indicates the third and first quartile and the bar indicates the mean.
8 Supplementary Figure 4 Genes altered by SNVs in BRCA2-mutant and sporadic PCa Relative aberration frequencies of genes recurrently disrupted by SNVs in localized BRCA2- mutant (n = 9) vs. sporadic PCa (n = 477). Genes were considered recurrently altered if found in at least eight sporadic or two BRCA2-mutant specimens. Sporadic samples were split into two groups based on age at initial treatment; 50 years of age or younger (left) and older than 50 years of age (right). Some points are occupied by multiple genes with identical occurrence frequencies.
. The top barplot shows the total number of single nucleotide variants (SNV) per specimen.")
9 Supplementary Figure 5 Comparison of somatic SNV profile between BRCA2-mutant and sporadic PCa Somatic SNV predictions in protein-coding regions from five BRCA2-mutant samples were compared to recurrently mutated genes in sporadic PCa (n = 477). The top barplot shows the total number of single nucleotide variants (SNV) per specimen. The central heatmap shows the recurrent somatic SNV predictions in the coding regions for the five BRCA2-mutant cancers. Tumours are sorted by patient id, sample type and Gleason score (bottom covariates). The top central heatmap shows overlap between the top 11 recurrently mutated genes, each found in at least eight specimens, detected in the sporadic cases and the recurrent genes found in the BRCA2 mutant cases. The percentage of recurrence found in sporadic cases 50 years of age or younger (n = 39), sporadic cases older than 50 years of age (n = 438), or in BRCA2-mutant cases are shown at the right side of each plot. Multiple foci from the same patient are indicated in the same patient covariate colour, where sample type colour indicates invasive carcinoma (IC) in dark blue and intraductal carcinoma (IDC) in yellow.
10 Supplementary Figure 6 Kataegis in BRCA2-mutant and sporadic PCa Boxplot comparing kataegis scores, generated by SeqKat, between BRCA2-mutant (n=11) and sporadic (n=133) PCa specimens. Values are shown for specimens, only if a kataegis even was identified. P-value is from a one-way ANOVA. Whiskers indicate the maximum and minimum values, the box outline indicates the third and first quartile and the bar indicates the mean.
 and men older than 50 years of age (right). The percentage of specimens the event was observed in is represented by the colour and thickness of the lines.")
11 Supplementary Figure 7 Genomic rearrangements in BRCA2-mutant and sporadic PCa Circos plots illustrating translocation and inversion events in BRCA2-mutant PCa (left) and sporadic PCa from men 50 years of age and younger (center) and men older than 50 years of age (right). The percentage of specimens the event was observed in is represented by the colour and thickness of the lines. Light red < 2%, dark red > 25%.
12 Supplementary Figure 8 Chromothripsis rates Boxplot comparing chromothripsis scores, generated by ShatterProof, between BRCA2 mutant (n = 11) and sporadic (n = 133) PCa specimens. P-value is from a two-sided, unpaired t-test. Whiskers indicate the maximum and minimum values, the box outline indicates the third and first quartile and the bar indicates the mean.
 differentially methylated probes between BRCA2-mutant (n = 10) and sporadic PCa (n = 100) specimens.")
13 Supplementary Figure 9 Differentially methylated probes in BRCA2- mutant Heatmap of 7,445 significantly (q-value < 0.05, log2 β-fc > 0.1) differentially methylated probes between BRCA2-mutant (n = 10) and sporadic PCa (n = 100) specimens. Red represents β-values closer to 0 (unmethylated) and blue represents β-values closer to 1 (methylated). Probes (columns) were sorted by chromosome location and cytoband. Specimens (rows) were sorted based on BRCA2 genotype and the sum of β-value in increasing order. Gleason scores are shown for each specimen.
 differentially methylated probes between BRCA2-mutant (n = 10) and sporadic (n = 100) specimens.")
14 Supplementary Figure 10 Differentially methylated probes controlling for CNA differences in BRCA2-mutant PCa Heatmap of 4,979 significantly (q-value < 0.05, log2 β-fc > 0.1, CNA fraction < 0.1) differentially methylated probes between BRCA2-mutant (n = 10) and sporadic (n = 100) specimens. Red represents β-values closer to 0 (unmethylated) and blue represents β-values closer to 1 (methylated). Probes (columns) were sorted by chromosome location and cytoband. Specimens (rows) were sorted based on BRCA2 status and the sum of β-value in increasing order. Gleason score is also shown for each specimen.
15 Supplementary Figure 11 Differentially methylated genes in BRCA2- mutant PCa A dotmap of the 25 most significantly differentially methylated genes between BRCA2-mutant and sporadic PCa, after controlling for CNA status. FDR values are represented by the shade of the gray boxes, and log 2 beta fold changes are indicated by the size of the circle within each box. The genes are ordered based on log 2 fold-change of the β-values.
16 Supplementary Figure 12 Pathway analysis of differential methylation Illustration of the enriched pathways (p < 0.05) from g:profiler analysis. Pathways were curated using gene ontology: biological process, KEGG and REACTOME. The outputs were visualized using the enrichment map in Cytoscape. Each node represents a gene-set, which is defined as a set of genes underlying a functional profile. Node size indicates the number of genes in the gene-set. Node colour represents significance of enrichment (hypergeometric test) from p = 8.25 x 10⁻⁵ to p = 0.05 (red to pink). Gene-sets are connected by a grey line if they share common genes, and line thickness reflects the number of overlapping genes. Gene-sets with similar functions are grouped together by purple dotted circles.

17 Supplementary Figure 13 Aberrant methylation and CNAs in NED associated pathways Key neuroendocrine differentiation (NED) associated genes show either differential methylation or a different proportion of patients with a CNA in BRCA2 mutant PCa relative to sporadic PCa. The shading of the grey boxes represents q-values, ranging from 0 to 1. The size of the circle for methylation analysis (left) indicates log 2 beta fold change and for CNA analysis (right) it represents the difference in the proportion of patients with CNA in BRCA2-mutant vs. sporadic PCa.
18 Supplementary Figure 14 Comparative methylation of the BRCA2 locus (a) β-values (y-axis) of probes within the BRCA2 locus for patients with BRCA2-mutant (n=10) and sporadic PCa (n = 100). Probes are sorted by genomic region. Those in grey were significantly differentially methylated (q < 0.05, log 2 FoldChange > 0.1). (b) Heatmap of relative methylation β-values for BRCA2-mutant vs. the mean of sporadic PCa for probes shown in (a).
.")
19 Supplementary Figure 15 Aberrant methylation in MED12L MED12L is hypomethylated in BRCA2-mutant PCa. β-values (y-axis) of patients with (n=10) and without BRCA2-mutations (n = 100) are shown. Probes highlighted in grey were shown to be significantly differentially methylated (q < 0.05, log 2 β-fc > 0.1). Probes were sorted based on genomic region (TSS1500, TSS200, 1st Exon, gene body and 3' UTR).
 Higher magnification images of the regions of (b) Gleason 3+4 adenocarcinoma and (c) IDC.")
20 Supplementary Figure 16 Histology of intraductal carcinoma of the prostate (a) Low magnification image of haematoxylin and eosin stained tissue from patient BR9003 showing prominent areas of adenocarcinoma and IDC. (b,c) Higher magnification images of the regions of (b) Gleason 3+4 adenocarcinoma and (c) IDC. Individual areas such as (b) and (c) were marked by a pathologist and micro-dissected from FFPE tissues for collection of DNA. Scale bar (a) 500 μm and (b, c) 100 μm.
21 Supplementary Figure 17 Cellularity comparisons Cellularity estimates in specimens from BRCA2-mutant and sporadic PCa derived from pathology, methylation and CNAs. Sporadic specimens were stratified by age at initial treatment. Whiskers indicate the maximum and minimum values, the box outline indicates the third and first quartile and the bar indicates the mean.
22 Patient ID Tumour/Germline Tissue Type Coverage Lanes Sequenced Aligned Reads BR9001 Tumour Invasive Carcinoma 39.74X Tumour Intraductal Carcinoma 46.24X Germline Benign Prostate Epithelium 41.15X BR9002 Tumour Intraductal Carcinoma 51.13X Germline Whole Blood 47.23X Tumour Invasive Carcinoma 42.43X BR9003 Tumour Intraductal Carcinoma 41.56X Germline Whole Blood 49.62X Tumour Invasive Carcinoma 51.60X BR9004 Tumour Invasive Carcinoma 41.42X Tumour Intraductal Carcinoma 45.11X BR9005 Tumour Invasive Carcinoma 45.44X Tumour Intraductal Carcinoma 36.09X Germline Whole Blood 48.80X BR9013 Tumour Gross Tumour BR9014 Tumour Gross Tumour BR9015 Tumour Gross Tumour BR9016 Tumour Gross Tumour BR9017 Tumour Gross Tumour BR9018 Tumour Gross Tumour BR0001 Tumour Gross Tumour BR0450 Tumour Invasive Carcinoma 60.42X Germline Whole Blood 41.42X BR0556 Tumour Invasive Carcinoma 21.37X SP0100 Tumour Intraductal Carcinoma 29.75X Tumour Invasive Carcinoma 39.44X Germline Whole Blood 48.93X SP0196 Tumour Intraductal Carcinoma 69.09X
23 Tumour Invasive Carcinoma 62.24X Germline Whole Blood 42.28X SP0260 Tumour Intraductal Carcinoma 41.45X Tumour Invasive Carcinoma 48.47X Germline Whole Blood 36.96X SP0334 Tumour Intraductal Carcinoma 38.13X Tumour Invasive Carcinoma 44.16X Germline Whole Blood 35.06X SP0361 Tumour Intraductal Carcinoma 59.90X Tumour Invasive Carcinoma 39.37X Germline Whole Blood 45.49X SP0364 Tumour Intraductal Carcinoma 41.07X Tumour Invasive Carcinoma 33.97X Germline Whole Blood 44.65X Patient ID # Somatic SNVs UTR # Somatic Nonsynonymous SNVs # Somatic Splicing SNVs # Somatic Stopgainloss SNVs # Somatic Synonymous SNVs Total Somatic SNVs (Post Filter) BR BR BR BR9004 BR BR9013 BR9014 BR9015
24 BR9016 BR9017 BR9018 BR0001 BR BR0556 SP SP SP SP SP SP Patient ID Deletion Inversions Duplication Translocation Total GRs Shatter- Proof Score BR BR
25 BR BR BR NA BR9013 BR9014 BR9015 BR9016 BR9017 BR9018 BR0001 BR BR SP SP SP SP SP
26 SP Patient ID T2E Gleason Score PSA T Category BRCA2 Genotype Mutation Effect ENIGMA Classification BR N/A pt3a c.7757g>a Stop Gain Class 5 - Pathogenic BR pt2c c.778_779delg A Frameshift Class 5 - Pathogenic BR pt3a c.5279c>g Stop Gain DEL; chr21: BR pt3a c.8585dupt Frameshift INV; chr21: BR pt3a c.9294c>g Stop Gain Class 5 - Pathogenic Class 5 - Pathogenic Class 5 - Pathogenic BR pt3a c.5073dupa Frameshift BR T3b c.8297delc Frameshift BR T2b c.9154c>t Missense BR T3a c.9117g>a Frameshift BR T2c c.5946delt Frameshift BR T3c c.3847_3848d elgt Frameshift BR T1c c.6174delt Frameshift Class 5 - Pathogenic Class 5 - Pathogenic Class 5 - Pathogenic Class 5 - Pathogenic Class 5 - Pathogenic Class 5 - Pathogenic Class 5 - Pathogenic
27 BR0450 DEL;chr21: T1c c.5946delt Frameshift Class 5 - Pathogenic BR T3a c.5946delt Frameshift SP T2a Class 5 - Pathogenic SP T2b SP T2a SP T2a SP T2a SP T2b Patient ID Number of Tumour Specimens IDC-P? Germline DNA Available? Methylation Data Available? BRCA2 Promoter Methylation Status BR Yes Yes Yes Hyper Yes Hyper No N/A BR Yes Yes Yes Hypo No Yes N/A Hyper BR Yes Yes Yes Hyper No N/A Yes Hyper BR Yes No Yes Hyper No N/A BR Yes Yes No N/A No N/A
28 No N/A BR Yes Yes No N/A BR Yes No No N/A BR No Yes No N/A BR No Yes No N/A BR Yes Yes No N/A BR No Yes No N/A BR No No Yes Hyper BR No Yes Yes Hypo No N/A BR No No Yes Hypo SP Yes Yes No N/A No No SP Yes Yes No N/A No SP Yes Yes No N/A No SP Yes Yes No N/A No SP Yes Yes No N/A No SP Yes Yes No N/A No No No No No No
29 Patient ID BR9001 # of 1st Degree rels with verified Ca/type n=9: x5 BrCa, x1 BrCa/Oesph, x2 PC, x1 Bowel # of 2nd Degree rels with verified Ca/type n=1: x1 Ov/BrCa BR9002 n=1: x1 Brca n=5: x2 Brca, x1 PC, x1 unknown primary, x1 lung BR9003 n=4: x3 BrCa, x1 PC n=1: x1 OvCa BR9004 n=2: x1 BrCa, x1 BrCa/OvCa n=0 BR9005 n=2: x2 BrCa n=2; x2 BrCa BR9013 BR9014 BR9015 BR9016 BR9017 BR9018 n=2: x2 BrCa n=1: x1 unknown primary n=1: x1 PC n=2: x1 PC, x1 Bowel n=3: x1 PC, x1 Thyroid & BrCa, x1 Uterine n=2: x1 PC, x1 unknown primary n=7: x1 Rectal/BrCa, x2 PC, x1 OvCa, x3 BrCa n=2: x1 BrCa, x1 bowel n=4: x1 Br/OvCa, x3 PancCa, n=2: x1 BrCa, x1 Lung n=1: x1 bowel n=5: x2 BrCa, x1 OvCa, x1 Pancreatic, x1 Bowel BR0001 Unknown Unknown BR0450 Unknown Unknown BR0556 Unknown Unknown SP0100 N/A N/A
30 SP0196 N/A N/A SP0260 N/A N/A SP0334 N/A N/A SP0361 N/A N/A SP0364 N/A N/A Supplementary Table 1 Summary and clinical data Summary data on sequencing statistics for the 19 specimens from the 14 BRCA2-mutant patients and 12 specimens from six sporadic patients including tissue type, coverage, number of lanes sequenced, and total aligned reads. The number of somatic SNVs in coding (nonsynonymous, synonymous, and stop-gain), splicing, and UTR regions predicted and annotated using SomaticSniper and Annovar, respectively. Also included is the number of various types of somatic genomic rearrangements including deletions, inversions, duplications, and interchromosomal translocations called using Delly. Chromothripsis scores were calculated using ShatterProof, while the presence of TMPRSS2-ERG fusions was determined by examining breakpoints on chromosome 21:39-42 Mbp. Clinical data is also provided, including the exact BRCA2 mutation position and mutational effect, Gleason score, pre-treatment PSA level, pre-treatment T stage, and histological diagnosis. Availability of germline DNA and number of DNA specimens are also indicated.
31 BRCA2-mutant vs. sporadic (< 50 yrs) BRCA2-mutant vs. sporadic (> 50 yrs) P-value Effect Size P-value Effect Size CNA count GR count SNV count PGA E Supplementary Table 2 Statistical analyses of mutational burden. Wilcoxon rank-sum test p-values comparing measures of mutational burden (including number of CNAs, GRs, SNVs, and PGA) between BRCA2-mutant and sporadic PCa.
32 ID Description T (nu mb er of ter m gen es) KEGG: KEGG: KEGG: KEGG: Morphine addiction Retrograde endocannabi noid signaling Circadian entrainment Glutamatergi c synapse Q (numb er of guery genes) Q&T (num ber of com mon gene s) Total gene list Enrichment FDR Q&T list < GNAS,GNG4,GNG 12,PDE1A,PDE4B, PDE2A,GABRE,P DE3B,GNB2,PDE8 A,GNGT1,GNB5,A DCY9,PRKCB,PR KX,GABRA4,GNAI 3,GABRA5,ADCY6,ADRBK1,CACNA1 A,PDE11A,GABRG 3,GABRG2,GABR B3,KCNJ3,PDE10 A,PRKCG,PDE7B, SLC32A1,OPRM1, PDE1B,KCNJ < GRIA3,GRIA4,GN G4,GNG12,GABR E,GNB2,GRM1,GN GT1,GNB5,ADCY9,PRKCB,PRKX,GA BRA4,GNAI3,GAB RA5,ADCY6,CACN A1A,ITPR1,MAPK1 0,GABRG3,GRIA1, GABRG2,GABRB3,KCNJ3,MAPK8,P RKCG,SLC32A1,P TGS2,GRIA2,GNA Q,SLC17A8,KCNJ < RYR2,GRIA3,GRIA 4,GNAS,GNG4,GN G12,PRKG1,GNB2,GNGT1,GNB5,AD CY9,PRKCB,PRKX,GNAI3,ADCY6,IT PR1,PER3,RPS6K A5,CAMK2B,GRIA 1,NOS1AP,KCNJ3, PRKCG,GRIN2C,G RIA2,GRIN2A,RYR 3,GNAQ,RYR1,KC NJ < GRIA3,GRM6,GRI A4,GNAS,GNG4,G NG12,GNB2,GRM 1,GNGT1,GNB5,P
33 KEGG: GO: Nicotine addiction positive regulation of development al process PP3CA,ADCY9,PR KCB,SHANK2,PRK X,GNAI3,SLC1A3, GRIK3,ADCY6,DL GAP1,ADRBK1,CA CNA1A,ITPR1,GRI A1,KCNJ3,PRKCG,GRIN2C,GRIA2,G RIN2A,GNAQ,SLC 1A2,SLC17A GRIA3,GRIA4,GAB RE,GABRA4,GAB RA5,CACNA1A,GA BRG3,GRIA1,GAB RG2,GABRB3,GRI N2C,SLC32A1,GRI A2,GRIN2A,SLC17 A NRXN1,WNT7A,T GFBR2,SEMA5A,H MGB2,ANXA3,RP S6KA3,ODZ4,GHR L,IFNG,SOX11,DM D,GATA3,FBXW8, NEUROD1,TNFSF 4,HIPK1,SRY,PRK CB,PROM1,GCNT 2,BMP10,TWIST1, EPHB2,TFAP2A,S MYD1,PAX8,BASP 1,POU4F2,RUNX1, DDR2,DKK1,NUM B,NELL1,CASP8,V HL,GLI2,ZEB1,INS M1,BMP4,MYOG, CTNNA1,ETS1,BD NF,NKX6-1,BHLHB9,GREM1,SOX6,NRP1,THB S1,MKL2,HMGA2, SOX9,OTX2,MAP2 K6,ASB4,BCL9L,F 3,TBX5,IL1RAPL1, ARNTL,FLT1,CD5 3,HDAC9,CAMK2B,PTPRD,NKX2-5,VNN1,ATOH1,M UL1,ZBTB1,TAL1, VWC2,ANGPT4,H OXD3,MFF,RBPJ, CTGF,COL1A1,NP TN,ASXL2,ACVR1, PTGS2,RGS14,BM P6,LRP5,TMEM10 0,NGF,TCF7L2,BM P5,ACVR2A,PACS
34 GO: GO: REAC: GO: GO: synapse assembly regulation of cell development GRB2:SOS binds IRS-P glandular epithelial cell differentiation regulation of neurogenesis IN1,OPRM1,BMP NRXN1,WNT7A,G HRL,SHANK2,NLG N4X,EPHB2,PCDH B3,BDNF,BHLHB9, DNM3,IL1RAPL1,P TPRD,PCDHB13,N RXN2,PCDHB5,PD LIM5,LRP4,PCDH B14,NLGN4Y,PCD HB ID2,WNT7A,SEMA 5A,ODZ4,IFNG,SO X11,DMD,FBXW8, NEUROD1,SARM1,FGF13,GCNT2,B MP10,RAPGEF1,K IAA0319,EPHA4,T WIST1,CNOT2,SM YD1,CHN1,PAX8, CDK1,NUMB,ZEB1,BMP4,MYOG,LTK,GFI1,PAX6,NEDD 4,NKX6-1,SIPA1L1,BHLHB 9,GREM1,NRP1,C NTN4,COL3A1,LR RC4C,HMGA2,SO X9,BCL9L,TBX5,E LL3,IL1RAPL1,AR NTL,HDAC9,CAM K2B,PTPRD,NKX2-5,ATOH1,SOX3,T RPV4,VWC2,RUF Y3,PDLIM5,HOXD 3,CCDC88A,COL1 A1,NPTN,RGS14,L RP4,NGF,SSH2,T CF7L2,KLK IRS1,IRS2,SOS1, GRB NEUROD1,CDK6,I NSM1,BMP4,PAX6,NKX6-1,ARNTL,PDX1,B MP6,BMP ID2,WNT7A,SEMA 5A,ODZ4,SOX11,D MD,FBXW8,NEUR OD1,SARM1,FGF1 3,RAPGEF1,KIAA0 319,EPHA4,CHN1, CDK1,NUMB,ZEB1,LTK,GFI1,PAX6,N
35 GO: GO: GO: GO: GO: membrane assembly enteroendocr ine cell differentiation membrane biogenesis positive regulation of transcription regulatory region DNA binding regulation of nervous system development EDD4,SIPA1L1,BH LHB9,NRP1,CNTN 4,COL3A1,LRRC4 C,SOX9,IL1RAPL1,ARNTL,CAMK2B, PTPRD,NKX2-5,ATOH1,SOX3,T RPV4,VWC2,RUF Y3,PDLIM5,HOXD 3,CCDC88A,NPTN,RGS14,LRP4,NG F,SSH2,KLK8,BMP 5,PACSIN1,OPRM NRXN1,ANK3,NLG N4X,IL1RAPL1,PT PRD,NRXN2,SPTB N1,LRP NEUROD1,CDK6,I NSM1,BMP4,PAX6,NKX6-1,ARNTL,PDX1,B MP NRXN1,ANK3,NLG N4X,IL1RAPL1,PT PRD,NRXN2,SPTB N1,LRP4,CLIP GATA3,NEUROD1,HAND2,TWIST1,H MGA2,TGFB ID2,NRXN1,WNT7 A,SEMA5A,ODZ4, GHRL,SOX11,DM D,FBXW8,NEURO D1,SARM1,FGF13, RAPGEF1,KIAA03 19,EPHA4,EPHB2, CHN1,CDK1,NUM B,ZEB1,LTK,GFI1, PAX6,NEDD4,BDN F,SIPA1L1,BHLHB 9,NRP1,CNTN4,C OL3A1,LRRC4C,S OX9,IL1RAPL1,AR NTL,CAMK2B,PTP RD,NKX2-5,ATOH1,SOX3,T RPV4,VWC2,RUF Y3,PDLIM5,HOXD 3,CCDC88A,NPTN,RGS14,LRP4,NG F,SSH2,KLK8,BMP 5,PACSIN1,OPRM
36 KEGG: GO: REAC: REAC: REAC: REAC: REAC: REAC: KEGG: Dopaminergi c synapse embryonic organ development Signaling by VEGF VEGF ligandreceptor interactions Neurophilin interactions with VEGF and VEGFR SOS phosphorylati on and dissociation (IRS) I-SMAD competes with R-SMAD for type I receptor Exocyst complex formation Focal adhesion GRIA3,GRIA4,GN AS,GNG4,GNG12, PPP2R2B,GNB2,G NGT1,GNB5,PPP3 CA,PRKCB,PRKX, GNAL,GNAI3,CAC NA1A,ITPR1,KIF5 C,MAPK10,PPP2R 5C,ARNTL,SLC18 A2,ATF2,CAMK2B, GRIA1,KCNJ3,MA PK8,PRKCG,GRIA 2,GRIN2A,GNAQ, KCNJ RYR2,ID2,TGFBR 2,STIL,TCF21,SOX 11,NEUROD1,HAN D2,DSCAML1,TWI ST1,EPHB2,TFAP 2A,PAX8,KDM2B, CASP8,GLI2,SOX1 7,SOX9,RARB,CO L2A1,KIT,TGFBR1, PKD2,NKX2-5,VANGL2,TAL1,KI TLG,HOXD3,RBPJ,NIPBL,ACVR1,FU Z VEGFC,NRP1,FLT 1,NRP2,FIGF,KDR VEGFC,NRP1,FLT 1,NRP2,FIGF,KDR NRP1,FLT1,NRP2, KDR IRS1,IRS2,SOS1, GRB TGFBR2,SMAD6,T GFBR1,TGFB EXOC7,EXOC4,EX OC2,EXOC5,EXO C TNXB,ACTN2,CAP N2,PIK3R3,PAK7, PRKCB,PPP1R12 A,IGF1R,MYLK4,R
37 KEGG: GO: REAC: GABAergic synapse regulation of neuron differentiation Formation of Platelet plug APGEF1,TNR,BIR C2,COL11A2,SOS 1,GRB2,VEGFC,A CTN1,PXN,SHC3,I TGA1,FN1,THBS1, MAPK10,COL3A1, COL2A1,ITGA2,FL T1,SHC1,FIGF,CO L4A5,MAPK8,ITGB 7,PRKCG,TLN2,P ARVB,COL1A1,CO L4A1,ITGA4,PDGF D,PPP1R12B,IBSP,COL11A1,KDR GNG4,GNG12,SL C6A1,GABRE,GN B2,GNGT1,GNB5, GPHN,ADCY9,PR KCB,PRKX,GABR A4,GNAI3,GABRA 5,ADCY6,CACNA1 A,GABRG3,SLC6A 13,GABRG2,GABR B3,PRKCG,SLC32 A ID2,SEMA5A,SOX 11,DMD,FBXW8,N EUROD1,SARM1, FGF13,RAPGEF1, KIAA0319,EPHA4, CHN1,ZEB1,LTK,G FI1,NEDD4,SIPA1 L1,BHLHB9,NRP1, CNTN4,LRRC4C,S OX9,IL1RAPL1,CA MK2B,PTPRD,NK X2-5,ATOH1,SOX3,T RPV4,VWC2,RUF Y3,PDLIM5,HOXD 3,CCDC88A,NPTN,LRP4,NGF,SSH2, KLK8,BMP5,PACS IN1,BMP GNG4,GNG12,AC TN2,GNB2,GNGT1,GNB5,PRKCB,AP BB1IP,SELP,ALB, SOS1,GRB2,VEGF C,ACTN1,FGA,ITP R1,FN1,THBS1,IT GA2,LAMP2,FIGF, PPBP,COL1A1,FG G,GNAQ,GP6,TGF B1
38 Supplementary Table 3 g:profiler analysis of differentially methylated genes Enriched pathways (p < 0.05) from a g:profiler analysis including gene ontology: biological process, KEGG, and REACTOME are specified. These pathways are enriched in genes showing significant differential methylation between BRCA2-mutant and sporadic PCa.
MSI positive MSI negative
 Pritchard et al. 2014 Supplementary Figure 1 MSI positive MSI negative Hypermutated Median: 673 Average: 659.2 Non-Hypermutated Median: 37.5 Average: 43.6 Supplementary Figure 1: Somatic Mutation Burden
Nature Methods: doi: /nmeth.3115
 Supplementary Figure 1 Analysis of DNA methylation in a cancer cohort based on Infinium 450K data. RnBeads was used to rediscover a clinically distinct subgroup of glioblastoma patients characterized by
SUPPLEMENTARY INFORMATION
 doi: 1.138/nature8645 Physical coverage (x haploid genomes) 11 6.4 4.9 6.9 6.7 4.4 5.9 9.1 7.6 125 Neither end mapped One end mapped Chimaeras Correct Reads (million ns) 1 75 5 25 HCC1187 HCC1395 HCC1599
Supplementary Figure 1. Estimation of tumour content
 Supplementary Figure 1. Estimation of tumour content a, Approach used to estimate the tumour content in S13T1/T2, S6T1/T2, S3T1/T2 and S12T1/T2. Tissue and tumour areas were evaluated by two independent
Whole Genome and Transcriptome Analysis of Anaplastic Meningioma. Patrick Tarpey Cancer Genome Project Wellcome Trust Sanger Institute
 Whole Genome and Transcriptome Analysis of Anaplastic Meningioma Patrick Tarpey Cancer Genome Project Wellcome Trust Sanger Institute Outline Anaplastic meningioma compared to other cancers Whole genomes
The 16th KJC Bioinformatics Symposium Integrative analysis identifies potential DNA methylation biomarkers for pan-cancer diagnosis and prognosis
 The 16th KJC Bioinformatics Symposium Integrative analysis identifies potential DNA methylation biomarkers for pan-cancer diagnosis and prognosis Tieliu Shi tlshi@bio.ecnu.edu.cn The Center for bioinformatics
Supplemental Information. Molecular, Pathological, Radiological, and Immune. Profiling of Non-brainstem Pediatric High-Grade
 Cancer Cell, Volume 33 Supplemental Information Molecular, Pathological, Radiological, and Immune Profiling of Non-brainstem Pediatric High-Grade Glioma from the HERBY Phase II Randomized Trial Alan Mackay,
Nature Genetics: doi: /ng Supplementary Figure 1. Somatic coding mutations identified by WES/WGS for 83 ATL cases.
 Supplementary Figure 1 Somatic coding mutations identified by WES/WGS for 83 ATL cases. (a) The percentage of targeted bases covered by at least 2, 10, 20 and 30 sequencing reads (top) and average read
Nature Medicine: doi: /nm.3967
 Supplementary Figure 1. Network clustering. (a) Clustering performance as a function of inflation factor. The grey curve shows the median weighted Silhouette widths for varying inflation factors (f [1.6,
SUPPLEMENTARY INFORMATION
 doi:10.1038/nature10866 a b 1 2 3 4 5 6 7 Match No Match 1 2 3 4 5 6 7 Turcan et al. Supplementary Fig.1 Concepts mapping H3K27 targets in EF CBX8 targets in EF H3K27 targets in ES SUZ12 targets in ES
Nature Genetics: doi: /ng Supplementary Figure 1. SEER data for male and female cancer incidence from
 Supplementary Figure 1 SEER data for male and female cancer incidence from 1975 2013. (a,b) Incidence rates of oral cavity and pharynx cancer (a) and leukemia (b) are plotted, grouped by males (blue),
Nature Getetics: doi: /ng.3471
 Supplementary Figure 1 Summary of exome sequencing data. ( a ) Exome tumor normal sample sizes for bladder cancer (BLCA), breast cancer (BRCA), carcinoid (CARC), chronic lymphocytic leukemia (CLLX), colorectal
Nature Structural & Molecular Biology: doi: /nsmb Supplementary Figure 1
 Supplementary Figure 1 Frequency of alternative-cassette-exon engagement with the ribosome is consistent across data from multiple human cell types and from mouse stem cells. Box plots showing AS frequency
CDH1 truncating alterations were detected in all six plasmacytoid-variant bladder tumors analyzed by whole-exome sequencing.
 Supplementary Figure 1 CDH1 truncating alterations were detected in all six plasmacytoid-variant bladder tumors analyzed by whole-exome sequencing. Whole-exome sequencing of six plasmacytoid-variant bladder
SUPPLEMENTAL INFORMATION
 SUPPLEMENTAL INFORMATION GO term analysis of differentially methylated SUMIs. GO term analysis of the 458 SUMIs with the largest differential methylation between human and chimp shows that they are more
Relationship between genomic features and distributions of RS1 and RS3 rearrangements in breast cancer genomes.
 Supplementary Figure 1 Relationship between genomic features and distributions of RS1 and RS3 rearrangements in breast cancer genomes. (a,b) Values of coefficients associated with genomic features, separately
Supplementary Information. Supplementary Figures
 Supplementary Information Supplementary Figures.8 57 essential gene density 2 1.5 LTR insert frequency diversity DEL.5 DUP.5 INV.5 TRA 1 2 3 4 5 1 2 3 4 1 2 Supplementary Figure 1. Locations and minor
Nature Medicine: doi: /nm.4439
 Figure S1. Overview of the variant calling and verification process. This figure expands on Fig. 1c with details of verified variants identification in 547 additional validation samples. Somatic variants
BWA alignment to reference transcriptome and genome. Convert transcriptome mappings back to genome space
 Whole genome sequencing Whole exome sequencing BWA alignment to reference transcriptome and genome Convert transcriptome mappings back to genome space genomes Filter on MQ, distance, Cigar string Annotate
Supplementary Figure 1
 Supplementary Figure 1 Supplementary Fig. 1: Quality assessment of formalin-fixed paraffin-embedded (FFPE)-derived DNA and nuclei. (a) Multiplex PCR analysis of unrepaired and repaired bulk FFPE gdna from
Supplementary Figure 1: Classification scheme for non-synonymous and nonsense germline MC1R variants. The common variants with previously established
 Supplementary Figure 1: Classification scheme for nonsynonymous and nonsense germline MC1R variants. The common variants with previously established classifications 1 3 are shown. The effect of novel missense
Supplementary Figures
 Supplementary Figures Supplementary Figure 1. Heatmap of GO terms for differentially expressed genes. The terms were hierarchically clustered using the GO term enrichment beta. Darker red, higher positive
Variant Classification. Author: Mike Thiesen, Golden Helix, Inc.
 Variant Classification Author: Mike Thiesen, Golden Helix, Inc. Overview Sequencing pipelines are able to identify rare variants not found in catalogs such as dbsnp. As a result, variants in these datasets
Supplementary Figures
 Supplementary Figures Supplementary Figure 1. Confirmation of Dnmt1 conditional knockout out mice. a, Representative images of sorted stem (Lin - CD49f high CD24 + ), luminal (Lin - CD49f low CD24 + )
Expanded View Figures
 Solip Park & Ben Lehner Epistasis is cancer type specific Molecular Systems Biology Expanded View Figures A B G C D E F H Figure EV1. Epistatic interactions detected in a pan-cancer analysis and saturation
Spatio-genomic heterogeneity within localized, multi-focal prostate cancer
 Spatio-genomic heterogeneity within localized, multi-focal prostate cancer Paul C. Boutros,1,2,3, Michael Fraser *,4, Nicholas J. Harding *,1, Richard de Borja *,1, Dominique Trudel *,5, Emilie Lalonde
Nature Genetics: doi: /ng Supplementary Figure 1. PCA for ancestry in SNV data.
 Supplementary Figure 1 PCA for ancestry in SNV data. (a) EIGENSTRAT principal-component analysis (PCA) of SNV genotype data on all samples. (b) PCA of only proband SNV genotype data. (c) PCA of SNV genotype
Expanded View Figures
 EMO Molecular Medicine Proteomic map of squamous cell carcinomas Hanibal ohnenberger et al Expanded View Figures Figure EV1. Technical reproducibility. Pearson s correlation analysis of normalised SILC
Supplementary Figures
 Supplementary Figures Supplementary Figure 1. Pan-cancer analysis of global and local DNA methylation variation a) Variations in global DNA methylation are shown as measured by averaging the genome-wide
Supplementary Figure 1: Features of IGLL5 Mutations in CLL: a) Representative IGV screenshot of first
 Representative IGV screenshot of first") Supplementary Figure 1: Features of IGLL5 Mutations in CLL: a) Representative IGV screenshot of first intron IGLL5 mutation depicting biallelic mutations. Red arrows highlight the presence of out of phase
Supplementary Figure 1: Features of IGLL5 Mutations in CLL: a) Representative IGV screenshot of first intron IGLL5 mutation depicting biallelic mutations. Red arrows highlight the presence of out of phase
Supplementary Figure 1: Comparison of acgh-based and expression-based CNA analysis of tumors from breast cancer GEMMs.
 Supplementary Figure 1: Comparison of acgh-based and expression-based CNA analysis of tumors from breast cancer GEMMs. (a) CNA analysis of expression microarray data obtained from 15 tumors in the SV40Tag
Nature Genetics: doi: /ng Supplementary Figure 1. Immunofluorescence (IF) confirms absence of H3K9me in met-2 set-25 worms.
 confirms absence of H3K9me in met-2 set-25 worms.") Supplementary Figure 1 Immunofluorescence (IF) confirms absence of H3K9me in met-2 set-25 worms. IF images of wild-type (wt) and met-2 set-25 worms showing the loss of H3K9me2/me3 at the indicated developmental
Supplementary Figure 1 Immunofluorescence (IF) confirms absence of H3K9me in met-2 set-25 worms. IF images of wild-type (wt) and met-2 set-25 worms showing the loss of H3K9me2/me3 at the indicated developmental
Supplementary Tables. Supplementary Figures
 Supplementary Files for Zehir, Benayed et al. Mutational Landscape of Metastatic Cancer Revealed from Prospective Clinical Sequencing of 10,000 Patients Supplementary Tables Supplementary Table 1: Sample
Expanded View Figures
 Molecular Systems iology Tumor CNs reflect metabolic selection Nicholas Graham et al Expanded View Figures Human primary tumors CN CN characterization by unsupervised PC Human Signature Human Signature
Abstract. Optimization strategy of Copy Number Variant calling using Multiplicom solutions APPLICATION NOTE. Introduction
 Optimization strategy of Copy Number Variant calling using Multiplicom solutions Michael Vyverman, PhD; Laura Standaert, PhD and Wouter Bossuyt, PhD Abstract Copy number variations (CNVs) represent a significant
Nature Genetics: doi: /ng.2995
 Supplementary Figure 1 Kaplan-Meier survival curves of patients with brainstem tumors. (a) Comparison of patients with PPM1D mutation versus wild-type PPM1D. (b) Comparison of patients with PPM1D mutation
Nature Genetics: doi: /ng Supplementary Figure 1. HOX fusions enhance self-renewal capacity.
 Supplementary Figure 1 HOX fusions enhance self-renewal capacity. Mouse bone marrow was transduced with a retrovirus carrying one of three HOX fusion genes or the empty mcherry reporter construct as described
underlying metastasis and recurrence in HNSCC, we analyzed two groups of patients. The
 Supplementary Figures Figure S1. Patient cohorts and study design. To define and interrogate the genetic alterations underlying metastasis and recurrence in HNSCC, we analyzed two groups of patients. The
Plasma-Seq conducted with blood from male individuals without cancer.
 Supplementary Figures Supplementary Figure 1 Plasma-Seq conducted with blood from male individuals without cancer. Copy number patterns established from plasma samples of male individuals without cancer
Nature Structural & Molecular Biology: doi: /nsmb Supplementary Figure 1
 Supplementary Figure 1 Effect of HSP90 inhibition on expression of endogenous retroviruses. (a) Inducible shrna-mediated Hsp90 silencing in mouse ESCs. Immunoblots of total cell extract expressing the
Prostate cancer ~ diagnosis and impact of pathology on prognosis ESMO 2017
 Prostate cancer ~ diagnosis and impact of pathology on prognosis ESMO 2017 Dr Puay Hoon Tan Division of Pathology Singapore General Hospital Prostate cancer (acinar adenocarcinoma) Invasive carcinoma composed
Supplementary Figure S1. Gene expression analysis of epidermal marker genes and TP63.
 Supplementary Figure Legends Supplementary Figure S1. Gene expression analysis of epidermal marker genes and TP63. A. Screenshot of the UCSC genome browser from normalized RNAPII and RNA-seq ChIP-seq data
Cancer Informatics Lecture
 Cancer Informatics Lecture Mayo-UIUC Computational Genomics Course June 22, 2018 Krishna Rani Kalari Ph.D. Associate Professor 2017 MFMER 3702274-1 Outline The Cancer Genome Atlas (TCGA) Genomic Data Commons
Nature Biotechnology: doi: /nbt Supplementary Figure 1. Binding capacity of DNA-barcoded MHC multimers and recovery of antigen specificity
 Supplementary Figure 1 Binding capacity of DNA-barcoded MHC multimers and recovery of antigen specificity (a, b) Fluorescent-based determination of the binding capacity of DNA-barcoded MHC multimers (+barcode)
Characterisation of structural variation in breast. cancer genomes using paired-end sequencing on. the Illumina Genome Analyser
 Characterisation of structural variation in breast cancer genomes using paired-end sequencing on the Illumina Genome Analyser Phil Stephens Cancer Genome Project Why is it important to study cancer? Why
Cancer Genomics. Nic Waddell. Winter School in Mathematical and Computational Biology. July th
 Cancer Genomics Nic Waddell Winter School in Mathematical and Computational Biology 6th July 2015 Time Line of Key Events in Cancer Genomics Michael R. Stratton Science 2011;331:1553-1558 The Cancer Genome
7SK ChIRP-seq is specifically RNA dependent and conserved between mice and humans.
 Supplementary Figure 1 7SK ChIRP-seq is specifically RNA dependent and conserved between mice and humans. Regions targeted by the Even and Odd ChIRP probes mapped to a secondary structure model 56 of the
Computational Investigation of Homologous Recombination DNA Repair Deficiency in Sporadic Breast Cancer
 University of Massachusetts Medical School escholarship@umms Open Access Articles Open Access Publications by UMMS Authors 11-16-2017 Computational Investigation of Homologous Recombination DNA Repair
Supplemental Information For: The genetics of splicing in neuroblastoma
 Supplemental Information For: The genetics of splicing in neuroblastoma Justin Chen, Christopher S. Hackett, Shile Zhang, Young K. Song, Robert J.A. Bell, Annette M. Molinaro, David A. Quigley, Allan Balmain,
OncoPPi Portal A Cancer Protein Interaction Network to Inform Therapeutic Strategies
 OncoPPi Portal A Cancer Protein Interaction Network to Inform Therapeutic Strategies 2017 Contents Datasets... 2 Protein-protein interaction dataset... 2 Set of known PPIs... 3 Domain-domain interactions...
p.r623c p.p976l p.d2847fs p.t2671 p.d2847fs p.r2922w p.r2370h p.c1201y p.a868v p.s952* RING_C BP PHD Cbp HAT_KAT11
 ARID2 p.r623c KMT2D p.v650fs p.p976l p.r2922w p.l1212r p.d1400h DNA binding RFX DNA binding Zinc finger KMT2C p.a51s p.d372v p.c1103* p.d2847fs p.t2671 p.d2847fs p.r4586h PHD/ RING DHHC/ PHD PHD FYR N
Supplemental Figure S1. RANK expression on human lung cancer cells.
 Supplemental Figure S1. RANK expression on human lung cancer cells. (A) Incidence and H-Scores of RANK expression determined from IHC in the indicated primary lung cancer subgroups. The overall expression
Supplementary Note. Nature Genetics: doi: /ng.2928
 Supplementary Note Loss of heterozygosity analysis (LOH). We used VCFtools v0.1.11 to extract only singlenucleotide variants with minimum depth of 15X and minimum mapping quality of 20 to create a ped
Next generation diagnostics Bringing high-throughput sequencing into clinical application
 Next generation diagnostics Bringing high-throughput sequencing into clinical application Leonardo A. Meza-Zepeda, PhD Translational Genomics Group Institute for Cancer Research Leonardo.Meza-Zepeda@rr-research.no
Nature Biotechnology: doi: /nbt.1904
 Supplementary Information Comparison between assembly-based SV calls and array CGH results Genome-wide array assessment of copy number changes, such as array comparative genomic hybridization (acgh), is
6/12/2018. Disclosures. Clinical Genomics The CLIA Lab Perspective. Outline. COH HopeSeq Heme Panels
 Clinical Genomics The CLIA Lab Perspective Disclosures Raju K. Pillai, M.D. Hematopathologist / Molecular Pathologist Director, Pathology Bioinformatics City of Hope National Medical Center, Duarte, CA
ARTICLE RESEARCH. Macmillan Publishers Limited. All rights reserved
 Extended Data Figure 6 Annotation of drivers based on clinical characteristics and co-occurrence patterns. a, Putative drivers affecting greater than 10 patients were assessed for enrichment in IGHV mutated
Single-strand DNA library preparation improves sequencing of formalin-fixed and paraffin-embedded (FFPE) cancer DNA
 cancer DNA") www.impactjournals.com/oncotarget/ Oncotarget, Supplementary Materials 2016 Single-strand DNA library preparation improves sequencing of formalin-fixed and paraffin-embedded (FFPE) DNA Supplementary Materials
www.impactjournals.com/oncotarget/ Oncotarget, Supplementary Materials 2016 Single-strand DNA library preparation improves sequencing of formalin-fixed and paraffin-embedded (FFPE) DNA Supplementary Materials
Computer Science, Biology, and Biomedical Informatics (CoSBBI) Outline. Molecular Biology of Cancer AND. Goals/Expectations. David Boone 7/1/2015
 Outline. Molecular Biology of Cancer AND. Goals/Expectations. David Boone 7/1/2015") Goals/Expectations Computer Science, Biology, and Biomedical (CoSBBI) We want to excite you about the world of computer science, biology, and biomedical informatics. Experience what it is like to be a
Goals/Expectations Computer Science, Biology, and Biomedical (CoSBBI) We want to excite you about the world of computer science, biology, and biomedical informatics. Experience what it is like to be a
RNA SEQUENCING AND DATA ANALYSIS
 RNA SEQUENCING AND DATA ANALYSIS Length of mrna transcripts in the human genome 5,000 5,000 4,000 3,000 2,000 4,000 1,000 0 0 200 400 600 800 3,000 2,000 1,000 0 0 2,000 4,000 6,000 8,000 10,000 Length
Figure S2. Distribution of acgh probes on all ten chromosomes of the RIL M0022
 96 APPENDIX B. Supporting Information for chapter 4 "changes in genome content generated via segregation of non-allelic homologs" Figure S1. Potential de novo CNV probes and sizes of apparently de novo
Frequency(%) KRAS G12 KRAS G13 KRAS A146 KRAS Q61 KRAS K117N PIK3CA H1047 PIK3CA E545 PIK3CA E542K PIK3CA Q546. EGFR exon19 NFS-indel EGFR L858R
 KRAS G12 KRAS G13 KRAS A146 KRAS Q61 KRAS K117N PIK3CA H1047 PIK3CA E545 PIK3CA E542K PIK3CA Q546. EGFR exon19 NFS-indel EGFR L858R") Frequency(%) 1 a b ALK FS-indel ALK R1Q HRAS Q61R HRAS G13R IDH R17K IDH R14Q MET exon14 SS-indel KIT D8Y KIT L76P KIT exon11 NFS-indel SMAD4 R361 IDH1 R13 CTNNB1 S37 CTNNB1 S4 AKT1 E17K ERBB D769H ERBB
Frequency(%) 1 a b ALK FS-indel ALK R1Q HRAS Q61R HRAS G13R IDH R17K IDH R14Q MET exon14 SS-indel KIT D8Y KIT L76P KIT exon11 NFS-indel SMAD4 R361 IDH1 R13 CTNNB1 S37 CTNNB1 S4 AKT1 E17K ERBB D769H ERBB
High Throughput Sequence (HTS) data analysis. Lei Zhou
 data analysis. Lei Zhou") High Throughput Sequence (HTS) data analysis Lei Zhou (leizhou@ufl.edu) High Throughput Sequence (HTS) data analysis 1. Representation of HTS data. 2. Visualization of HTS data. 3. Discovering genomic
High Throughput Sequence (HTS) data analysis Lei Zhou (leizhou@ufl.edu) High Throughput Sequence (HTS) data analysis 1. Representation of HTS data. 2. Visualization of HTS data. 3. Discovering genomic
Nature Genetics: doi: /ng Supplementary Figure 1
 Supplementary Figure 1 Multiple samples from five patients (P4, P8, P14, P15 and P17) with Barrett s esophagus and adjacent EAC show that the poor overlap is not a result of sampling bias. Bar graphs showing
(a) Schematic diagram of the FS mutation of UVRAG in exon 8 containing the highly instable
 Schematic diagram of the FS mutation of UVRAG in exon 8 containing the highly instable") Supplementary Figure 1. Frameshift (FS) mutation in UVRAG. (a) Schematic diagram of the FS mutation of UVRAG in exon 8 containing the highly instable A 10 DNA repeat, generating a premature stop codon
Supplementary Figure 1. Frameshift (FS) mutation in UVRAG. (a) Schematic diagram of the FS mutation of UVRAG in exon 8 containing the highly instable A 10 DNA repeat, generating a premature stop codon
NGS in tissue and liquid biopsy
 NGS in tissue and liquid biopsy Ana Vivancos, PhD Referencias So, why NGS in the clinics? 2000 Sanger Sequencing (1977-) 2016 NGS (2006-) ABIPrism (Applied Biosystems) Up to 2304 per day (96 sequences
Clasificación Molecular del Cáncer de Próstata. JM Piulats
 Clasificación Molecular del Cáncer de Próstata JM Piulats Introduction The Gleason score is the major method for prostate cancer tissue grading and the most important prognostic factor in this disease.
Identifying Mutations Responsible for Rare Disorders Using New Technologies
 Identifying Mutations Responsible for Rare Disorders Using New Technologies Jacek Majewski, Department of Human Genetics, McGill University, Montreal, QC Canada Mendelian Diseases Clear mode of inheritance
SUPPLEMENTARY INFORMATION. Intron retention is a widespread mechanism of tumor suppressor inactivation.
 SUPPLEMENTARY INFORMATION Intron retention is a widespread mechanism of tumor suppressor inactivation. Hyunchul Jung 1,2,3, Donghoon Lee 1,4, Jongkeun Lee 1,5, Donghyun Park 2,6, Yeon Jeong Kim 2,6, Woong-Yang
of TERT, MLL4, CCNE1, SENP5, and ROCK1 on tumor development were discussed.
 Supplementary Note The potential association and implications of HBV integration at known and putative cancer genes of TERT, MLL4, CCNE1, SENP5, and ROCK1 on tumor development were discussed. Human telomerase
S1 Appendix: Figs A G and Table A. b Normal Generalized Fraction 0.075
 Aiello & Alter (216) PLoS One vol. 11 no. 1 e164546 S1 Appendix A-1 S1 Appendix: Figs A G and Table A a Tumor Generalized Fraction b Normal Generalized Fraction.25.5.75.25.5.75 1 53 4 59 2 58 8 57 3 48
Nature Neuroscience: doi: /nn Supplementary Figure 1. MADM labeling of thalamic clones.
 Supplementary Figure 1 MADM labeling of thalamic clones. (a) Confocal images of an E12 Nestin-CreERT2;Ai9-tdTomato brain treated with TM at E10 and stained for BLBP (green), a radial glial progenitor-specific
Analysis of Massively Parallel Sequencing Data Application of Illumina Sequencing to the Genetics of Human Cancers
 Analysis of Massively Parallel Sequencing Data Application of Illumina Sequencing to the Genetics of Human Cancers Gordon Blackshields Senior Bioinformatician Source BioScience 1 To Cancer Genetics Studies
WDR62 is associated with the spindle pole and mutated in human microcephaly
 WDR62 is associated with the spindle pole and mutated in human microcephaly Adeline K. Nicholas, Maryam Khurshid, Julie Désir, Ofélia P. Carvalho, James J. Cox, Gemma Thornton, Rizwana Kausar, Muhammad
Development Supplementary information. Supplementary Figures * * +/+ +/- -/- +/+ +/- -/-
 Development 144: doi:1.1242/dev.1473: Supplementary information Supplementary Figures A (f) FRT LoxP 2 3 4 B All Males Females I Ovary 1 (+) 77 bps (f) 78 bps (-) >13 bps (-) 2 4 (-) 424 bps M +/f +/-
gliomas. Fetal brain expected who each low-
 Supplementary Figure S1. Grade-specificity aberrant expression of HOXA genes in gliomas. (A) Representative RT-PCR analyses of HOXA gene expression in human astrocytomas. Exemplified glioma samples include
SUPPLEMENTARY INFORMATION
 DOI: 10.1038/ncb2607 Figure S1 Elf5 loss promotes EMT in mammary epithelium while Elf5 overexpression inhibits TGFβ induced EMT. (a, c) Different confocal slices through the Z stack image. (b, d) 3D rendering
fl/+ KRas;Atg5 fl/+ KRas;Atg5 fl/fl KRas;Atg5 fl/fl KRas;Atg5 Supplementary Figure 1. Gene set enrichment analyses. (a) (b)
 (b)") KRas;At KRas;At KRas;At KRas;At a b Supplementary Figure 1. Gene set enrichment analyses. (a) GO gene sets (MSigDB v3. c5) enriched in KRas;Atg5 fl/+ as compared to KRas;Atg5 fl/fl tumors using gene set
KRas;At KRas;At KRas;At KRas;At a b Supplementary Figure 1. Gene set enrichment analyses. (a) GO gene sets (MSigDB v3. c5) enriched in KRas;Atg5 fl/+ as compared to KRas;Atg5 fl/fl tumors using gene set
Session 4 Rebecca Poulos
 The Cancer Genome Atlas (TCGA) & International Cancer Genome Consortium (ICGC) Session 4 Rebecca Poulos Prince of Wales Clinical School Introductory bioinformatics for human genomics workshop, UNSW 20
Supplementary Material
 Supplementary Material Identification of mir-187 and mir-182 as biomarkers for early diagnosis and prognosis in prostate cancer patients treated with radical prostatectomy Irene Casanova-Salas 1, José
SUPPLEMENTARY FIGURES: Supplementary Figure 1
 SUPPLEMENTARY FIGURES: Supplementary Figure 1 Supplementary Figure 1. Glioblastoma 5hmC quantified by paired BS and oxbs treated DNA hybridized to Infinium DNA methylation arrays. Workflow depicts analytic
Supplementary Figure 1: Attenuation of association signals after conditioning for the lead SNP. a) attenuation of association signal at the 9p22.
 attenuation of association signal at the 9p22.") Supplementary Figure 1: Attenuation of association signals after conditioning for the lead SNP. a) attenuation of association signal at the 9p22.32 PCOS locus after conditioning for the lead SNP rs10993397;
Supplementary Figure 1: Attenuation of association signals after conditioning for the lead SNP. a) attenuation of association signal at the 9p22.32 PCOS locus after conditioning for the lead SNP rs10993397;
Package ClusteredMutations
 Package ClusteredMutations April 29, 2016 Version 1.0.1 Date 2016-04-28 Title Location and Visualization of Clustered Somatic Mutations Depends seriation Description Identification and visualization of
Nature Immunology: doi: /ni Supplementary Figure 1. Transcriptional program of the TE and MP CD8 + T cell subsets.
 Supplementary Figure 1 Transcriptional program of the TE and MP CD8 + T cell subsets. (a) Comparison of gene expression of TE and MP CD8 + T cell subsets by microarray. Genes that are 1.5-fold upregulated
a) List of KMTs targeted in the shrna screen. The official symbol, KMT designation,
 List of KMTs targeted in the shrna screen. The official symbol, KMT designation,") Supplementary Information Supplementary Figures Supplementary Figure 1. a) List of KMTs targeted in the shrna screen. The official symbol, KMT designation, gene ID and specifities are provided. Those highlighted
Supplementary Information Supplementary Figures Supplementary Figure 1. a) List of KMTs targeted in the shrna screen. The official symbol, KMT designation, gene ID and specifities are provided. Those highlighted
Session 4 Rebecca Poulos
 The Cancer Genome Atlas (TCGA) & International Cancer Genome Consortium (ICGC) Session 4 Rebecca Poulos Prince of Wales Clinical School Introductory bioinformatics for human genomics workshop, UNSW 28
Supplementary Information Titles Journal: Nature Medicine
 Supplementary Information Titles Journal: Nature Medicine Article Title: Corresponding Author: Supplementary Item & Number Supplementary Fig.1 Fig.2 Fig.3 Fig.4 Fig.5 Fig.6 Fig.7 Fig.8 Fig.9 Fig. Fig.11
Nature Genetics: doi: /ng Supplementary Figure 1. Mutational signatures in BCC compared to melanoma.
 Supplementary Figure 1 Mutational signatures in BCC compared to melanoma. (a) The effect of transcription-coupled repair as a function of gene expression in BCC. Tumor type specific gene expression levels
CHR POS REF OBS ALLELE BUILD CLINICAL_SIGNIFICANCE
 CHR POS REF OBS ALLELE BUILD CLINICAL_SIGNIFICANCE is_clinical dbsnp MITO GENE chr1 13273 G C heterozygous - - -. - DDX11L1 chr1 949654 A G Homozygous 52 - - rs8997 - ISG15 chr1 1021346 A G heterozygous
Supplementary Figure 1: High-throughput profiling of survival after exposure to - radiation. (a) Cells were plated in at least 7 wells in a 384-well
 Cells were plated in at least 7 wells in a 384-well") Supplementary Figure 1: High-throughput profiling of survival after exposure to - radiation. (a) Cells were plated in at least 7 wells in a 384-well plate at cell densities ranging from 25-225 cells in
Supplementary Figure 1: High-throughput profiling of survival after exposure to - radiation. (a) Cells were plated in at least 7 wells in a 384-well plate at cell densities ranging from 25-225 cells in
Nature Neuroscience doi: /nn Supplementary Figure 1. Characterization of viral injections.
 Supplementary Figure 1 Characterization of viral injections. (a) Dorsal view of a mouse brain (dashed white outline) after receiving a large, unilateral thalamic injection (~100 nl); demonstrating that
Home Brewed Personalized Genomics
 Home Brewed Personalized Genomics The Quest for Meaningful Analysis Results of a 23andMe Exome Pilot Trio of Myself, Wife, and Son February 22, 2013 Gabe Rudy, Vice President of Product Development Exome
SSM signature genes are highly expressed in residual scar tissues after preoperative radiotherapy of rectal cancer.
 Supplementary Figure 1 SSM signature genes are highly expressed in residual scar tissues after preoperative radiotherapy of rectal cancer. Scatter plots comparing expression profiles of matched pretreatment
The Harvard community has made this article openly available. Please share how this access benefits you. Your story matters.
 Identification of novel prostate cancer drivers using RegNetDriver: a framework for integration of genetic and epigenetic alterations with tissue-specific regulatory network The Harvard community has made
Nature Genetics: doi: /ng Supplementary Figure 1. Details of sequencing analysis.
 Supplementary Figure 1 Details of sequencing analysis. (a) Flow chart showing which patients fall into each category and were used for analysis. (b) Graph showing the average and median coverage for all
Comparison of open chromatin regions between dentate granule cells and other tissues and neural cell types.
 Supplementary Figure 1 Comparison of open chromatin regions between dentate granule cells and other tissues and neural cell types. (a) Pearson correlation heatmap among open chromatin profiles of different
SUPPLEMENTARY INFORMATION
 doi:10.1038/nature13908 Supplementary Tables Supplementary Table 1: Families in this study (.xlsx) All families included in the study are listed. For each family, we show: the genders of the probands and
Supplementary Figure 1. Using DNA barcode-labeled MHC multimers to generate TCR fingerprints
 Supplementary Figure 1 Using DNA barcode-labeled MHC multimers to generate TCR fingerprints (a) Schematic overview of the workflow behind a TCR fingerprint. Each peptide position of the original peptide
Supplementary information to:
 Supplementary information to: Digital Sorting of Pure Cell Populations Enables Unambiguous Genetic Analysis of Heterogeneous Formalin-Fixed Paraffin Embedded Tumors by Next Generation Sequencing Authors
The use of diagnostic FFPE material in cancer epidemiology research
 The use of diagnostic FFPE material in cancer epidemiology research Neil O Callaghan Genetic Epidemiology Laboratory Department of Pathology The University of Melbourne www.pedigree.org.au Overview Who