Supplemental Information. Molecular, Pathological, Radiological, and Immune. Profiling of Non-brainstem Pediatric High-Grade
|
|
|
- Darren Wilcox
- 6 years ago
- Views:
Transcription
1 Cancer Cell, Volume 33 Supplemental Information Molecular, Pathological, Radiological, and Immune Profiling of Non-brainstem Pediatric High-Grade Glioma from the HERBY Phase II Randomized Trial Alan Mackay, Anna Burford, Valeria Molinari, David T.W. Jones, Elisa Izquierdo, Jurriaan Brouwer-Visser, Felice Giangaspero, Christine Haberler, Torsten Pietsch, Thomas S. Jacques, Dominique Figarella-Branger, Daniel Rodriguez, Paul S. Morgan, Pichai Raman, Angela J. Waanders, Adam C. Resnick, Maura Massimino, Maria Luisa Garrè, Helen Smith, David Capper, Stefan M. Pfister, Thomas Würdinger, Rachel Tam, Josep Garcia, Meghna Das Thakur, Gilles Vassal, Jacques Grill, Tim Jaspan, Pascale Varlet, and Chris Jones
 Kaplan- Meier plot of event-free and overall survival of cases (y axis) separated by MGMT status, time given in months (x axis) and p value calculated by the")
2 Figure S1 (related to Figure 2) MGMT promoter methylation. (A) Barplots of number of cases with methylated MGMT promoter, subdivided by methylation subgroup. (B) Kaplan- Meier plot of event-free and overall survival of cases (y axis) separated by MGMT status, time given in months (x axis) and p value calculated by the log-rank test.
3
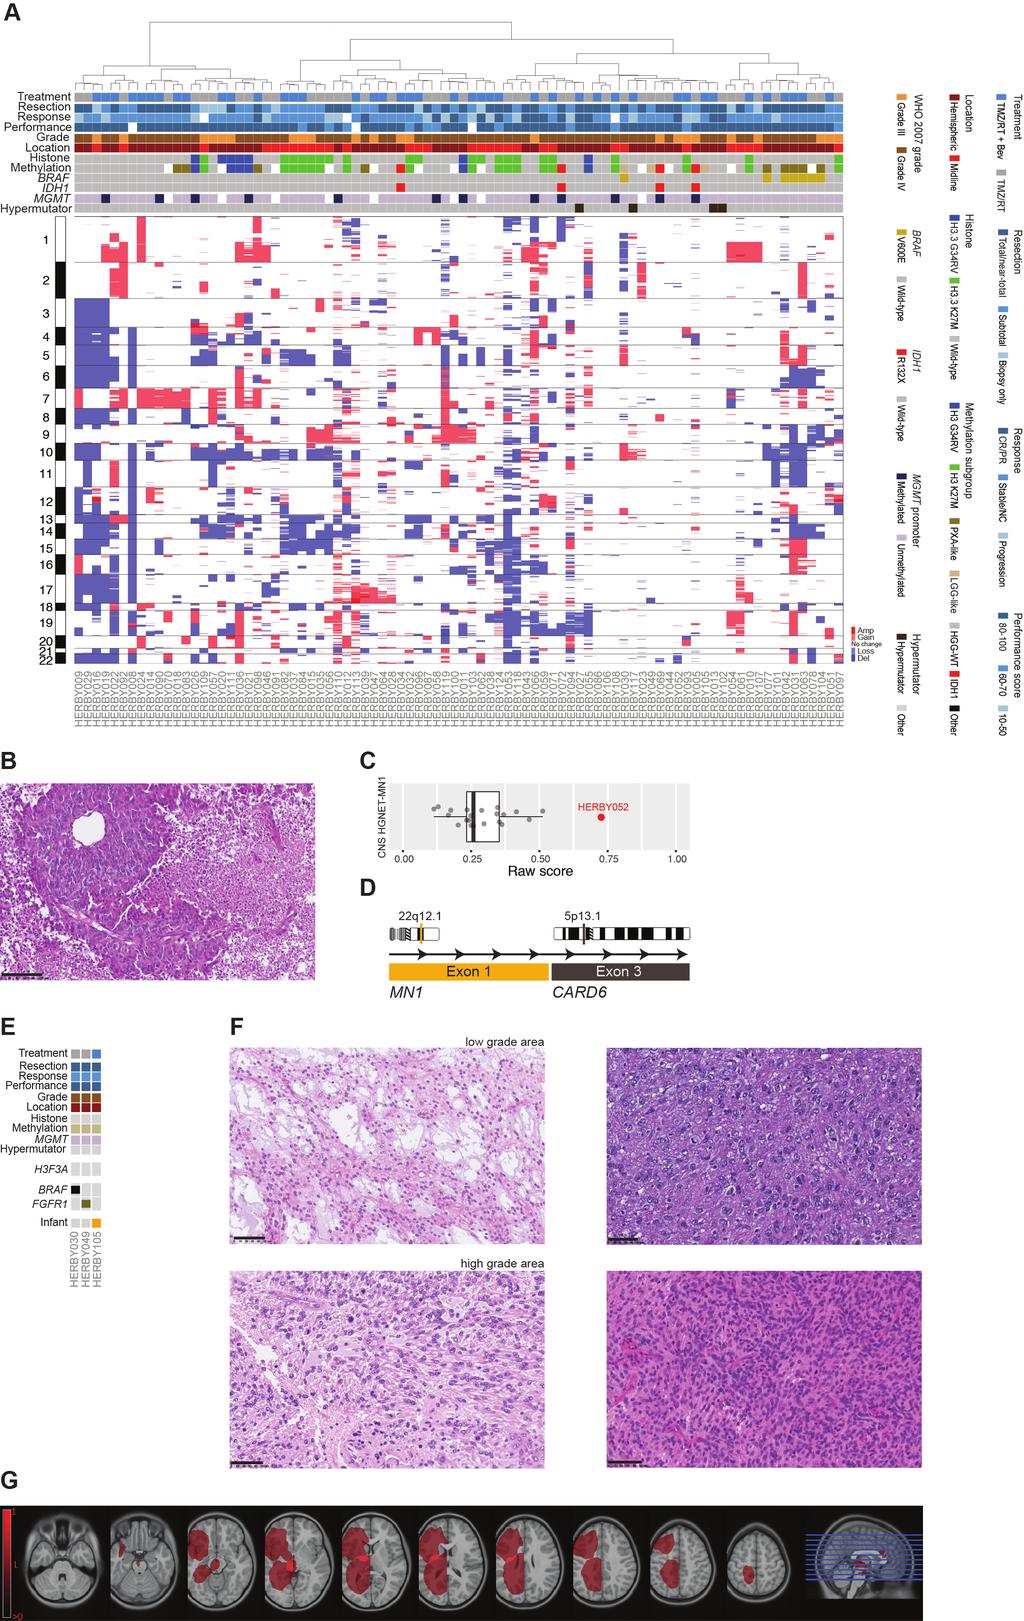
4 Figure S2 (related to Figure 3) DNA copy number profiling and non-hgg-like entities. (A) Heatmap representation of segmented DNA copy number for 86 samples derived from exome coverage data (dark red, amplification; red, gain; dark blue, deletion; blue, loss). Samples are arranged in columns clustered by gene-level data across the whole genome. Clinicopathological and molecular annotations are provided as bars according to the included key. CR/PR = complete response or partial response; Stable/NC = stable disease or no change. (B-D) CNS HGNET-MN1. Haematoxylin and eosin staining (B) of the case most closely resembling CNS HGNET-MN1 (HERBY052), as demonstrated by a boxplot of reference methylation classifier scores (C), and the presence of an MN1:CARD6 gene fusion by capture panel sequencing (D). Scale bar = 100 µm. (E) Integrated annotation of somatic mutations and DNA copy number changes in 3 samples classifying as LGG-like. Clinicopathological and molecular annotations are provided as bars according to the included key in Figure S1. (F) Haematoxylin and eosin staining of the three cases, all histologically classified as glioblastoma (left) the presence of both low- (upper panel) and high grade (lower panel) areas of the tumor harboring BRAF_V600E mutation (HERBY049); (top right) case harboring an intragenic FGFR1 duplication (HERBY030; both previous cases classifying as pilocytic astrocytoma); (bottom left) a cased from the infant cohort, with a methylation profile most closely resembling desmoplastic infantile ganglioglioma (HERBY105). Scale bar = 50 µm. (G) Radiological tumor lesion map of LGG-like cases. Brighter colored pixels indicate a higher probability of tumor incidence.
5
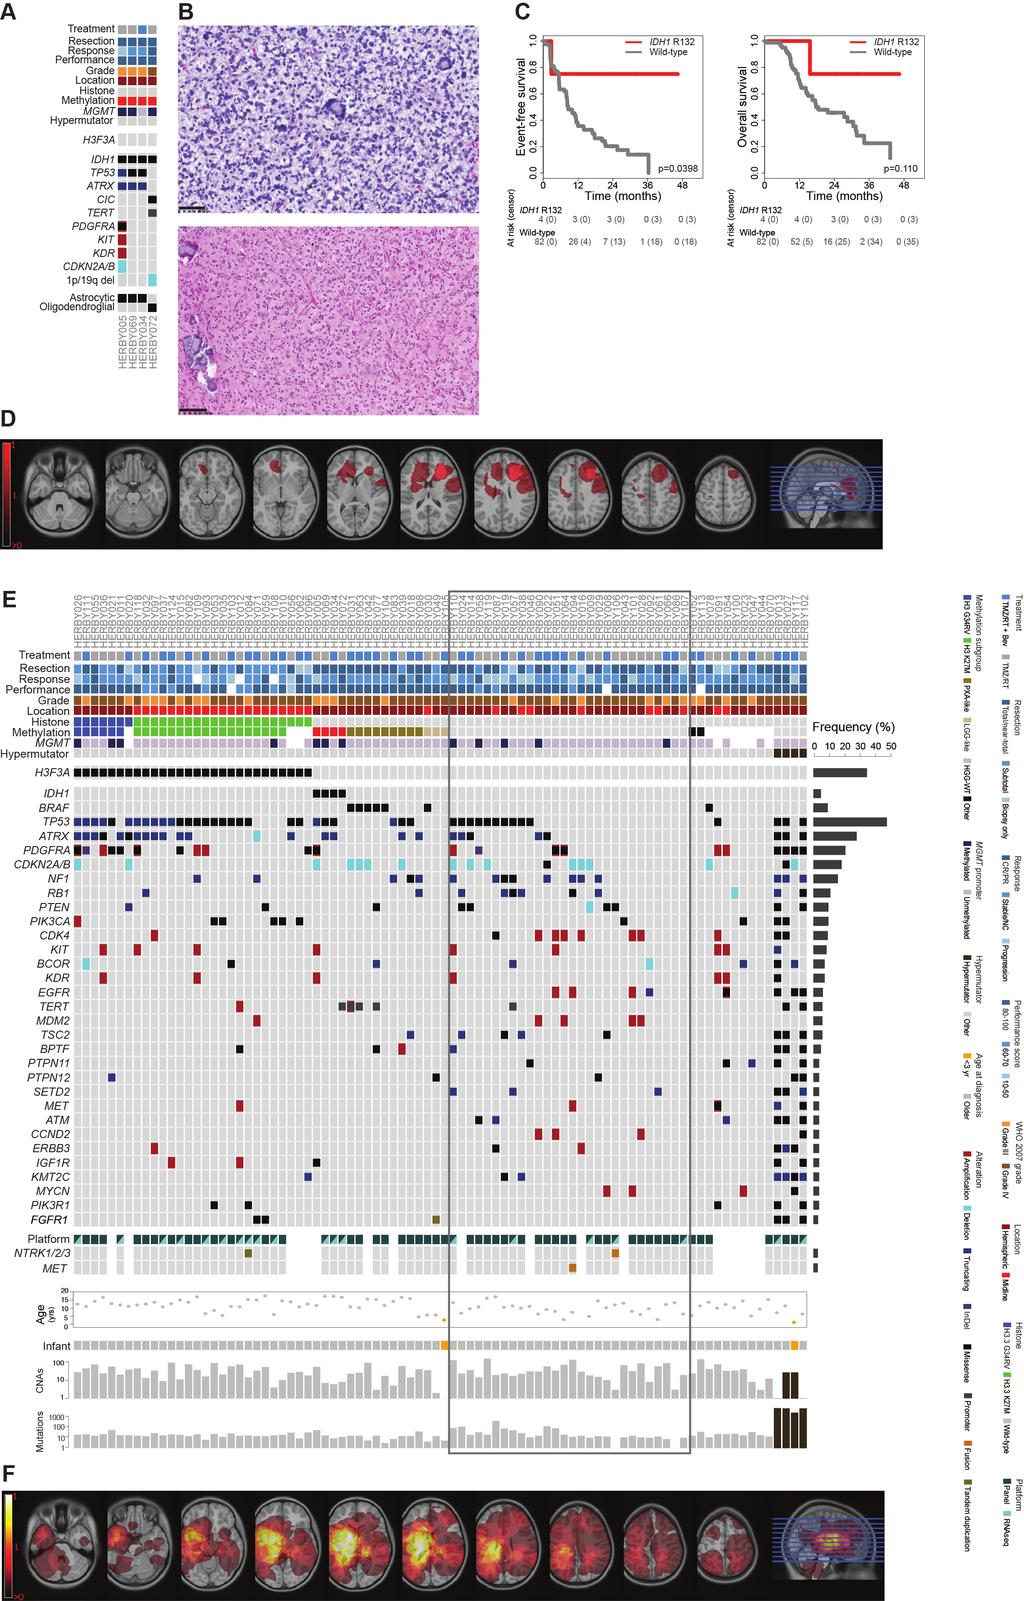
6 Figure S3 (related to Figure 3) IDH1 mutant and H3F3A/IDH1/BRAF wild-type tumors. (A) Integrated annotation of somatic mutations and DNA copy number changes in 4 samples with IDH1_R132 mutation. Clinicopathological and molecular annotations are provided as bars according to the included key in Figure S1. (B) Haematoxylin and eosin staining of cases showing astrocytic (top, HERBY005) and oligodendroglial (bottom, HERBY072) histological features. Scale bar = 50 µm (top) and 100 µm (bottom). (C) Kaplan-Meier plot of event-free and overall survival of cases (y axis) separated by IDH1_R132 status, time given in months (x axis) and p value calculated by the log-rank test. (D) Radiological tumor lesion map of IDH1 cases. Brighter colored pixels indicate a higher probability of tumor incidence. (E) Oncoprint representation of an integrated annotation of somatic mutations and DNA copy number changes for the 30 most frequently altered genes in 86 samples (n³3, frequency barplot on the right, excluding hypermutator cases), ordered by histone and methylation subgroups. Selected common fusion events are also shown where available. Samples are arranged in columns with genes labelled along rows. Barplots are provided on a log 10 scale for numbers of copy number aberrations and somatic mutations per case. Clinicopathological and molecular annotations are provided as bars according to the included key. CR/PR = complete response or partial response; Stable/NC = stable disease or no change. The annotated box highlights H3F3A/IDH1/BRAF wild-type HGG-WT tumors not otherwise assigned to a subgroup. (F) Radiological tumor lesion map of HGG-WT cases. Brighter colored pixels indicate a higher probability of tumor incidence.
7 Figure S4 (related to Figure 4) H3F3A mutant subgroups. (A) Kaplan-Meier plot of eventfree and overall survival (y axis) of 31 cerebral hemispheric cases, excluding those classified by methylation profiling as IDH1, PXA-like or LGG-like, separated by H3F3A status. Time is given in months (x axis) and p value calculated by the log-rank test. (B) Kaplan-Meier plot of event-free and overall survival (y axis) of 24 midline H3F3A_K27M cases, separated by WHO grade. Time is given in months (x axis) and p value calculated by the log-rank test.
 Barplot showing relative proportions of tumor-infiltrating lymphocytes categorized according to two schema (Palma and Rutledge), of 72 cases split by phgg subgroups.")
8 Figure S5 (related to Figure 5) Immune profiling. (A) Barplot showing relative proportions of tumor-infiltrating lymphocytes categorized according to two schema (Palma and Rutledge), of 72 cases split by phgg subgroups. (B) Barplot showing relative proportions of histologically defined immune phenotype of 72 cases, split by phgg subgroups.
9
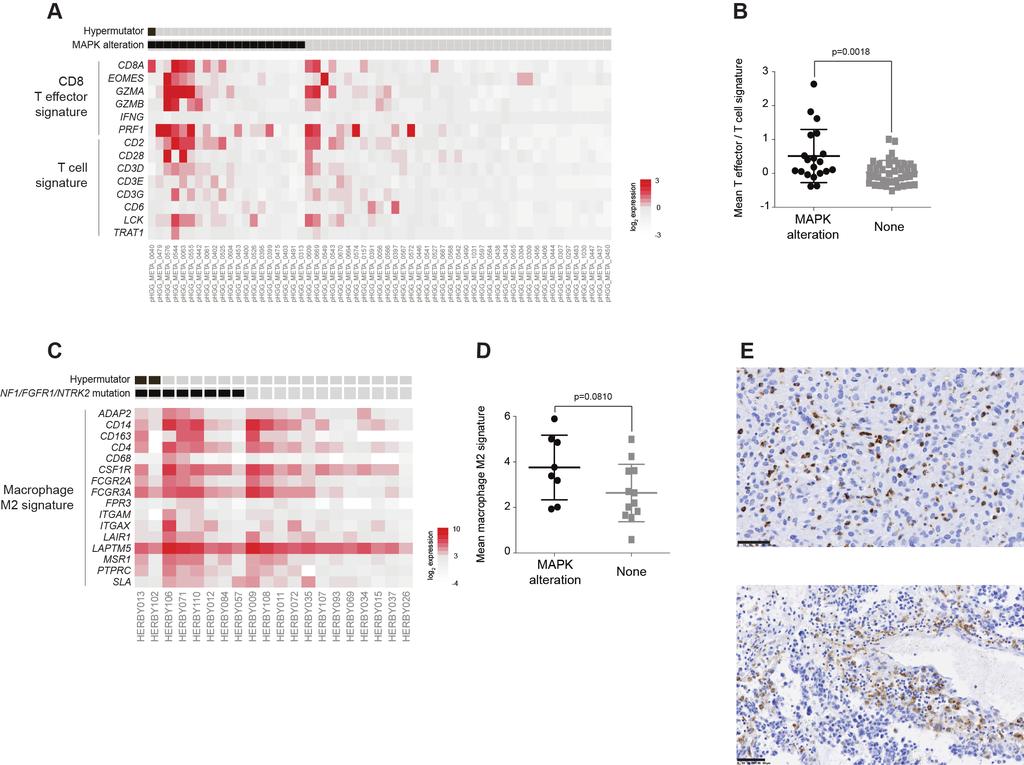
10 Figure S6 (related to Figure 7) CD8 and CD68 signatures. (A) Gene expression signatures for CD8 T effector and T cells plotted as a heatmap from combined gene expression data of non-brainstem high-grade glioma in n=59 patients aged 3-18 years from Mackay et al., Hypermutator cases and those with MAPK alterations are annotated. (B) Boxplot of T effector / T cell gene expression values in MAPK altered samples compared to those without. Horizontal bar represents the mean, error bars the standard deviation. (C) Gene expression signatures for M2 macrophages plotted as a heatmap from 20 cases with RNAseq data. Hypermutator cases and those with MAPK alterations are annotated. (D) Boxplot of M2 macrophage cell gene expression values in MAPK altered samples compared to those without. Horizontal bar represents the mean, error bars the standard deviation. (E) Immunohistochemistry directed against CD68, showing positive cells in perivascular areas associated with lymphocytes (top, HERBY104, hypermutator) and more diffusely mixed with tumor cells (bottom, HERBY102, BRAF_V600E). Scale bar = 50 µm.
11
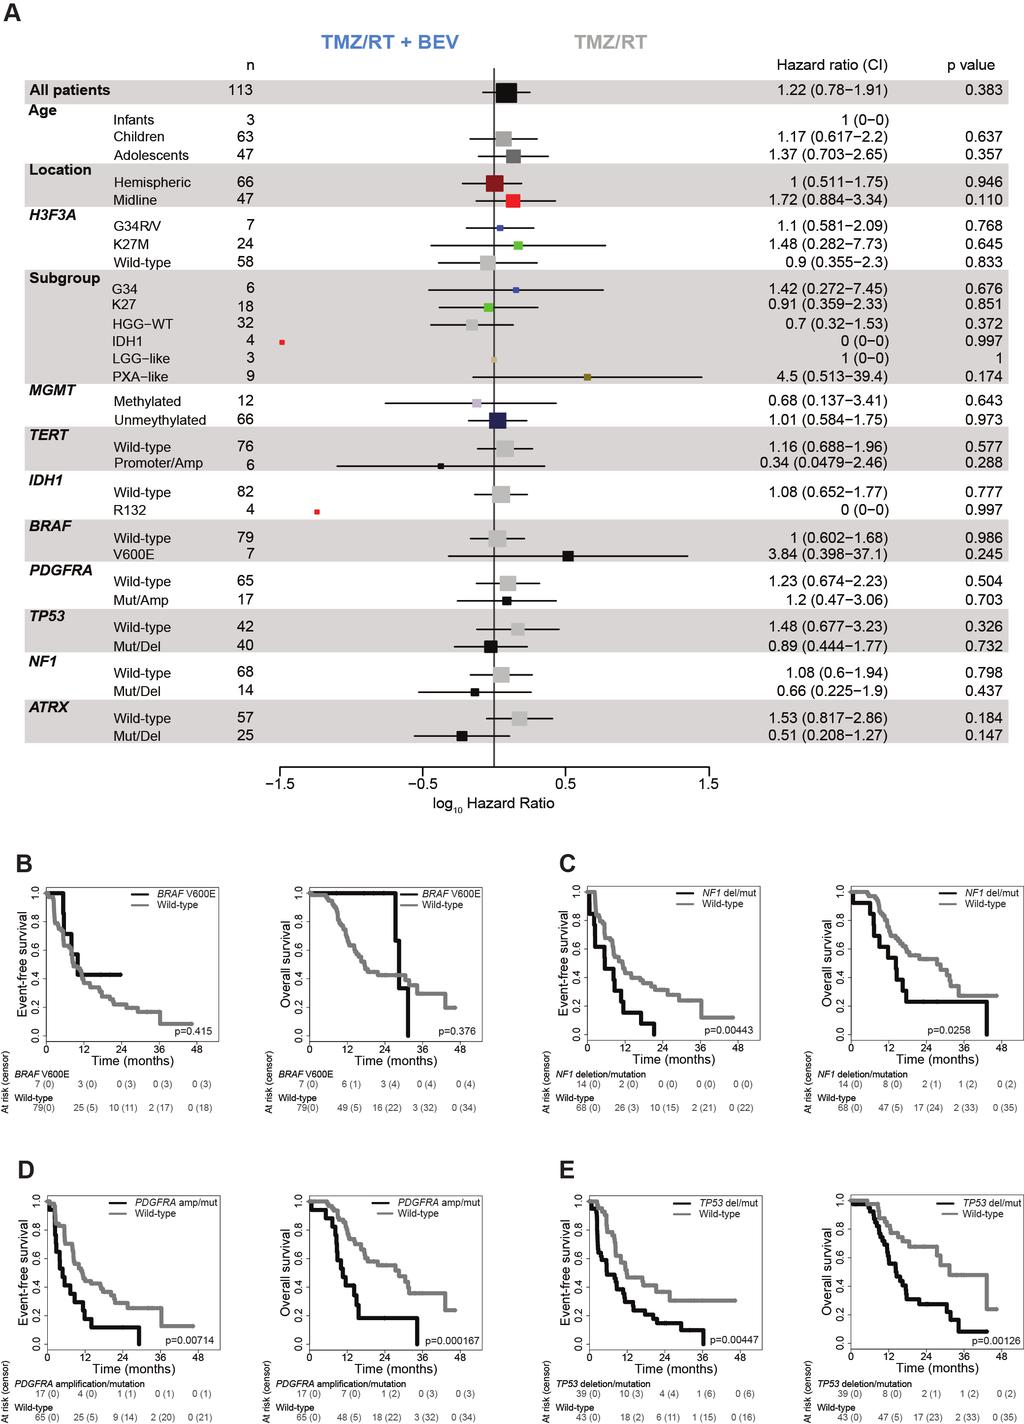
12 Figure S7 (related to Figure 7) Exploratory biomarker analysis. (A) Hazard ratio plot for a univariate Cox regression analysis on a variety of molecular subgroups and alterations in respect of event-free survival. Log 2 hazard ratios less than zero indicate a better response to TMZ/RT plus BEV, ratios greater than zero a better response to TMZ/RT alone. Median (box) and 95% confidence intervals (whiskers) are plotted, with size of box proportion to sample size on an indicated category of tumors. (B-E) Kaplan-Meier plot of event-free and overall survival of cases (y axis) separated by BRAF_V600E (B), NF1 (C), PDGFRA (D) and TP53 (E) status, time given in months (x axis) and p value calculated by the log-rank test.
Nature Genetics: doi: /ng.2995
 Supplementary Figure 1 Kaplan-Meier survival curves of patients with brainstem tumors. (a) Comparison of patients with PPM1D mutation versus wild-type PPM1D. (b) Comparison of patients with PPM1D mutation
SUPPLEMENTARY INFORMATION
 doi:10.1038/nature10866 a b 1 2 3 4 5 6 7 Match No Match 1 2 3 4 5 6 7 Turcan et al. Supplementary Fig.1 Concepts mapping H3K27 targets in EF CBX8 targets in EF H3K27 targets in ES SUZ12 targets in ES
Molecular, Pathological, Radiological, and Immune Profiling of Non-brainstem Pediatric High-Grade Glioma from the HERBY Phase II Randomized Trial
 Article Molecular, Pathological, Radiological, and Immune Profiling of Non-brainstem Pediatric High-Grade Glioma from the HERBY Phase II Randomized Trial Graphical Abstract Authors Alan Mackay, Anna Burford,
Neuropathology Evening Session: Case 3
 Neuropathology Evening Session: Case 3 Christine E. Fuller, MD Cincinnati Children s Hospital Medical Center Disclosure of Relevant Financial Relationships USCAP requires that all faculty in a position
Nature Medicine: doi: /nm.3967
 Supplementary Figure 1. Network clustering. (a) Clustering performance as a function of inflation factor. The grey curve shows the median weighted Silhouette widths for varying inflation factors (f [1.6,
Pr D.Figarella-Branger Service d Anatomie Pathologique et de Neuropathologie, La Timone, Marseille UMR 911 Inserm, Université d Aix-Marseille
 Novelties in the WHO 2016 classification of brain tumours Pr D.Figarella-Branger Service d Anatomie Pathologique et de Neuropathologie, La Timone, Marseille UMR 911 Inserm, Université d Aix-Marseille The
Genomic analysis of childhood High grade glial (HGG) brain tumors
 brain tumors") Genomic analysis of childhood High grade glial (HGG) brain tumors Linda D Cooley Children s Mercy, Kansas City The Children s Mercy Hospital, 2017 Genomic analysis of childhood High grade glial (HGG) brain
Genomic analysis of childhood High grade glial (HGG) brain tumors Linda D Cooley Children s Mercy, Kansas City The Children s Mercy Hospital, 2017 Genomic analysis of childhood High grade glial (HGG) brain
Nature Genetics: doi: /ng Supplementary Figure 1. HOX fusions enhance self-renewal capacity.
 Supplementary Figure 1 HOX fusions enhance self-renewal capacity. Mouse bone marrow was transduced with a retrovirus carrying one of three HOX fusion genes or the empty mcherry reporter construct as described
Gliomas in the 2016 WHO Classification of CNS Tumors
 Gliomas in the 2016 WHO Classification of CNS Tumors Hindi N Al-Hindi, MD, FCAP Consultant Neuropathologist and Head Section of Anatomic Pathology Department of Pathology and Laboratory Medicine King Faisal
Enterprise Interest None
 Enterprise Interest None Heterogeneous chromosomal profiles in a unique series of DIPG in children and young adults European Congress of Pathology Amsterdam, 6 th September 2017 Charlotte Dufour, Romain
Nature Methods: doi: /nmeth.3115
 Supplementary Figure 1 Analysis of DNA methylation in a cancer cohort based on Infinium 450K data. RnBeads was used to rediscover a clinically distinct subgroup of glioblastoma patients characterized by
Clinical significance of genetic analysis in glioblastoma treatment
 Clinical significance of genetic analysis in glioblastoma treatment Department of Neurosurgery, Graduate School of Medical Sciences, Kyushu University, Fukuoka, Japan Koji Yoshimoto Can we get prognostic
2017 Diagnostic Slide Session Case 3
 2017 Diagnostic Slide Session Case 3 Andrew Gao, MD Lili-Naz Hazrati, MD, PhD Cynthia Hawkins, MD, PhD Hospital for Sick Children and University of Toronto, Toronto, Canada Disclosures: none Clinical History
Supplementary Appendix
 Supplementary Appendix This appendix has been provided by the authors to give readers additional information about their work. Supplement to: Bredel M, Scholtens DM, Yadav AK, et al. NFKBIA deletion in
The 16th KJC Bioinformatics Symposium Integrative analysis identifies potential DNA methylation biomarkers for pan-cancer diagnosis and prognosis
 The 16th KJC Bioinformatics Symposium Integrative analysis identifies potential DNA methylation biomarkers for pan-cancer diagnosis and prognosis Tieliu Shi tlshi@bio.ecnu.edu.cn The Center for bioinformatics
Nature Genetics: doi: /ng Supplementary Figure 1. Details of sequencing analysis.
 Supplementary Figure 1 Details of sequencing analysis. (a) Flow chart showing which patients fall into each category and were used for analysis. (b) Graph showing the average and median coverage for all
Expanded View Figures
 EMO Molecular Medicine Proteomic map of squamous cell carcinomas Hanibal ohnenberger et al Expanded View Figures Figure EV1. Technical reproducibility. Pearson s correlation analysis of normalised SILC
Examining large groups of cancer patients to identify ways of predicting which therapies cancers might respond to.
 Stratified Medicine Examining large groups of cancer patients to identify ways of predicting which therapies cancers might respond to. Looking in detail at cancer cells and their genetic make up. Permit
WHO 2016 CNS TUMOR CLASSIFICATION UPDATE. Arie Perry, M.D. Director, Neuropathology
 WHO 2016 CNS TUMOR CLASSIFICATION UPDATE Arie Perry, M.D. Director, Neuropathology DISCLOSURES (Arie Perry, MD) I have no financial relationships to disclose. - and - I will not discuss off label use or
SUPPLEMENTARY FIGURES: Supplementary Figure 1
 SUPPLEMENTARY FIGURES: Supplementary Figure 1 Supplementary Figure 1. Glioblastoma 5hmC quantified by paired BS and oxbs treated DNA hybridized to Infinium DNA methylation arrays. Workflow depicts analytic
BRAF mutation and CDKN2A deletion define a clinically distinct subgroup of childhood secondary high-grade glioma
 BRAF mutation and CDKN2A deletion define a clinically distinct subgroup of childhood secondary high-grade glioma by Matthew R. Mistry A thesis submitted in conformity with the requirements for the degree
Supplementary Materials for
 www.sciencemag.org/content/355/6332/eaai8478/suppl/dc1 Supplementary Materials for Decoupling genetics, lineages, and microenvironment in IDH-mutant gliomas by single-cell RNA-seq Andrew S. Venteicher,
MOLECULAR DIAGNOSTICS OF GLIOMAS
 MOLECULAR DIAGNOSTICS OF GLIOMAS Arie Perry, M.D. Director, Neuropathology Division DIFFUSE GLIOMAS Cell types Astrocytomas (A) Oligodendrogliomas (O) Mixed oligoastrocytoma (MOA) Three WHO grades: II,
The New WHO Classification and the Role of Integrated Molecular Profiling in the Diagnosis of Malignant Gliomas
 The New WHO Classification and the Role of Integrated Molecular Profiling in the Diagnosis of Malignant Gliomas Stefan Prokop, MD Neuropathology Fellow Hospital of the University of Pennsylvania Background
Nature Genetics: doi: /ng Supplementary Figure 1. SEER data for male and female cancer incidence from
 Supplementary Figure 1 SEER data for male and female cancer incidence from 1975 2013. (a,b) Incidence rates of oral cavity and pharynx cancer (a) and leukemia (b) are plotted, grouped by males (blue),
Nature Immunology: doi: /ni Supplementary Figure 1. Characteristics of SEs in T reg and T conv cells.
 Supplementary Figure 1 Characteristics of SEs in T reg and T conv cells. (a) Patterns of indicated transcription factor-binding at SEs and surrounding regions in T reg and T conv cells. Average normalized
Cynthia Hawkins. Division of Pathology, Labatt Brain Tumour Research Centre, The Hospital for Sick Children, University of Toronto, Canada
 Cynthia Hawkins Division of Pathology, Labatt Brain Tumour Research Centre, The Hospital for Sick Children, University of Toronto, Canada To apply a practical diagnostic approach to pediatric high grade
Nature Medicine: doi: /nm.4439
 Figure S1. Overview of the variant calling and verification process. This figure expands on Fig. 1c with details of verified variants identification in 547 additional validation samples. Somatic variants
gliomas. Fetal brain expected who each low-
 Supplementary Figure S1. Grade-specificity aberrant expression of HOXA genes in gliomas. (A) Representative RT-PCR analyses of HOXA gene expression in human astrocytomas. Exemplified glioma samples include
Nature Genetics: doi: /ng Supplementary Figure 1. Somatic coding mutations identified by WES/WGS for 83 ATL cases.
 Supplementary Figure 1 Somatic coding mutations identified by WES/WGS for 83 ATL cases. (a) The percentage of targeted bases covered by at least 2, 10, 20 and 30 sequencing reads (top) and average read
DNA methylation signatures for 2016 WHO classification subtypes of diffuse gliomas
 Paul et al. Clinical Epigenetics (2017) 9:32 DOI 10.1186/s13148-017-0331-9 RESEARCH Open Access DNA methylation signatures for 2016 WHO classification subtypes of diffuse gliomas Yashna Paul, Baisakhi
Corporate Medical Policy
 Corporate Medical Policy Analysis of MGMT Promoter Methylation in Malignant Gliomas File Name: Origination: Last CAP Review: Next CAP Review: Last Review: analysis_of_mgmt_promoter_methylation_in_malignant_gliomas
Whole Genome and Transcriptome Analysis of Anaplastic Meningioma. Patrick Tarpey Cancer Genome Project Wellcome Trust Sanger Institute
 Whole Genome and Transcriptome Analysis of Anaplastic Meningioma Patrick Tarpey Cancer Genome Project Wellcome Trust Sanger Institute Outline Anaplastic meningioma compared to other cancers Whole genomes
S1 Appendix: Figs A G and Table A. b Normal Generalized Fraction 0.075
 Aiello & Alter (216) PLoS One vol. 11 no. 1 e164546 S1 Appendix A-1 S1 Appendix: Figs A G and Table A a Tumor Generalized Fraction b Normal Generalized Fraction.25.5.75.25.5.75 1 53 4 59 2 58 8 57 3 48
SUPPLEMENTARY FIG. S2. Representative counting fields used in quantification of the in vitro neural differentiation of pattern of dnscs.
 Supplementary Data SUPPLEMENTARY FIG. S1. Representative counting fields used in quantification of the in vitro neural differentiation of pattern of anpcs. A panel of lineage-specific markers were used
Genetic alterations of histone lysine methyltransferases and their significance in breast cancer
 Genetic alterations of histone lysine methyltransferases and their significance in breast cancer Supplementary Materials and Methods Phylogenetic tree of the HMT superfamily The phylogeny outlined in the
CNS pathology Third year medical students. Dr Heyam Awad 2018 Lecture 12: CNS tumours 2/3
 CNS pathology Third year medical students Dr Heyam Awad 2018 Lecture 12: CNS tumours 2/3 Pilocytic astrocytoma Relatively benign ( WHO grade 1) Occurs in children and young adults Mostly: in the cerebellum
Supplementary Figure 1: Attenuation of association signals after conditioning for the lead SNP. a) attenuation of association signal at the 9p22.
 attenuation of association signal at the 9p22.") Supplementary Figure 1: Attenuation of association signals after conditioning for the lead SNP. a) attenuation of association signal at the 9p22.32 PCOS locus after conditioning for the lead SNP rs10993397;
Supplementary Figure 1: Attenuation of association signals after conditioning for the lead SNP. a) attenuation of association signal at the 9p22.32 PCOS locus after conditioning for the lead SNP rs10993397;
Genomic Methods in Cancer Epigenetic Dysregulation
 Genomic Methods in Cancer Epigenetic Dysregulation Clara, Lyon 2018 Jacek Majewski, Associate Professor Department of Human Genetics, McGill University Montreal, Canada A few words about my lab Genomics
Precision medicine for gliomas
 Precision medicine for YAZMIN ODIA, MD MS LEAD PHYSICIAN OF MEDICAL NEURO-ONCOLOGY DISCLOSURES Novocure: Advisory Board for Optune in No other financial conflicts of interest Glioma OVERVIEW INFILTRATIVE,
Supplementary Tables. Supplementary Figures
 Supplementary Files for Zehir, Benayed et al. Mutational Landscape of Metastatic Cancer Revealed from Prospective Clinical Sequencing of 10,000 Patients Supplementary Tables Supplementary Table 1: Sample
p.r623c p.p976l p.d2847fs p.t2671 p.d2847fs p.r2922w p.r2370h p.c1201y p.a868v p.s952* RING_C BP PHD Cbp HAT_KAT11
 ARID2 p.r623c KMT2D p.v650fs p.p976l p.r2922w p.l1212r p.d1400h DNA binding RFX DNA binding Zinc finger KMT2C p.a51s p.d372v p.c1103* p.d2847fs p.t2671 p.d2847fs p.r4586h PHD/ RING DHHC/ PHD PHD FYR N
Classification of Diffuse Gliomas: Progress, Pearls and Pitfalls. Rob Macaulay Neuropathologist, MCC October 21, 2017
 Classification of Diffuse Gliomas: Progress, Pearls and Pitfalls Rob Macaulay Neuropathologist, MCC October 21, 2017 Objectives Explain why the designation high grade glioma is preferable to GBM for intraoperative
Transcriptional Profiles from Paired Normal Samples Offer Complementary Information on Cancer Patient Survival -- Evidence from TCGA Pan-Cancer Data
 Transcriptional Profiles from Paired Normal Samples Offer Complementary Information on Cancer Patient Survival -- Evidence from TCGA Pan-Cancer Data Supplementary Materials Xiu Huang, David Stern, and
iplex genotyping IDH1 and IDH2 assays utilized the following primer sets (forward and reverse primers along with extension primers).
.") Supplementary Materials Supplementary Methods iplex genotyping IDH1 and IDH2 assays utilized the following primer sets (forward and reverse primers along with extension primers). IDH1 R132H and R132L Forward:
Supplementary Materials Supplementary Methods iplex genotyping IDH1 and IDH2 assays utilized the following primer sets (forward and reverse primers along with extension primers). IDH1 R132H and R132L Forward:
A clinical perspective on neuropathology and molecular genetics in brain tumors
 A clinical perspective on neuropathology and molecular genetics in brain tumors M.J. van den Bent Erasmus MC Cancer Institute Rotterdam, the Netherlands Disclosures Member speakersbureau: MSD Consultancy:
Frequency(%) KRAS G12 KRAS G13 KRAS A146 KRAS Q61 KRAS K117N PIK3CA H1047 PIK3CA E545 PIK3CA E542K PIK3CA Q546. EGFR exon19 NFS-indel EGFR L858R
 KRAS G12 KRAS G13 KRAS A146 KRAS Q61 KRAS K117N PIK3CA H1047 PIK3CA E545 PIK3CA E542K PIK3CA Q546. EGFR exon19 NFS-indel EGFR L858R") Frequency(%) 1 a b ALK FS-indel ALK R1Q HRAS Q61R HRAS G13R IDH R17K IDH R14Q MET exon14 SS-indel KIT D8Y KIT L76P KIT exon11 NFS-indel SMAD4 R361 IDH1 R13 CTNNB1 S37 CTNNB1 S4 AKT1 E17K ERBB D769H ERBB
Frequency(%) 1 a b ALK FS-indel ALK R1Q HRAS Q61R HRAS G13R IDH R17K IDH R14Q MET exon14 SS-indel KIT D8Y KIT L76P KIT exon11 NFS-indel SMAD4 R361 IDH1 R13 CTNNB1 S37 CTNNB1 S4 AKT1 E17K ERBB D769H ERBB
SYSTEMIC MANAGEMENT OF PEDIATRIC PRIMARY BRAIN TUMORS
 SYSTEMIC MANAGEMENT OF PEDIATRIC PRIMARY BRAIN TUMORS María E. Echevarría, MD Assistant Professor University of Puerto Rico Medical Sciences Campus DISCLOSURES No disclosures INTRODUCTION Pediatric CNS
Mosaic loss of chromosome Y in peripheral blood is associated with shorter survival and higher risk of cancer
 Supplementary Information Mosaic loss of chromosome Y in peripheral blood is associated with shorter survival and higher risk of cancer Lars A. Forsberg, Chiara Rasi, Niklas Malmqvist, Hanna Davies, Saichand
Nature Getetics: doi: /ng.3471
 Supplementary Figure 1 Summary of exome sequencing data. ( a ) Exome tumor normal sample sizes for bladder cancer (BLCA), breast cancer (BRCA), carcinoid (CARC), chronic lymphocytic leukemia (CLLX), colorectal
Nature Immunology: doi: /ni Supplementary Figure 1. RNA-Seq analysis of CD8 + TILs and N-TILs.
 Supplementary Figure 1 RNA-Seq analysis of CD8 + TILs and N-TILs. (a) Schematic representation of the tumor and cell types used for the study. HNSCC, head and neck squamous cell cancer; NSCLC, non-small
fl/+ KRas;Atg5 fl/+ KRas;Atg5 fl/fl KRas;Atg5 fl/fl KRas;Atg5 Supplementary Figure 1. Gene set enrichment analyses. (a) (b)
 (b)") KRas;At KRas;At KRas;At KRas;At a b Supplementary Figure 1. Gene set enrichment analyses. (a) GO gene sets (MSigDB v3. c5) enriched in KRas;Atg5 fl/+ as compared to KRas;Atg5 fl/fl tumors using gene set
KRas;At KRas;At KRas;At KRas;At a b Supplementary Figure 1. Gene set enrichment analyses. (a) GO gene sets (MSigDB v3. c5) enriched in KRas;Atg5 fl/+ as compared to KRas;Atg5 fl/fl tumors using gene set
Pharmacologic inhibition of histone demethylation as a therapy for pediatric brainstem glioma
 Supplementary information for: Pharmacologic inhibition of histone demethylation as a therapy for pediatric brainstem glioma Rintaro Hashizume 1, Noemi Andor 2, Yuichiro Ihara 2, Robin Lerner 2, Haiyun
underlying metastasis and recurrence in HNSCC, we analyzed two groups of patients. The
 Supplementary Figures Figure S1. Patient cohorts and study design. To define and interrogate the genetic alterations underlying metastasis and recurrence in HNSCC, we analyzed two groups of patients. The
Nature Structural & Molecular Biology: doi: /nsmb.2419
 Supplementary Figure 1 Mapped sequence reads and nucleosome occupancies. (a) Distribution of sequencing reads on the mouse reference genome for chromosome 14 as an example. The number of reads in a 1 Mb
Supplementary Figure 1. IDH1 and IDH2 mutation site sequences on WHO grade III
 Supplementary Materials: Supplementary Figure 1. IDH1 and IDH2 mutation site sequences on WHO grade III patient samples. Genomic DNA samples extracted from punch biopsies from either FFPE or frozen tumor
What yield in the last decade about Molecular Diagnostics in Neuro
 What yield in the last decade about Molecular Diagnostics in Neuro Oncology? Raphael Salles S.Medeiros Neuropathologist at HC FMUSP Clinical Research Project Manager at Oncology department at Hospital
Breeding scheme, transgenes, histological analysis and site distribution of SB-mutagenized osteosarcoma.
 Supplementary Figure 1 Breeding scheme, transgenes, histological analysis and site distribution of SB-mutagenized osteosarcoma. (a) Breeding scheme. R26-LSL-SB11 homozygous mice were bred to Trp53 LSL-R270H/+
Corporate Medical Policy
 Corporate Medical Policy BRAF Gene Variant Testing to Select Melanoma or Glioma Patients File Name: Origination: Last CAP Review: Next CAP Review: Last Review: braf_gene_variant_testing_to_select_melanoma_or_glioma_patients_for_targeted_
Supplemental Figure legends
 Supplemental Figure legends Supplemental Figure S1 Frequently mutated genes. Frequently mutated genes (mutated in at least four patients) with information about mutation frequency, RNA-expression and copy-number.
Integration of Cancer Genome into GECCO- Genetics and Epidemiology of Colorectal Cancer Consortium
 Integration of Cancer Genome into GECCO- Genetics and Epidemiology of Colorectal Cancer Consortium Ulrike Peters Fred Hutchinson Cancer Research Center University of Washington U01-CA137088-05, PI: Peters
Cancer Informatics Lecture
 Cancer Informatics Lecture Mayo-UIUC Computational Genomics Course June 22, 2018 Krishna Rani Kalari Ph.D. Associate Professor 2017 MFMER 3702274-1 Outline The Cancer Genome Atlas (TCGA) Genomic Data Commons
Biomarker development in the era of precision medicine. Bei Li, Interdisciplinary Technical Journal Club
 Biomarker development in the era of precision medicine Bei Li, 23.08.2016 Interdisciplinary Technical Journal Club The top ten highest-grossing drugs in the United States help between 1 in 25 and 1 in
Journal: Nature Methods
 Journal: Nature Methods Article Title: Network-based stratification of tumor mutations Corresponding Author: Trey Ideker Supplementary Item Supplementary Figure 1 Supplementary Figure 2 Supplementary Figure
Expert-guided Visual Exploration (EVE) for patient stratification. Hamid Bolouri, Lue-Ping Zhao, Eric C. Holland
 for patient stratification. Hamid Bolouri, Lue-Ping Zhao, Eric C. Holland") Expert-guided Visual Exploration (EVE) for patient stratification Hamid Bolouri, Lue-Ping Zhao, Eric C. Holland Oncoscape.sttrcancer.org Paul Lisa Ken Jenny Desert Eric The challenge Given - patient clinical
Expert-guided Visual Exploration (EVE) for patient stratification Hamid Bolouri, Lue-Ping Zhao, Eric C. Holland Oncoscape.sttrcancer.org Paul Lisa Ken Jenny Desert Eric The challenge Given - patient clinical
SUPPLEMENTARY APPENDIX
 SUPPLEMENTARY APPENDIX 1) Supplemental Figure 1. Histopathologic Characteristics of the Tumors in the Discovery Cohort 2) Supplemental Figure 2. Incorporation of Normal Epidermal Melanocytic Signature
Detection of IDH1 mutation in human gliomas: comparison of immunohistochemistry and sequencing
 DOI.7/s4--3-7 ORIGINAL ARTICLE Detection of IDH mutation in human gliomas: comparison of immunohistochemistry and sequencing Shingo Takano Wei Tian Masahide Matsuda Tetsuya Yamamoto Eiichi Ishikawa Mika
Case Presentation: USCAP Jason T. Huse, MD, PhD Assistant Member Department of Pathology Memorial Sloan Kettering Cancer Center
 Case Presentation: USCAP 2016 Jason T. Huse, MD, PhD Assistant Member Department of Pathology Memorial Sloan Kettering Cancer Center Case History 53 year old female with a long standing history of migraines
SSM signature genes are highly expressed in residual scar tissues after preoperative radiotherapy of rectal cancer.
 Supplementary Figure 1 SSM signature genes are highly expressed in residual scar tissues after preoperative radiotherapy of rectal cancer. Scatter plots comparing expression profiles of matched pretreatment
SUPPLEMENTARY INFORMATION
 DOI: 1.138/ncb3355 a S1A8 + cells/ total.1.8.6.4.2 b S1A8/?-Actin c % T-cell proliferation 3 25 2 15 1 5 T cells Supplementary Figure 1 Inter-tumoral heterogeneity of MDSC accumulation in mammary tumor
Phase II Pediatric Study With Dabrafenib in Combination With Trametinib in Patients With HGG and LGG
 Find Studies About Studies Submit Studies Resources About Site Phase II Pediatric Study With Dabrafenib in Combination With Trametinib in Patients With HGG and LGG The safety and scientific validity of
The Cancer Genome Atlas Research Network* abstract
 The new england journal of medicine established in 1812 June 25, 2015 vol. 372 no. 26 Comprehensive, Integrative Genomic Analysis of Diffuse Lower-Grade Gliomas The Cancer Genome Atlas Research Network*
Radioterapia no Tratamento dos Gliomas de Baixo Grau
 Radioterapia no Tratamento dos Gliomas de Baixo Grau Dr. Luis Souhami University Montreal - Canada Low Grade Gliomas Relatively rare Heterogeneous, slow growing tumors WHO Classification Grade I Pilocytic
CDH1 truncating alterations were detected in all six plasmacytoid-variant bladder tumors analyzed by whole-exome sequencing.
 Supplementary Figure 1 CDH1 truncating alterations were detected in all six plasmacytoid-variant bladder tumors analyzed by whole-exome sequencing. Whole-exome sequencing of six plasmacytoid-variant bladder
Douglas Jolly Executive VP R&D Tocagen Inc.
 REPLICATING RETROVIRUSES FOR MANIPULATION OF THE TUMOR IMMUNE ECOSYSTEM: PRECLINICAL AND CLINICAL OUTCOMES. Douglas Jolly Executive VP R&D Tocagen Inc. PEGS 2018 IT Track Boston May 1 2018 Outline Phase
Supplementary Figure 1
 Supplementary Figure 1 Supplementary Fig. 1: Quality assessment of formalin-fixed paraffin-embedded (FFPE)-derived DNA and nuclei. (a) Multiplex PCR analysis of unrepaired and repaired bulk FFPE gdna from
Results and Discussion of Receptor Tyrosine Kinase. Activation
 Results and Discussion of Receptor Tyrosine Kinase Activation To demonstrate the contribution which RCytoscape s molecular maps can make to biological understanding via exploratory data analysis, we here
H3F3A K27M Mutation in Pediatric CNS Tumors. A Marker for Diffuse High-Grade Astrocytomas
 Anatomic Pathology / H3.3 Mutations in Pediatric Diffuse High-Grade Astrocytomas H3F3A K27M Mutation in Pediatric CNS Tumors A Marker for Diffuse High-Grade Astrocytomas Gerrit H. Gielen, MD, 1 Marco Gessi,
Expanded View Figures
 Molecular Systems iology Tumor CNs reflect metabolic selection Nicholas Graham et al Expanded View Figures Human primary tumors CN CN characterization by unsupervised PC Human Signature Human Signature
Relationship between genomic features and distributions of RS1 and RS3 rearrangements in breast cancer genomes.
 Supplementary Figure 1 Relationship between genomic features and distributions of RS1 and RS3 rearrangements in breast cancer genomes. (a,b) Values of coefficients associated with genomic features, separately
WHO 2016 CNS Tumor Classification Update. DISCLOSURES (Arie Perry, MD) PATTERN RECOGNITION. Arie Perry, M.D. Director, Neuropathology
 PATTERN RECOGNITION. Arie Perry, M.D. Director, Neuropathology") WHO 2016 CNS Tumor Classification Update Arie Perry, M.D. Director, Neuropathology DISCLOSURES (Arie Perry, MD) I have no financial relationships to disclose. - and - I will not discuss off label use or
WHO 2016 CNS Tumor Classification Update Arie Perry, M.D. Director, Neuropathology DISCLOSURES (Arie Perry, MD) I have no financial relationships to disclose. - and - I will not discuss off label use or
Supplemental Information. Integrated Genomic Analysis of the Ubiquitin. Pathway across Cancer Types
 Cell Reports, Volume 23 Supplemental Information Integrated Genomic Analysis of the Ubiquitin Pathway across Zhongqi Ge, Jake S. Leighton, Yumeng Wang, Xinxin Peng, Zhongyuan Chen, Hu Chen, Yutong Sun,
R1601 Essential Immunohistochemical and Molecular Markers for General CNS Glial Tumors
 October 22, 2018 12:00-1:00 PM Background The World Health Organization Classification of tumors of the Central Nervous System has recently been revised. There is now greater emphasis on molecular phenotype
Supplementary Figure 1. ALVAC-protein vaccines and macaque immunization. (A) Maximum likelihood
 Maximum likelihood") Supplementary Figure 1. ALVAC-protein vaccines and macaque immunization. (A) Maximum likelihood tree illustrating CRF01_AE gp120 protein sequence relationships between 107 Envs sampled in the RV144 trial
Supplementary Figure 1. ALVAC-protein vaccines and macaque immunization. (A) Maximum likelihood tree illustrating CRF01_AE gp120 protein sequence relationships between 107 Envs sampled in the RV144 trial
Disclaimers. Molecular pathology of brain tumors. Some aspects only. Some details are inevitably personal opinions
 Molecular pathology of brain tumors Disclaimers Some aspects only H.K. Ng The Chinese University of Hong Kong Some details are inevitably personal opinions Free ppt : http://www.acp.cuhk.edu.hk/hkng Why
Supplementary Figure S1 Expression of mir-181b in EOC (A) Kaplan-Meier
 Kaplan-Meier") Supplementary Figure S1 Expression of mir-181b in EOC (A) Kaplan-Meier curves for progression-free survival (PFS) and overall survival (OS) in a cohort of patients (N=52) with stage III primary ovarian
Supplementary Figure S1 Expression of mir-181b in EOC (A) Kaplan-Meier curves for progression-free survival (PFS) and overall survival (OS) in a cohort of patients (N=52) with stage III primary ovarian
Predicting cancer outcomes from histology and genomics using convolutional networks
 Predicting cancer outcomes from histology and genomics using convolutional networks Pooya Mobadersany a, Safoora Yousefi a, Mohamed Amgad a, David A. Gutman b, Jill S. Barnholtz-Sloan c, José E. Velázquez
성균관대학교삼성창원병원신경외과학교실신경종양학 김영준. KNS-MT-03 (April 15, 2015)
") 성균관대학교삼성창원병원신경외과학교실신경종양학 김영준 INTRODUCTIONS Low grade gliomas (LGG) - heterogeneous group of tumors with astrocytic, oligodendroglial, ependymal, or mixed cellular histology - In adults diffuse, infiltrating
성균관대학교삼성창원병원신경외과학교실신경종양학 김영준 INTRODUCTIONS Low grade gliomas (LGG) - heterogeneous group of tumors with astrocytic, oligodendroglial, ependymal, or mixed cellular histology - In adults diffuse, infiltrating
Exploring TCGA Pan-Cancer Data at the UCSC Cancer Genomics Browser
 Exploring TCGA Pan-Cancer Data at the UCSC Cancer Genomics Browser Melissa S. Cline 1*, Brian Craft 1, Teresa Swatloski 1, Mary Goldman 1, Singer Ma 1, David Haussler 1, Jingchun Zhu 1 1 Center for Biomolecular
Supplemental Figure 1. Intracranial transduction of a modified ptomo lentiviral vector in the mouse
 Supplemental figure legends Supplemental Figure 1. Intracranial transduction of a modified ptomo lentiviral vector in the mouse hippocampus targets GFAP-positive but not NeuN-positive cells. (A) Stereotaxic
Review: Diagnostic, prognostic and predictive relevance of molecular markers in gliomas
 Review: Diagnostic, prognostic and predictive relevance of molecular markers in gliomas Sebastian Brandner MD FRCPath 1 and Andreas von Deimling 2 MD 1) Division of Neuropathology, The National Hospital
Summary... 2 TRANSLATIONAL RESEARCH Tumour gene expression used to direct clinical decision-making for patients with advanced cancers...
 ESMO 2016 Congress 7-11 October, 2016 Copenhagen, Denmark Table of Contents Summary... 2 TRANSLATIONAL RESEARCH... 3 Tumour gene expression used to direct clinical decision-making for patients with advanced
PBZ FT01_PBZ FT01_TZ FT01_NZ. interface zone (I) tumor zone (TZ) necrotic zone (NZ)
 tumor zone (TZ) necrotic zone (NZ)") Oncotarget, Supplementary Materials www.impactjournals.com/oncotarget/ SUPPLEMENTRY FLES ndividuals factor map (P) FT_ FT_ FT_ Dim (.%) Dim (.%) >% peripheral brain zone () around % interface zone () FT
Oncotarget, Supplementary Materials www.impactjournals.com/oncotarget/ SUPPLEMENTRY FLES ndividuals factor map (P) FT_ FT_ FT_ Dim (.%) Dim (.%) >% peripheral brain zone () around % interface zone () FT
General: Brain tumors are lesions that have mass effect distorting the normal tissue and often result in increased intracranial pressure.
 1 Lecture Objectives Know the histologic features of the most common tumors of the CNS. Know the differences in behavior of the different tumor types. Be aware of the treatment modalities in the various
New Imaging Concepts in Central Nervous System Neoplasms
 New Imaging Concepts in Central Nervous System Neoplasms Maarten Lequin Department of Pediatric Radiology Wilhelmina Children s Hospital/University Medical Center Utrecht New Imaging Concepts in Central
About OMICS Group Conferences
 About OMICS Group OMICS Group International is an amalgamation of Open Access publications and worldwide international science conferences and events. Established in the year 2007 with the sole aim of
Nature Genetics: doi: /ng Supplementary Figure 1. Depths and coverages in whole-exome and targeted deep sequencing data.
 Supplementary Figure 1 Depths and coverages in whole-exome and targeted deep sequencing data. Depth (top) and coverage (bottom) of whole-exome sequencing for 38 independent JPN cases (mean depth = 130)
Supplementary Appendix
 Supplementary Appendix This appendix has been provided by the authors to give readers additional information about their work. Supplement to: Patel JP, Gönen M, Figueroa ME, et al. Prognostic relevance
Applications of molecular neuro-oncology - a review of diffuse glioma integrated diagnosis and emerging molecular entities
 Wood et al. Diagnostic Pathology (2019) 14:29 https://doi.org/10.1186/s13000-019-0802-8 REVIEW Applications of molecular neuro-oncology - a review of diffuse glioma integrated diagnosis and emerging molecular
Advances in Brain Tumor Research: Leveraging BIG data for BIG discoveries
 Advances in Brain Tumor Research: Leveraging BIG data for BIG discoveries Jill Barnholtz-Sloan, PhD Associate Professor & Associate Director for Bioinformatics and Translational Informatics jsb42@case.edu