Supplementary Figure 1
|
|
|
- Morris Preston
- 5 years ago
- Views:
Transcription
1 Supplementary Figure 1 ZV 50 nm Relative to Protein Levels () C Relative to Protein Levels () Treatment Time (6 h) ZV Concentration (25 µm) ZV Concentration (25 µm)
2 Supplementary Figure 2 ZV 50 nm Treatment Time (6 h) Relative to Protein Levels () C Relative to Protein Levels () ZV Concentration (25 µm) ZV Concentration (25 µm)
3 Supplementary Figure 3 XP h (25 µm) h C XP-1 XP (25 µm) h / (25 µm)

 Differentiated 0 1.38 1.03 1.")
")
4 Supplementary Figure 4 Non-differentiated 3T3-L μm Relative density Relative density (6 h) Differentiated 3T3-L μm Relative density Relative density (6 h)
5 C Differentiated SGS μm Relative density Relative density (6 h) D Differentiated 3T3-L1 Relative mrn Levels Concentration (μm)

6 Supplementary Figure 5 LC3- I LC3-II μm Relative density ctin 12.5 µm C 2,000 X 4,000 X 10,000 X
7 Supplementary Figure 6 No Tx 100 nm 25 µm / 7 Relative density Relative density ctin 1.5 Relative mrn levels (5) No Tx / C nm 25 µm Relative mrn levels (7) No Tx / 100 nm 25 µm
8 Supplementary Figure 1. Differential activation of the UPR by HIV PIs in nondifferentiated 3T3-L1 cells. Non-differentiated 3T3-L1 cells were treated for 6 hwith 25 µm of 9 HIV PIs. mprenavir (), Indinavir (), tazanavir (ZV), Ritonavir (), Lopinavir (), Nelfinavir (), Saquinavir (), Darunavir (DV), Tipranavir (). ) Representative immunoblots against, and from nuclear extracts are shown. -C) The density of immunoblots was determined by Image J. Relative protein levels of and were normalized using as loading control. Values are mean ± SE of three independent experiments. Statistical significance relative to vehicle control, p < 0.05 and p<0.01. Supplementary Figure 2. Differential activation of the UPR by HIV PIs in differentiated 3T3-L1 cells. Non-differentiated 3T3-L1 cells were treated for 6 h with 25 µm of 9 HIV PIs. mprenavir (), Indinavir (), tazanavir (ZV), Ritonavir (), Lopinavir (), Nelfinavir (), Saquinavir (), Darunavir (DV), Tipranavir (). ) Representative immunoblots against, and from nuclear extracts. -C) The density of immunoblots was determined by Image J. Relative protein levels of and were normalized using as loading control. Values are mean ± SE of three independent experiments. Statistical significance relative to vehicle control, p < 0.05 and p<0.01. Supplementary Figure 3. Time-dependent activation of the UPR in mouse adipocytes by HIV PIs. Representative immunoblots of five separate experiments against,, XP-1, and from the nuclear extracts of differentiated mouse 3T3-L1 cells treated with 25 µm of HIV PIs for 0-24 h. was used as loading control. ) Ritonavir (); ) Lopinavir (); C) Lopinavir/Ritonavir (/). The density of immunoblots was determined by Image J. Relative protein levels of and were normalized using as loading control. 1
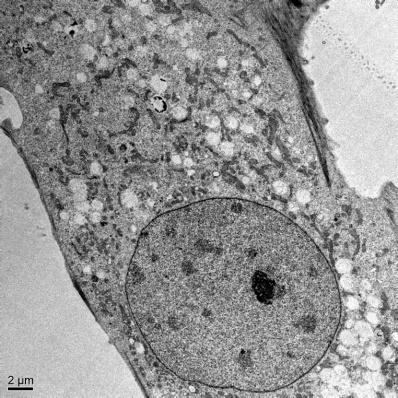
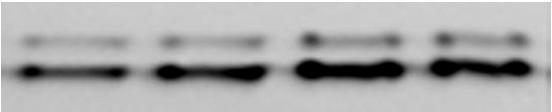
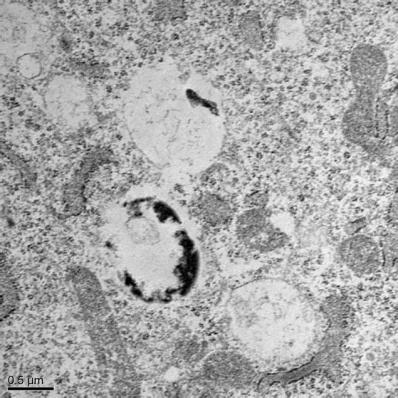
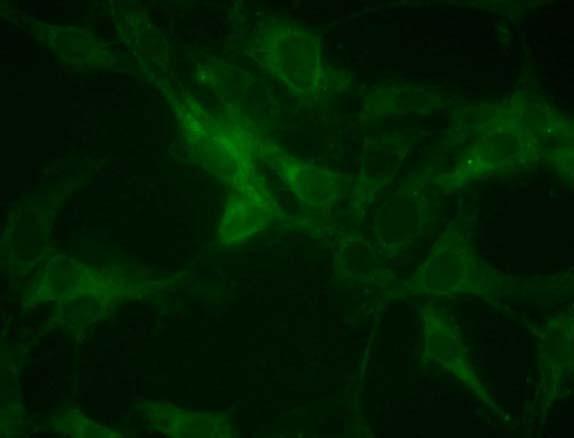
9 Supplementary Figure 4. ctivation of the UPR by. ) Non-differentiated 3T3L1 cells, ) differentiated 3T3-L1 cells, and C) differentiated human SGS were treated with increasing concentrations of for 6 h. Representative immunoblots against and from nuclear extracts are shown. The density of immunoblots was determined by Image J. Relative protein levels of and were normalized using as a loading control. D) Differentiated 3T3-L1 cells were treated with increasing concentrations of for 4 h and total RN was isolated. The mrn levels of and were quantified by real-time RT-PCR and normalized using internal control β-ctin. Values are mean ± SE of three independent experiments. Statistical significance relative to vehicle control, p < Supplementary Figure 5. induces an increase of autophagosomes in 3T3-L1 cells. ) Representative immunoblots of LC3 from total cell lysates of differentiated 3T3-L1 cells treated with increasing concentrations of for 24 h are shown. β-actin was used as loading control. ) Representative fluorescent images of non-differentiated 3T3-L1 cells stably expressing GFP-tagged LC3 treated with 12.5 µm or vehicle control () for 24 h. C) Representative EM images of non-differentiated 3T3-L1s treated with individual 12.5 µm for 24 h. Cells were processed for transmission electron microscopy as described in Methods. Representative images at 2,000, 4,000 and 10,000 are shown. Supplemental Figure 6. Effect of HIV PIs on 5 and 7 expression in differentiated mouse adipocytes. ) Representative immunoblots against 7 and 5 from total cellular extracts of mouse differentiated 3T3-L1 cells treated with vehicle control (), 100 nm, or (25 µm), (25 µm), or / (4:1, =20 µm, =5µM), for 24 h are shown. The density of immunoblot was determined by Image J. Relative protein levels of 5 and 7 were normalized using β-ctin as a loading control. -C) Total cellular RN was isolated from differentiated 3T3-L1 cells treated as in 2
10 () for 24 h. The mrn levels of ) 5 and C) 7 were quantified by real-time RT- PCR and normalized using internal control β-ctin. Values are mean ± SE of three independent experiments. Statistical significance relative to vehicle control, p <
(a) Significant biological processes (upper panel) and disease biomarkers (lower panel)
 Significant biological processes (upper panel) and disease biomarkers (lower panel)") Supplementary Figure 1. Functional enrichment analyses of secretomic proteins. (a) Significant biological processes (upper panel) and disease biomarkers (lower panel) 2 involved by hrab37-mediated secretory
Supplementary Figure 1. Functional enrichment analyses of secretomic proteins. (a) Significant biological processes (upper panel) and disease biomarkers (lower panel) 2 involved by hrab37-mediated secretory
Supplementary Figure 1
 Supplementary Figure 1 14 12 SEM4C PLXN2 8 SEM4C C 3 Cancer Cell Non Cancer Cell Expression 1 8 6 6 4 log2 ratio Expression 2 1 4 2 2 p value.1 D Supplementary Figure 1. Expression of Sema4C and Plexin2
Tumor suppressor Spred2 interaction with LC3 promotes autophagosome maturation and induces autophagy-dependent cell death
 www.impactjournals.com/oncotarget/ Oncotarget, Supplementary Materials 2016 Tumor suppressor Spred2 interaction with LC3 promotes autophagosome maturation and induces autophagy-dependent cell death Supplementary
LPS LPS P6 - + Supplementary Fig. 1.
 P6 LPS - - - + + + - LPS + + - - P6 + Supplementary Fig. 1. Pharmacological inhibition of the JAK/STAT blocks LPS-induced HMGB1 nuclear translocation. RAW 267.4 cells were stimulated with LPS in the absence
Plasma exposure levels from individual mice 4 hours post IP administration at the
 Supplemental Figure Legends Figure S1. Plasma exposure levels of MKC-3946 in mice. Plasma exposure levels from individual mice 4 hours post IP administration at the indicated dose mg/kg. Data represent
Supplementary Materials for
 www.sciencesignaling.org/cgi/content/full/9/439/ra78/dc1 Supplementary Materials for Small heterodimer partner mediates liver X receptor (LXR) dependent suppression of inflammatory signaling by promoting
SUPPLEMENTARY FIGURES AND TABLES
 SUPPLEMENTARY FIGURES AND TABLES Supplementary Figure S1: CaSR expression in neuroblastoma models. A. Proteins were isolated from three neuroblastoma cell lines and from the liver metastasis of a MYCN-non
Supplementary Materials and Methods
 Supplementary Materials and Methods Immunoblotting Immunoblot analysis was performed as described previously (1). Due to high-molecular weight of MUC4 (~ 950 kda) and MUC1 (~ 250 kda) proteins, electrophoresis
SUPPLEMENTARY INFORMATION
 Supplementary Figures Supplementary Figure S1. Binding of full-length OGT and deletion mutants to PIP strips (Echelon Biosciences). Supplementary Figure S2. Binding of the OGT (919-1036) fragments with
T H E J O U R N A L O F C E L L B I O L O G Y
 Supplemental material Díaz et al., http://www.jcb.org/cgi/content/full/jcb.201209151/dc1 T H E J O U R N A L O F C E L L B I O L O G Y Figure S1. Hypoxia induces invadopodia formation in different epithelial
Supplementary Figures for
 mirns regulate s Supplementary igures for MicroRNs Reprogram Normal ibroblasts into Cancer ssociated ibroblasts in Ovarian Cancer nirban K. Mitra, Marion Zillhardt, Youjia Hua, Payal iwari, ndrea E. Murmann,
Supplementary Figure 1. Characterization of human carotid plaques. (a) Flash-frozen human plaques were separated into vulnerable (V) and stable (S),
 Flash-frozen human plaques were separated into vulnerable (V) and stable (S),") Supplementary Figure 1. Characterization of human carotid plaques. (a) Flash-frozen human plaques were separated into vulnerable (V) and stable (S), regions which were then quantified for mean fluorescence
Supplementary Figure 1. Characterization of human carotid plaques. (a) Flash-frozen human plaques were separated into vulnerable (V) and stable (S), regions which were then quantified for mean fluorescence
Integrin CD11b negatively regulates TLR-triggered inflammatory responses by. activating Syk and promoting MyD88 and TRIF degradation via cbl-b
 Integrin CD11b negatively regulates TLR-triggered inflammatory responses by activating Syk and promoting MyD88 and TRIF degradation via cbl-b Chaofeng Han, Jing Jin, Sheng Xu, Haibo Liu, Nan Li, and Xuetao
(A) RT-PCR for components of the Shh/Gli pathway in normal fetus cell (MRC-5) and a
 RT-PCR for components of the Shh/Gli pathway in normal fetus cell (MRC-5) and a") Supplementary figure legends Supplementary Figure 1. Expression of Shh signaling components in a panel of gastric cancer. (A) RT-PCR for components of the Shh/Gli pathway in normal fetus cell (MRC-5) and
Supplementary figure legends Supplementary Figure 1. Expression of Shh signaling components in a panel of gastric cancer. (A) RT-PCR for components of the Shh/Gli pathway in normal fetus cell (MRC-5) and
SUPPLEMENTARY MATERIAL
 SUPPLEMENTARY MATERIAL IL-1 signaling modulates activation of STAT transcription factors to antagonize retinoic acid signaling and control the T H 17 cell it reg cell balance Rajatava Basu 1,5, Sarah K.
Supplementary Figure 1. Blood glucose and insulin levels in mice during 4-day infusion.
 Supplementary Figure 1. Blood glucose and insulin levels in mice during 4-day infusion. (A-B) WT and HT mice infused with saline or glucose had overlapping achieved blood glucose and insulin levels, necessitating
Suppl. Figure 1. T 3 induces autophagic flux in hepatic cells. (A) RFP-GFP-LC3 transfected HepG2/TRα cells were visualized and cells were quantified
 RFP-GFP-LC3 transfected HepG2/TRα cells were visualized and cells were quantified") Suppl. Figure 1. T 3 induces autophagic flux in hepatic cells. (A) RFP-GFP-LC3 transfected HepG2/TRα cells were visualized and cells were quantified for RFP-LC3 puncta (red dots) representing both autolysosomes
Suppl. Figure 1. T 3 induces autophagic flux in hepatic cells. (A) RFP-GFP-LC3 transfected HepG2/TRα cells were visualized and cells were quantified for RFP-LC3 puncta (red dots) representing both autolysosomes
Supplemental Figures:
 Supplemental Figures: Figure 1: Intracellular distribution of VWF by electron microscopy in human endothelial cells. a) Immunogold labeling of LC3 demonstrating an LC3-positive autophagosome (white arrow)
T H E J O U R N A L O F C E L L B I O L O G Y
 Supplemental material Chairoungdua et al., http://www.jcb.org/cgi/content/full/jcb.201002049/dc1 T H E J O U R N A L O F C E L L B I O L O G Y Figure S1. Expression of CD9 and CD82 inhibits Wnt/ -catenin
supplementary information
 DOI: 10.1038/ncb1875 Figure S1 (a) The 79 surgical specimens from NSCLC patients were analysed by immunohistochemistry with an anti-p53 antibody and control serum (data not shown). The normal bronchi served
Samali A Figure S1.
 Deegan S, Saveljeva S, Logue SE, Pakos-Zebrucka K, Gupta S, Vandenabeele P, Bertrand MJ,Samali A. (2014) Deficiency in the mitochondrial apoptotic pathway reveals the toxic potential of autophagy under
High Resolution Mass Spectrometry for Qualitative and Quantitative Toxicology Analysis
 High Resolution Mass Spectrometry for Qualitative and Quantitative Toxicology Analysis William Clarke, PhD, MBA, DABCC Associate Professor, Pathology Johns Hopkins University School of Medicine Disclosures
0.14 ( 0.053%) UNAIDS 10% (94) ( ) (73-94/6 ) 8,920
 UNAIDS 10% (94) ( ) (73-94/6 ) 8,920") 0.14 UNAIDS 0.053% 2 250 60 10% 94 73 20 73-94/6 8,920 12 43 Public Health Service Task Force Recommendations 5-10% for Use of Antiretroviral Drugs in 10-20% Pregnant HIV-1-Infected Women for Maternal
0.14 UNAIDS 0.053% 2 250 60 10% 94 73 20 73-94/6 8,920 12 43 Public Health Service Task Force Recommendations 5-10% for Use of Antiretroviral Drugs in 10-20% Pregnant HIV-1-Infected Women for Maternal
Supplementary Figures for TSC1 controls macrophage polarization to prevent inflammatory disorder by Linnan Zhu et al
 Supplementary Figures for TSC1 controls macrophage polarization to prevent inflammatory disorder by Linnan Zhu et al Suppl. Fig. 1 Tissue DN C Proteins kd TSC1-17 TSC 1 loxp bp -48-285 ctin PEMs Neutrophils
General Laboratory methods Plasma analysis: Gene Expression Analysis: Immunoblot analysis: Immunohistochemistry:
 General Laboratory methods Plasma analysis: Plasma insulin (Mercodia, Sweden), leptin (duoset, R&D Systems Europe, Abingdon, United Kingdom), IL-6, TNFα and adiponectin levels (Quantikine kits, R&D Systems
FIG S1 Examination of eif4b expression after virus infection. (A) A549 cells
 A549 cells") Supplementary Figure Legends FIG S1 Examination of expression after virus infection. () 549 cells were infected with herpes simplex virus (HSV) (MOI = 1), and harvested at the indicated times, followed
Supplementary Figure Legends FIG S1 Examination of expression after virus infection. () 549 cells were infected with herpes simplex virus (HSV) (MOI = 1), and harvested at the indicated times, followed
condition. Left panel, the HCT-116 cells were lysed with RIPA buffer containing 0.1%
 FIGURE LEGENDS Supplementary Fig 1 (A) sumoylation pattern detected under denaturing condition. Left panel, the HCT-116 cells were lysed with RIPA buffer containing 0.1% SDS in the presence and absence
Central Nervous System Penetration of ARVs: Does it Matter?
 NORTHWEST AIDS EDUCATION AND TRAINING CENTER Central Nervous System Penetration of ARVs: Does it Matter? Christina M. Marra, MD Neurology and Medicine (Infectious Diseases) University of Washington 15
I m B m. 1 f ub I B. D m B. f u. 1 f ua 1 D I A. I A m. D m A. f a. 1 f u. D m B ) D m A )(I m B. 1 f ua. 1 (I m A. log (I A. log f.
 D m A )(I m B. 1 f ua. 1 (I m A. log (I A. log f.") Supplementary Material Appendix 1 Here we show that independent inhibition by a single drug of two distinct steps (A and ) in the viral life cycle results in a non-linear median effect dose-response curve
Supplementary Material Appendix 1 Here we show that independent inhibition by a single drug of two distinct steps (A and ) in the viral life cycle results in a non-linear median effect dose-response curve
Supplementary Table 1. Characterization of HNSCC PDX models established at MSKCC
 Supplementary Table 1. Characterization of HNSCC PDX models established at MSKCC Supplementary Table 2. Drug content and loading efficiency estimated with F-NMR and UV- Vis Supplementary Table 3. Complete
Supplementary Information
 Supplementary Information Supplementary Figure 1: cholesterol manipulation alters the positioning of autophagosomes in cells, related to figure 1. (a) HeLa cells were treated for 24h under conditions reducing
Supplementary Table 1. Example of cationic drugs that can be considered triethylamine derivatives. concentration that vacuolizes cells in 4 h or less
 Marceau et al., Data Supplement Supplementary Table 1. Example of cationic drugs that can be considered triethylamine derivatives. Cationic drug a logp pk a Threshold concentration that vacuolizes cells
The use of antiretroviral agents during pregnancy in Canada and compliance with North-American guidelines
 The use of antiretroviral agents during pregnancy in Canada and compliance with North-American guidelines I. Boucoiran, T. Lee, K. Tulloch, L. Sauve, L. Samson, J. Brophy, M. Boucher and D. Money For and
2.5. AMPK activity
 Supplement Fig. A 3 B phos-ampk 2.5 * Control AICAR AMPK AMPK activity (Absorbance at 45 nm) 2.5.5 Control AICAR Supplement Fig. Effects of AICAR on AMPK activation in macrophages. J774. macrophages were
Trehalose, sucrose and raffinose are novel activators of autophagy in human. keratinocytes through an mtor-independent pathway
 Title page Trehalose, sucrose and raffinose are novel activators of autophagy in human keratinocytes through an mtor-independent pathway Xu Chen 1*, Min Li 1*, Li Li 1, Song Xu 1, Dan Huang 1, Mei Ju 1,
Supplementary Figure 1. The CagA-dependent wound healing or transwell migration of gastric cancer cell. AGS cells transfected with vector control or
 Supplementary Figure 1. The CagA-dependent wound healing or transwell migration of gastric cancer cell. AGS cells transfected with vector control or 3xflag-CagA expression vector were wounded using a pipette
Nuclear Receptors Mediated Induction of P-glycoprotein by Antiretroviral Drugs in Human Brain Microvessel Endothelial Cells
 Under The Microscope: The Impact of ARTs Nuclear Receptors Mediated Induction of P-glycoprotein by Antiretroviral Drugs in Human Brain Microvessel Endothelial Cells Gary N.Y. Chan, Ph. D. Candidate Supervisor:
Rescue of mutant rhodopsin traffic by metformin-induced AMPK activation accelerates photoreceptor degeneration Athanasiou et al
 Supplementary Material Rescue of mutant rhodopsin traffic by metformin-induced AMPK activation accelerates photoreceptor degeneration Athanasiou et al Supplementary Figure 1. AICAR improves P23H rod opsin
HIV and transplant: obstacles and opportunities
 HIV and transplant: obstacles and opportunities Christine Durand, M.D. 18 de abril de 2013, XI Conferência Brasil Johns Hopkins University em HIV/AIDS Outline Part 1: Solid organ transplant (SOT) Part
Supplementary Figure 1: si-craf but not si-braf sensitizes tumor cells to radiation.
 Supplementary Figure 1: si-craf but not si-braf sensitizes tumor cells to radiation. (a) Embryonic fibroblasts isolated from wildtype (WT), BRAF -/-, or CRAF -/- mice were irradiated (6 Gy) and DNA damage
Supplementary Figure 1. Gating strategy and quantification of integrated HIV DNA in sorted CD4 + T-cell subsets.
 Supplementary information HIV reservoir size and persistence are driven by T-cell survival and homeostatic proliferation. Chomont, N., M. El Far, P. Ancuta, L. Trautmann, F. A. Procopio, B. Yassine-Diab,
A. Generation and characterization of Ras-expressing autophagycompetent
 Supplemental Material Supplemental Figure Legends Fig. S1 A. Generation and characterization of Ras-expressing autophagycompetent and -deficient cell lines. HA-tagged H-ras V12 was stably expressed in
Title: Smooth muscle cell-specific Tgfbr1 deficiency promotes aortic aneurysm formation by stimulating multiple signaling events
 Title: Smooth muscle cell-specific Tgfbr1 deficiency promotes aortic aneurysm formation by stimulating multiple signaling events Pu Yang 1, 3, radley M. Schmit 1, Chunhua Fu 1, Kenneth DeSart 1, S. Paul
Supplementary Figures
 Supplementary Figures Supplementary Figure 1 Characterization of stable expression of GlucB and sshbira in the CT26 cell line (a) Live cell imaging of stable CT26 cells expressing green fluorescent protein
A. List of selected proteins with high SILAC (H/L) ratios identified in mass
 ratios identified in mass") Supplementary material Figure S1. Interaction between UBL5 and FANCI A. List of selected proteins with high SILAC (H/L) ratios identified in mass spectrometry (MS)-based analysis of UBL5-interacting proteins,
Supplementary material Figure S1. Interaction between UBL5 and FANCI A. List of selected proteins with high SILAC (H/L) ratios identified in mass spectrometry (MS)-based analysis of UBL5-interacting proteins,
Industry Data Request
 Industry Data Request Purpose: reported data will be used internally to populate patient forecasting models that are used for business planning. Business planning includes stock requirement forecasts,
Figure S1. PMVs from THP-1 cells expose phosphatidylserine and carry actin. A) Flow
 Flow") SUPPLEMENTARY DATA Supplementary Figure Legends Figure S1. PMVs from THP-1 cells expose phosphatidylserine and carry actin. A) Flow cytometry analysis of PMVs labelled with annexin-v-pe (Guava technologies)
SUPPLEMENTARY DATA Supplementary Figure Legends Figure S1. PMVs from THP-1 cells expose phosphatidylserine and carry actin. A) Flow cytometry analysis of PMVs labelled with annexin-v-pe (Guava technologies)
HSP72 HSP90. Quadriceps Muscle. MEF2c MyoD1 MyoG Myf5 Hsf1 Hsp GLUT4/GAPDH (AU)
") Supplementary Figure 1. Impaired insulin action in HSP72 deficient muscle and myotubes in culture cannot be explained by altered myogenesis or reduced total GLUT4 expression. Genes associated with myogenesis
Supplementary Figure 1. Impaired insulin action in HSP72 deficient muscle and myotubes in culture cannot be explained by altered myogenesis or reduced total GLUT4 expression. Genes associated with myogenesis
Supplemental Data. Beck et al. (2010). Plant Cell /tpc
. Plant Cell /tpc") Supplemental Figure 1. Phenotypic comparison of the rosette leaves of four-week-old mpk4 and Col-0 plants. A mpk4 vs Col-0 plants grown in soil. Note the extreme dwarfism of the mpk4 plants (white arrows)
Supplemental Figure 1. Phenotypic comparison of the rosette leaves of four-week-old mpk4 and Col-0 plants. A mpk4 vs Col-0 plants grown in soil. Note the extreme dwarfism of the mpk4 plants (white arrows)
Industry Request Integrase Inhibitors
 Industry Request Integrase Inhibitors The objective of this request is to describe and understand the temporal changes in the prescribing practices of Integrese Inibitors (II) in AHOD cohort between 1/1/
(A) Dose response curves of HMLE_shGFP (blue circle), HMLE_shEcad (red square),
 Dose response curves of HMLE_shGFP (blue circle), HMLE_shEcad (red square),") Supplementary Figures and Tables Figure S1. Validation of EMT-selective small molecules (A) Dose response curves of HMLE_shGFP (blue circle), HMLE_shEcad (red square), and HMLE_Twist (black diamond) cells
Supplementary Figures and Tables Figure S1. Validation of EMT-selective small molecules (A) Dose response curves of HMLE_shGFP (blue circle), HMLE_shEcad (red square), and HMLE_Twist (black diamond) cells
Figure S1. Reduction in glomerular mir-146a levels correlate with progression to higher albuminuria in diabetic patients.
 Supplementary Materials Supplementary Figures Figure S1. Reduction in glomerular mir-146a levels correlate with progression to higher albuminuria in diabetic patients. Figure S2. Expression level of podocyte
HIV associated CNS disease in the era of HAART
 HIV associated CNS disease in the era of HAART CSF/CNS penetration and efficacy Acknowledgements Peter Portegies Department of Neurology, AMC Mark van der Valk Department of Internal Medicine/Infectious
THE HIV LIFE CYCLE. Understanding How Antiretroviral Medications Work
 THE HIV LIFE CYCLE Understanding How Antiretroviral Medications Work DEFINITIONS Host: The animal or cell that another organism lives in. In HIV human CD4 T-cells are the host for HIV. Nucleus: The core
Supplementary Materials for
 advances.sciencemag.org/cgi/content/full/1/9/e1500781/dc1 Supplementary Materials for pnaktide inhibits Na/K-ATPase reactive oxygen species amplification and attenuates adipogenesis Komal Sodhi, Kyle Maxwell,
High Resolution Accurate Mass Spectrometry in Clinical Toxicology. William Clarke, PhD, MBA, DABCC Johns Hopkins University School of Medicine
 High Resolution Accurate Mass Spectrometry in Clinical Toxicology Applied to an ED HIV Study William Clarke, PhD, MBA, DABCC Johns Hopkins University School of Medicine Disclosure William Clarke, PhD received
Supplementary Fig. 1. GPRC5A post-transcriptionally down-regulates EGFR expression. (a) Plot of the changes in steady state mrna levels versus
 Plot of the changes in steady state mrna levels versus") Supplementary Fig. 1. GPRC5A post-transcriptionally down-regulates EGFR expression. (a) Plot of the changes in steady state mrna levels versus changes in corresponding proteins between wild type and Gprc5a-/-
Supplementary Fig. 1. GPRC5A post-transcriptionally down-regulates EGFR expression. (a) Plot of the changes in steady state mrna levels versus changes in corresponding proteins between wild type and Gprc5a-/-
SUPPLEMENTARY DATA. Supplementary Table 1. Primers used for PCR and qpcr Primer Name
 Supplementary Table. Primers used for PCR and qpcr Primer Name ccession Number Fwd Rev Type of PCR Cre NC_8 GGCGTCTTCCGC GTGCCCCTCGTTTG Standard PCR LoUcp CCGGGCTGTCTCCGCGG GGCTGTTCGCCCGGCC Standard PCR
Supplementary Figure 1 P53 is degraded following Chlamydia infection independent of the cell lysis and protein sample preparation procedure applied.
 Supplementary Figure 1 P53 is degraded following Chlamydia infection independent of the cell lysis and protein sample preparation procedure applied. (a) Western blotting analysis showing degradation of
Pro-apoptotic signalling through Toll-like receptor 3 involves TRIF-dependent
 Pro-apoptotic signalling through Toll-like receptor 3 involves TRIF-dependent activation of caspase-8 and is under the control of inhibitor of apoptosis proteins in melanoma cells Arnim Weber, Zofia Kirejczyk,
Supplementary Table 1. Metabolic parameters in GFP and OGT-treated mice
 Supplementary Table 1. Metabolic parameters in GFP and OGT-treated mice Fasted Refed GFP OGT GFP OGT Liver G6P (mmol/g) 0.03±0.01 0.04±0.02 0.60±0.04 0.42±0.10 A TGs (mg/g of liver) 20.08±5.17 16.29±0.8
Supplementary information. MARCH8 inhibits HIV-1 infection by reducing virion incorporation of envelope glycoproteins
 Supplementary information inhibits HIV-1 infection by reducing virion incorporation of envelope glycoproteins Takuya Tada, Yanzhao Zhang, Takayoshi Koyama, Minoru Tobiume, Yasuko Tsunetsugu-Yokota, Shoji
SUPPLEMENTARY INFORMATION
 DOI: 10.1038/ncb2988 Supplementary Figure 1 Kif7 L130P encodes a stable protein that does not localize to cilia tips. (a) Immunoblot with KIF7 antibody in cell lysates of wild-type, Kif7 L130P and Kif7
GS-8374, a Novel HIV Protease Inhibitor, Does Not Alter Glucose Homeostasis in Cultured Adipocytes or in a Healthy-Rodent Model System
 ANTIMICROBIAL AGENTS AND CHEMOTHERAPY, Apr. 2011, p. 1377 1382 Vol. 55, No. 4 0066-4804/11/$12.00 doi:10.1128/aac.01184-10 Copyright 2011, American Society for Microbiology. All Rights Reserved. GS-8374,
The Hospitalized HIV+ Patient
 The Hospitalized HIV+ Patient Danny Toub MD dannyt@srheathcenters.org October 8, 2012 Santa Rosa Family Medicine Residency List 3 ways of risk-stratifying known or suspected HIV+ inpatients Perform differential
HIV Drugs and the HIV Lifecycle
 HIV Drugs and the HIV Lifecycle Together, we can change the course of the HIV epidemic one woman at a time. #onewomanatatime #thewellproject All HIV drugs work by interrupting different steps in HIV's
Supplementary Figure 1.TRIM33 binds β-catenin in the nucleus. a & b, Co-IP of endogenous TRIM33 with β-catenin in HT-29 cells (a) and HEK 293T cells
 and HEK 293T cells") Supplementary Figure 1.TRIM33 binds β-catenin in the nucleus. a & b, Co-IP of endogenous TRIM33 with β-catenin in HT-29 cells (a) and HEK 293T cells (b). TRIM33 was immunoprecipitated, and the amount of
Supplementary Figure 1.TRIM33 binds β-catenin in the nucleus. a & b, Co-IP of endogenous TRIM33 with β-catenin in HT-29 cells (a) and HEK 293T cells (b). TRIM33 was immunoprecipitated, and the amount of
MII. Supplement Figure 1. CapZ β2. Merge. 250ng. 500ng DIC. Merge. Journal of Cell Science Supplementary Material. GFP-CapZ β2 DNA
 A GV GVBD MI DNA CapZ β2 CapZ β2 Merge B DIC GFP-CapZ β2 Merge CapZ β2-gfp 250ng 500ng Supplement Figure 1. MII A early MI late MI Control RNAi CapZαβ DNA Actin Tubulin B Phalloidin Intensity(A.U.) n=10
McAlpine PERK-GSK3 regulates foam cell formation. Supplemental Material. Supplementary Table I. Sequences of real time PCR primers.
 Mclpine PERK-GSK3 regulates foam cell formation Supplemental Material Supplementary Table I. Sequences of real time PCR primers. Primer Name Primer Sequences (5-3 ) Product Size (bp) GRP78 (human) Fwd:
Intracellular MHC class II molecules promote TLR-triggered innate. immune responses by maintaining Btk activation
 Intracellular MHC class II molecules promote TLR-triggered innate immune responses by maintaining Btk activation Xingguang Liu, Zhenzhen Zhan, Dong Li, Li Xu, Feng Ma, Peng Zhang, Hangping Yao and Xuetao
Supplemental Table 1. Clinical and epidemiological characteristics of the
 Tendeiro et al. Supplemental Digital Content 1_ Page 2 of 1 Supplemental Table 1. Clinical and epidemiological characteristics of the therapy naïve and treated infected individuals. a Number [male/female]
ADAP Monitoring Provider Prescribing Patterns. Amanda Bowes, NASTAD Christine Rivera and Dr. Charles Gonzalez, NYS AIDS Institute
 ADAP Monitoring Provider Prescribing Patterns Amanda Bowes, NASTAD Christine Rivera and Dr. Charles Gonzalez, NYS AIDS Institute WEBINAR ETIQUETTE All questions or comments can be shared either via the
RAW264.7 cells stably expressing control shrna (Con) or GSK3b-specific shrna (sh-
 or GSK3b-specific shrna (sh-") 1 a b Supplementary Figure 1. Effects of GSK3b knockdown on poly I:C-induced cytokine production. RAW264.7 cells stably expressing control shrna (Con) or GSK3b-specific shrna (sh- GSK3b) were stimulated
1 a b Supplementary Figure 1. Effects of GSK3b knockdown on poly I:C-induced cytokine production. RAW264.7 cells stably expressing control shrna (Con) or GSK3b-specific shrna (sh- GSK3b) were stimulated
Distribution and Effectiveness of Antiretrovirals in the Central Nervous System
 Distribution and Effectiveness of Antiretrovirals in the Central Nervous System Scott Letendre, MD Associate Professor of Medicine HIV Neurobehavioral Research Center and Antiviral Research Center University
WOMENS INTERAGENCY HIV STUDY ANTIRETROVIRAL DOSAGE FORM SECTION A. GENERAL INFORMATION
 WOMENS INTERAGENCY HIV STUDY ANTIRETROVIRAL DOSAGE FORM SECTION A. GENERAL INFORMATION A1. PARTICIPANT ID: ENTER NUMBER HERE - - - ONLY IF ID LABEL IS NOT AVAILABLE A2. VISIT #: A3. VERSION DATE: 1 0 /
Control GST GST-RAP. α2-mg. 170 kda. b-actin. 42 kda LRP-1
 % of max Supplementary Figure 1 Control GST GST-RP 17 kda α2-mg 42 kda b-actin Gate: CD11c+ (DCs) Gate: F4/8+ (Mfs) IgG Cd11cCre + Lrp1 fl/fl LRP-1 Supplementary figure 1. () MDCs were pretreated with
Supplementary Figure 1. IDH1 and IDH2 mutation site sequences on WHO grade III
 Supplementary Materials: Supplementary Figure 1. IDH1 and IDH2 mutation site sequences on WHO grade III patient samples. Genomic DNA samples extracted from punch biopsies from either FFPE or frozen tumor
HIV Update Objectives. Epidemiology. Epidemiology, Transmission and Natural History. Transmission Risk by Exposure. Transmission 9/29/2014
 Objectives HIV Update 2014 Jay Sizemore, MD, MPH Medical Director Chattanooga CARES Assistant Professor UTCOM Chattanooga 2October 2014 Review HIV epidemiology and screening/testing guidelines Discuss
SUPPLEMENTARY INFORMATION
 DOI:.38/ncb2822 a MTC02 FAO cells EEA1 b +/+ MEFs /DAPI -/- MEFs /DAPI -/- MEFs //DAPI c HEK 293 cells WCE N M C P AKT TBC1D7 Lamin A/C EEA1 VDAC d HeLa cells WCE N M C P AKT Lamin A/C EEA1 VDAC Figure
Darunavir STADA 400, 600 and 800 mg film-coated tablets , Version 1.1 PUBLIC SUMMARY OF THE RISK MANAGEMENT PLAN
 Darunavir STADA 400, 600 and 800 mg film-coated tablets 7.9.2016, Version 1.1 PUBLIC SUMMARY OF THE RISK MANAGEMENT PLAN VI.2 Elements for a public summary VI.2.1 Overview of disease epidemiology Human
HIV in the Brain MANAGING COMORBIDITIES IN PATIENTS WITH HIV
 HIV in the Brain MANAGING COMORBIDITIES IN PATIENTS WITH HIV Shibani S. Mukerji MD, PhD Massachusetts General Hospital, Division of Immunologic, Inflammatory and Infectious Neurological Diseases Dana-Farber
Supplementary Figure 1
 S U P P L E M E N TA R Y I N F O R M AT I O N DOI: 10.1038/ncb2896 Supplementary Figure 1 Supplementary Figure 1. Sequence alignment of TERB1 homologs in vertebrates. M. musculus TERB1 was derived from
Summary of treatment benefits
 VI.2 Elements for a public summary VI.2.1 Overview of disease epidemiology Human immunodeficiency virus (HIV) attacks the cells of the immune system, the body's natural defense against germs and other
Figure S1, related to Figure 1. Escaper p38a-expressing cancer cells repopulate the tumors (A) Scheme of the mt/mg reporter that expresses a
 Scheme of the mt/mg reporter that expresses a") Cancer Cell, Volume 33 Supplemental Information Targeting p38a Increases DNA Damage, Chromosome Instability, and the Anti-tumoral Response to Taxanes in Breast Cancer Cells Begoña Cánovas, Ana Igea, Alessandro
Cancer Cell, Volume 33 Supplemental Information Targeting p38a Increases DNA Damage, Chromosome Instability, and the Anti-tumoral Response to Taxanes in Breast Cancer Cells Begoña Cánovas, Ana Igea, Alessandro
a! b! c! Supplementary Fig. 1! Diameter (μm) S1P (LogM) U (LogM) enos! β-actin! Nogo-B! MLEC! nnos! β-actin!
 S1P (LogM) U (LogM) enos! β-actin! Nogo-B! MLEC! nnos! β-actin!") a! b! c! Diamet (μm) 2 2 1 WT Nogo-A/B-deficient -9-8 -7 - -5-4 PE (LogM) Diamet (μm) 2 2 1-12-11-1 -9-8 -7 - -5 U-419 (LogM) Diamet (μm) 2 2 1-8 -7 - -5 S1P (LogM) d! WT! Nogo-A/B-deficient! MLE! enos!
a! b! c! Diamet (μm) 2 2 1 WT Nogo-A/B-deficient -9-8 -7 - -5-4 PE (LogM) Diamet (μm) 2 2 1-12-11-1 -9-8 -7 - -5 U-419 (LogM) Diamet (μm) 2 2 1-8 -7 - -5 S1P (LogM) d! WT! Nogo-A/B-deficient! MLE! enos!
McWilliams et al., http :// /cgi /content /full /jcb /DC1
 Supplemental material JCB McWilliams et al., http ://www.jcb.org /cgi /content /full /jcb.201603039 /DC1 THE JOURNAL OF CELL BIOLOGY Figure S1. In vitro characterization of mito-qc. (A and B) Analysis
a. b. c. d. e. f. g. h. i. j. k. l. m. n. o. p.
 a. b. c. d. e. f. g. h. i. j. k. l. 2.5 2 1.5 1.5 IL-1β 12 8 6 4 2 IL-1β 9 8 7 6 4 3 3 2.9 IL-1β m. n. o. p. 1.8 1.6 1.4 1.2 1.8.6.4.2 6h LPS 2 15 1 5 6h LPS 2 6h LPS 6 4 3 6h LPS Supplementary Figure
Supplementary Figure 1. PAQR3 knockdown inhibits SREBP-2 processing in CHO-7 cells CHO-7 cells were transfected with control sirna or a sirna
 Supplementary Figure 1. PAQR3 knockdown inhibits SREBP-2 processing in CHO-7 cells CHO-7 cells were transfected with control sirna or a sirna targeted for hamster PAQR3. At 24 h after the transfection,
Supplementary Information
 Supplementary Information Intrinsic Photosensitivity Enhances Motility of T Lymphocytes by Phan X. Thieu, Barbara Jaruga, Sandeep C. Pingle, Bidhan C. Bandyopadhyay, & Gerard P. Ahern Supplementary Figure
HIV DISEASE! Neurobehavioral! Neuromedical. Igor Grant, MD, FRCP(C) Director HIV Neurobehavioral Research Program University of California, San Diego
 Director HIV Neurobehavioral Research Program University of California, San Diego") Igor Grant, MD, FRCP(C) Director HIV Neurobehavioral Research Program University of California, San Diego HIV DISEASE! Neuromedical Neurobehavioral! HIV Neurobehavioral Disturbances HIV Associated Neurocognitive
Igor Grant, MD, FRCP(C) Director HIV Neurobehavioral Research Program University of California, San Diego HIV DISEASE! Neuromedical Neurobehavioral! HIV Neurobehavioral Disturbances HIV Associated Neurocognitive
Sestrin2 and BNIP3 (Bcl-2/adenovirus E1B 19kDa-interacting. protein3) regulate autophagy and mitophagy in renal tubular cells in. acute kidney injury
 regulate autophagy and mitophagy in renal tubular cells in. acute kidney injury") Sestrin2 and BNIP3 (Bcl-2/adenovirus E1B 19kDa-interacting protein3) regulate autophagy and mitophagy in renal tubular cells in acute kidney injury by Masayuki Ishihara 1, Madoka Urushido 2, Kazu Hamada
Sestrin2 and BNIP3 (Bcl-2/adenovirus E1B 19kDa-interacting protein3) regulate autophagy and mitophagy in renal tubular cells in acute kidney injury by Masayuki Ishihara 1, Madoka Urushido 2, Kazu Hamada
Supplementary Figure 1 IMQ-Induced Mouse Model of Psoriasis. IMQ cream was
 Supplementary Figure 1 IMQ-Induced Mouse Model of Psoriasis. IMQ cream was painted on the shaved back skin of CBL/J and BALB/c mice for consecutive days. (a, b) Phenotypic presentation of mouse back skin
SUPPLEMENTARY INFORMATION. Supplementary Figures S1-S9. Supplementary Methods
 SUPPLEMENTARY INFORMATION SUMO1 modification of PTEN regulates tumorigenesis by controlling its association with the plasma membrane Jian Huang 1,2#, Jie Yan 1,2#, Jian Zhang 3#, Shiguo Zhu 1, Yanli Wang
TB Intensive Tyler, Texas December 2-4, Tuberculosis and HIV Co-Infection. Lisa Y. Armitige, MD, PhD. December 4, 2008.
 TB Intensive Tyler, Texas December 2-4, 2008 Tuberculosis and HIV Co-Infection Lisa Y. Armitige, MD, Ph.D. December 4, 2008 Tuberculosis and HIV Co Infection Lisa Y. Armitige, MD, PhD Assistant Professor
Supplementary Materials for. c-abl Activation Plays a Role in α-synucleinopathy Induced Neurodegeneration
 Supplementary Materials for c-abl Activation Plays a Role in α-synucleinopathy Induced Neurodegeneration Saurav Brahmachari, Preston Ge, Su Hyun Lee, Donghoon Kim, Senthilkumar S. Karuppagounder, Manoj
p47 negatively regulates IKK activation by inducing the lysosomal degradation of polyubiquitinated NEMO
 Supplementary Information p47 negatively regulates IKK activation by inducing the lysosomal degradation of polyubiquitinated NEMO Yuri Shibata, Masaaki Oyama, Hiroko Kozuka-Hata, Xiao Han, Yuetsu Tanaka,
Supplementary material Legends to Supplementary Figures Figure S1. Figure S2. Figure S3.
 Supplementary material Legends to Supplementary Figures. Figure S1. Expression of BICD-N-MTS fusion does not affect the distribution of the Golgi and endosomes. HeLa cells were transfected with GFP-BICD-N-MTS
Gallic acid prevents isoproterenol-induced cardiac hypertrophy and fibrosis through regulation of JNK2 signaling and Smad3 binding activity
 Gallic acid prevents isoproterenol-induced cardiac hypertrophy and fibrosis through regulation of JNK2 signaling and Smad3 binding activity Yuhee Ryu 1,+, Li Jin 1,2+, Hae Jin Kee 1,, Zhe Hao Piao 3, Jae
Supplemental Material:
 Supplemental Material: MATERIALS AND METHODS RNA interference Mouse CHOP sirna (ON-TARGETplus SMARTpool Cat# L-062068-00) and control sirna (ON-TARGETplus Control) were purchased from Dharmacon. Transfection
(a) Schematic diagram of the FS mutation of UVRAG in exon 8 containing the highly instable
 Schematic diagram of the FS mutation of UVRAG in exon 8 containing the highly instable") Supplementary Figure 1. Frameshift (FS) mutation in UVRAG. (a) Schematic diagram of the FS mutation of UVRAG in exon 8 containing the highly instable A 10 DNA repeat, generating a premature stop codon
Supplementary Figure 1. Frameshift (FS) mutation in UVRAG. (a) Schematic diagram of the FS mutation of UVRAG in exon 8 containing the highly instable A 10 DNA repeat, generating a premature stop codon