SUPPLEMENTARY INFORMATION
|
|
|
- Anissa Williamson
- 5 years ago
- Views:
Transcription

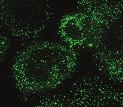
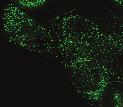
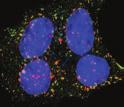
 Representative images of FAO cell showing endogenous (green) and MTC02 (mitochondria marker) or EEA1")
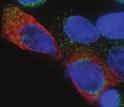
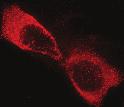
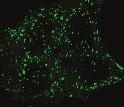
 Representative images of +/+ and -/- MEFs showing endogenous (green) and (red). (Scale bar - μm).")
, and peroxisome (P) fractions.")
, AKT, catalase, and lamin A/C.")
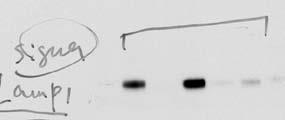
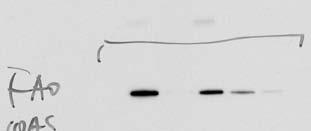
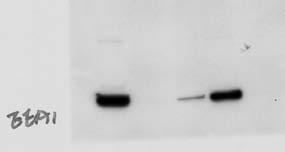
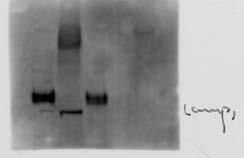
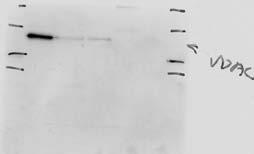
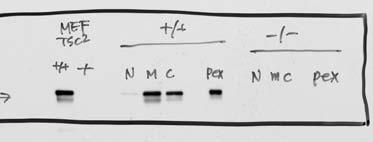
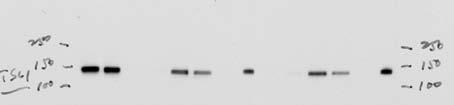
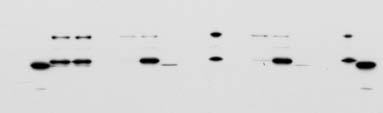
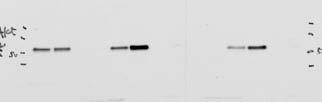
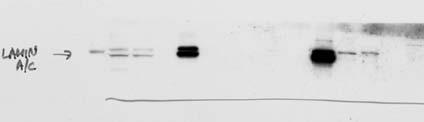
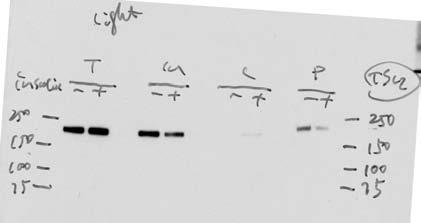
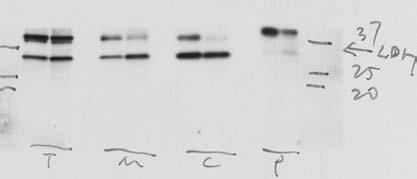
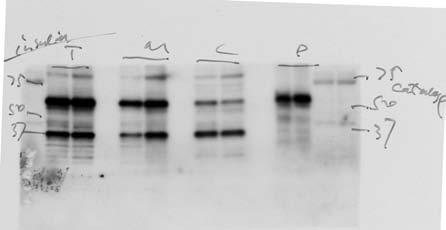
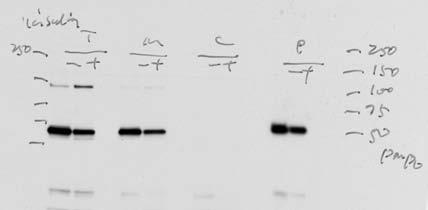
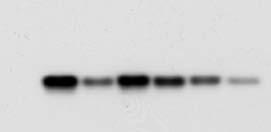
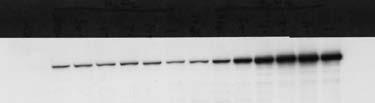
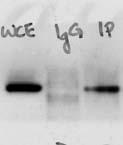
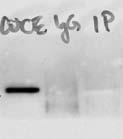
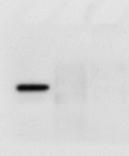
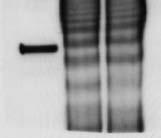
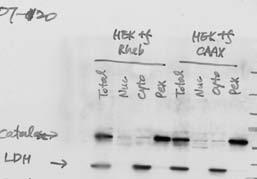
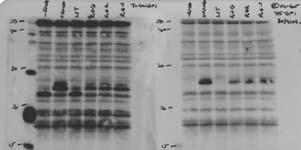
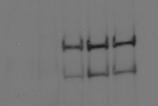
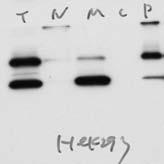
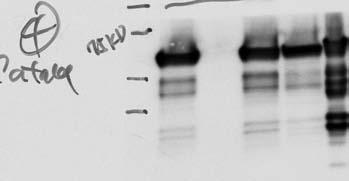
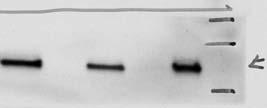
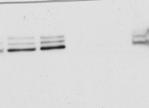
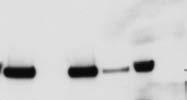
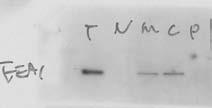
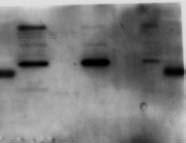
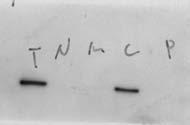
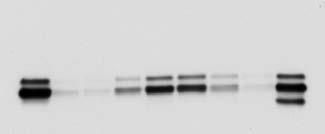
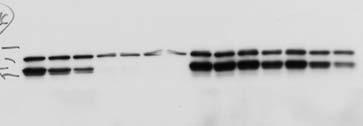
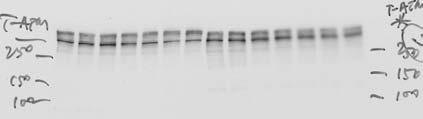
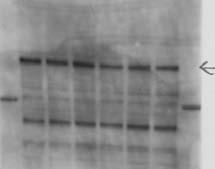
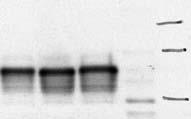
1 DOI:.38/ncb2822 a MTC02 FAO cells EEA1 b +/+ MEFs /DAPI -/- MEFs /DAPI -/- MEFs //DAPI c HEK 293 cells WCE N M C P AKT TBC1D7 Lamin A/C EEA1 VDAC d HeLa cells WCE N M C P AKT Lamin A/C EEA1 VDAC Figure S1 Localization at the peroxisome. (a) Representative images of FAO cell showing endogenous (green) and MTC02 (mitochondria marker) or EEA1 (endosome marker) (red). (Scale bar - μm). (b) Representative images of +/+ and -/- MEFs showing endogenous (green) and (red). (Scale bar - μm). (c and d) Subcellular fractionation of HEK 293 (c) or HeLa (d) cells to separate nuclear (N), cytosolic (C), membrane (M), and peroxisome (P) fractions. Immuno-blot analyses were performed using antibodies to,,, TBC1D7 (HEK 293, Fig. ), AKT, catalase, and lamin A/C. The degree of enrichment for peroxisomes in fractionated lysates was evaluated by assessing markers for endosomes (EEA1), lysosomes () and mitochondria (VDAC). WCE whole cell extracts. Uncropped images of western blots are shown in Supplementary Fig Macmillan Publishers Limited. All rights reserved.
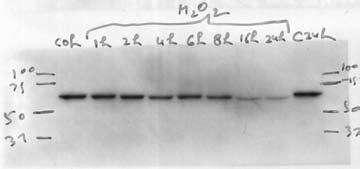
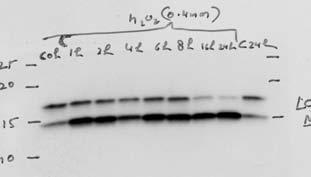
2 Ratio of /Actin Ratio of /Actin Ratio of /Actin SUPPLEMENTARY INFORMATION a GFP-LC3 MCF7 cells H 2 O Time (hr) p p Actin b 6.0 * * * * * 4.0 *** * 2.0 NS 0.0 H 2 O 2 _ _ Time (hr) c light dark H 2 O Baf A GFP-LC3 MCF7 cells d 2 ** ** NS NS 1.5 * ** H 2 O H 2 O Baf A Baf A Actin e Atg5 +/+ MEFs Atg5 -/- MEFs H 2 O Atg5 Figure S2 Induction of autophagy in response to ROS. (a) Western analyses of MCF-7 stably expressing GFP-LC3 cells treated with 0.4 mm H 2 O 2 for the indicated time with markers for autophagy ( and LC3), mtorc1 signaling (p (T389),, p (S235/236) and ). (b) Quantitation of the ratio of /Actin from Fig. S. (±s.e.m., n = 3 independent experiments). *p < 0.05, *** p < 0.001, NS, not significant. (c) Western analysis of GFP-LC3 MCF7 cells pre-incubated in the presence or absence nm Bafilomycin A1 (BafA1) for 1hr before treatement with 0.4 mm H 2 O 2 for 7hr using anti- and LC3 antibodies. (d) Quantitation of the ratio of /Actin and /Actin from Fig. S2c. (±s.e.m., n = 3 independent experiments). *p < 0.05, ** p < 0.01, NS, not significant. (e) Western analysis of Atg5 +/+ MEFs and Atg5 -/- MEFs treated with 0.4 mm H 2 O 2 for 24hr using anti- and Atg5 antibodies. Uncropped images of western blots are shown in Supplementary Fig.. Source data of statistical analysis are shown in Supplementary Table S Macmillan Publishers Limited. All rights reserved.
 p p p4ebp1 GM13427 (control) GM13269 (ZW) 0.0.05.1.2.4 1 0.0.05.1.2.4 1 b GM871 (control) GM13267 (ZW) H 2 O 2 - + - + - + - + Baf A1 - - + + - - + + LC3-I LC3-II Actin 4EBP1 patm ATM pampk AMPK (light) (dark) LC3-I LC3-II c 5 control ZW control ZW 4 ** ** 2.")
 (ZW) - + - + Figure S3 mtorc1")
 Western analysis of human fibroblasts obtained from Zellweger (GM13269) or corresponding control patient with Ehlers-Danlos syndrome (GM13427) treated with indicated doses of H 2 O 2 for 1hr.")
3 Ratio of /Actin Ratio of /Actin SUPPLEMENTARY INFORMATION a H 2 O 2 (mm) p p p4ebp1 GM13427 (control) GM13269 (ZW) b GM871 (control) GM13267 (ZW) H 2 O Baf A LC3-I LC3-II Actin 4EBP1 patm ATM pampk AMPK (light) (dark) LC3-I LC3-II c 5 control ZW control ZW 4 ** ** * * * NS NS 2 *** ** ** 1 NS *** 0 H 2 O H 2 O Baf A1 + Baf A1 + d Amino acids p p p4ebp1 4EBP1 GM13427 GM13269 (Control) (ZW) Figure S3 mtorc1 signaling and autophagy in Zellweger cells with ROS and amino acids. (a) Western analysis of human fibroblasts obtained from Zellweger (GM13269) or corresponding control patient with Ehlers-Danlos syndrome (GM13427) treated with indicated doses of H 2 O 2 for 1hr. mtorc1 signaling monitored by western analysis for p (T389),, p (S235/236),, p4ebp1 (T/46), 4EBP1, patm (S1981), ATM, pampk (T172), AMPK, and LC3. (b) Western analysis of Zellweger cells (GM13267) or control fibroblasts (GM871) cells pre-incubated in the presence or absence of nm Bafilomycin A1 (BafA1) for 1hr before treatment with 0.4 mm H 2 O 2 for 1hr using anti- and LC3 antibodies. (c) Quantitation of the ratio of /Actin and /Actin from Fig. S3b (±s.e.m., n = 3 independent experiments). *p < 0.05, ** p < 0.01, *** p < 0.001, NS, not significant. (d) Representative western analysis using cell extracts from human fibroblasts obtained from a Zellweger patient (GM13269) or control fibroblasts (GM13427) treated with amino acid free media for 60 min, and stimulated with amino acid containing media for min. mtorc1 signaling was monitored using anti-p (T389),, p (S235/236),, p4ebp1(t/46) and 4EBP1. Uncropped images of western blots are shown in Supplementary Fig.. Source data of statistical analysis are shown in Supplementary Table S Macmillan Publishers Limited. All rights reserved.


 Representative images using")
 and or the")
 and (peroxisome")
 Representative images using")
 and (marker")

. (Scale bar - μm).")
 stained with")
")
. (Scale bar - μm).")

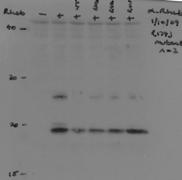
 or L1624P (GAP mutant) or")


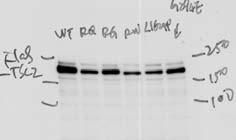
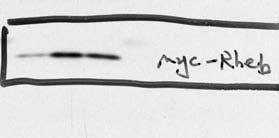
4 Fold change of p/ SUPPLEMENTARY INFORMATION a c Calnexin WT RQ RQ HeLa cells VDAC RQ HeLa cells RG d HEK 293 cells RW IgG Myc- L1624P WT RQ RG RW G294E IP: Myc b Myc- Input RQ HeLa cells RG e - HEK 293 cells Mock WT RQ ** * RW p 0.5 mtor Myc- 0 Mock WT RQ mtor Figure S4 Localization of PEX5 binding mutants. (a) Representative images using HeLa cells transfected with Myc- and wild type (WT) and or the PxBS mutants (RQ, RG, RW) stained with (red) and (peroxisome marker, green). (Scale bar - μm). (b) Representative images using HeLa cells transfected with Myc- and mutants (RQ, RG and RW) stained with (green) and (marker for lysosome, red). As a control, the cells were stained by anti-mtor (green) and anti- (red). (Scale bar - μm). (c) Representative images using HeLa cells transfected with Myc- and mutant (RQ) stained with (red) and either calnexin (marker for endoplasmic reticulum, green) or VDAC (marker for mitochondria, green). (Scale bar - μm). (d) HEK 293 cells were transfected with Myc- and wild type (WT) or the mutants (RQ, RG, RW) or L1624P (GAP mutant) or G294E ( binding mutant). The lysates were immunoprecipitated using anti-myc and control IgG, and samples were analyzed using anti- and anti-myc antibodies. (e) Functional assays were performed using HEK 293 cells expressing -, myc-, and wild type (WT) or mutant (RQ). mtor signaling was monitored by measuring the ratio of p (T389) to level. Graph represents densitometric quantitation of the ratio of phospho- to total (±s.e.m., n = 3 independent experiments). *p < 0.05, ** p < Uncropped images of western blots are shown in Supplementary Fig.. Source data of statistical analysis are shown in Supplementary Table S Macmillan Publishers Limited. All rights reserved.

5 Figure S5 Model for TSC complex localization on peroxisomal membranes, and activation of the -- signaling node by peroxisomal ROS to repress mtorc1 and induce autophagy, or inactivation by AKT phosphorylation of, with subsequent binding of by and sequestration in cytosol Macmillan Publishers Limited. All rights reserved.


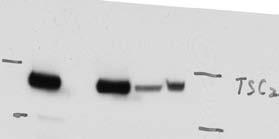
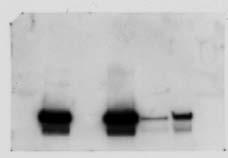
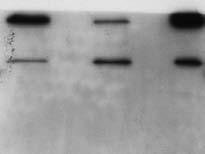
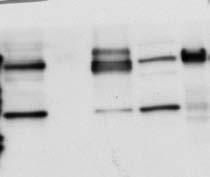
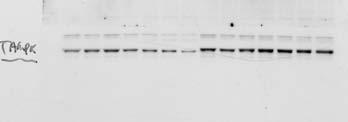
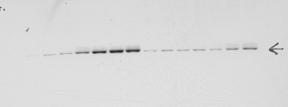
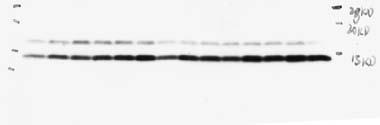
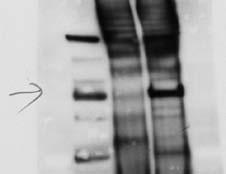
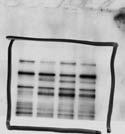
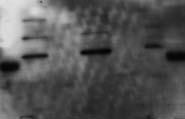
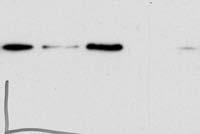
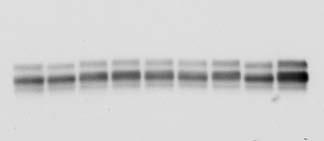
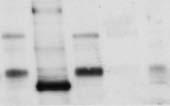
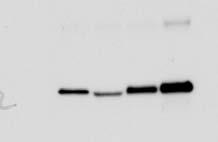
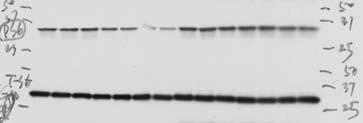
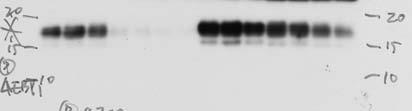
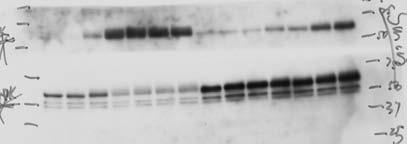
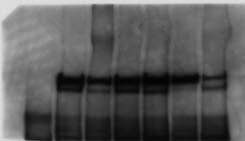
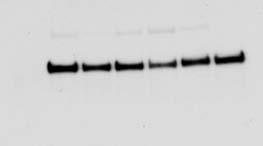
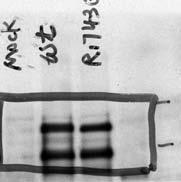
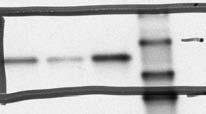
6 1e 2 1 1e AKT TBC1D7 Lamin A/C EEA VDAC Figure Original scans of Western blots. Black boxes indicate cropped region and are labeled for corresponding figure, panel and antibody Macmillan Publishers Limited. All rights reserved.


7 AKT Lamin A/C EEA VDAC 2c 2 1 2c AKT 2c 2c 2c 2c 1 LDH β-integrin 2c 2c 2 1 Lamin A/C 2c Figure continued Macmillan Publishers Limited. All rights reserved.
 2")

 2")


8 3a (light) 2 1 3a (dark) 2 1 3a LDH 3a 3a 3b (light) 2 1 3b (dark) 2 1 LDH 3b 3b 3b Figure continued Macmillan Publishers Limited. All rights reserved.
 pakt")


9 3c 3c p (S939) pakt (S473) 2 1 3c 3c 2 1 3c pakt (T308) LDH 3c 3d 2 1 3d 2 1 3d 3d 3d EHHADH 4e ACAA1 4e 4e p 4e Figure Con=nued Figure continued Macmillan Publishers Limited. All rights reserved.


")


10 p 4e 4e 4e 4e 4e p p p4ebp1 4EBP1 patm pampk (light) pampk (dark) 2 1 ATM AMPK 2 1 Figure Con=nued Figure continued 13 Macmillan Publishers Limited. All rights reserved.


")


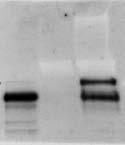
11 5c p 5c 5c 5c 5c 5d p 5d p4ebp1 5d p 5d 4EBP1 5d 5d 5d IP:PEX5 IP:PEX5 IP:PEX5 IP:PEX5 2 2 mtor PEX5 1 IP:PEX5 IP:PEX5 (dark) (light) IP:PEX19 IP:PEX19 IP:PEX19 mtor IP:PEX19 IP:PEX19 IP:PEX19 PEX1 2 1 PEX Figure Con=nued Figure continued Macmillan Publishers Limited. All rights reserved.


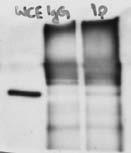
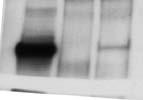
12 PEX5 IP: IP: IP: 2 6d 1 6d 6d Input 2 1 IP:PEX5 6d 2 1 IP:PEX5 PEX5 6d IP:PEX5 6d Input 2 1 6e 2 1 6e PEX5 6f 6f 2 1 6f Input 2 1 WCE M P g 2 1 β-integrin 6g 1-6h IP:PEX19 6h IP:PEX19 Input IP:PEX19 PEX19 6h 6i LDH 6g - 6i Lamin A/C 6i Figure Con=nued Figure continued Macmillan Publishers Limited. All rights reserved.
 7a")


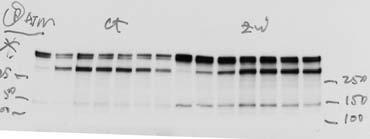
13 PEX5 7a p (light) 7a p (dark) 7a 7a 7a p (light) 7a p (dark) 7a - 7b 7b b 30 - p 7b b p 7b - 7c b 7b 4EBP1 p4ebp1(s65) 30-7d 2 1 7f 30 7c p 7d - 7f HA- 7d 7f Figure continued Macmillan Publishers Limited. All rights reserved.


14 AKT TBC1D7 Lamin A/C EEA VDAC AKT Lamin A/C EEA VDAC S S p S S Figure continued Macmillan Publishers Limited. All rights reserved.


15 p S S Actin S S2c light S2c dark S2c Actin S2c Atg5 S2e S2e p p patm p4ebp1 4EBP1 ATM pampk 2 1 P62 (light) 2 1 AMPK Figure continued 13 Macmillan Publishers Limited. All rights reserved.
")


16 P62 (dark) P62 S3b S3b S3b Actin p S3d S3d p S3d p4ebp1 4EBP1 S3d S3d S3d S4d S3d IP: Myc Myc- p S4e Input IP: Myc S4d S4e IP: Myc S4d Input S4d 1 - S4e Myc- S4e IP: Myc Myc Figure continued Macmillan Publishers Limited. All rights reserved.
17 Supplementary Table 1 Statistics Source data Macmillan Publishers Limited. All rights reserved.
A TSC signaling node at the peroxisome regulates mtorc1 and autophagy in response to ROS
 A TSC signaling node at the peroxisome regulates mtorc1 and autophagy in response to ROS The Harvard community has made this article openly available. Please share how this access benefits you. Your story
SUPPLEMENTARY FIGURES
 SUPPLEMENTARY FIGURES Supplementary Figure 1. (A) Left, western blot analysis of ISGylated proteins in Jurkat T cells treated with 1000U ml -1 IFN for 16h (IFN) or left untreated (CONT); right, western
Supplementary Figure S1 Supplementary Figure S2
 Supplementary Figure S A) The blots shown in Figure B were qualified by using Gel-Pro analyzer software (Rockville, MD, USA). The ratio of LC3II/LC3I to actin was then calculated. The data are represented
Supplementary Figure 1. Normal T lymphocyte populations in Dapk -/- mice. (a) Normal thymic development in Dapk -/- mice. Thymocytes from WT and Dapk
 Normal thymic development in Dapk -/- mice. Thymocytes from WT and Dapk") Supplementary Figure 1. Normal T lymphocyte populations in Dapk -/- mice. (a) Normal thymic development in Dapk -/- mice. Thymocytes from WT and Dapk -/- mice were stained for expression of CD4 and CD8.
Supplementary Figure 1. Normal T lymphocyte populations in Dapk -/- mice. (a) Normal thymic development in Dapk -/- mice. Thymocytes from WT and Dapk -/- mice were stained for expression of CD4 and CD8.
Expanded View Figures
 PEX13 functions in selective autophagy Ming Y Lee et al Expanded View Figures Figure EV1. PEX13 is required for Sindbis virophagy. A, B Quantification of mcherry-capsid puncta per cell (A) and GFP-LC3
Rapid parallel measurements of macroautophagy and mitophagy in
 Supplemental Figures Rapid parallel measurements of macroautophagy and mitophagy in mammalian cells using a single fluorescent biosensor Sargsyan A, Cai J, Fandino LB, Labasky ME, Forostyan T, Colosimo
Nature Structural and Molecular Biology: doi: /nsmb Supplementary Figure 1
 Supplementary Figure 1 Mutational analysis of the SA2-Scc1 interaction in vitro and in human cells. (a) Autoradiograph (top) and Coomassie stained gel (bottom) of 35 S-labeled Myc-SA2 proteins (input)
Supplementary Fig. 1. GPRC5A post-transcriptionally down-regulates EGFR expression. (a) Plot of the changes in steady state mrna levels versus
 Plot of the changes in steady state mrna levels versus") Supplementary Fig. 1. GPRC5A post-transcriptionally down-regulates EGFR expression. (a) Plot of the changes in steady state mrna levels versus changes in corresponding proteins between wild type and Gprc5a-/-
Supplementary Fig. 1. GPRC5A post-transcriptionally down-regulates EGFR expression. (a) Plot of the changes in steady state mrna levels versus changes in corresponding proteins between wild type and Gprc5a-/-
Figure S1. Effect of bafilomycin on EGF-induced Akt and Erk signaling. Effect of chloroquine on EGF-stimulated mtorc1, Akt and Erk
 EGF induced VATPase assembly and mtorc1 activation Supplemental Information Supplemental Figure Legends Figure S1. Effect of bafilomycin on EGFinduced Akt and Erk signaling. A. Hepatocytes were treated
Supplementary Figure 1
 Supplementary Figure 1 a γ-h2ax MDC1 RNF8 FK2 BRCA1 U2OS Cells sgrna-1 ** 60 sgrna 40 20 0 % positive Cells (>5 foci per cell) b ** 80 sgrna sgrna γ-h2ax MDC1 γ-h2ax RNF8 FK2 MDC1 BRCA1 RNF8 FK2 BRCA1
Rescue of mutant rhodopsin traffic by metformin-induced AMPK activation accelerates photoreceptor degeneration Athanasiou et al
 Supplementary Material Rescue of mutant rhodopsin traffic by metformin-induced AMPK activation accelerates photoreceptor degeneration Athanasiou et al Supplementary Figure 1. AICAR improves P23H rod opsin
IP: anti-gfp VPS29-GFP. IP: anti-vps26. IP: anti-gfp - + +
 FAM21 Strump. WASH1 IP: anti- 1 2 3 4 5 6 FAM21 Strump. FKBP IP: anti-gfp VPS29- GFP GFP-FAM21 tail H H/P P H H/P P c FAM21 FKBP Strump. VPS29-GFP IP: anti-gfp 1 2 3 FKBP VPS VPS VPS VPS29 1 = VPS29-GFP
Tumor suppressor Spred2 interaction with LC3 promotes autophagosome maturation and induces autophagy-dependent cell death
 www.impactjournals.com/oncotarget/ Oncotarget, Supplementary Materials 2016 Tumor suppressor Spred2 interaction with LC3 promotes autophagosome maturation and induces autophagy-dependent cell death Supplementary
SUPPLEMENTAL FIGURE LEGENDS
 SUPPLEMENTAL FIGURE LEGENDS Supplemental Figure S1: Endogenous interaction between RNF2 and H2AX: Whole cell extracts from 293T were subjected to immunoprecipitation with anti-rnf2 or anti-γ-h2ax antibodies
Supplementary Figure 1.TRIM33 binds β-catenin in the nucleus. a & b, Co-IP of endogenous TRIM33 with β-catenin in HT-29 cells (a) and HEK 293T cells
 and HEK 293T cells") Supplementary Figure 1.TRIM33 binds β-catenin in the nucleus. a & b, Co-IP of endogenous TRIM33 with β-catenin in HT-29 cells (a) and HEK 293T cells (b). TRIM33 was immunoprecipitated, and the amount of
Supplementary Figure 1.TRIM33 binds β-catenin in the nucleus. a & b, Co-IP of endogenous TRIM33 with β-catenin in HT-29 cells (a) and HEK 293T cells (b). TRIM33 was immunoprecipitated, and the amount of
Supplementary Information
 Supplementary Information Supplementary Figure 1: cholesterol manipulation alters the positioning of autophagosomes in cells, related to figure 1. (a) HeLa cells were treated for 24h under conditions reducing
SUPPLEMENTARY INFORMATION
 SUPPLEMENTARY INFORMATION doi:10.1038/nature11429 S1a 6 7 8 9 Nlrc4 allele S1b Nlrc4 +/+ Nlrc4 +/F Nlrc4 F/F 9 Targeting construct 422 bp 273 bp FRT-neo-gb-PGK-FRT 3x.STOP S1c Nlrc4 +/+ Nlrc4 F/F casp1
SUPPLEMENTARY INFORMATION
 DOI: 10.1038/ncb2988 Supplementary Figure 1 Kif7 L130P encodes a stable protein that does not localize to cilia tips. (a) Immunoblot with KIF7 antibody in cell lysates of wild-type, Kif7 L130P and Kif7
LPS LPS P6 - + Supplementary Fig. 1.
 P6 LPS - - - + + + - LPS + + - - P6 + Supplementary Fig. 1. Pharmacological inhibition of the JAK/STAT blocks LPS-induced HMGB1 nuclear translocation. RAW 267.4 cells were stimulated with LPS in the absence
Supplementary Figure 1: si-craf but not si-braf sensitizes tumor cells to radiation.
 Supplementary Figure 1: si-craf but not si-braf sensitizes tumor cells to radiation. (a) Embryonic fibroblasts isolated from wildtype (WT), BRAF -/-, or CRAF -/- mice were irradiated (6 Gy) and DNA damage
Xenoestrogen-induced Regulation of EZH2 and Histone Methylation via Non-Genomic Estrogen
 Xenoestrogen-induced Regulation of EZH2 and Histone Methylation via Non-Genomic Estrogen Receptor Signaling to PI3K/AKT Tiffany G. Bredfeldt, Kristen L. Greathouse, Stephen H. Safe, Mien-Chie Hung, Mark
Predictive PP1Ca binding region in BIG3 : 1,228 1,232aa (-KAVSF-) HEK293T cells *** *** *** KPL-3C cells - E E2 treatment time (h)
 HEK293T cells *** *** *** KPL-3C cells - E E2 treatment time (h)") Relative expression ERE-luciferase activity activity (pmole/min) activity (pmole/min) activity (pmole/min) activity (pmole/min) MCF-7 KPL-3C ZR--1 BT-474 T47D HCC15 KPL-1 HBC4 activity (pmole/min) a d
Relative expression ERE-luciferase activity activity (pmole/min) activity (pmole/min) activity (pmole/min) activity (pmole/min) MCF-7 KPL-3C ZR--1 BT-474 T47D HCC15 KPL-1 HBC4 activity (pmole/min) a d
RAW264.7 cells stably expressing control shrna (Con) or GSK3b-specific shrna (sh-
 or GSK3b-specific shrna (sh-") 1 a b Supplementary Figure 1. Effects of GSK3b knockdown on poly I:C-induced cytokine production. RAW264.7 cells stably expressing control shrna (Con) or GSK3b-specific shrna (sh- GSK3b) were stimulated
1 a b Supplementary Figure 1. Effects of GSK3b knockdown on poly I:C-induced cytokine production. RAW264.7 cells stably expressing control shrna (Con) or GSK3b-specific shrna (sh- GSK3b) were stimulated
(a) Schematic diagram of the FS mutation of UVRAG in exon 8 containing the highly instable
 Schematic diagram of the FS mutation of UVRAG in exon 8 containing the highly instable") Supplementary Figure 1. Frameshift (FS) mutation in UVRAG. (a) Schematic diagram of the FS mutation of UVRAG in exon 8 containing the highly instable A 10 DNA repeat, generating a premature stop codon
Supplementary Figure 1. Frameshift (FS) mutation in UVRAG. (a) Schematic diagram of the FS mutation of UVRAG in exon 8 containing the highly instable A 10 DNA repeat, generating a premature stop codon
condition. Left panel, the HCT-116 cells were lysed with RIPA buffer containing 0.1%
 FIGURE LEGENDS Supplementary Fig 1 (A) sumoylation pattern detected under denaturing condition. Left panel, the HCT-116 cells were lysed with RIPA buffer containing 0.1% SDS in the presence and absence
Fig. S1. Subcellular localization of overexpressed LPP3wt-GFP in COS-7 and HeLa cells. Cos7 (top) and HeLa (bottom) cells expressing for 24 h human
 and HeLa (bottom) cells expressing for 24 h human") Fig. S1. Subcellular localization of overexpressed LPP3wt-GFP in COS-7 and HeLa cells. Cos7 (top) and HeLa (bottom) cells expressing for 24 h human LPP3wt-GFP, fixed and stained for GM130 (A) or Golgi97
Fig. S1. Subcellular localization of overexpressed LPP3wt-GFP in COS-7 and HeLa cells. Cos7 (top) and HeLa (bottom) cells expressing for 24 h human LPP3wt-GFP, fixed and stained for GM130 (A) or Golgi97
A. Generation and characterization of Ras-expressing autophagycompetent
 Supplemental Material Supplemental Figure Legends Fig. S1 A. Generation and characterization of Ras-expressing autophagycompetent and -deficient cell lines. HA-tagged H-ras V12 was stably expressed in
(a) Significant biological processes (upper panel) and disease biomarkers (lower panel)
 Significant biological processes (upper panel) and disease biomarkers (lower panel)") Supplementary Figure 1. Functional enrichment analyses of secretomic proteins. (a) Significant biological processes (upper panel) and disease biomarkers (lower panel) 2 involved by hrab37-mediated secretory
Supplementary Figure 1. Functional enrichment analyses of secretomic proteins. (a) Significant biological processes (upper panel) and disease biomarkers (lower panel) 2 involved by hrab37-mediated secretory
SUPPLEMENTARY INFORMATION
 DOI: 10.1038/ncb2566 Figure S1 CDKL5 protein expression pattern and localization in mouse brain. (a) Multiple-tissue western blot from a postnatal day (P) 21 mouse probed with an antibody against CDKL5.
Supplementary Figure 1: Characterisation of phospho-fgfr-y463 antibody. (A)
") Supplementary Figure 1: Characterisation of phospho-fgfr-y463 antibody. (A) Cells over-expressing hfgfr1-pcdna3 (+) or pcdna3 (-) were stimulated for 10 minutes with 50ng/ml FGF2 and lysates immunoblotted
Supplementary Figure 1: Characterisation of phospho-fgfr-y463 antibody. (A) Cells over-expressing hfgfr1-pcdna3 (+) or pcdna3 (-) were stimulated for 10 minutes with 50ng/ml FGF2 and lysates immunoblotted
a b G75 G60 Sw-2 Sw-1 Supplementary Figure 1. Structure predictions by I-TASSER Server.
 a b G75 2 2 G60 Sw-2 Sw-1 Supplementary Figure 1. Structure predictions by I-TASSER Server. a. Overlay of top 10 models generated by I-TASSER illustrates the potential effect of 7 amino acid insertion
SUPPLEMENTARY FIGURES AND TABLE
 SUPPLEMENTARY FIGURES AND TABLE Supplementary Figure S1: Characterization of IRE1α mutants. A. U87-LUC cells were transduced with the lentiviral vector containing the GFP sequence (U87-LUC Tet-ON GFP).
Supplementary Figure 1. MAT IIα is Acetylated at Lysine 81.
 IP: Flag a Mascot PTM Modified Mass Error Position Gene Names Score Score Sequence m/z [ppm] 81 MAT2A;AMS2;MATA2 35.6 137.28 _AAVDYQK(ac)VVR_ 595.83-2.28 b Pre-immu After-immu Flag- WT K81R WT K81R / Flag
Supplemental Materials. STK16 regulates actin dynamics to control Golgi organization and cell cycle
 Supplemental Materials STK16 regulates actin dynamics to control Golgi organization and cell cycle Juanjuan Liu 1,2,3, Xingxing Yang 1,3, Binhua Li 1, Junjun Wang 1,2, Wenchao Wang 1, Jing Liu 1, Qingsong
SUPPLEMENTARY FIGURE LEGENDS
 SUPPLEMENTARY FIGURE LEGENDS Supplemental FIG. 1. Localization of myosin Vb in cultured neurons varies with maturation stage. A and B, localization of myosin Vb in cultured hippocampal neurons. A, in DIV
SUPPLEMENTARY INFORMATION
 DOI: 1.138/ncb222 / b. WB anti- WB anti- ulin Mitotic index (%) 14 1 6 2 T (h) 32 48-1 1 2 3 4 6-1 4 16 22 28 3 33 e. 6 4 2 Time (min) 1-6- 11-1 > 1 % cells Figure S1 depletion leads to mitotic defects
supplementary information
 DOI: 10.1038/ncb1875 Figure S1 (a) The 79 surgical specimens from NSCLC patients were analysed by immunohistochemistry with an anti-p53 antibody and control serum (data not shown). The normal bronchi served
Trehalose, sucrose and raffinose are novel activators of autophagy in human. keratinocytes through an mtor-independent pathway
 Title page Trehalose, sucrose and raffinose are novel activators of autophagy in human keratinocytes through an mtor-independent pathway Xu Chen 1*, Min Li 1*, Li Li 1, Song Xu 1, Dan Huang 1, Mei Ju 1,
(A) RT-PCR for components of the Shh/Gli pathway in normal fetus cell (MRC-5) and a
 RT-PCR for components of the Shh/Gli pathway in normal fetus cell (MRC-5) and a") Supplementary figure legends Supplementary Figure 1. Expression of Shh signaling components in a panel of gastric cancer. (A) RT-PCR for components of the Shh/Gli pathway in normal fetus cell (MRC-5) and
Supplementary figure legends Supplementary Figure 1. Expression of Shh signaling components in a panel of gastric cancer. (A) RT-PCR for components of the Shh/Gli pathway in normal fetus cell (MRC-5) and
SUPPLEMENTARY INFORMATION
 DOI: 10.1038/ncb3311 A B TSC2 -/- MEFs C Rapa Hours WCL 0 6 12 24 36 pakt.s473 AKT ps6k S6K CM IGF-1 Recipient WCL - + - + - + pigf-1r IGF-1R pakt ps6 AKT D 1 st SILAC 2 nd SILAC E GAPDH FGF21 ALKPGVIQILGVK
Name Animal source Vendor Cat # Dilutions
 Supplementary data Table S1. Primary and Secondary antibody sources Devi et al, TXNIP in mitophagy A. Primary Antibodies Name Animal source Vendor Cat # Dilutions 1. TXNIP mouse MBL KO205-2 1:2000 (WB)
SUPPLEMENTARY INFORMATION
 SUPPLEMENTARY INFORMATION doi:1.138/nature9814 a A SHARPIN FL B SHARPIN ΔNZF C SHARPIN T38L, F39V b His-SHARPIN FL -1xUb -2xUb -4xUb α-his c Linear 4xUb -SHARPIN FL -SHARPIN TF_LV -SHARPINΔNZF -SHARPIN
SUPPLEMENTARY INFORMATION
 doi:.38/nature234 Note 1. LINC00961 encodes a lysosomal Type I transmembrane polypeptide In order to determine if the polypeptide encoded by LINC00961 was an integral membrane protein or simply associated
Supporting Information. Epigallocatechin-3-gallate (EGCG) promotes autophagy-dependent survival via
 promotes autophagy-dependent survival via") Supporting Information Epigallocatechin-3-gallate (EGCG) promotes autophagy-dependent survival via influencing the balance of mtor-ampk pathways upon endoplasmic reticulum stress Figure S1. EGCG induces
Supporting Information Epigallocatechin-3-gallate (EGCG) promotes autophagy-dependent survival via influencing the balance of mtor-ampk pathways upon endoplasmic reticulum stress Figure S1. EGCG induces
Supplemental Information. Increased 4E-BP1 Expression Protects. against Diet-Induced Obesity and Insulin. Resistance in Male Mice
 Cell Reports, Volume 16 Supplemental Information Increased 4E-BP1 Expression Protects against Diet-Induced Obesity and Insulin Resistance in Male Mice Shih-Yin Tsai, Ariana A. Rodriguez, Somasish G. Dastidar,
Kidney. Heart. Lung. Sirt1. Gapdh. Mouse IgG DAPI. Rabbit IgG DAPI
 a e Na V 1.5 Ad-LacZ Ad- 110KD b Scn5a/ (relative to Ad-LacZ) f 150 100 50 0 p = 0.65 Ad-LacZ Ad- c Heart Lung Kidney Spleen 110KD d fl/fl c -/- DAPI 20 µm Na v 1.5 250KD fl/fl Rabbit IgG DAPI fl/fl Mouse
Supplementary Materials
 Supplementary Materials Supplementary Figure S1 Regulation of Ubl4A stability by its assembly partner A, The translation rate of Ubl4A is not affected in the absence of Bag6. Control, Bag6 and Ubl4A CRISPR
supplementary information
 DOI: 1.138/ncb1 Control Atg7 / NAC 1 1 1 1 (mm) Control Atg7 / NAC 1 1 1 1 (mm) Lamin B Gstm1 Figure S1 Neither the translocation of into the nucleus nor the induction of antioxidant proteins in autophagydeficient
(A) SW480, DLD1, RKO and HCT116 cells were treated with DMSO or XAV939 (5 µm)
 SW480, DLD1, RKO and HCT116 cells were treated with DMSO or XAV939 (5 µm)") Supplementary Figure Legends Figure S1. Tankyrase inhibition suppresses cell proliferation in an axin/β-catenin independent manner. (A) SW480, DLD1, RKO and HCT116 cells were treated with DMSO or XAV939
Supplementary Figure Legends Figure S1. Tankyrase inhibition suppresses cell proliferation in an axin/β-catenin independent manner. (A) SW480, DLD1, RKO and HCT116 cells were treated with DMSO or XAV939
SUPPLEMENTARY INFORMATION
 Figure S1 Induction of non-apoptotic death of SV40-transformed and primary DKO MEFs, and DKO thymocytes. (A-F) STS-induced non-apoptotic death of DKO MEF. (A, B) Reduced viability of DKO MEFs after exposure
293T cells were transfected with indicated expression vectors and the whole-cell extracts were subjected
 SUPPLEMENTARY INFORMATION Supplementary Figure 1. Formation of a complex between Slo1 and CRL4A CRBN E3 ligase. (a) HEK 293T cells were transfected with indicated expression vectors and the whole-cell
SUPPLEMENTARY INFORMATION
 doi:10.1038/nature12652 Supplementary Figure 1. PRDM16 interacts with endogenous EHMT1 in brown adipocytes. Immunoprecipitation of PRDM16 complex by flag antibody (M2) followed by Western blot analysis
S1a S1b S1c. S1d. S1f S1g S1h SUPPLEMENTARY FIGURE 1. - si sc Il17rd Il17ra bp. rig/s IL-17RD (ng) -100 IL-17RD
 -100 IL-17RD") SUPPLEMENTARY FIGURE 1 0 20 50 80 100 IL-17RD (ng) S1a S1b S1c IL-17RD β-actin kda S1d - si sc Il17rd Il17ra rig/s15-574 - 458-361 bp S1f S1g S1h S1i S1j Supplementary Figure 1. Knockdown of IL-17RD enhances
SUPPLEMENTARY FIGURE 1 0 20 50 80 100 IL-17RD (ng) S1a S1b S1c IL-17RD β-actin kda S1d - si sc Il17rd Il17ra rig/s15-574 - 458-361 bp S1f S1g S1h S1i S1j Supplementary Figure 1. Knockdown of IL-17RD enhances
Supplementary Table 1. Characterization of HNSCC PDX models established at MSKCC
 Supplementary Table 1. Characterization of HNSCC PDX models established at MSKCC Supplementary Table 2. Drug content and loading efficiency estimated with F-NMR and UV- Vis Supplementary Table 3. Complete
Live cell imaging of trafficking of the chaperone complex vaccine to the ER. BMDCs were incubated with ER-Tracker Red (1 M) in staining solution for
 in staining solution for") Live cell imaging of trafficking of the chaperone complex vaccine to the ER. BMDCs were incubated with ER-Tracker Red (1 M) in staining solution for 15 min at 37 C and replaced with fresh complete medium.
Live cell imaging of trafficking of the chaperone complex vaccine to the ER. BMDCs were incubated with ER-Tracker Red (1 M) in staining solution for 15 min at 37 C and replaced with fresh complete medium.
Supplementary information. The Light Intermediate Chain 2 Subpopulation of Dynein Regulates Mitotic. Spindle Orientation
 Supplementary information The Light Intermediate Chain 2 Subpopulation of Dynein Regulates Mitotic Spindle Orientation Running title: Dynein LICs distribute mitotic functions. Sagar Mahale a, d, *, Megha
Nature Immunology: doi: /ni.3866
 Nature Immunology: doi:10.1038/ni.3866 Supplementary Figure 1 The effect of TIPE2 on chemotaxis. a, The expression of TIPE2 in dhl-60c, dhl-60t, TIPE2-expressing and 15/16Q-expressing dhl-60t neutrophils
T H E J O U R N A L O F C E L L B I O L O G Y
 Supplemental material Chairoungdua et al., http://www.jcb.org/cgi/content/full/jcb.201002049/dc1 T H E J O U R N A L O F C E L L B I O L O G Y Figure S1. Expression of CD9 and CD82 inhibits Wnt/ -catenin
Supplemental Figure 1. Western blot analysis indicated that MIF was detected in the fractions of
 Supplemental Figure Legends Supplemental Figure 1. Western blot analysis indicated that was detected in the fractions of plasma membrane and cytosol but not in nuclear fraction isolated from Pkd1 null
Type of file: PDF Title of file for HTML: Supplementary Information Description: Supplementary Figures
 Type of file: PDF Title of file for HTML: Supplementary Information Description: Supplementary Figures Type of file: MOV Title of file for HTML: Supplementary Movie 1 Description: NLRP3 is moving along
Figure S1. Western blot analysis of clathrin RNA interference in human DCs Human immature DCs were transfected with 100 nm Clathrin SMARTpool or
 Figure S1. Western blot analysis of clathrin RNA interference in human DCs Human immature DCs were transfected with 100 nm Clathrin SMARTpool or control nontargeting sirnas. At 90 hr after transfection,
Supplementary Figures
 Supplementary Figures Supplementary Figure 1 Characterization of stable expression of GlucB and sshbira in the CT26 cell line (a) Live cell imaging of stable CT26 cells expressing green fluorescent protein
Supplementary Materials
 Supplementary Materials Figure S1. MTT Cell viability assay. To measure the cytotoxic potential of the oxidative treatment, the MTT [3-(4,5-dimethylthiazol- 2-yl)-2,5-diphenyl tetrazolium bromide] assay
Supplementary Figure 1. Confocal immunofluorescence showing mitochondrial translocation of Drp1. Cardiomyocytes treated with H 2 O 2 were prestained
 Supplementary Figure 1. Confocal immunofluorescence showing mitochondrial translocation of Drp1. Cardiomyocytes treated with H 2 O 2 were prestained with MitoTracker (red), then were immunostained with
Loss of Calreticulin Uncovers a Critical Role for Calcium in Regulating Cellular Lipid Homeostasis
 SUPPLEMENTARY MATERIAL Loss of Calreticulin Uncovers a Critical Role for Calcium in Regulating Cellular Lipid Homeostasis Wen-An Wang 1, Wen-Xin Liu 1, Serpen Durnaoglu 2, Sun-Kyung Lee 2, Jihong Lian
Supplementary Figure 1. PD-L1 is glycosylated in cancer cells. (a) Western blot analysis of PD-L1 in breast cancer cells. (b) Western blot analysis
 Western blot analysis of PD-L1 in breast cancer cells. (b) Western blot analysis") Supplementary Figure 1. PD-L1 is glycosylated in cancer cells. (a) Western blot analysis of PD-L1 in breast cancer cells. (b) Western blot analysis of PD-L1 in ovarian cancer cells. (c) Western blot analysis
Supplementary Figure 1. PD-L1 is glycosylated in cancer cells. (a) Western blot analysis of PD-L1 in breast cancer cells. (b) Western blot analysis of PD-L1 in ovarian cancer cells. (c) Western blot analysis
Supplementary Materials for
 www.sciencesignaling.org/cgi/content/full/6/283/ra57/dc1 Supplementary Materials for JNK3 Couples the Neuronal Stress Response to Inhibition of Secretory Trafficking Guang Yang,* Xun Zhou, Jingyan Zhu,
Supplementary information
 Supplementary information 1 Supplementary Figure 1. CALM regulates autophagy. (a). Quantification of LC3 levels in the experiment described in Figure 1A. Data are mean +/- SD (n > 3 experiments for each
hexahistidine tagged GRP78 devoid of the KDEL motif (GRP78-His) on SDS-PAGE. This
 on SDS-PAGE. This") SUPPLEMENTAL FIGURE LEGEND Fig. S1. Generation and characterization of. (A) Coomassie staining of soluble hexahistidine tagged GRP78 devoid of the KDEL motif (GRP78-His) on SDS-PAGE. This protein was expressed
SUPPLEMENTAL FIGURE LEGEND Fig. S1. Generation and characterization of. (A) Coomassie staining of soluble hexahistidine tagged GRP78 devoid of the KDEL motif (GRP78-His) on SDS-PAGE. This protein was expressed
SUPPLEMENTARY INFORMATION. Supplementary Figures S1-S9. Supplementary Methods
 SUPPLEMENTARY INFORMATION SUMO1 modification of PTEN regulates tumorigenesis by controlling its association with the plasma membrane Jian Huang 1,2#, Jie Yan 1,2#, Jian Zhang 3#, Shiguo Zhu 1, Yanli Wang
Supplementary Materials for
 www.sciencesignaling.org/cgi/content/full/7/308/ra4/dc1 Supplementary Materials for Antipsychotics Activate mtorc1-dependent Translation to Enhance Neuronal Morphological Complexity Heather Bowling, Guoan
Supplementary Figure 1
 Supplementary Figure 1 Supplementary Figure 1. Neither the activation nor suppression of the MAPK pathway affects the ASK1/Vif interaction. (a, b) HEK293 cells were cotransfected with plasmids encoding
TRAF6 ubiquitinates TGFβ type I receptor to promote its cleavage and nuclear translocation in cancer
 Supplementary Information TRAF6 ubiquitinates TGFβ type I receptor to promote its cleavage and nuclear translocation in cancer Yabing Mu, Reshma Sundar, Noopur Thakur, Maria Ekman, Shyam Kumar Gudey, Mariya
SUPPLEMENTARY INFORMATION
 DOI: 1.138/ncb3355 a S1A8 + cells/ total.1.8.6.4.2 b S1A8/?-Actin c % T-cell proliferation 3 25 2 15 1 5 T cells Supplementary Figure 1 Inter-tumoral heterogeneity of MDSC accumulation in mammary tumor
Supplementary Figure 1. Rab27a-KD inhibits speed and persistence of HEp3 cells migrating in the chick CAM. (a) Western blot analysis of Rab27a
 Western blot analysis of Rab27a") Supplementary Figure 1. Rab27a-KD inhibits speed and persistence of HEp3 cells migrating in the chick CAM. (a) Western blot analysis of Rab27a expression in GFP-expressing HEp3 cells. (b) Representative
Supplementary Figure 1. Rab27a-KD inhibits speed and persistence of HEp3 cells migrating in the chick CAM. (a) Western blot analysis of Rab27a expression in GFP-expressing HEp3 cells. (b) Representative
Supplementary Figure 1. SC35M polymerase activity in the presence of Bat or SC35M NP encoded from the phw2000 rescue plasmid.
 1 2 3 4 5 6 7 8 9 10 11 12 13 14 15 16 17 18 19 20 21 22 23 24 25 26 27 Supplementary Figure 1. SC35M polymerase activity in the presence of Bat or SC35M NP encoded from the phw2000 rescue plasmid. HEK293T
c Ischemia (30 min) Reperfusion (8 w) Supplementary Figure bp 300 bp Ischemia (30 min) Reperfusion (4 h) Dox 20 mg/kg i.p.
 Reperfusion (8 w) Supplementary Figure bp 300 bp Ischemia (30 min) Reperfusion (4 h) Dox 20 mg/kg i.p.") a Marker Ripk3 +/ 5 bp 3 bp b Ischemia (3 min) Reperfusion (4 h) d 2 mg/kg i.p. 1 w 5 w Sacrifice for IF size A subset for echocardiography and morphological analysis c Ischemia (3 min) Reperfusion (8
a Marker Ripk3 +/ 5 bp 3 bp b Ischemia (3 min) Reperfusion (4 h) d 2 mg/kg i.p. 1 w 5 w Sacrifice for IF size A subset for echocardiography and morphological analysis c Ischemia (3 min) Reperfusion (8
Nature Immunology doi: /ni.3268
 Supplementary Figure 1 Loss of Mst1 and Mst2 increases susceptibility to bacterial sepsis. (a) H&E staining of colon and kidney sections from wild type and Mst1 -/- Mst2 fl/fl Vav-Cre mice. Scale bar,
Supplemental Figures:
 Supplemental Figures: Figure 1: Intracellular distribution of VWF by electron microscopy in human endothelial cells. a) Immunogold labeling of LC3 demonstrating an LC3-positive autophagosome (white arrow)
Supplementary Figure 1
 S U P P L E M E N TA R Y I N F O R M AT I O N DOI: 10.1038/ncb2896 Supplementary Figure 1 Supplementary Figure 1. Sequence alignment of TERB1 homologs in vertebrates. M. musculus TERB1 was derived from
SUPPLEMENTARY INFORMATION
 Supplementary Table 1. Cell sphingolipids and S1P bound to endogenous TRAF2. Sphingolipid Cell pmol/mg TRAF2 immunoprecipitate pmol/mg Sphingomyelin 4200 ± 250 Not detected Monohexosylceramide 311 ± 18
Supplementary Table 1. List of primers used in this study
 Supplementary Table 1. List of primers used in this study Gene Forward primer Reverse primer Rat Met 5 -aggtcgcttcatgcaggt-3 5 -tccggagacacaggatgg-3 Rat Runx1 5 -cctccttgaaccactccact-3 5 -ctggatctgcctggcatc-3
Supplementary Figure 1. Spatial distribution of LRP5 and β-catenin in intact cardiomyocytes. (a) and (b) Immunofluorescence staining of endogenous
 and (b) Immunofluorescence staining of endogenous") Supplementary Figure 1. Spatial distribution of LRP5 and β-catenin in intact cardiomyocytes. (a) and (b) Immunofluorescence staining of endogenous LRP5 in intact adult mouse ventricular myocytes (AMVMs)
Supplementary Figure 1. Spatial distribution of LRP5 and β-catenin in intact cardiomyocytes. (a) and (b) Immunofluorescence staining of endogenous LRP5 in intact adult mouse ventricular myocytes (AMVMs)
SUPPLEMENTARY INFORMATION
 SUPPLEENTRY INFORTION DOI: 1.138/ncb2577 Early Telophase Late Telophase B icrotubules within the ICB (percent of total cells in telophase) D G ultinucleate cells (% total) 8 6 4 2 2 15 1 5 T without gaps
supplementary information
 Figure S1 Nucleotide binding status of RagA mutants. Wild type and mutant forms of MycRagA was transfected into HEK293 cells and the transfected cells were labeled with 32 Pphosphate. MycRagA was immunoprecipitated
Supplemental Information
 Supplemental Information Tobacco-specific Carcinogen Induces DNA Methyltransferases 1 Accumulation through AKT/GSK3β/βTrCP/hnRNP-U in Mice and Lung Cancer patients Ruo-Kai Lin, 1 Yi-Shuan Hsieh, 2 Pinpin
Supplementary Figure 1. The CagA-dependent wound healing or transwell migration of gastric cancer cell. AGS cells transfected with vector control or
 Supplementary Figure 1. The CagA-dependent wound healing or transwell migration of gastric cancer cell. AGS cells transfected with vector control or 3xflag-CagA expression vector were wounded using a pipette
18s AAACGGCTACCACATCCAAG CCTCCAATGGATCCTCGTTA. 36b4 GTTCTTGCCCATCAGCACC AGATGCAGCAGATCCGCAT. Acc1 AGCAGATCCGCAGCTTG ACCTCTGCTCGCTGAGTGC
 Supplementary Table 1. Quantitative PCR primer sequences Gene symbol Sequences (5 to 3 ) Forward Reverse 18s AAACGGCTACCACATCCAAG CCTCCAATGGATCCTCGTTA 36b4 GTTCTTGCCCATCAGCACC AGATGCAGCAGATCCGCAT Acc1
ERK1/2/MAPK pathway-dependent regulation of the telomeric factor TRF2
 ERK1/2/MAPK pathway-dependent regulation of the telomeric factor TRF2 SUPPLEMENTARY FIGURES AND TABLE Supplementary Figure S1: Conservation of the D domain throughout evolution. Alignment of TRF2 sequences
Figure S1. HP1α localizes to centromeres in mitosis and interacts with INCENP. (A&B) HeLa
 HeLa") SUPPLEMENTARY FIGURES Figure S1. HP1α localizes to centromeres in mitosis and interacts with INCENP. (A&B) HeLa tet-on cells that stably express HP1α-CFP, HP1β-CFP, or HP1γ-CFP were monitored with livecell
SUPPLEMENTARY FIGURES Figure S1. HP1α localizes to centromeres in mitosis and interacts with INCENP. (A&B) HeLa tet-on cells that stably express HP1α-CFP, HP1β-CFP, or HP1γ-CFP were monitored with livecell
Loss of RhoA promotes skin tumor formation. Supplementary Figure 1. Loss of RhoA does not impair F-actin organization.
 Supplementary Figure Legends Supplementary Figure 1. Loss of RhoA does not impair F-actin organization. a. Representative IF images of F-actin staining of big and small control (left) and RhoA ko tumors
Supplementary Materials for
 www.sciencesignaling.org/cgi/content/full/9/439/ra78/dc1 Supplementary Materials for Small heterodimer partner mediates liver X receptor (LXR) dependent suppression of inflammatory signaling by promoting
Supplementary Materials for
 www.sciencesignaling.org/cgi/content/full/9/430/ra57/dc1 Supplementary Materials for The 4E-BP eif4e axis promotes rapamycinsensitive growth and proliferation in lymphocytes Lomon So, Jongdae Lee, Miguel
SUPPLEMENTARY INFORMATION
 DOI: 10.1038/ncb3076 Supplementary Figure 1 btrcp targets Cep68 for degradation during mitosis. a) Cep68 immunofluorescence in interphase and metaphase. U-2OS cells were transfected with control sirna
supplementary information
 DOI: 10.1038/ncb2153 Figure S1 Ectopic expression of HAUSP up-regulates REST protein. (a) Immunoblotting showed that ectopic expression of HAUSP increased REST protein levels in ENStemA NPCs. (b) Immunofluorescent
Supplementary Materials for
 advances.sciencemag.org/cgi/content/full/3/2/e1602038/dc1 Supplementary Materials for Mitochondrial metabolic regulation by GRP78 Manoj Prasad, Kevin J. Pawlak, William E. Burak, Elizabeth E. Perry, Brendan
Supplementary Figure S1: Defective heterochromatin repair in HGPS progeroid cells
 Supplementary Figure S1: Defective heterochromatin repair in HGPS progeroid cells Immunofluorescence staining of H3K9me3 and 53BP1 in PH and HGADFN003 (HG003) cells at 24 h after γ-irradiation. Scale bar,
p = formed with HCI-001 p = Relative # of blood vessels that formed with HCI-002 Control Bevacizumab + 17AAG Bevacizumab 17AAG
 A.. Relative # of ECs associated with HCI-001 1.4 1.2 1.0 0.8 0.6 0.4 0.2 0.0 ol b p < 0.001 Relative # of blood vessels that formed with HCI-001 1.4 1.2 1.0 0.8 0.6 0.4 0.2 0.0 l b p = 0.002 Control IHC:
SUPPLEMENTARY LEGENDS...
 TABLE OF CONTENTS SUPPLEMENTARY LEGENDS... 2 11 MOVIE S1... 2 FIGURE S1 LEGEND... 3 FIGURE S2 LEGEND... 4 FIGURE S3 LEGEND... 5 FIGURE S4 LEGEND... 6 FIGURE S5 LEGEND... 7 FIGURE S6 LEGEND... 8 FIGURE
WT MSD MPS-IIIA. Lysosomal ph
 7 6 Lysosomal ph 5 4 3 2 1 Supplementary figure S1. Lysosomal ph was measure in, and MPSIIIA MEFs using a Lysosensor yellow/blue-dextran (Molecular Probes) as a lysosomal ph indicator (see methods). P