Supplemental Information. Dorsal Raphe Dual Serotonin-Glutamate Neurons. Drive Reward by Establishing Excitatory Synapses
|
|
|
- Candice McCormick
- 5 years ago
- Views:
Transcription
1 Cell Reports, Volume 26 Supplemental Information Dorsal Raphe Dual Serotonin-Glutamate Neurons Drive Reward by Establishing Excitatory Synapses on VTA Mesoaccumbens Dopamine Neurons Hui-Ling Wang, Shiliang Zhang, Jia Qi, Huikun Wang, Roger Cachope, Carlos A. Mejias- Aponte, Jorge A. Gomez, Gabriel E. Mateo-Semidey, Gerard M.J. Beaudoin, Carlos A. Paladini, Joseph F. Cheer, and Marisela Morales
 make synapses on VTA TH-negative neurons, triple immunolabeling; TH label (gold particles); SERT-immunoperoxidase label (scattered dark material) and VGluT3 label (gold")
2 Figure S1. Both SERT-only and SERT-VGluT3 neurons synapse on VTA TH or non-th neurons. Related to Figure 1. A. SERT-only axon terminals (AT) make synapses on VTA TH-negative neurons, triple immunolabeling; TH label (gold particles); SERT-immunoperoxidase label (scattered dark material) and VGluT3 label (gold particles). SERT AT lacking VGluT3 (red outline) makes a symmetric synapse (red arrow) with a TH-negative dendrite (De, cyan outline). B. Frequency of SERT-only terminals synapsing on VTA dendrites. The bars represent mean + s.e.m. of the 2 classes of dendrites in the VTA of 4 mice from a total of 535 terminals (36.99 ± 3.72% SERT-only terminals on TH-positive dendrites and ± 3.72% SERT-only terminals on TH-negative dendrites). t (3) = 3.498, P = , t-test. C. SERT-VGluT3 axon terminals (AT) make synapses on VTA TH-negative neurons, triple immunolabeling; TH label (gold particles); SERT-immunoperoxidase label (scattered dark material) and VGluT3 label (gold particles, yellow arrow). SERT-VGluT3 AT (yellow outline) makes an asymmetric synapse (green arrow) with a TH-negative dendrite (De, cyan outline). D. Frequency of SERT-VGluT3 terminals synapsing on VTA dendrites. The bars represent mean + s.e.m. of the 2 classes of dendrites in the VTA of 4 mice from a total of 251 terminals (61.17 ± 2.59% SERT-VGluT3 terminals on THpositive dendrites and ± 2.59% SERT-VGluT3 terminals on TH-negative dendrites). t (3) = 4.313, P = , t-test. Scale bars represent 200 nm in (A) and (C).
. B. CTb signal detected as red fluorescence.")
3 Figure S2. Histological verification of injection sites of FG or CTb in the nacc of SERT::Cre mice. Related to Figure 2. A. FG signal detected as brown material in the nacc injection site. The diagram adapted from mouse atlas (bregma at 1.10mm). B. CTb signal detected as red fluorescence. aca, anterior commissure anterior part; AcbC, accumbens nucleus core; Acbsh, accumbens nucleus shell; CPu, caudate putamen; LV, lateral ventricle. Scale bars represent 1000 μm in (A) and 800 μm in (B).
4 Figure S3. Monosynaptic glutamatergic transmission in DR-VTA pathway. Related to Figure 2. A. Averaged traces show that optical-evoked EPSCs were eliminated by bath application of TTX (500 nm), and restored by application of 4-AP (200 µm). B. Summarized bar graph of the effects of TTX (6.9 ± 1.7% to control) and 4-AP (78.5 ± 9.1 % to control) on optical-evoked responses (n = 7; Repeated measures-anova, F 2, 12 = 11.78, P = ** P < 0.01 vs control, Newman-Keuls post hoc test). C. Sample traces of 5 consecutive recordings (gray) and the averaged response (black) showing short and consistent synaptic latency of the DR-VTA glutamatergic transmissions. Latency was defined as the time from the onset of laser pulses (blue line) to 10% of the peak responses. D. Summarized graph shows the averaged latency (2.94 ± 0.20 ms, n = 14) of the DR- VTA transmission. Black dots denote the monosynaptic latency of cells from the TTX/4-AP experiments (n = 7). Black circles denote the synaptic latency of cells from the CNQX experiments (n = 7; shown in Figure 2J), which are VTA mesoaccumbens DA neurons. Gray lines indicate the median and 25% and 75% quartiles of all cells.
5
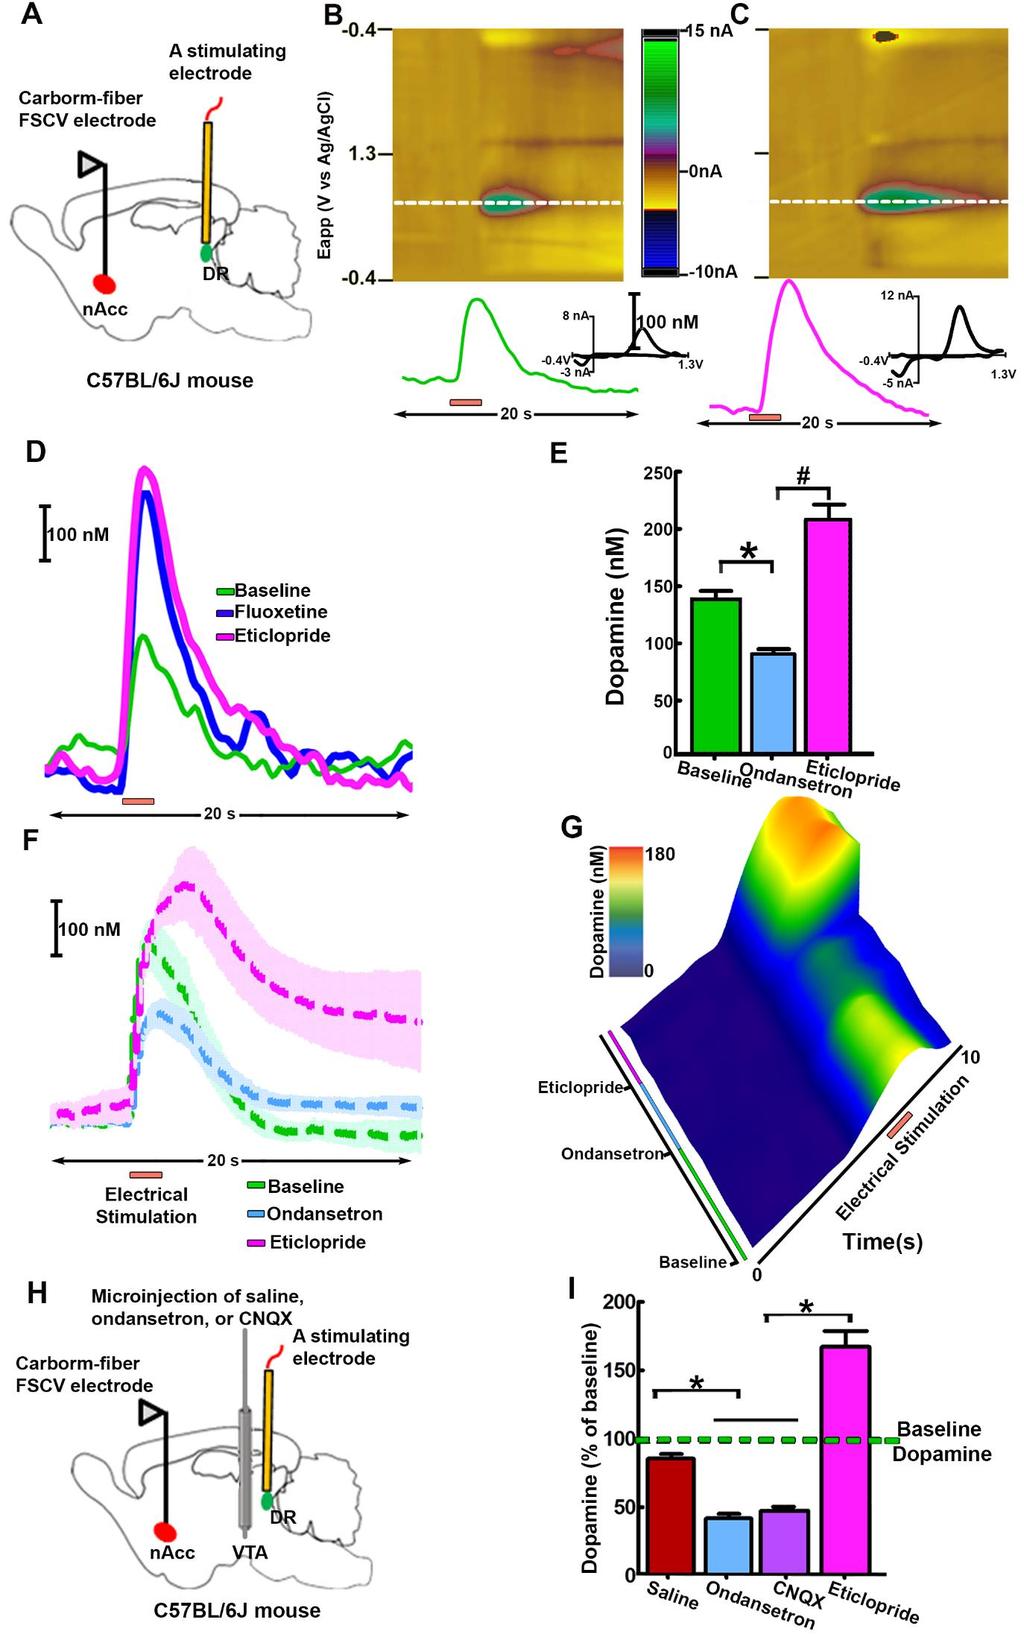
6 Figure S4. Disrupting serotonin or glutamate signaling reduces dopamine release in the nacc core evoked by DR electrical stimulation. Related to Figure 4. A. Diagram showing electrical stimulation of DR neurons and measurement of dopamine release in the nacc core by FSCV. B. DR electrical stimulation evoked dopamine release in the nacc core. Representative color plot (top) and dopamine concentration trace (bottom) show increase in the release of dopamine in the nacc core evoked by DR electrical stimulation. Top: Color plot topographically illustrates the voltammetric data with time on the x-axis, applied scan potential (E app) on the y-axis, and backgroundsubtracted faradaic current shown on the z-axis in pseudocolor. Dopamine is identified by an oxidation peak (green) at +0.6 V and a smaller reduction peak (yellow, top) at -0.2 V. Bottom: Corresponding tracer shows the concentration of dopamine (nm) detected in response to electrical stimulation. Onset of the bipolar stimulation was at 5 s with 300 µa, 60 Hz and 120 pulses (red bar). Inset shows characteristic dopamine voltammogram. C. Systemic administration of D 2 receptor antagonist eticlopride increases release of dopamine in the nacc core evoked by DR electrical stimulation. Top: Eticlopride treatment (2 mg/kg, i.p.) increases release of dopamine induced by DR electrical stimulation due to D 2 autoreceptor blockade. Bottom: Corresponding tracer indicates the concentration of dopamine (nm) in response to electrical stimulation after systemic administration of eticlopride. Inset shows characteristic dopamine voltammogram. D. The 5-HT reuptake inhibitor fluoxetine does not change dopamine time course evoked by DR electrical stimulation in comparison with eticlopride treatment. Lines indicate dopamine concentrations in the nacc core after DR electrical stimulation prior to drug treatment (baseline, green line), and after i.p. injection of fluoxetine (10 mg/kg, blue line) or eticlopride (2 mg/kg, pink line). E. Systemic administration of the 5-HT 3 receptor antagonist ondansetron significantly decreases dopamine levels evoked by DR stimulation. Bars indicate dopamine concentrations in the nacc core after DR electrical stimulation prior to drug treatment (baseline, green bar), and after injection of ondansetron (2 mg/kg, i.p., blue bar) or eticlopride (2 mg/kg, i.p., pink bar). The decreasing effect of ondansetron is reversed by systemic administration of eticlopride. Data are shown as mean + s.e.m. (n = 4 each group). A significant difference versus baseline or eticlopride treatment is indicated by * or # (main effect group: F 2, 12 = 44.12, P = , one-way repeated measures ANOVA; * P = 0.001, # P = , Newman Keuls post-hoc test). F. Dopamine concentration in the nacc core is decreased by systemic administration of ondansetron. Tracers show the average concentration of dopamine (nm) in the nacc core after DR stimulation prior to drug treatment (baseline, green line), and after i.p. injection of ondansetron (blue line) or eticlopride (pink line). G. A representative surface-plot illustrates changes in dopamine concentration (z-axis), across drug treatment (y-axis) evoked by DR electrical stimulation prior to drug treatment (baseline, green line) and after ondansetron (blue line) or eticlopride (pink line). H. Diagram showing microinjection of saline, 5-HT 3 receptor antagonist ondansetron, or AMPA receptor antagonist CNQX into the VTA, and measurement of dopamine release in the nacc core evoked by DR electrical stimulation. I. Disrupting serotonin or glutamate signaling in the VTA reduces dopamine release in the nacc core evoked by DR electrical stimulation. Intra-VTA microinjection of 5-HT 3 receptor antagonist ondansetron or AMPA receptor antagonist CNQX significantly decreases dopamine release evoked in the nacc core by DR electrical stimulation. Evoked dopamine release in the nacc core by DR electrical stimulation prior to drug treatments (baseline, green dashed line), after intra-vta injection of saline (red bar), ondansetron (3 µg/0.3 µl, blue bar), CNQX (3 µg/0.3 µl, purple bar) or after i.p. injection of eticlopride (2 mg/kg, pink bar). Data are represented as mean + s.e.m. (n = 4 each group). A significant difference versus saline group or eticlopride treatment is indicated by * (main effect group: F 3, 12 = 26.11, P = , two-way ANOVA; * P < 0.001, Newman Keuls post-hoc test, see P value in table 2).

7 Figure S5. Histological verification of electrode, microinjectors and microdialysis probes placements in wild type mice or SERT::Cre mice. Related to Figure 4. A. Electrical lesions were used to verify stimulating electrode placements in the DR. Coronal DR sections were stained with cresylviolet. Arrow points to an example of an electrical lesion hole in the DR. B. Histological verification of VTA microinjection site. A representative VTA coronal section is shown as black ink infusion (arrow) into the VTA after microinjections of ondansetron or CNQX. C-D. DR and VTA expression of ChR2-mCherry under the SERT promoter (SERT::Cre mice). Detection of mcherry in the DR (c) and VTA (d,d ) of SERT-ChR2-mCherry mice. C. mcherry is seen in cell bodies (arrows) and processes (arrowheads). D,D, mcherry is seen in processes within the VTA (arrowheads, closer view in D ). Aq, aqueduct; ml, medial lemniscus; mlf, medial longitudinal fasciculus. Scale bars represent 1000 μm in (A and B), 200 μm in (C and D), and 40 μm in (D ). E. Microinjector tips in the VTA of SERT-ChR2-eYFP mice are indicated by red squares (ACSF group), green triangles (CNQX group) or purple circles (ondansetron group) in the schematic brain drawings. fr, fasciculus retroflexus; IPF, interpeduncular fossa; ml, medial lemniscus; RLi, rostral liner raphe; RPC, red nucleus parvicellular part; SNC, substantia nigra compacta part; SNR, substantia nigra reticulata part. F. Representative microdialysis probe tracks in the nacc of a SERT-ChR2-eYFP mouse (bregma 1.10 mm). G. Microdialysis probes placements in the nacc are indicated by red (ACSF group), green (CNQX group) or purple (ondansetron) line segments in the schematic brain drawings. aca, anterior commissure anterior part; AcbC, accumbens nucleus core; Acbsh, accumbens nucleus shell; CPu, caudate putamen; LV, lateral ventricle. Diagrams were adapted from mouse atlas.
8
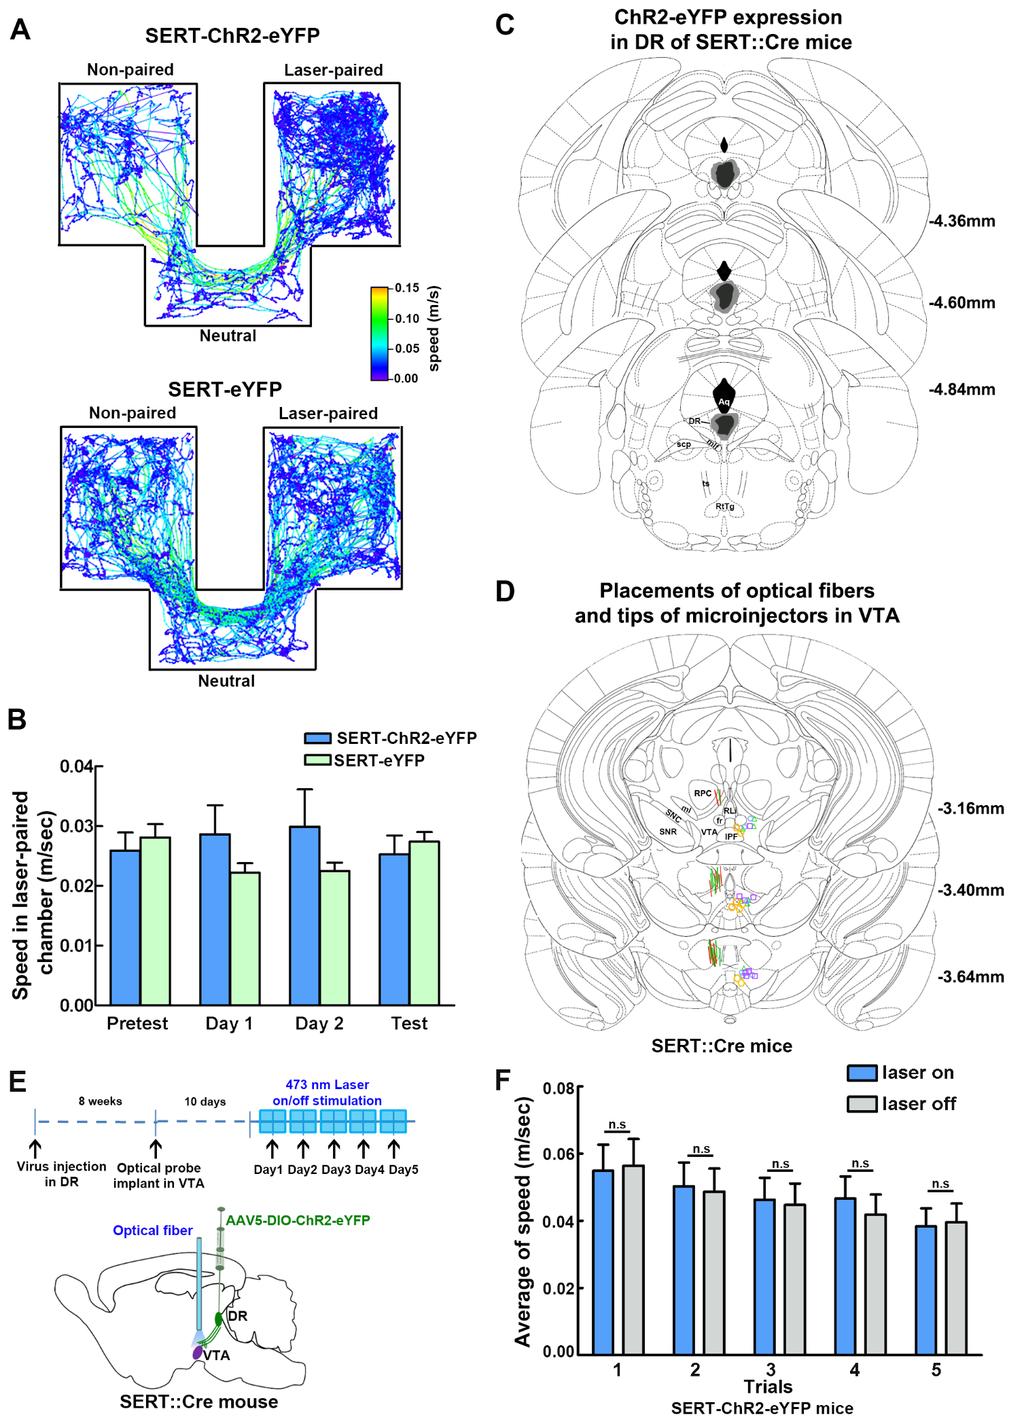
9 Figure S6. SERT-ChR2-eYFP mice show preference to the laser-paired chamber. Related to Figure 5. A. ChR2-eYFP mice spent more time in the laser-paired chamber on test day. Tracking data showing representative traces from a ChR2-eYFP (top) or an eyfp (bottom) mouse on test day. B. Laser stimulation does not alter locomotor activity. Bars show the average speed (m/s) for each group of mice in pretest day, laser-paired training days and test day (F 1,24 =1.34, P = 0.26, SERT-ChR2- eyfp mice versus SERT-eYFP mice). C. Maximal (grey) and minimal (black) cellular viral infection within the DR. Coronal sections coordinates are indicated with reference to the mouse atlas. Aq, aqueduct; DR, dorsal raphe; mlf, medial longitudinal fasciculus; RtTg, reticulotegmental nucleus of the pons; scp, superior cerebellar peduncle; ts, tectospinal tract. D. Optical fibers placements and tips of microinjectors in VTA. Lines indicate the location of optical fibers within the VTA of SERT-ChR2-eYFP (green) or SERTeYFP (red) mice. Microinjector tips in VTA of SERT-ChR2-eYFP mice are indicated by green triangles (ACSF group), blue circles (ondansetron group), orange rectangles (ketanserin group) and purple squares (CNQX group). E. Diagram showing experiment timeline, virus injection in DR of SERT::Cre mice, and VTA optical activation of DR SERT terminals. F. VTA optical activation of DR inputs does not alter locomotor activity of SERT-ChR2-eYFP mice. Mouse locomotor activity were measured daily in an open field chamber in the five trials with and without optical stimulation (two-way ANOVA, optical stimulation effect: F 1,9 = 1.201, P = n = 10). All values are represented as mean + s.e.m. fr, fasciculus retroflexus; IPF, interpeduncular fossa; ml, medial lemniscus; RLi, rostral liner raphe; RPC, red nucleus parvicellular part; SNC, substantia nigra compacta part; SNR, substantia nigra reticulata part.
 or orange (SERT-ChR2-eYFP mice) line segments in the schematic brain drawings.")
10 Figure S7. Localization of optical fibers in the VTA of SERT::Cre or VGluT3::Cre mice. Related to Figure 6. A. Representative optical fiber track in VTA of a SERT-ChR2-eYFP mouse. B. Optical fibers placements in the VTA are indicated by blue (VGluT3-ChR2-eYFP mice) or orange (SERT-ChR2-eYFP mice) line segments in the schematic brain drawings. fr, fasciculus retroflexus; IPF, interpeduncular fossa; ml, medial lemniscus; RLi, rostral liner raphe; RPC, red nucleus parvicellular part; SNC, substantia nigra compacta part; SNR, substantia nigra reticulata part.
11 Table S1. Frequency of TH neurons coexpressing 5-HT3A mrna in the VTA a. Related to Figure 4. bregma (mm) subject Percentage of TH neurons coexpressing 5-HT3A within the total population of 5-HT3A neurons in the VTA Percentage of TH neurons coexpressing 5-HT3A within the total population of TH neurons in the VTA % (n = 115) 29.6% (n = 115) % (n = 99) 30.8% (n = 99) % (n = 108) 30.3% (n = 108) mean ± s.e.m ± 1.7% (n = 322) 30.3 ± 0.4% (n = 322) % (n = 148) 24.4% (n = 148) % (n = 138) 27.5% (n = 138) % (n = 181) 28.4% (n = 181) mean ± s.e.m ± 0.4% (n = 464) 26.8 ± 1.2% (n = 464) % (n = 163) 26.6% (n = 163) % (n = 128) 27.9% (n = 128) % (n = 131) 26.0% (n = 131) mean ± s.e.m ± 0.7% (n = 422) 26.9 ± 0.6% (n = 422) a TH neurons coexpressing 5-HT3A mrna were counted in 12 µm thick sections from 3 different rats (subject 1, 2, 3). n = total number of TH neurons coexpressing 5-HT3A mrna in the VTA.
12 Table S2. P value corresponded to each figure. Figure P value In comparison with Statistical method Figure 4F Time 40 min 40 min vs. 20 min Newman keuls post hoc test Figure 4F Time 40 min 40 min vs. 30 min Newman keuls post hoc test Figure 4F Time 40 min 40 min vs. 50 min Newman keuls post hoc test Figure 4F Time 40 min 40 min vs. 60 min Newman keuls post hoc test Figure 4F Time 40 min 40 min vs. 70 min Newman keuls post hoc test Figure 4F Time 40 min 40 min vs. 80 min Newman keuls post hoc test Laser-paired vs. non-paired on day 1 Newman keuls post hoc test Sert-ChR2-eYFP Laser-paired vs. non-paired on day 2 Newman keuls post hoc test Sert-ChR2-eYFP Laser-paired vs. non-paired on test 1 Newman keuls post hoc test Sert-ChR2-eYFP Laser-paired vs. non-paired on test 2 Newman keuls post hoc test Sert-ChR2-eYFP Laser-paired vs. non-paired on test 3 Newman keuls post hoc test Sert-ChR2-eYFP Laser-paired vs. non-paired on test 4 Newman keuls post hoc test Sert-ChR2-eYFP Laser-paired vs. non-paired on day 1 Newman keuls post hoc test VGluT3-ChR2-eYFP Laser-paired vs. non-paired on day 2 Newman keuls post hoc test VGluT3-ChR2-eYFP Laser-paired vs. non-paired on test 1 Newman keuls post hoc test VGluT3-ChR2-eYFP Laser-paired vs. non-paired on test 2 Newman keuls post hoc test VGluT3-ChR2-eYFP Laser-paired vs. non-paired on test 3 Newman keuls post hoc test VGluT3-ChR2-eYFP Laser-paired vs. non-paired on test 4 Newman keuls post hoc test VGluT3-ChR2-eYFP Figure 3I s vs. baseline Newman keuls post hoc test Figure 3I s vs. baseline Newman keuls post hoc test Figure 3I s vs. baseline Newman keuls post hoc test Figure 3I s vs. baseline Newman keuls post hoc test Figure 3I s vs. baseline Newman keuls post hoc test Figure 3I s vs. baseline Newman keuls post hoc test Figure 3J s vs. baseline Newman keuls post hoc test Figure 3J s vs. baseline Newman keuls post hoc test Figure 3J s vs. baseline Newman keuls post hoc test Figure 3J s vs. baseline Newman keuls post hoc test Figure 3J s vs. baseline Newman keuls post hoc test Figure 3J s vs. baseline Newman keuls post hoc test SupplementaryFigure 4I 0.01 Ondansetron vs. saline Newman keuls post hoc test Supplementary Figure 4I 0.04 CNQX vs. saline Newman keuls post hoc test Supplementary Figure 4I Ondansetron vs. eticlopride Newman keuls post hoc test Supplementary Figure 4I CNQX vs. eticlopride Newman keuls post hoc test
Nature Neuroscience: doi: /nn Supplementary Figure 1
 Supplementary Figure 1 Subcellular segregation of VGluT2-IR and TH-IR within the same VGluT2-TH axon (wild type rats). (a-e) Serial sections of a dual VGluT2-TH labeled axon. This axon (blue outline) has
Supplementary Figure 1
 Supplementary Figure 1 Localization of virus injections. (a) Schematic showing the approximate center of AAV-DIO-ChR2-YFP injection sites in the NAc of Dyn-cre mice (n=8 mice, 16 injections; caudate/putamen,
Nature Neuroscience: doi: /nn Supplementary Figure 1. Diverse anorexigenic signals induce c-fos expression in CEl PKC-δ + neurons
 Supplementary Figure 1 Diverse anorexigenic signals induce c-fos expression in CEl PKC-δ + neurons a-c. Quantification of CEl c-fos expression in mice intraperitoneal injected with anorexigenic drugs (a),
Dopamine in Ube3a m-/p+ mice. Online Supplemental Material
 Online Supplemental Material S1 Supplemental Figure 1. Schematic of rate-dependent intracranial self-stimulation (ICSS) (A) Mice implanted with monopolar stimulating electrodes to the medial forebrain
Supplementary Figure 1
 Supplementary Figure 1 Miniature microdrive, spike sorting and sleep stage detection. a, A movable recording probe with 8-tetrodes (32-channels). It weighs ~1g. b, A mouse implanted with 8 tetrodes in
Supplementary figure 1: LII/III GIN-cells show morphological characteristics of MC
 1 2 1 3 Supplementary figure 1: LII/III GIN-cells show morphological characteristics of MC 4 5 6 7 (a) Reconstructions of LII/III GIN-cells with somato-dendritic compartments in orange and axonal arborizations
Nature Neuroscience: doi: /nn.4335
 Supplementary Figure 1 Cholinergic neurons projecting to the VTA are concentrated in the caudal mesopontine region. (a) Schematic showing the sites of retrograde tracer injections in the VTA: cholera toxin
Supplemental Information. A Visual-Cue-Dependent Memory Circuit. for Place Navigation
 Neuron, Volume 99 Supplemental Information A Visual-Cue-Dependent Memory Circuit for Place Navigation Han Qin, Ling Fu, Bo Hu, Xiang Liao, Jian Lu, Wenjing He, Shanshan Liang, Kuan Zhang, Ruijie Li, Jiwei
Nature Neuroscience: doi: /nn Supplementary Figure 1. Distribution of starter cells for RV-mediated retrograde tracing.
 Supplementary Figure 1 Distribution of starter cells for RV-mediated retrograde tracing. Parcellation of cortical areas is based on Allen Mouse Brain Atlas and drawn to scale. Thick white curves, outlines
Nature Neuroscience: doi: /nn Supplementary Figure 1. Confirmation that optogenetic inhibition of dopaminergic neurons affects choice
 Supplementary Figure 1 Confirmation that optogenetic inhibition of dopaminergic neurons affects choice (a) Sample behavioral trace as in Figure 1d, but with NpHR stimulation trials depicted as green blocks
Hormonal gain control of a medial preoptic area social reward circuit
 CORRECTION NOTICE Nat. Neurosci. 20, 449 458 (2017) Hormonal gain control of a medial preoptic area social reward circuit Jenna A McHenry, James M Otis, Mark A Rossi, J Elliott Robinson, Oksana Kosyk,
Nature Neuroscience: doi: /nn Supplementary Figure 1. Trial structure for go/no-go behavior
 Supplementary Figure 1 Trial structure for go/no-go behavior a, Overall timeline of experiments. Day 1: A1 mapping, injection of AAV1-SYN-GCAMP6s, cranial window and headpost implantation. Water restriction
Supplementary Figure 1
 Supplementary Figure 1 Arcuate ChIEF-tdTomato neurons expressed TH These micrographs show that TH-Cre-ChIEF-tdTomato (magenta), expressed by AAV in a TH-Cre mouse, were immunostained with TH (green) in
-80 Figure 1. Identification of dopaminergic neurons in. VTA slices (a) Micrographs demonstrate the location of the VTA with
 Micrographs demonstrate the location of the VTA with") Potential (mv) A B C Potential (mv) D E F Biocytin TH Merge R 12 12 1 1 8 G 6 4 8 6 4 H 2 2-2 -2-4 -4-6 -6 Supplemental -8-8 Figure 1. Identification of dopaminergic neurons in -1 VTA slices. -1 (a) Micrographs
Potential (mv) A B C Potential (mv) D E F Biocytin TH Merge R 12 12 1 1 8 G 6 4 8 6 4 H 2 2-2 -2-4 -4-6 -6 Supplemental -8-8 Figure 1. Identification of dopaminergic neurons in -1 VTA slices. -1 (a) Micrographs
Nature Neuroscience: doi: /nn Supplementary Figure 1
 Supplementary Figure 1 Drd1a-Cre driven ChR2 expression in the SCN. (a) Low-magnification image of a representative Drd1a-ChR2 coronal brain section (n = 2) showing endogenous tdtomato fluorescence (magenta).
Supplementary Figure 1. Recording sites.
 Supplementary Figure 1 Recording sites. (a, b) Schematic of recording locations for mice used in the variable-reward task (a, n = 5) and the variable-expectation task (b, n = 5). RN, red nucleus. SNc,
Nature Neuroscience: doi: /nn Supplementary Figure 1
 Supplementary Figure 1 Reward rate affects the decision to begin work. (a) Latency distributions are bimodal, and depend on reward rate. Very short latencies (early peak) preferentially occur when a greater
Nature Neuroscience: doi: /nn Supplementary Figure 1
 Supplementary Figure 1 Atlas representations of the midcingulate (MCC) region targeted in this study compared against the anterior cingulate (ACC) region commonly reported. Coronal sections are shown on
Nucleus Accumbens Subnuclei Regulate Motivated Behavior via Direct Inhibition and Disinhibition of VTA Dopamine Subpopulations
 Article Nucleus Accumbens Subnuclei Regulate Motivated Behavior via Direct Inhibition and Disinhibition of VTA Dopamine Subpopulations Highlights d Mesolimbic DA subpopulations are embedded within different
SUPPLEMENTARY INFORMATION
 doi: 10.1038/nature06310 SUPPLEMENTARY INFORMATION www.nature.com/nature 1 www.nature.com/nature 2 www.nature.com/nature 3 Supplementary Figure S1 Spontaneous duration of wake, SWS and REM sleep (expressed
Nature Neuroscience: doi: /nn Supplementary Figure 1
 Supplementary Figure 1 Distribution of GlyT2::eGFP fibers in the mouse thalamus at three different coronal levels. Note the innervation centered in the rostral (CL, PC) and caudal (PF) nuclear groups of
SUPPLEMENTARY INFORMATION
 SUPPLEMENTARY INFORMATION doi:10.1038/nature12024 entary Figure 1. Distribution of the number of earned cocaine Supplementary Figure 1. Distribution of the number of earned cocaine infusions in Shock-sensitive
Nature Neuroscience: doi: /nn.4642
 Supplementary Figure 1 Recording sites and example waveform clustering, as well as electrophysiological recordings of auditory CS and shock processing following overtraining. (a) Recording sites in LC
Lack of GPR88 enhances medium spiny neuron activity and alters. motor- and cue- dependent behaviors
 Lack of GPR88 enhances medium spiny neuron activity and alters motor- and cue- dependent behaviors Albert Quintana, Elisenda Sanz, Wengang Wang, Granville P. Storey, Ali D. Güler Matthew J. Wanat, Bryan
Zhu et al, page 1. Supplementary Figures
 Zhu et al, page 1 Supplementary Figures Supplementary Figure 1: Visual behavior and avoidance behavioral response in EPM trials. (a) Measures of visual behavior that performed the light avoidance behavior
Nature Neuroscience doi: /nn Supplementary Figure 1. Characterization of viral injections.
 Supplementary Figure 1 Characterization of viral injections. (a) Dorsal view of a mouse brain (dashed white outline) after receiving a large, unilateral thalamic injection (~100 nl); demonstrating that
SUPPLEMENTARY INFORMATION. Supplementary Figure 1
 SUPPLEMENTARY INFORMATION Supplementary Figure 1 The supralinear events evoked in CA3 pyramidal cells fulfill the criteria for NMDA spikes, exhibiting a threshold, sensitivity to NMDAR blockade, and all-or-none
Supplementary Figure 1. Basic properties of compound EPSPs at
 Supplementary Figure 1. Basic properties of compound EPSPs at hippocampal CA3 CA3 cell synapses. (a) EPSPs were evoked by extracellular stimulation of the recurrent collaterals and pharmacologically isolated
Nature Neuroscience: doi: /nn Supplementary Figure 1. ACx plasticity is required for fear conditioning.
 Supplementary Figure 1 ACx plasticity is required for fear conditioning. (a) Freezing time of conditioned and control mice before CS presentation and during CS presentation in a new context. Student s
Supplementary Figure 1. SybII and Ceb are sorted to distinct vesicle populations in astrocytes. Nature Neuroscience: doi: /nn.
 Supplementary Figure 1 SybII and Ceb are sorted to distinct vesicle populations in astrocytes. (a) Exemplary images for cultured astrocytes co-immunolabeled with SybII and Ceb antibodies. SybII accumulates
Nature Methods: doi: /nmeth Supplementary Figure 1. Activity in turtle dorsal cortex is sparse.
 Supplementary Figure 1 Activity in turtle dorsal cortex is sparse. a. Probability distribution of firing rates across the population (notice log scale) in our data. The range of firing rates is wide but
Nature Neuroscience: doi: /nn Supplementary Figure 1. Lick response during the delayed Go versus No-Go task.
 Supplementary Figure 1 Lick response during the delayed Go versus No-Go task. Trial-averaged lick rate was averaged across all mice used for pyramidal cell imaging (n = 9). Different colors denote different
Supplementary Figure 1) GABAergic enhancement by leptin hyperpolarizes POMC neurons A) Representative recording samples showing the membrane
 GABAergic enhancement by leptin hyperpolarizes POMC neurons A) Representative recording samples showing the membrane") Supplementary Figure 1) GABAergic enhancement by leptin hyperpolarizes POMC neurons A) Representative recording samples showing the membrane potential recorded from POMC neurons following treatment with
Supplementary Figure 1) GABAergic enhancement by leptin hyperpolarizes POMC neurons A) Representative recording samples showing the membrane potential recorded from POMC neurons following treatment with
Astrocyte signaling controls spike timing-dependent depression at neocortical synapses
 Supplementary Information Astrocyte signaling controls spike timing-dependent depression at neocortical synapses Rogier Min and Thomas Nevian Department of Physiology, University of Berne, Bern, Switzerland
Nature Neuroscience: doi: /nn Supplementary Figure 1. Large-scale calcium imaging in vivo.
 Supplementary Figure 1 Large-scale calcium imaging in vivo. (a) Schematic illustration of the in vivo camera imaging set-up for large-scale calcium imaging. (b) High-magnification two-photon image from
Structural basis for the role of inhibition in facilitating adult brain plasticity
 Structural basis for the role of inhibition in facilitating adult brain plasticity Jerry L. Chen, Walter C. Lin, Jae Won Cha, Peter T. So, Yoshiyuki Kubota & Elly Nedivi SUPPLEMENTARY FIGURES 1-6 a b M
File name: Supplementary Information Description: Supplementary Figures, Supplementary Table and Supplementary References
 File name: Supplementary Information Description: Supplementary Figures, Supplementary Table and Supplementary References File name: Supplementary Data 1 Description: Summary datasheets showing the spatial
Anatomy of the basal ganglia. Dana Cohen Gonda Brain Research Center, room 410
 Anatomy of the basal ganglia Dana Cohen Gonda Brain Research Center, room 410 danacoh@gmail.com The basal ganglia The nuclei form a small minority of the brain s neuronal population. Little is known about
Supplementary Figure 1. Microglia do not show signs of classical immune activation following MD a-b. Images showing immunoreactivity for MHCII (a)
") 1 Supplementary Figure 1. Microglia do not show signs of classical immune activation following MD a-b. Images showing immunoreactivity for MHCII (a) and CD45 (b) in fixed sections of binocular visual cortex
1 Supplementary Figure 1. Microglia do not show signs of classical immune activation following MD a-b. Images showing immunoreactivity for MHCII (a) and CD45 (b) in fixed sections of binocular visual cortex
Nature Neuroscience: doi: /nn Supplementary Figure 1. Visualization of AT1a-positive cells using AT1a lacz/+ mouse.
 Supplementary Figure 1 Visualization of AT1a-positive cells using AT1a lacz/+ mouse. (a f) Immunohistochemical detection of β-gal in the mouse brain. Coronal sections at the respective anteroposterior
Supplementary Figure 1. Nature Neuroscience: doi: /nn.4547
 Supplementary Figure 1 Characterization of the Microfetti mouse model. (a) Gating strategy for 8-color flow analysis of peripheral Ly-6C + monocytes from Microfetti mice 5-7 days after TAM treatment. Living
Supporting Information
 ATP from synaptic terminals and astrocytes regulates NMDA receptors and synaptic plasticity through PSD- 95 multi- protein complex U.Lalo, O.Palygin, A.Verkhratsky, S.G.N. Grant and Y. Pankratov Supporting
Supplementary Figure 1 Information on transgenic mouse models and their recording and optogenetic equipment. (a) 108 (b-c) (d) (e) (f) (g)
 108 (b-c) (d) (e) (f) (g)") Supplementary Figure 1 Information on transgenic mouse models and their recording and optogenetic equipment. (a) In four mice, cre-dependent expression of the hyperpolarizing opsin Arch in pyramidal cells
Supplementary Figure 1 Information on transgenic mouse models and their recording and optogenetic equipment. (a) In four mice, cre-dependent expression of the hyperpolarizing opsin Arch in pyramidal cells
Reward prediction based on stimulus categorization in. primate lateral prefrontal cortex
 Reward prediction based on stimulus categorization in primate lateral prefrontal cortex Xiaochuan Pan, Kosuke Sawa, Ichiro Tsuda, Minoro Tsukada, Masamichi Sakagami Supplementary Information This PDF file
Tuning properties of individual circuit components and stimulus-specificity of experience-driven changes.
 Supplementary Figure 1 Tuning properties of individual circuit components and stimulus-specificity of experience-driven changes. (a) Left, circuit schematic with the imaged component (L2/3 excitatory neurons)
Nature Neuroscience: doi: /nn Supplementary Figure 1
 Supplementary Figure 1 Relative expression of K IR2.1 transcript to enos was reduced 29-fold in capillaries from knockout animals. Relative expression of K IR2.1 transcript to enos was reduced 29-fold
Wenqin Hu, Cuiping Tian, Tun Li, Mingpo Yang, Han Hou & Yousheng Shu
 Distinct contributions of Na v 1.6 and Na v 1.2 in action potential initiation and backpropagation Wenqin Hu, Cuiping Tian, Tun Li, Mingpo Yang, Han Hou & Yousheng Shu Supplementary figure and legend Supplementary
SUPPLEMENTARY INFORMATION
 Supplementary Figure 1. Normal AMPAR-mediated fepsp input-output curve in CA3-Psen cdko mice. Input-output curves, which are plotted initial slopes of the evoked fepsp as function of the amplitude of the
Ube3a is required for experience-dependent maturation of the neocortex
 Ube3a is required for experience-dependent maturation of the neocortex Koji Yashiro, Thorfinn T. Riday, Kathryn H. Condon, Adam C. Roberts, Danilo R. Bernardo, Rohit Prakash, Richard J. Weinberg, Michael
Nature Neuroscience: doi: /nn Supplementary Figure 1. Splenic atrophy and leucopenia caused by T3 SCI.
 Supplementary Figure 1 Splenic atrophy and leucopenia caused by T3 SCI. (a) Gross anatomy of representative spleens from control and T3 SCI mice at 28 days post-injury. (b and c) Hematoxylin and eosin
SUPPLEMENTARY INFORMATION
 Supplementary Figure 1. Behavioural effects of ketamine in non-stressed and stressed mice. Naive C57BL/6 adult male mice (n=10/group) were given a single dose of saline vehicle or ketamine (3.0 mg/kg,
SUPPLEMENTARY INFORMATION
 SUPPLEMENTARY INFORMATION doi:10.1038/nature11306 Supplementary Figures Supplementary Figure 1. Basic characterization of GFP+ RGLs in the dentate gyrus of adult nestin-gfp mice. a, Sample confocal images
Supplementary Materials for
 advances.sciencemag.org/cgi/content/full/1/10/e1500775/dc1 Supplementary Materials for Structural-functional connectivity deficits of neocortical circuits in the Fmr1 /y mouse model of autism Matthias
Supplemental Figure 1
 A C E Supplemental Figure 1 AP 1mm A+C 1mm Apo 1mm B D 1mm CGS F 1mm All 1mm Supplemental Figure 1. The locations of microinfusion cannulae. Each dot represents the cannula tip of a given rat in Figure.
Nature Neuroscience: doi: /nn Supplementary Figure 1. MADM labeling of thalamic clones.
 Supplementary Figure 1 MADM labeling of thalamic clones. (a) Confocal images of an E12 Nestin-CreERT2;Ai9-tdTomato brain treated with TM at E10 and stained for BLBP (green), a radial glial progenitor-specific
Neuroscience 201A (2016) - Problems in Synaptic Physiology
 - Problems in Synaptic Physiology") Question 1: The record below in A shows an EPSC recorded from a cerebellar granule cell following stimulation (at the gap in the record) of a mossy fiber input. These responses are, then, evoked by stimulation.
Question 1: The record below in A shows an EPSC recorded from a cerebellar granule cell following stimulation (at the gap in the record) of a mossy fiber input. These responses are, then, evoked by stimulation.
Clarke's Column Neurons as the Focus of a Corticospinal Corollary Circuit. Supplementary Information. Adam W. Hantman and Thomas M.
 Clarke's Column Neurons as the Focus of a Corticospinal Corollary Circuit Supplementary Information Adam W. Hantman and Thomas M. Jessell Supplementary Results Characterizing the origin of primary
Social deficits in Shank3-deficient mouse models of autism are rescued by histone deacetylase (HDAC) inhibition
 inhibition") SUPPLEMENTARY INFORMATION Articles https://doi.org/10.1038/s41593-018-0110-8 In the format provided by the authors and unedited. Social deficits in Shank3-deficient mouse models of autism are rescued by
SUPPLEMENTARY INFORMATION Articles https://doi.org/10.1038/s41593-018-0110-8 In the format provided by the authors and unedited. Social deficits in Shank3-deficient mouse models of autism are rescued by
Supplementary Information
 Supplementary Information D-Serine regulates cerebellar LTD and motor coordination through the 2 glutamate receptor Wataru Kakegawa, Yurika Miyoshi, Kenji Hamase, Shinji Matsuda, Keiko Matsuda, Kazuhisa
Suppl. Information Supplementary Figure 1. Strategy/latency analysis of individual mice during maze learning. a,
 Goal-oriented searching mediated by ventral hippocampus early in trial-and-error learning Ruediger, S, Spirig, D., Donato, F., Caroni, P. Suppl. Information Supplementary Figure 1. Strategy/latency analysis
Nature Neuroscience: doi: /nn Supplementary Figure 1
 Supplementary Figure 1 Bidirectional optogenetic modulation of the tonic activity of CEA PKCδ + neurons in vitro. a, Top, Cell-attached voltage recording illustrating the blue light-induced increase in
Internal Organisation of the Brainstem
 Internal Organisation of the Brainstem Major tracts and nuclei of the brainstem (Notes) The brainstem is the major pathway for tracts and houses major nuclei, that contain sensory, motor and autonomics
Supplementary Figure 1. Verification of drug infusions into the IPN. a. Representative
 Supplementary Figure 1. Verifiation of drug infusions into the IPN. a. Representative neutral red-stained oronal setion from a mouse with a guide annula targeting the IPN. The guide annula sar is irled
Fig.1: A, Sagittal 110x110 mm subimage close to the midline, passing through the cingulum. Note that the fibers of the corpus callosum run at a
 Fig.1 E Fig.1:, Sagittal 110x110 mm subimage close to the midline, passing through the cingulum. Note that the fibers of the corpus callosum run at a slight angle are through the plane (blue dots with
Supplemental Information. A Labeled-Line Neural Circuit. for Pheromone-Mediated Sexual Behaviors in Mice
 Neuron, Volume Supplemental Information A Labeled-Line Neural Circuit for Pheromone-Mediated Sexual Behaviors in Mice Kentaro K. Ishii, Takuya Osakada, Hiromi Mori, Nobuhiko Miyasaka, Yoshihiro Yoshihara,
Two distinct mechanisms for experiencedependent
 SUPPLEMENTARY INFORMATION Articles https://doi.org/10.1038/s41593-018-0150-0 In the format provided by the authors and unedited. Two distinct mechanisms for experiencedependent homeostasis Michelle C.
Nature Neuroscience: doi: /nn Supplementary Figure 1. Iliopsoas and quadratus lumborum motor neurons in the L2 spinal segment.
 Supplementary Figure 1 Iliopsoas and quadratus lumborum motor neurons in the L2 spinal segment. (A) IL and QL motor neurons were labeled after CTb-488 (green) muscle injections at birth. At P4, the L2
Theta sequences are essential for internally generated hippocampal firing fields.
 Theta sequences are essential for internally generated hippocampal firing fields. Yingxue Wang, Sandro Romani, Brian Lustig, Anthony Leonardo, Eva Pastalkova Supplementary Materials Supplementary Modeling
Supplementary Figure 1. SDS-FRL localization of CB 1 in the distal CA3 area of the rat hippocampus. (a-d) Axon terminals (t) in stratum pyramidale
 Axon terminals (t) in stratum pyramidale") Supplementary Figure 1. SDS-FRL localization of CB 1 in the distal CA3 area of the rat hippocampus. (a-d) Axon terminals (t) in stratum pyramidale (b) show stronger immunolabeling for CB 1 than those in
Supplementary Figure 1. SDS-FRL localization of CB 1 in the distal CA3 area of the rat hippocampus. (a-d) Axon terminals (t) in stratum pyramidale (b) show stronger immunolabeling for CB 1 than those in
1/2/2019. Basal Ganglia & Cerebellum a quick overview. Outcomes you want to accomplish. MHD-Neuroanatomy Neuroscience Block. Basal ganglia review
 This power point is made available as an educational resource or study aid for your use only. This presentation may not be duplicated for others and should not be redistributed or posted anywhere on the
Nature Neuroscience: doi: /nn Supplementary Figure 1
 Supplementary Figure 1 Quantification of myelin fragments in the aging brain (a) Electron microscopy on corpus callosum is shown for a 18-month-old wild type mice. Myelin fragments (arrows) were detected
SUPPLEMENTARY INFORMATION
 doi:10.1038/nature11436 Supplementary Figure 1. CRF peptide is localized cholinergic interneurons throughout the nucleus accumbens. Immunofluorescent images demonstrating localization of CRF peptide, tyrosine
Kappa Opioid Receptor Activation Potentiates the Cocaine-Induced Increase in Evoked Dopamine Release Recorded In Vivo in the Mouse Nucleus Accumbens
 (214) 39, 336 348 & 214 American College of. All rights reserved 893-133X/14 www.neuropsychopharmacology.org Kappa Opioid Receptor Activation Potentiates the aine-induced Increase in Evoked Dopamine Release
Damage on one side.. (Notes) Just remember: Unilateral damage to basal ganglia causes contralateral symptoms.
 Just remember: Unilateral damage to basal ganglia causes contralateral symptoms.") Lecture 20 - Basal Ganglia Basal Ganglia (Nolte 5 th Ed pp 464) Damage to the basal ganglia produces involuntary movements. Although the basal ganglia do not influence LMN directly (to cause this involuntary
Lecture 20 - Basal Ganglia Basal Ganglia (Nolte 5 th Ed pp 464) Damage to the basal ganglia produces involuntary movements. Although the basal ganglia do not influence LMN directly (to cause this involuntary
Short- and long-lasting consequences of in vivo nicotine treatment
 Short- and long-lasting consequences of in vivo nicotine treatment on hippocampal excitability Rachel E. Penton, Michael W. Quick, Robin A. J. Lester Supplementary Figure 1. Histogram showing the maximal
Supplementary Materials for VAMP4 directs synaptic vesicles to a pool that selectively maintains asynchronous neurotransmission
 Supplementary Materials for VAMP4 directs synaptic vesicles to a pool that selectively maintains asynchronous neurotransmission Jesica Raingo, Mikhail Khvotchev, Pei Liu, Frederic Darios, Ying C. Li, Denise
Supplementary Figure 1. Microdialysis measurements of extracellular dopamine in ventral and dorsal striatum.
 Supplementary Figure 1 Microdialysis measurements of extracellular dopamine in ventral and dorsal striatum. A. Behavioural preparation. Mice are placed in an operant box where a spout containing the artificial
mtorc2 controls actin polymerization required for consolidation of long-term memory
 CORRECTION NOTICE Nat. Neurosci.; doi:1.138/nn.3351 mtorc2 controls actin polymerization required for consolidation of long-term memory Wei Huang, Ping Jun Zhu, Shixing Zhang, Hongyi Zhou, Loredana Stoica,
Supplementary Figure 1: Kv7 currents in neonatal CA1 neurons measured with the classic M- current voltage-clamp protocol.
 Supplementary Figures 1-11 Supplementary Figure 1: Kv7 currents in neonatal CA1 neurons measured with the classic M- current voltage-clamp protocol. (a), Voltage-clamp recordings from CA1 pyramidal neurons
Supplemental Information. Memory-Relevant Mushroom Body. Output Synapses Are Cholinergic
 Neuron, Volume 89 Supplemental Information Memory-Relevant Mushroom Body Output Synapses Are Cholinergic Oliver Barnstedt, David Owald, Johannes Felsenberg, Ruth Brain, John-Paul Moszynski, Clifford B.
Sound waves from the auditory environment all combine in the ear canal to form a complex waveform. This waveform is deconstructed by the cochlea with
 1 Sound waves from the auditory environment all combine in the ear canal to form a complex waveform. This waveform is deconstructed by the cochlea with respect to time, loudness, and frequency and neural
-51mV 30s 3mV. n=14 n=4 p=0.4. Depolarization (mv) 3
 3") Supplementary Figure 1 a optoβ 2 -AR b ChR2-51mV 30s 3mV -50mV 30s 3mV c 4 n=14 n=4 p=0.4 Depolarization (mv) 3 2 1 0 Both optogenetic actuators, optoβ 2 AR and ChR2, were effective in stimulating astrocytes
Supplementary Figure 1 a optoβ 2 -AR b ChR2-51mV 30s 3mV -50mV 30s 3mV c 4 n=14 n=4 p=0.4 Depolarization (mv) 3 2 1 0 Both optogenetic actuators, optoβ 2 AR and ChR2, were effective in stimulating astrocytes
SUPPLEMENTARY INFORMATION
 doi:1.138/nature1139 a d Whisker angle (deg) Whisking repeatability Control Muscimol.4.3.2.1 -.1 8 4-4 1 2 3 4 Performance (d') Pole 8 4-4 1 2 3 4 5 Time (s) b Mean protraction angle (deg) e Hit rate (p
GABA injected into the anterior dorsal tegmentum ADT of the midbrain blocks stepping initiated by stimulation of the hypothalamus
 Ž. Brain Research 766 1997 271 275 Short communication Ž. GABA injected into the anterior dorsal tegmentum ADT of the midbrain blocks stepping initiated by stimulation of the hypothalamus H.M. Sinnamon
SUPPLEMENTARY INFORMATION
 SUPPLEMENTARY INFORMATION doi:10.1038/nature12107 Supplementary Figure 1. CLARITY preserves GFP and TdTomato signals. (a) 3D rendering of a 1mm-thick Thy1-EGFP M line mouse brain block processed by CLARITY
SUPPLEMENTARY INFORMATION
 doi: 10.1038/nature06994 A phosphatase cascade by which rewarding stimuli control nucleosomal response A. Stipanovich*, E. Valjent*, M. Matamales*, A. Nishi, J.H. Ahn, M. Maroteaux, J. Bertran-Gonzalez,
By Dr. Saeed Vohra & Dr. Sanaa Alshaarawy
 By Dr. Saeed Vohra & Dr. Sanaa Alshaarawy 1 By the end of the lecture, students will be able to : Distinguish the internal structure of the components of the brain stem in different levels and the specific
Nature Neuroscience: doi: /nn Supplementary Figure 1. Neuron class-specific arrangements of Khc::nod::lacZ label in dendrites.
 Supplementary Figure 1 Neuron class-specific arrangements of Khc::nod::lacZ label in dendrites. Staining with fluorescence antibodies to detect GFP (Green), β-galactosidase (magenta/white). (a, b) Class
Social transmission and buffering of synaptic changes after stress
 SUPPLEMENTARY INFORMATION Articles https://doi.org/10.1038/s41593-017-0044-6 In the format provided by the authors and unedited. Social transmission and buffering of synaptic changes after stress Toni-Lee
Supplemental information Acid-sensing ion channel 1a contributes to hippocampal LTP inducibility through multiple mechanisms
 Supplemental information Acid-sensing ion channel 1a contributes to hippocampal LTP inducibility through multiple mechanisms Ming-Gang Liu, Hu-Song Li, Wei-Guang Li, Yan-Jiao Wu, Shi-Ning Deng, Chen Huang,
Introduction to the Central Nervous System: Internal Structure
 Introduction to the Central Nervous System: Internal Structure Objective To understand, in general terms, the internal organization of the brain and spinal cord. To understand the 3-dimensional organization
Supplementary Figure 1
 Supplementary Figure 1 Supplementary Figure 1 SNARE Probes for FRET/2pFLIM Analysis Used in the Present Study. mturquoise (mtq) and Venus (Ven) are in blue and yellow, respectively. The soluble N-ethylmaleimide-sensitive
Brain anatomy and artificial intelligence. L. Andrew Coward Australian National University, Canberra, ACT 0200, Australia
 Brain anatomy and artificial intelligence L. Andrew Coward Australian National University, Canberra, ACT 0200, Australia The Fourth Conference on Artificial General Intelligence August 2011 Architectures
Supplementary Figure 1. Identification of the type II spiral ganglion neurons (SGN) via immunofluorescence of peripherin protein (PRPH).
 via immunofluorescence of peripherin protein (PRPH).") Supplementary Figure 1. Identification of the type II spiral ganglion neurons (SGN) via immunofluorescence of peripherin protein (PRPH). (a), (b), PRPH immunolabelling of cryosections from post-natal day
Supplementary Figure 1. Identification of the type II spiral ganglion neurons (SGN) via immunofluorescence of peripherin protein (PRPH). (a), (b), PRPH immunolabelling of cryosections from post-natal day
Intravital Microscopic Interrogation of Peripheral Taste Sensation
 Supplementary Information Intravital Microscopic Interrogation of Peripheral Taste Sensation Myunghwan Choi 1, Woei Ming Lee 1,2, and Seok-Hyun Yun 1 * 1 Harvard Medical School and Wellman Center for Photomedicine,
Hypothalamus. To learn how the brain regulates neuroendocrine secretions NTA Ch 14, pgs Key Figs: 14-3; 14-4,
 Hypothalamus Objectives To learn the general organization of the hypothalamus and the functions of the major nuclei NTA Ch 14, pgs. 419-422 Key Figs: 14-2, 14-3 To learn how the brain regulates neuroendocrine
SUPPLEMENTARY INFORMATION. Rett Syndrome Mutation MeCP2 T158A Disrupts DNA Binding, Protein Stability and ERP Responses
 SUPPLEMENTARY INFORMATION Rett Syndrome Mutation T158A Disrupts DNA Binding, Protein Stability and ERP Responses Darren Goffin, Megan Allen, Le Zhang, Maria Amorim, I-Ting Judy Wang, Arith-Ruth S. Reyes,
J. Cell Sci. 129: doi: /jcs : Supplementary information
 Movie 1. AgLDL is contained in small sub-regions of the lysosomal synapse that are acidic. J774 cells were incubated with agldl dual labeled with a ph sensitive and a ph insensitive fluorophore for 1 hr.
Supplementary Information
 Supplementary Information Title Degeneration and impaired regeneration of gray matter oligodendrocytes in amyotrophic lateral sclerosis Authors Shin H. Kang, Ying Li, Masahiro Fukaya, Ileana Lorenzini,
Dynamic Nigrostriatal Dopamine Biases Action Selection
 Article Dynamic Nigrostriatal Dopamine Biases Action Selection Highlights d Nigrostriatal dopamine signaling is associated with ongoing action selection Authors Christopher D. Howard, Hao Li, Claire E.