Supplemental Figure 1. CD69 antigen-response curves of CAR engrafted Jurkat T cells. Supplemental Figure 2.
|
|
|
- Joleen Gregory
- 5 years ago
- Views:
Transcription
1 Supplemental Figure 1. CD69 antigen-response curves of CAR engrafted Jurkat T cells. To evaluate the antigen sensitivity of mutant CARs transduced Jurkat T cells were stimulated with varying concentrations of immobilized CEA for 24 hours before analysis by flow cytometry for expression of the activation marker CD69. (A) Antigen responses of a panel of different CARs. (B) Antigen responses of dimer mutant CARs. (C) Antigen responses of D6 mutant CARs. (D) Antigen responses of combined C2 and D6 mutant CARs Supplemental Figure 2. Antigen sensitivity and TCR-interactions by a mutant F10A CAR. To highlight the specificity of transmembrane targeted mutations an F10A mutant receptor was generated which was hypothesized to have no functional effect on antigen sensitivity or to abrogate TCR interactions. Non-reducing immunoblot analysis of F10A CAR engrafted Jurkat T cell lysate (A). Antigen sensitivity was assessed by measuring upregulation of CD69 in response to 24 hours stimulation by immobilsed CEA (B). MA5.8 cells were transduced with the F10A mutant CAR (C) and analyzed for upregulation of CD3 surface expression (D). FCIP analysis was conducted on lysates from transduced Jurkat T cells with fold increase in anti- TCRV 8 (E) or CEAhFc/anti-hIgG (F) binding analyzed. ** p < 0.01 by 2-way ANOVA with a post-hoc Dunnet test. Data represents mean ± SD from three independent experiments. Supplemental Figure 3. Mutant CAR activity in primary human T-cells. To evaluate CAR activity in primary human T-cells transduced or non-transduced cells were first enriched and then expanded in the presence of irradiated autologous feeder cells to obtain populations with enhanced CAR expression. Cells were equilibrated with mock transduced cells to obtain populations with equivalent CAR surface expression before incubation with varying concentrations of immobilized CEA protein for 24 hours. IFN secretion was analyzed by ELISA from the CAR dimerisation panel (A) or the D6 mutant panel (B). Data represents average ± SD from one donor in triplicate. To assess the effect of transmembrane mutations on tumour killing transduced donor T-cells were incubated with CEA-expressing MKN45k tumour cells before staining for the degranulation marker CD107a. Increase in mean fluorescence intensity values compared to cells incubated without tumour cells is shown for each CAR mutant (C). Surface expression of CAR and CD3 is shown for each cell population expressing the different mutant CARs with CD3 MFI values for CAR + cells indicated above each dotplot (D). Results are from one donor each in triplicate ± SD. Supplemental Figure 4. FCIP negative control and primary human T-cell analysis. To evaluate the specificity of the FCIP approach interactions between MFE.FLAG and three molecules highly expressed in Jurkat T-cells was assessed. (A) Anti-FLAG beads were incubated with lysates from non-transduced or MFE.FLAG expressing Jurkat T-cells and stained with anti-tcrv 8, anti-cd28, anti-cd45ra or anti-cd95 PE antibodies. Analysis was conducted using an LSRII cytometer and FlowJo software. Results are averages ± SD from three experiments. (B) Lysates from non-transduced primary human T-cells or cells expressing MFE.FLAG or MFE.htm.FLAG were incubated with anti-flag beads before staining with anti- 1
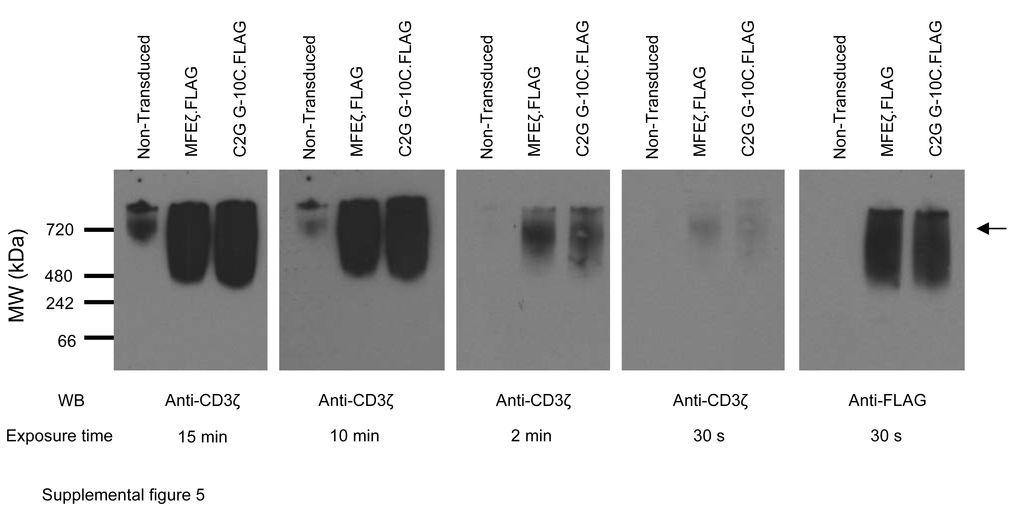
2 CD3 PE or CEAhFc/anti-hIgG-PE. Analysis was conducted using an LSRII cytometer and FlowJo software. Results are averages of two experiments. Supplemental Figure 5. Native PAGE analysis of TCR complexes from tranduced and non-transduced Jurkat T-cells. Digitonin lysates from nontransduced Jurkat T-cells or cells expressing MFE or MFE.C2G G-10C were separated on a 4-15 % tris-glycine gel, transferred to PVDF membranes and probed with anti-cd3 or anti-flag antibodies. Results from various exposure times are indicated with arrow indicating the position of the endogenous TCR complex. Approximate molecular weight markers are also shown. 2
3
4
5
6
7
Supplementary Figure 1
 Supplementary Figure 1 YAP negatively regulates IFN- signaling. (a) Immunoblot analysis of Yap knockdown efficiency with sh-yap (#1 to #4 independent constructs) in Raw264.7 cells. (b) IFN- -Luc and PRDs
supplemental Figure 1
 supplemental Figure 1 A T cell T1 anti-ny-eso-117-16/hla-a*:1 CDζ CH/CH scfv B T cell T1 anti-ny-eso-117-16/hla-a*:1 CDζ CH/CH scfv C T cell BW1/6 anti-cea CDζ CH/CH scfv supplemental Figure 1.79.9.87
Supplementary Figure 1. BMS enhances human T cell activation in vitro in a
 Supplementary Figure 1. BMS98662 enhances human T cell activation in vitro in a concentration-dependent manner. Jurkat T cells were activated with anti-cd3 and anti-cd28 antibody in the presence of titrated
Supplementary Figures
 Supplementary Figures Supplementary Fig. 1. Surface thiol groups and reduction of activated T cells. (a) Activated CD8 + T-cells have high expression levels of free thiol groups on cell surface proteins.
Supplementary Figure 1. Using DNA barcode-labeled MHC multimers to generate TCR fingerprints
 Supplementary Figure 1 Using DNA barcode-labeled MHC multimers to generate TCR fingerprints (a) Schematic overview of the workflow behind a TCR fingerprint. Each peptide position of the original peptide
Nature Protocols: doi: /nprot Supplementary Figure 1
 Supplementary Figure 1 Traditional electronic gating strategy for analysing cell death based on A5-FITC and 7-AAD. a, Flow cytometry analysis showing the traditional two-stage electronic gating strategy
Bioassays for Quality Control of Cell & Gene Therapy Products
 Bioassays for Quality Control of Cell & Gene Therapy Products Erik Rutjens, Cell & Gene Therapy, Novartis Pharma AG CASSS Bioassays, Silver Spring, March2015 CTL019 Introduction CARTs = Chimeric Antigen
Low Avidity CMV + T Cells accumulate in Old Humans
 Supplementary Figure Legends Supplementary Figure 1. CD45RA expressing CMVpp65-specific T cell populations accumulate within HLA-A*0201 and HLA-B*0701 individuals Pooled data showing the size of the NLV/HLA-A*0201-specific
Supplementary Figure 1. Enhanced detection of CTLA-4 on the surface of HIV-specific
 SUPPLEMENTARY FIGURE LEGEND Supplementary Figure 1. Enhanced detection of CTLA-4 on the surface of HIV-specific CD4 + T cells correlates with intracellular CTLA-4 levels. (a) Comparative CTLA-4 levels
Dual Targeting Nanoparticle Stimulates the Immune
 Dual Targeting Nanoparticle Stimulates the Immune System to Inhibit Tumor Growth Alyssa K. Kosmides, John-William Sidhom, Andrew Fraser, Catherine A. Bessell, Jonathan P. Schneck * Supplemental Figure
Supplemental Methods In vitro T cell assays Inhibition of perforin- and FasL-mediated cytotoxicity Flow Cytometry
 Supplemental Methods In vitro T cell assays Cell lines Jurkat (ATCC #TIB-152), CCRF-CEM (ATCC #CCL-119), MOLT-4 (ATCC #CRL- 1582), Hut 78 (ATCC #TIB-161), SupT1 (ATCC #CRL-1942), Raji (ATCC #CCL-86) and
Figure S1. Gating strategy used in NK cells and γδ T lymphocytes coculture An example of flow cytometry analysis shows the gating of NK cells and γδ
 Figure S1. Gating strategy used in NK cells and γδ T lymphocytes coculture An example of flow cytometry analysis shows the gating of NK cells and γδ T lymphocytes used in all NK activation and cytotoxicity
<10. IL-1β IL-6 TNF + _ TGF-β + IL-23
 3 ns 25 ns 2 IL-17 (pg/ml) 15 1 ns ns 5 IL-1β IL-6 TNF
Supplementary Table; Supplementary Figures and legends S1-S21; Supplementary Materials and Methods
 Silva et al. PTEN posttranslational inactivation and hyperactivation of the PI3K/Akt pathway sustain primary T cell leukemia viability Supplementary Table; Supplementary Figures and legends S1-S21; Supplementary
HD1 (FLU) HD2 (EBV) HD2 (FLU)
 HD2 (EBV) HD2 (FLU)") ramer staining + anti-pe beads ramer staining a HD1 (FLU) HD2 (EBV) HD2 (FLU).73.11.56.46.24 1.12 b CD127 + c CD127 + d CD127 - e CD127 - PD1 - PD1 + PD1 + PD1-1 1 1 1 %CD127 + PD1-8 6 4 2 + anti-pe %CD127
ramer staining + anti-pe beads ramer staining a HD1 (FLU) HD2 (EBV) HD2 (FLU).73.11.56.46.24 1.12 b CD127 + c CD127 + d CD127 - e CD127 - PD1 - PD1 + PD1 + PD1-1 1 1 1 %CD127 + PD1-8 6 4 2 + anti-pe %CD127
Supplementary Data. Treg phenotype
 Supplementary Data Additional Experiment An additional experiment was performed using cryopreserved peripheral blood mononuclear cells (PBMC) derived from five renal cell carcinoma (RCC) patients [see
Fluorochrome Panel 1 Panel 2 Panel 3 Panel 4 Panel 5 CTLA-4 CTLA-4 CD15 CD3 FITC. Bio) PD-1 (MIH4, BD) ICOS (C398.4A, Biolegend) PD-L1 (MIH1, BD)
 PD-1 (MIH4, BD) ICOS (C398.4A, Biolegend) PD-L1 (MIH1, BD)") Additional file : Table S. Antibodies used for panel stain to identify peripheral immune cell subsets. Panel : PD- signaling; Panel : CD + T cells, CD + T cells, B cells; Panel : Tregs; Panel :, -T, cdc,
Additional file : Table S. Antibodies used for panel stain to identify peripheral immune cell subsets. Panel : PD- signaling; Panel : CD + T cells, CD + T cells, B cells; Panel : Tregs; Panel :, -T, cdc,
Human and mouse T cell regulation mediated by soluble CD52 interaction with Siglec-10. Esther Bandala-Sanchez, Yuxia Zhang, Simone Reinwald,
 Human and mouse T cell regulation mediated by soluble CD52 interaction with Siglec-1 Esther Bandala-Sanchez, Yuxia Zhang, Simone Reinwald, James A. Dromey, Bo Han Lee, Junyan Qian, Ralph M Böhmer and Leonard
Immune surveillance: The immune system can recognize and destroy nascent malignant cells
 Immune surveillance: The immune system can recognize and destroy nascent malignant cells Control Escape APC T C T H B NKT NK Innate Tumor T cells are believed to play a major role in controlling tumor
Supplementary Figure 1. Supernatants electrophoresis from CD14+ and dendritic cells. Supernatants were resolved by SDS-PAGE and stained with
 Supplementary Figure 1. Supernatants electrophoresis from CD14+ and dendritic cells. Supernatants were resolved by SDS-PAGE and stained with Coomassie brilliant blue. One µg/ml recombinant human (rh) apo-e
Supplementary Figures
 Supplementary Figures a b c d PDI activity in % ERp72 activity in % 4 3 2 1 1 1 ERp activity in % e ΔRFU min -1 1 1 ERp7 activity in % 1 1 Supplementary Figure 1. Selectivity of the bepristat-mediated
Pearson r = P (one-tailed) = n = 9
 = n = 9") 8F4-Specific Lysis, % 1 UPN1 UPN3 8 UPN7 6 Pearson r =.69 UPN2 UPN5 P (one-tailed) =.192 4 UPN8 n = 9 2 UPN9 UPN4 UPN6 5 1 15 2 25 8 8F4, % Max MFI Supplementary Figure S1. AML samples UPN1-UPN9 show variable
8F4-Specific Lysis, % 1 UPN1 UPN3 8 UPN7 6 Pearson r =.69 UPN2 UPN5 P (one-tailed) =.192 4 UPN8 n = 9 2 UPN9 UPN4 UPN6 5 1 15 2 25 8 8F4, % Max MFI Supplementary Figure S1. AML samples UPN1-UPN9 show variable
Bead Based Assays for Cytokine Detection
 Bead Based Assays for Cytokine Detection September 27, 2014 6 th EFIS-EJI South East European Immunology School SEEIS 2014 Timisoara, Romania The Cells of the Immune System The Immune Reaction (Th2) (Th1)
Supplementary Information
 Supplementary Information Supplementary Figure 1. CD4 + T cell activation and lack of apoptosis after crosslinking with anti-cd3 + anti-cd28 + anti-cd160. (a) Flow cytometry of anti-cd160 (5D.10A11) binding
Supplementary Data Table of Contents:
 Supplementary Data Table of Contents: - Supplementary Methods - Supplementary Figures S1(A-B) - Supplementary Figures S2 (A-B) - Supplementary Figures S3 - Supplementary Figures S4(A-B) - Supplementary
SUPPLEMENTARY INFORMATION
 Complete but curtailed T-cell response to very-low-affinity antigen Dietmar Zehn, Sarah Y. Lee & Michael J. Bevan Supp. Fig. 1: TCR chain usage among endogenous K b /Ova reactive T cells. C57BL/6 mice
Supplementary Table 1 Clinicopathological characteristics of 35 patients with CRCs
 Supplementary Table Clinicopathological characteristics of 35 patients with CRCs Characteristics Type-A CRC Type-B CRC P value Sex Male / Female 9 / / 8.5 Age (years) Median (range) 6. (9 86) 6.5 (9 76).95
Effective activity of cytokine-induced killer cells against autologous metastatic melanoma including cells with stemness features
 Effective activity of cytokine-induced killer cells against autologous metastatic melanoma including cells with stemness features Loretta Gammaitoni, Lidia Giraudo, Valeria Leuci, et al. Clin Cancer Res
SUPPLEMENTAL FIGURE LEGENDS
 SUPPLEMENTAL FIGURE LEGENDS Supplemental Figure S1: Endogenous interaction between RNF2 and H2AX: Whole cell extracts from 293T were subjected to immunoprecipitation with anti-rnf2 or anti-γ-h2ax antibodies
a b G75 G60 Sw-2 Sw-1 Supplementary Figure 1. Structure predictions by I-TASSER Server.
 a b G75 2 2 G60 Sw-2 Sw-1 Supplementary Figure 1. Structure predictions by I-TASSER Server. a. Overlay of top 10 models generated by I-TASSER illustrates the potential effect of 7 amino acid insertion
Supplementary Figure 1. IDH1 and IDH2 mutation site sequences on WHO grade III
 Supplementary Materials: Supplementary Figure 1. IDH1 and IDH2 mutation site sequences on WHO grade III patient samples. Genomic DNA samples extracted from punch biopsies from either FFPE or frozen tumor
The CD46 and Jagged1 interaction is critical for human adaptive T H
 The CD46 and Jagged1 interaction is critical for human adaptive T H 1 immunity Gaëlle Le Friec, Devon Sheppard, Pat Whiteman, Christian M. Karsten, Salley Al-Tilib Shamoun, Adam Laing, Laurence Bugeon,
DURACLONE IF BE CERTAIN ABOUT THE RESPONSE. l res. a il n c n. For Research Use Only - Not for use in Diagnostic procedures
 DURACLONE IF earch tria l res lc a om ic il n c n nio pa Yo ur BE CERTAIN ABOUT THE RESPONSE For Research Use Only - Not for use in Diagnostic procedures BE CERTAIN ABOUT THE RESPONSE The sensitive and
SUPPLEMENTARY INFORMATION
 doi: 10.1038/nature05732 SUPPLEMENTARY INFORMATION Supplemental Data Supplement Figure Legends Figure S1. RIG-I 2CARD undergo robust ubiquitination a, (top) At 48 h posttransfection with a GST, GST-RIG-I-2CARD
Supplemental Data Figure S1 Effect of TS2/4 and R6.5 antibodies on the kinetics of CD16.NK-92-mediated specific lysis of SKBR-3 target cells.
 Supplemental Data Figure S1. Effect of TS2/4 and R6.5 antibodies on the kinetics of CD16.NK-92-mediated specific lysis of SKBR-3 target cells. (A) Specific lysis of IFN-γ-treated SKBR-3 cells in the absence
CD25-PE (BD Biosciences) and labeled with anti-pe-microbeads (Miltenyi Biotec) for depletion of CD25 +
 and labeled with anti-pe-microbeads (Miltenyi Biotec) for depletion of CD25 +") Supplements Supplemental Materials and Methods Depletion of CD25 + T-cells from PBMC. Fresh or HD precultured PBMC were stained with the conjugate CD25-PE (BD Biosciences) and labeled with anti-pe-microbeads
Supplements Supplemental Materials and Methods Depletion of CD25 + T-cells from PBMC. Fresh or HD precultured PBMC were stained with the conjugate CD25-PE (BD Biosciences) and labeled with anti-pe-microbeads
Tbk1-TKO! DN cells (%)! 15! 10!
! 15! 10!") a! T Cells! TKO! B Cells! TKO! b! CD4! 8.9 85.2 3.4 2.88 CD8! Tbk1-TKO! 1.1 84.8 2.51 2.54 c! DN cells (%)! 4 3 2 1 DP cells (%)! 9 8 7 6 CD4 + SP cells (%)! 5 4 3 2 1 5 TKO! TKO! TKO! TKO! 15 1 5 CD8
a! T Cells! TKO! B Cells! TKO! b! CD4! 8.9 85.2 3.4 2.88 CD8! Tbk1-TKO! 1.1 84.8 2.51 2.54 c! DN cells (%)! 4 3 2 1 DP cells (%)! 9 8 7 6 CD4 + SP cells (%)! 5 4 3 2 1 5 TKO! TKO! TKO! TKO! 15 1 5 CD8
Integrin CD11b negatively regulates TLR-triggered inflammatory responses by. activating Syk and promoting MyD88 and TRIF degradation via cbl-b
 Integrin CD11b negatively regulates TLR-triggered inflammatory responses by activating Syk and promoting MyD88 and TRIF degradation via cbl-b Chaofeng Han, Jing Jin, Sheng Xu, Haibo Liu, Nan Li, and Xuetao
Supplemental Figure 1
 Supplemental Figure 1 1a 1c PD-1 MFI fold change 6 5 4 3 2 1 IL-1α IL-2 IL-4 IL-6 IL-1 IL-12 IL-13 IL-15 IL-17 IL-18 IL-21 IL-23 IFN-α Mut Human PD-1 promoter SBE-D 5 -GTCTG- -1.2kb SBE-P -CAGAC- -1.kb
Supplementary Materials
 Supplementary Materials 43 Figure S1. CD123 in acute lymphoblastic leukemia and leukemia-initiating cells. A. CD123 (histograms) is highly and homogenously expressed in B-ALL blasts (as defined by live,
Blocking antibodies and peptides. Rat anti-mouse PD-1 (29F.1A12, rat IgG2a, k), PD-
, PD-") Supplementary Methods Blocking antibodies and peptides. Rat anti-mouse PD-1 (29F.1A12, rat IgG2a, k), PD- L1 (10F.9G2, rat IgG2b, k), and PD-L2 (3.2, mouse IgG1) have been described (24). Anti-CTLA-4 (clone
Supplementary Methods Blocking antibodies and peptides. Rat anti-mouse PD-1 (29F.1A12, rat IgG2a, k), PD- L1 (10F.9G2, rat IgG2b, k), and PD-L2 (3.2, mouse IgG1) have been described (24). Anti-CTLA-4 (clone
Supplementary Figure 1
 Supplementary Figure 1 Expression of apoptosis-related genes in tumor T reg cells. (a) Identification of FOXP3 T reg cells by FACS. CD45 + cells were gated as enriched lymphoid cell populations with low-granularity.
Supplementary Figure 1. Prevalence of U539C and G540A nucleotide and E172K amino acid substitutions among H9N2 viruses. Full-length H9N2 NS
 Supplementary Figure 1. Prevalence of U539C and G540A nucleotide and E172K amino acid substitutions among H9N2 viruses. Full-length H9N2 NS nucleotide sequences (a, b) or amino acid sequences (c) from
% of live splenocytes. STAT5 deletion. (open shapes) % ROSA + % floxed
 % ROSA + % floxed") Supp. Figure 1. a 14 1 1 8 6 spleen cells (x1 6 ) 16 % of live splenocytes 5 4 3 1 % of live splenocytes 8 6 4 b 1 1 c % of CD11c + splenocytes (closed shapes) 8 6 4 8 6 4 % ROSA + (open shapes) % floxed
Supp. Figure 1. a 14 1 1 8 6 spleen cells (x1 6 ) 16 % of live splenocytes 5 4 3 1 % of live splenocytes 8 6 4 b 1 1 c % of CD11c + splenocytes (closed shapes) 8 6 4 8 6 4 % ROSA + (open shapes) % floxed
Supplementary Figure 1 CD4 + T cells from PKC-θ null mice are defective in NF-κB activation during T cell receptor signaling. CD4 + T cells were
 Supplementary Figure 1 CD4 + T cells from PKC-θ null mice are defective in NF-κB activation during T cell receptor signaling. CD4 + T cells were isolated from wild type (PKC-θ- WT) or PKC-θ null (PKC-θ-KO)
Supplemental Figure 1. Cell-bound Cetuximab reduces EGFR staining intensity. Blood
 Antibody-mediated depletion of CD19-CAR T cells Supplemental 1 Supplemental Materials Supplemental Figure 1. Supplemental Figure 1. Cell-bound Cetuximab reduces EGFR staining intensity. Blood cells were
Supplementary Fig. 1: Ex vivo tetramer enrichment with anti-c-myc beads
 Supplementary Fig. 1: Ex vivo tetramer enrichment with anti-c-myc beads Representative example of comparative ex vivo tetramer enrichment performed in three independent experiments with either conventional
Supplementary Figure 1. Characterization of human carotid plaques. (a) Flash-frozen human plaques were separated into vulnerable (V) and stable (S),
 Flash-frozen human plaques were separated into vulnerable (V) and stable (S),") Supplementary Figure 1. Characterization of human carotid plaques. (a) Flash-frozen human plaques were separated into vulnerable (V) and stable (S), regions which were then quantified for mean fluorescence
Supplementary Figure 1. Characterization of human carotid plaques. (a) Flash-frozen human plaques were separated into vulnerable (V) and stable (S), regions which were then quantified for mean fluorescence
Appendix. Table of Contents
 Appendix Table of Contents Appendix Figures Figure S1: Gp78 is not required for the degradation of mcherry-cl1 in Hela Cells. Figure S2: Indel formation in the MARCH6 sgrna targeted HeLa clones. Figure
Acid sphingomyelinase is a critical regulator of cytotoxic granule secretion by
 Supplementary Data Acid sphingomyelinase is a critical regulator of cytotoxic granule secretion by primary T lymphocytes Jasmin Herz, Julian Pardo, Hamid Kashkar, Michael Schramm, Elza Kuzmenkina, Erik
CHAPTER 3 LABORATORY PROCEDURES
 CHAPTER 3 LABORATORY PROCEDURES CHAPTER 3 LABORATORY PROCEDURES 3.1 HLA TYPING Molecular HLA typing will be performed for all donor cord blood units and patients in the three reference laboratories identified
Supplementary Figure 1
 Supplementary Figure 1 6 HE-50 HE-116 E-1 HE-108 Supplementary Figure 1. Targeted drug response curves of endometrial cancer cells. Endometrial cancer cell lines were incubated with serial dilutions of
activation with anti-cd3/cd28 beads and 3d following transduction. Supplemental Figure 2 shows
 Supplemental Data Supplemental Figure 1 compares CXCR4 expression in untreated CD8 + T cells, following activation with anti-cd3/cd28 beads and 3d following transduction. Supplemental Figure 2 shows the
A mechanism for glycoconjugate vaccine activation of the adaptive immune system and its implications for vaccine design
 A mechanism for glycoconjugate vaccine activation of the adaptive immune system and its implications for vaccine design Fikri Y. Avci 1,2, Xiangming Li 3, Moriya Tsuji 3, Dennis L. Kasper 1,2* Supplementary
Masashi Takahara,* Manami Miyai,* Mai Tomiyama,* Masato Mutou,* Andrew J. Nicol, and Mie Nieda*,1
 Copulsing tumor antigen-pulsed dendritic cells with zoledronate efficiently enhance the expansion of tumor antigen-specific CD8 T cells via V 9 T cell activation Masashi Takahara,* Manami Miyai,* Mai Tomiyama,*
Nature Immunology doi: /ni.2771
 Supplementary Figure 1. Lymphadenopathy, mitogen response, effector cells, and serum Ig assessment. (a) Computerized Tomography (CT) images demonstrating lymphadenopathy (arrows) in patient F.II.1 and
PBMC from each patient were suspended in AIM V medium (Invitrogen) with 5% human
 with 5% human") Anti-CD19-CAR transduced T-cell preparation PBMC from each patient were suspended in AIM V medium (Invitrogen) with 5% human AB serum (Gemini) and 300 international units/ml IL-2 (Novartis). T cell proliferation
Anti-CD19-CAR transduced T-cell preparation PBMC from each patient were suspended in AIM V medium (Invitrogen) with 5% human AB serum (Gemini) and 300 international units/ml IL-2 (Novartis). T cell proliferation
sequences of a styx mutant reveals a T to A transversion in the donor splice site of intron 5
 sfigure 1 Styx mutant mice recapitulate the phenotype of SHIP -/- mice. (A) Analysis of the genomic sequences of a styx mutant reveals a T to A transversion in the donor splice site of intron 5 (GTAAC
Commercially available HLA Class II tetramers (Beckman Coulter) conjugated to
 conjugated to") Class II tetramer staining Commercially available HLA Class II tetramers (Beckman Coulter) conjugated to PE were combined with dominant HIV epitopes (DRB1*0101-DRFYKTLRAEQASQEV, DRB1*0301- PEKEVLVWKFDSRLAFHH,
Class II tetramer staining Commercially available HLA Class II tetramers (Beckman Coulter) conjugated to PE were combined with dominant HIV epitopes (DRB1*0101-DRFYKTLRAEQASQEV, DRB1*0301- PEKEVLVWKFDSRLAFHH,
Supplemental Methods. CD107a assay
 Supplemental Methods CD107a assay For each T cell culture that was tested, two tubes were prepared. One tube contained BCMA-K562 cells, and the other tube contained NGFR-K562 cells. Both tubes contained
hexahistidine tagged GRP78 devoid of the KDEL motif (GRP78-His) on SDS-PAGE. This
 on SDS-PAGE. This") SUPPLEMENTAL FIGURE LEGEND Fig. S1. Generation and characterization of. (A) Coomassie staining of soluble hexahistidine tagged GRP78 devoid of the KDEL motif (GRP78-His) on SDS-PAGE. This protein was expressed
SUPPLEMENTAL FIGURE LEGEND Fig. S1. Generation and characterization of. (A) Coomassie staining of soluble hexahistidine tagged GRP78 devoid of the KDEL motif (GRP78-His) on SDS-PAGE. This protein was expressed
Trim29 gene-targeting strategy. (a) Genotyping of wildtype mice (+/+), Trim29 heterozygous mice (+/ ) and homozygous mice ( / ).
 Genotyping of wildtype mice (+/+), Trim29 heterozygous mice (+/ ) and homozygous mice ( / ).") Supplementary Figure 1 Trim29 gene-targeting strategy. (a) Genotyping of wildtype mice (+/+), Trim29 heterozygous mice (+/ ) and homozygous mice ( / ). (b) Immunoblot analysis of TRIM29 in lung primary
Supplementary Figure 1 Trim29 gene-targeting strategy. (a) Genotyping of wildtype mice (+/+), Trim29 heterozygous mice (+/ ) and homozygous mice ( / ). (b) Immunoblot analysis of TRIM29 in lung primary
Increased IL-12 induced STAT-4 signaling in CD8 T cells. from aged mice
 Increased IL-2 induced STAT-4 signaling in CD8 T cells from aged mice Erin Rottinghaus * Abstract: Aging is associated with poor immune function leading to increased susceptibility to infectious diseases
Nature Structural and Molecular Biology: doi: /nsmb Supplementary Figure 1
 Supplementary Figure 1 Mutational analysis of the SA2-Scc1 interaction in vitro and in human cells. (a) Autoradiograph (top) and Coomassie stained gel (bottom) of 35 S-labeled Myc-SA2 proteins (input)
Supplementary information. MARCH8 inhibits HIV-1 infection by reducing virion incorporation of envelope glycoproteins
 Supplementary information inhibits HIV-1 infection by reducing virion incorporation of envelope glycoproteins Takuya Tada, Yanzhao Zhang, Takayoshi Koyama, Minoru Tobiume, Yasuko Tsunetsugu-Yokota, Shoji
were isolated from the freshly drawn blood of healthy donors and ACS patients using the
 Supplemental Figure 1. Quality control of CD4 + T-cell purification. CD4 + T cells were isolated from the freshly drawn blood of healthy donors and ACS patients using the RosetteSep CD4 + T Cell Enrichment
Detailed step-by-step operating procedures for NK cell and CTL degranulation assays
 Supplemental methods Detailed step-by-step operating procedures for NK cell and CTL degranulation assays Materials PBMC isolated from patients, relatives and healthy donors as control K562 cells (ATCC,
BET bromodomain inhibition enhances T cell persistence and function in adoptive immunotherapy models
 BET bromodomain inhibition enhances T cell persistence and function in adoptive immunotherapy models Yuki Kagoya,, Cheryl H. Arrowsmith, Naoto Hirano J Clin Invest. 2016;126(9):3479-3494. https://doi.org/10.1172/jci86437.
Supplementary Figure 1. Normal T lymphocyte populations in Dapk -/- mice. (a) Normal thymic development in Dapk -/- mice. Thymocytes from WT and Dapk
 Normal thymic development in Dapk -/- mice. Thymocytes from WT and Dapk") Supplementary Figure 1. Normal T lymphocyte populations in Dapk -/- mice. (a) Normal thymic development in Dapk -/- mice. Thymocytes from WT and Dapk -/- mice were stained for expression of CD4 and CD8.
Supplementary Figure 1. Normal T lymphocyte populations in Dapk -/- mice. (a) Normal thymic development in Dapk -/- mice. Thymocytes from WT and Dapk -/- mice were stained for expression of CD4 and CD8.
Supplementary Materials for
 www.sciencetranslationalmedicine.org/cgi/content/full/8/352/352ra110/dc1 Supplementary Materials for Spatially selective depletion of tumor-associated regulatory T cells with near-infrared photoimmunotherapy
Exploiting tumour infiltrating lymphocytes (TILs) as a therapeutic strategy in epithelial ovarian cancer
 as a therapeutic strategy in epithelial ovarian cancer") Exploiting tumour infiltrating lymphocytes (TILs) as a therapeutic strategy in epithelial ovarian cancer G.L.Owens 1,2, V.Sheard 2, M.Price 1, D.E.Gilham 2, R.J.Edmondson 1 1 Gynaecological Oncology Research
Exploiting tumour infiltrating lymphocytes (TILs) as a therapeutic strategy in epithelial ovarian cancer G.L.Owens 1,2, V.Sheard 2, M.Price 1, D.E.Gilham 2, R.J.Edmondson 1 1 Gynaecological Oncology Research
The pi-value distribution of single-pass membrane proteins at the plasma membrane in immune cells and in total cells.
 Supplementary Figure 1 The pi-value distribution of single-pass membrane proteins at the plasma membrane in immune cells and in total cells. The PI values were measured for the first 10 amino acids in
Table S1. Sequence of human and mouse primers used for RT-qPCR measurements.
 Table S1. Sequence of human and mouse primers used for RT-qPCR measurements. Ca9, carbonic anhydrase IX; Ndrg1, N-myc downstream regulated gene 1; L28, ribosomal protein L28; Hif1a, hypoxia inducible factor
Quantification of intracellular payload release from
 Quantification of intracellular payload release from polymersome nanoparticles Edoardo Scarpa 1,2, Joanne L. Bailey 2, Agnieszka A. Janeczek 1,2, Patrick S. Stumpf 1,2, Alexander H. Johnston 2, Richard
SUPPLEMENTARY INFORMATION
 DOI: 10.1038/ncb2566 Figure S1 CDKL5 protein expression pattern and localization in mouse brain. (a) Multiple-tissue western blot from a postnatal day (P) 21 mouse probed with an antibody against CDKL5.
Supplementary Figure 1.TRIM33 binds β-catenin in the nucleus. a & b, Co-IP of endogenous TRIM33 with β-catenin in HT-29 cells (a) and HEK 293T cells
 and HEK 293T cells") Supplementary Figure 1.TRIM33 binds β-catenin in the nucleus. a & b, Co-IP of endogenous TRIM33 with β-catenin in HT-29 cells (a) and HEK 293T cells (b). TRIM33 was immunoprecipitated, and the amount of
Supplementary Figure 1.TRIM33 binds β-catenin in the nucleus. a & b, Co-IP of endogenous TRIM33 with β-catenin in HT-29 cells (a) and HEK 293T cells (b). TRIM33 was immunoprecipitated, and the amount of
Supplementary. presence of the. (c) mrna expression. Error. in naive or
 mrna expression. Error. in naive or") Figure 1. (a) Naive CD4 + T cells were activated in the presence of the indicated cytokines for 3 days. Enpp2 mrna expression was measured by qrt-pcrhr, infected with (b, c) Naive CD4 + T cells were activated
Figure 1. (a) Naive CD4 + T cells were activated in the presence of the indicated cytokines for 3 days. Enpp2 mrna expression was measured by qrt-pcrhr, infected with (b, c) Naive CD4 + T cells were activated
NK mediated Antibody Dependent Cellular Cytotoxicity in HIV infections
 NK mediated Antibody Dependent Cellular Cytotoxicity in HIV infections Amy Chung Dr. Ivan Stratov Prof. Stephen Kent ADCC process consists of Target cell QuickTime and a TIFF (Uncompressed) FcγR decompressor
General Laboratory methods Plasma analysis: Gene Expression Analysis: Immunoblot analysis: Immunohistochemistry:
 General Laboratory methods Plasma analysis: Plasma insulin (Mercodia, Sweden), leptin (duoset, R&D Systems Europe, Abingdon, United Kingdom), IL-6, TNFα and adiponectin levels (Quantikine kits, R&D Systems
IMMUNE CELL SURFACE RECEPTORS AND THEIR FUNCTIONS
 LECTURE: 07 Title: IMMUNE CELL SURFACE RECEPTORS AND THEIR FUNCTIONS LEARNING OBJECTIVES: The student should be able to: The chemical nature of the cellular surface receptors. Define the location of the
Other Clinical Diagnoses
 Donor Case ID 14 year old fe npod6342 24 year old npod6367 12 year old fe npod6268 6 year old fe npod69 22 year old fe npod6323 20 year old T1D.6 27 year old T1D.7 30 year old T1D.8 22 year old T1D.9 Duration
Supplementary Data 1. Alanine substitutions and position variants of APNCYGNIPL. Applied in
 Supplementary Data 1. Alanine substitutions and position variants of APNCYGNIPL. Applied in Supplementary Fig. 2 Substitution Sequence Position variant Sequence original APNCYGNIPL original APNCYGNIPL
and follicular helper T cells is Egr2-dependent. (a) Diagrammatic representation of the
 Diagrammatic representation of the") Supplementary Figure 1. LAG3 + Treg-mediated regulation of germinal center B cells and follicular helper T cells is Egr2-dependent. (a) Diagrammatic representation of the experimental protocol for the
Supplementary Figure 1. LAG3 + Treg-mediated regulation of germinal center B cells and follicular helper T cells is Egr2-dependent. (a) Diagrammatic representation of the experimental protocol for the
BD CBA on the BD Accuri C6: Bringing Multiplexed Cytokine Detection to the Benchtop
 BD CBA on the BD Accuri C6: Bringing Multiplexed Cytokine Detection to the Benchtop Maria Dinkelmann, PhD Senior Marketing Applications Specialist BD Biosciences, Ann Arbor, MI 23-14380-00 Cellular Communication
Relevant Disclosures
 6/18/215 Therapeutic developments for autoimmune demyelinating diseases: Musings from a MD (Mouse Doctor) Michael K. Racke, M.D. May 28, 215 Relevant Disclosures Editorial Boards for Journal of Neuroimmunology,
08/02/59. Tumor Immunotherapy. Development of Tumor Vaccines. Types of Tumor Vaccines. Immunotherapy w/ Cytokine Gene-Transfected Tumor Cells
 Tumor Immunotherapy Autologous virus Inactivation Inactivated virus Lymphopheresis Culture? Monocyte s Dendritic cells Immunization Autologous vaccine Development of Tumor Vaccines Types of Tumor Vaccines
33VASTVNGATSANNHGEPPS51PADARPR58
 Pro-rich region Trans-membrane region 214 246 359 381 UL50 1 397 211SSRTAS216PPPPPR222 NLS CR1 CR2 CR3 CR4 UL53 1 376 11RERRS15ALRS19LLRKRRR25 33VASTVNGATSANNHGEPPS51PADARPR58 FIG S1. UL97 phosphorylation
Supplemental Figure 1. Protein L
 Supplemental Figure 1 Protein L m19delta T m1928z T Suppl. Fig 1. Expression of CAR: B6-derived T cells were transduced with m19delta (left) and m1928z (right) to generate CAR T cells and transduction
L-selectin Is Essential for Delivery of Activated CD8 + T Cells to Virus-Infected Organs for Protective Immunity
 Cell Reports Supplemental Information L-selectin Is Essential for Delivery of Activated CD8 + T Cells to Virus-Infected Organs for Protective Immunity Rebar N. Mohammed, H. Angharad Watson, Miriam Vigar,
Tel: ; Fax: ;
 Tel.: +98 216 696 9291; Fax: +98 216 696 9291; E-mail: mrasadeghi@pasteur.ac.ir Tel: +98 916 113 7679; Fax: +98 613 333 6380; E-mail: abakhshi_e@ajums.ac.ir A Soluble Chromatin-bound MOI 0 1 5 0 1 5 HDAC2
Figure S1. Generation of inducible PTEN deficient mice and the BMMCs (A) B6.129 Pten loxp/loxp mice were mated with B6.
 B6.129 Pten loxp/loxp mice were mated with B6.") Figure S1. Generation of inducible PTEN deficient mice and the BMMCs (A) B6.129 Pten loxp/loxp mice were mated with B6.129-Gt(ROSA)26Sor tm1(cre/ert2)tyj /J mice. To induce deletion of the Pten locus,
Figure S1. Generation of inducible PTEN deficient mice and the BMMCs (A) B6.129 Pten loxp/loxp mice were mated with B6.129-Gt(ROSA)26Sor tm1(cre/ert2)tyj /J mice. To induce deletion of the Pten locus,
Naive, memory and regulatory T lymphocytes populations analysis
 Naive, memory and regulatory T lymphocytes populations analysis Jaen Olivier, PhD ojaen@beckmancoulter.com Cellular Analysis application specialist Beckman Coulter France Introduction Flow cytometric analysis
Supplementary Fig. 1 No relative growth advantage of Foxp3 negative cells.
 Supplementary Fig. 1 Supplementary Figure S1: No relative growth advantage of Foxp3 negative cells. itreg were induced from WT (A) or FIR (B) CD4 + T cells. FIR itregs were then removed from the TCR signal
vicinity of the effector cells after cytolytic lysis of targets. Therefore, both γδ T cells and NK cells could possibly potentiate the adaptive
 particular, what percentage of γδ T cells phagocytose and how does this compare to other lymphocytes? Is phagocytosis a feature of a particular type of γδ TCR+ cell? Is phagocytosis in γδ T cells followed
Supplementary Figure S1. PTPN2 levels are not altered in proliferating CD8+ T cells. Lymph node (LN) CD8+ T cells from C57BL/6 mice were stained with
 CD8+ T cells from C57BL/6 mice were stained with") Supplementary Figure S1. PTPN2 levels are not altered in proliferating CD8+ T cells. Lymph node (LN) CD8+ T cells from C57BL/6 mice were stained with CFSE and stimulated with plate-bound α-cd3ε (10µg/ml)
Supplementary Figure S1. PTPN2 levels are not altered in proliferating CD8+ T cells. Lymph node (LN) CD8+ T cells from C57BL/6 mice were stained with CFSE and stimulated with plate-bound α-cd3ε (10µg/ml)
ACTR (Antibody Coupled T-cell Receptor): A universal approach to T-cell therapy
: A universal approach to T-cell therapy") ACTR (Antibody Coupled T-cell Receptor): A universal approach to T-cell therapy European Medicines Agency Workshop on Scientific and Regulatory Challenges of Genetically Modified Cell-based Cancer Immunotherapy
ACTR (Antibody Coupled T-cell Receptor): A universal approach to T-cell therapy European Medicines Agency Workshop on Scientific and Regulatory Challenges of Genetically Modified Cell-based Cancer Immunotherapy
Table S1. New colony formation 7 days after stimulation with doxo and VCR in JURKAT cells
 Table S1. New colony formation 7 days after stimulation with and in JURKAT cells drug co + number of colonies 7±14 4±7 48±11 JURKAT cells were stimulated and analyzed as in Table 1. Drug concentrations
S1a S1b S1c. S1d. S1f S1g S1h SUPPLEMENTARY FIGURE 1. - si sc Il17rd Il17ra bp. rig/s IL-17RD (ng) -100 IL-17RD
 -100 IL-17RD") SUPPLEMENTARY FIGURE 1 0 20 50 80 100 IL-17RD (ng) S1a S1b S1c IL-17RD β-actin kda S1d - si sc Il17rd Il17ra rig/s15-574 - 458-361 bp S1f S1g S1h S1i S1j Supplementary Figure 1. Knockdown of IL-17RD enhances
SUPPLEMENTARY FIGURE 1 0 20 50 80 100 IL-17RD (ng) S1a S1b S1c IL-17RD β-actin kda S1d - si sc Il17rd Il17ra rig/s15-574 - 458-361 bp S1f S1g S1h S1i S1j Supplementary Figure 1. Knockdown of IL-17RD enhances
Cytotoxicity assays. Rory D. de Vries, PhD 1. Viroscience lab, Erasmus MC, Rotterdam, the Netherlands
 Cytotoxicity assays Rory D. de Vries, PhD 1 1 Viroscience lab, Erasmus MC, Rotterdam, the Netherlands Anti-influenza immunity Humoral / CD4+ / CD8+ / NK? Function of CTL Elimination of virus-infected cells?
Stewart et al. CD36 ligands promote sterile inflammation through assembly of a TLR 4 and 6 heterodimer
 NFκB (fold induction) Stewart et al. ligands promote sterile inflammation through assembly of a TLR 4 and 6 heterodimer a. mrna (fold induction) 5 4 3 2 1 LDL oxldl Gro1a MIP-2 RANTES mrna (fold induction)