Supplementary Figure 1. Supernatants electrophoresis from CD14+ and dendritic cells. Supernatants were resolved by SDS-PAGE and stained with
|
|
|
- Ross Payne
- 5 years ago
- Views:
Transcription
 apo-e or apoa-i were employed as standards.")
1 Supplementary Figure 1. Supernatants electrophoresis from CD14+ and dendritic cells. Supernatants were resolved by SDS-PAGE and stained with Coomassie brilliant blue. One µg/ml recombinant human (rh) apo-e or apoa-i were employed as standards. Bands were cut and analysed by MALDI-TOF/MS (refer to Supplementary Table 1 for details) are highlighted.
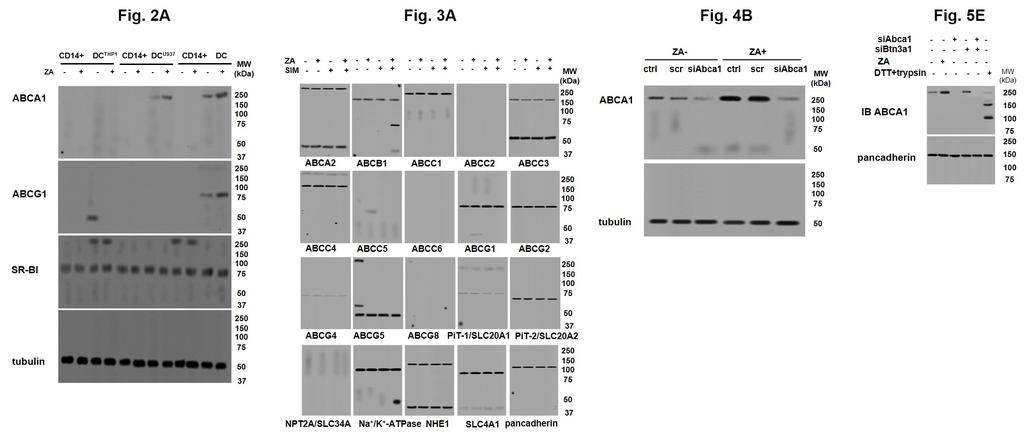
2 Supplementary Figure 2. Correlation between extracellular IPP release and ABCA1. Intracellular and extracellular IPP levels (A) and ABCA1, ABCG1 and SR-BI expression (B) were investigated in CD14+ cells and DC (n=11) from healthy donors; THP-1 and U37 cells and corresponding DC subsets (DC THP1, DC U37 ) (n=3); primary CD138+ cells isolated from the bone marrow of myeloma patients (CD138+ MM) (n=3); the human multiple myeloma SKMM1 cell line (n = 3); primary B-cell chronic lymphocytic leukaemia (B-CLL) cells from IGHV unmutated (UM) and mutated (M) patients (n=15); bone marrow stromal cells (BMSC) derived from healthy donors (HD BMSC) (n=8), MM patients (MM BMSC) (n = 12), B-CLL patients (B-CLL BMSC) (n=6); and the non-small cell lung cancer A54 cell line, which was included as a non-haematological cell line. A) Intracellular and extracellular IPP were measured after [ 3 H]-acetate radiolabelling. Cells are ranked according to the amount of extracellular IPP release. B) Western blot analysis of ABCA1, ABCG1, and SR-BI in whole cell lysates. β-tubulin was employed as a control of equal protein loading. Cells are ranked according to ABCA1 expression levels. The blots are representative of 1 out of 3 experiments. C) Correlations between extracellular and intracellular IPP and ABCA1 expression. The mean band density of ABCA1 (panel B) was calculated using ImageJ software ( expressed as arbitrary units (where the band density in CD14+ cells was set to 1) and plotted against extracellular (left panel) or intracellular (right panel) IPP levels in each cell sample. The R 2 coefficient was calculated using Fig.P software (Fig.P Software Inc., Hamilton, Canada). D) Cytofluorimetric analysis of cell surface BT3A1 expression in selected cell types from panels A-B. o statistically significant differences were observed in terms of percentage and mean fluorescence intensity (MFI). 2
, primary CLL cells from patients with mutated (M) and unmutated (UM) chronic lymphocytic leukaemia (CLL), the non-small cell")
3 Supplementary Figure 3. ZA-induced ABCA1 upregulation in different cells. The multiple myeloma SKMM1 cell line, primary myeloma cells (CD138+ MM), primary CLL cells from patients with mutated (M) and unmutated (UM) chronic lymphocytic leukaemia (CLL), the non-small cell lung cancer A54 cell line, and bone marrow stromal cells derived from MM patients (MM BMSC), CLL patients (CLL BMSC) or healthy donors (HD BMSC) were incubated for 24 h in the absence (-) or in the presence (+) of 1 µm ZA. Whole cell lysates were analysed for ABCA1 expression by Western blotting. ZA increased ABCA1 expression on cells that already expressed ABCA1 in baseline conditions. β-tubulin was employed to check the equal protein loading per lane. The blots are representative of 1 of 3 experiments. 3
 were employed as internal positive control. A) LXRα, LXRβ and RXR levels were measured by Western blotting in nuclear extracts.")
4 Supplementary Figure 4. LXRα activity, ABCA1 and apoa-i expression in THP-1 cells. THP-1 cells and DC THP1 were incubated for 24 h in the absence (-) or presence (+) of 1 µm ZA. DC generated from healthy donors (DC) were employed as internal positive control. A) LXRα, LXRβ and RXR levels were measured by Western blotting in nuclear extracts. In contrast to normal DC, THP-1 cells exhibited a low LXRα/LXRβ ratio, which were not modified by ZA. TBP served as a control for equal protein loading. The blots are representative of 1 of 3 experiments. B) Abca1 and apoa-i mra levels. Total mra was extracted, retro-transcribed and amplified by qrt-pcr. THP-1 cells have significantly lower levels of Abca1 and apoa-i mra than DC irrespective of ZA treatment. The bars represent the mean ± s.e.m. of 3 experiments ( * P < 0.05, *** P < 0.001; AOVA). 4
 or presence of increasing concentrations of GGPP and FPP.")
5 Supplementary Figure 5. Effect of GGPP and FPP on LXRα transcriptional activity. Evaluation of LXRα binding to LRE sequences in the Abca1 promoter by ChIP assay. Genomic DA extracted from DC and recombinant human LXRα protein were incubated in the absence (ctrl) or presence of increasing concentrations of GGPP and FPP. Binding to an upstream 10,000 bp non-specific sequence was employed as an internal negative control. The bars represent the mean ± s.e.m. of 3 experiments (** P < 0.01, *** P < 0.001; AOVA). 5
 or IPP")
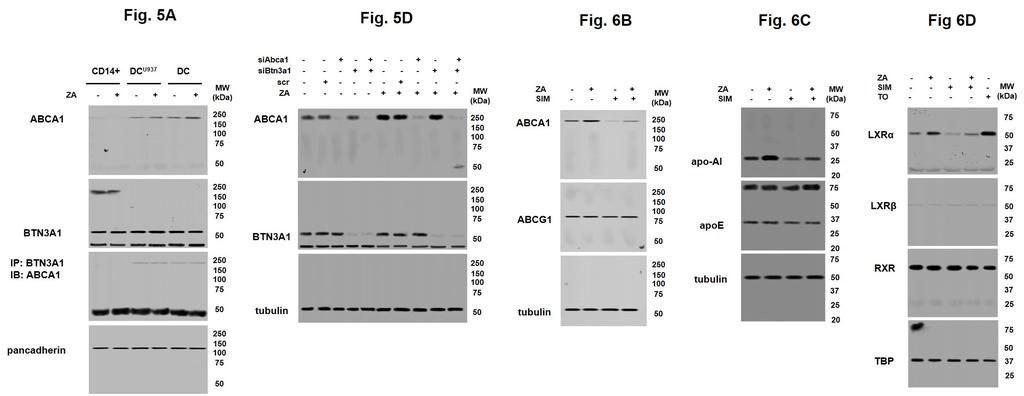
6 Supplementary Figure 6. Effect of ZA and IPP on ABCA1 activity. Effect of ZA and IPP on ABCA1 activity; A-B) ABCA1 was immunoprecipitated from whole cell lysates of untreated DC. ATPase activity was spectrophotometrically measured on 100 µg of immunoprecipitated proteins that contain an equal amount of ABCA1, in the absence or in the presence of increasing ZA (panel A) or IPP (panel B) concentrations in the reaction mix. either ZA nor IPP modified ABCA1 ATPase activity. The bars represent the mean ± s.e.m. of 4 experiments. C) One mg of plasma membrane proteins from CD14 + cells or DC, incubated for 24 h in the absence (ZA-) or in the presence (ZA+) of 1 µm ZA, were subjected to immunoprecipitation with an anti-abca1 antibody. The ATPase assay was spectrophotometrically measured on 100 µl immunoprecipitated extracts. DC showed higher ATPase activity than CD14 + cells, which was only increased in ZA-treated DC. For a positive control of maximal ABCA1 activity, 100 µm cholesterol/β-methyl-cyclodextrin (Chol) complexes and 1 µg/ml of human recombinant apoa-i (apoa-i) were added to the ATPase reaction mix. The bars represent the mean ± s.e.m. of 4 experiments (* P < 0.05, *** P < 0.001; AOVA). 6
akt, Akt, phospho(thr38)p70 S6K, phospho(thr421/ser424)p70 S6K, p70 S6K in cell lysates from DC incubated for 24 h in the absence (-) or presence (+) of 1 µm")
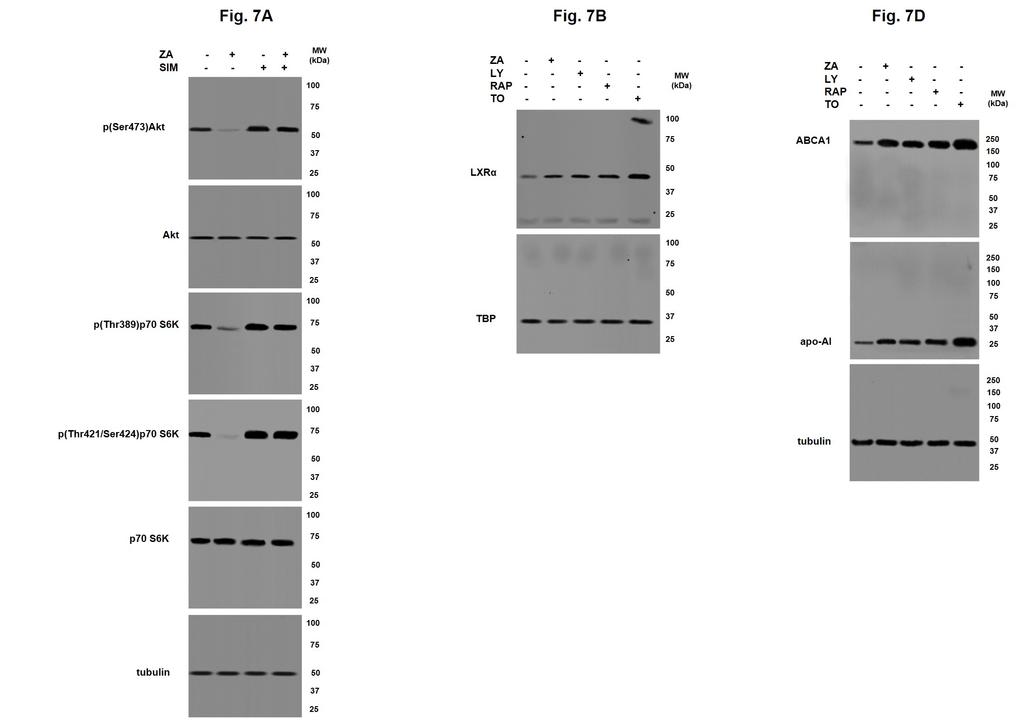
7 Supplementary Figure 7. Modulation of PI3K/Akt/mTOR signalling pathway in DC. Western blot analysis of phospho(ser473)akt, Akt, phospho(thr38)p70 S6K, phospho(thr421/ser424)p70 S6K, p70 S6K in cell lysates from DC incubated for 24 h in the absence (-) or presence (+) of 1 µm ZA, 200 µm LY24002 (LY) as PI3K inhibitor, and 20 nm rapamycin (RAP) as mtor inhibitor. The results indicate effective PI3K/Akt/mTOR signalling inhibition by these agents. β-tubulin served as a control for equal protein loading per lane. The blots are representative of one out of two experiments. 7
8 Supplementary Figure 8. Flow cytometry gating strategies. A) Myeloma cells: the first gate (R1) is drawn to include all viable cells based on FSC vs SSC parameters. ext, cells in R1 are classified as myeloma cells according to double expression of CD38 and CD138 (R2: CD138+CD38+ cells). B) Bone marrow stromal cells: the first gate (R1) is drawn to include all viable cells based on FSC vs SSC parameters. ext, cells in R1 are classified as bone marrow stromal cells according to their expression of CD44, CD105 and CD11a. C) VγVδ2 T cells: the first gate (R1) is drawn to include all viable cells based on FSC vs SSC parameters. ext, cells in R1 are analyzed for the expression of CD3 to identify the T lymphocyte population (R2: CD3). Finally, VγVδ2 T cells are gated according to double expression of TCR-Vγ and CD3 (R3: TCR-V γ+cd3+ cells). D) Dendritic cells: the first gate (R1) is drawn to include all viable cells based on FSC vs SSC parameters. ext, cells in R1 are analyzed for the expression of HLA-DR, CD86 and CD80 and classified as dendritic cells according to double expression of HLA-DR and CD80, and the expression of CD86. 8
9 Supplementary Figure. Original immunoblotting of main figures.

10 Supplementary Figure 10. Original immunoblotting of supplementary figures. 10
11 Ban d Result Accession number C1 APOE_HUMA P0264 Apolipoprotei ame MW pi Matched peptides/ n E 2 Coverage % Mascot score C2 APOE_HUMA 51 C3 APOE_HUMA P0264 Apolipoprotei n E C4 APOE_HUMA P0264 Apolipoprotei n E C5 APOA1_HUMA P02647 Apolipoprotei C6 APOA1_HUMA P02647 Apolipoprotei C7 APOA1_HUMA P02647 Apolipoprotei C8 APOA1_HUMA P02647 Apolipoprotei C APOA1_HUMA P02647 Apolipoprotei C10 APOA1_HUMA P02647 Apolipoprotei C11 APOA1_HUMA P02647 Apolipoprotei C12 APOA1_HUMA P02647 Apolipoprotei C13 APOA1_HUMA P02647 Apolipoprotei C14 APOA1_HUMA P02647 Apolipoprotei Supplementary Table 1. ApoA-I and apoe identification in dendritic cell supernatants. Bands were excised from the gel shown in Figure 2C. The excised bands are shown in Supplementary Fig. 1. Slice numbers, accession number for SwissProt database, name, molecular weight (MW), isoelectric point (pi), the number of matched peptides on the number of total peptides searched, sequence coverage and Mascot score are indicated. 11
2.5. AMPK activity
 Supplement Fig. A 3 B phos-ampk 2.5 * Control AICAR AMPK AMPK activity (Absorbance at 45 nm) 2.5.5 Control AICAR Supplement Fig. Effects of AICAR on AMPK activation in macrophages. J774. macrophages were
- 1 - Cell types Monocytes THP-1 cells Macrophages. LPS Treatment time (Hour) IL-6 level (pg/ml)
 IL-6 level (pg/ml)") Supplementary Table ST1: The dynamic effect of LPS on IL-6 production in monocytes and THP-1 cells after GdA treatment. Monocytes, THP-1 cells and macrophages (5x10 5 ) were incubated with 10 μg/ml of
Supplementary Table ST1: The dynamic effect of LPS on IL-6 production in monocytes and THP-1 cells after GdA treatment. Monocytes, THP-1 cells and macrophages (5x10 5 ) were incubated with 10 μg/ml of
Supplementary Figure 1. Normal T lymphocyte populations in Dapk -/- mice. (a) Normal thymic development in Dapk -/- mice. Thymocytes from WT and Dapk
 Normal thymic development in Dapk -/- mice. Thymocytes from WT and Dapk") Supplementary Figure 1. Normal T lymphocyte populations in Dapk -/- mice. (a) Normal thymic development in Dapk -/- mice. Thymocytes from WT and Dapk -/- mice were stained for expression of CD4 and CD8.
Supplementary Figure 1. Normal T lymphocyte populations in Dapk -/- mice. (a) Normal thymic development in Dapk -/- mice. Thymocytes from WT and Dapk -/- mice were stained for expression of CD4 and CD8.
Supplementary Figure 1. BMS enhances human T cell activation in vitro in a
 Supplementary Figure 1. BMS98662 enhances human T cell activation in vitro in a concentration-dependent manner. Jurkat T cells were activated with anti-cd3 and anti-cd28 antibody in the presence of titrated
Supplementary Materials for
 www.sciencesignaling.org/cgi/content/full/9/430/ra57/dc1 Supplementary Materials for The 4E-BP eif4e axis promotes rapamycinsensitive growth and proliferation in lymphocytes Lomon So, Jongdae Lee, Miguel
Nature Protocols: doi: /nprot Supplementary Figure 1
 Supplementary Figure 1 Traditional electronic gating strategy for analysing cell death based on A5-FITC and 7-AAD. a, Flow cytometry analysis showing the traditional two-stage electronic gating strategy
TRAF6 ubiquitinates TGFβ type I receptor to promote its cleavage and nuclear translocation in cancer
 Supplementary Information TRAF6 ubiquitinates TGFβ type I receptor to promote its cleavage and nuclear translocation in cancer Yabing Mu, Reshma Sundar, Noopur Thakur, Maria Ekman, Shyam Kumar Gudey, Mariya
well for 2 h at rt. Each dot represents an individual mouse and bar is the mean ±
 Supplementary data: Control DC Blimp-1 ko DC 8 6 4 2-2 IL-1β p=.5 medium 8 6 4 2 IL-2 Medium p=.16 8 6 4 2 IL-6 medium p=.3 5 4 3 2 1-1 medium IL-1 n.s. 25 2 15 1 5 IL-12(p7) p=.15 5 IFNγ p=.65 4 3 2 1
Supplementary Figure 1: Expression of NFAT proteins in Nfat2-deleted B cells (a+b) Protein expression of NFAT2 (a) and NFAT1 (b) in isolated splenic
 Protein expression of NFAT2 (a) and NFAT1 (b) in isolated splenic") Supplementary Figure 1: Expression of NFAT proteins in Nfat2-deleted B cells (a+b) Protein expression of NFAT2 (a) and NFAT1 (b) in isolated splenic B cells from WT Nfat2 +/+, TCL1 Nfat2 +/+ and TCL1 Nfat2
Supplementary Figure 1: Expression of NFAT proteins in Nfat2-deleted B cells (a+b) Protein expression of NFAT2 (a) and NFAT1 (b) in isolated splenic B cells from WT Nfat2 +/+, TCL1 Nfat2 +/+ and TCL1 Nfat2
Plasma exposure levels from individual mice 4 hours post IP administration at the
 Supplemental Figure Legends Figure S1. Plasma exposure levels of MKC-3946 in mice. Plasma exposure levels from individual mice 4 hours post IP administration at the indicated dose mg/kg. Data represent
Supplementary Figure 1. IDH1 and IDH2 mutation site sequences on WHO grade III
 Supplementary Materials: Supplementary Figure 1. IDH1 and IDH2 mutation site sequences on WHO grade III patient samples. Genomic DNA samples extracted from punch biopsies from either FFPE or frozen tumor
Supplementary Information
 Supplementary Information Supplementary Figure 1. CD4 + T cell activation and lack of apoptosis after crosslinking with anti-cd3 + anti-cd28 + anti-cd160. (a) Flow cytometry of anti-cd160 (5D.10A11) binding
Supplementary Figure S1. PTPN2 levels are not altered in proliferating CD8+ T cells. Lymph node (LN) CD8+ T cells from C57BL/6 mice were stained with
 CD8+ T cells from C57BL/6 mice were stained with") Supplementary Figure S1. PTPN2 levels are not altered in proliferating CD8+ T cells. Lymph node (LN) CD8+ T cells from C57BL/6 mice were stained with CFSE and stimulated with plate-bound α-cd3ε (10µg/ml)
Supplementary Figure S1. PTPN2 levels are not altered in proliferating CD8+ T cells. Lymph node (LN) CD8+ T cells from C57BL/6 mice were stained with CFSE and stimulated with plate-bound α-cd3ε (10µg/ml)
Supplementary Figure 1. PD-L1 is glycosylated in cancer cells. (a) Western blot analysis of PD-L1 in breast cancer cells. (b) Western blot analysis
 Western blot analysis of PD-L1 in breast cancer cells. (b) Western blot analysis") Supplementary Figure 1. PD-L1 is glycosylated in cancer cells. (a) Western blot analysis of PD-L1 in breast cancer cells. (b) Western blot analysis of PD-L1 in ovarian cancer cells. (c) Western blot analysis
Supplementary Figure 1. PD-L1 is glycosylated in cancer cells. (a) Western blot analysis of PD-L1 in breast cancer cells. (b) Western blot analysis of PD-L1 in ovarian cancer cells. (c) Western blot analysis
LPS LPS P6 - + Supplementary Fig. 1.
 P6 LPS - - - + + + - LPS + + - - P6 + Supplementary Fig. 1. Pharmacological inhibition of the JAK/STAT blocks LPS-induced HMGB1 nuclear translocation. RAW 267.4 cells were stimulated with LPS in the absence
Supplementary Materials for
 www.sciencesignaling.org/cgi/content/full/9/439/ra78/dc1 Supplementary Materials for Small heterodimer partner mediates liver X receptor (LXR) dependent suppression of inflammatory signaling by promoting
Supplementary Figure 1 Chemokine and chemokine receptor expression during muscle regeneration (a) Analysis of CR3CR1 mrna expression by real time-pcr
 Analysis of CR3CR1 mrna expression by real time-pcr") Supplementary Figure 1 Chemokine and chemokine receptor expression during muscle regeneration (a) Analysis of CR3CR1 mrna expression by real time-pcr at day 0, 1, 4, 10 and 21 post- muscle injury. (b)
Supplementary Figure 1 Chemokine and chemokine receptor expression during muscle regeneration (a) Analysis of CR3CR1 mrna expression by real time-pcr at day 0, 1, 4, 10 and 21 post- muscle injury. (b)
Supplementary Figure S I: Effects of D4F on body weight and serum lipids in apoe -/- mice.
 Supplementary Figures: Supplementary Figure S I: Effects of D4F on body weight and serum lipids in apoe -/- mice. Male apoe -/- mice were fed a high-fat diet for 8 weeks, and given PBS (model group) or
Supplementary Figure 1. Generation of knockin mice expressing L-selectinN138G. (a) Schematics of the Sellg allele (top), the targeting vector, the
 Schematics of the Sellg allele (top), the targeting vector, the") Supplementary Figure 1. Generation of knockin mice expressing L-selectinN138G. (a) Schematics of the Sellg allele (top), the targeting vector, the targeted allele in ES cells, and the mutant allele in
Supplementary Figure 1. Generation of knockin mice expressing L-selectinN138G. (a) Schematics of the Sellg allele (top), the targeting vector, the targeted allele in ES cells, and the mutant allele in
Supplementary Figures
 Supplementary Figures Supplementary Fig. 1. Galectin-3 is present within tumors. (A) mrna expression levels of Lgals3 (galectin-3) and Lgals8 (galectin-8) in the four classes of cell lines as determined
RayBio KinaseSTAR TM Akt Activity Assay Kit
 Activity Assay Kit User Manual Version 1.0 March 13, 2015 RayBio KinaseSTAR TM Akt Activity Kit Protocol (Cat#: 68AT-Akt-S40) RayBiotech, Inc. We Provide You With Excellent Support And Service Tel:(Toll
Supplemental Figure 1
 Supplemental Figure 1 1a 1c PD-1 MFI fold change 6 5 4 3 2 1 IL-1α IL-2 IL-4 IL-6 IL-1 IL-12 IL-13 IL-15 IL-17 IL-18 IL-21 IL-23 IFN-α Mut Human PD-1 promoter SBE-D 5 -GTCTG- -1.2kb SBE-P -CAGAC- -1.kb
Aggregated neutrophil extracellular traps limit inflammation by degrading cytokines and chemokines
 CORRECTION NOTICE Nat. Med. doi:10.1038/nm.3547; corrected online 25 August 2014 Aggregated neutrophil extracellular traps limit inflammation by degrading cytokines and chemokines Christine Schauer, Christina
Supplementary Figure 1.TRIM33 binds β-catenin in the nucleus. a & b, Co-IP of endogenous TRIM33 with β-catenin in HT-29 cells (a) and HEK 293T cells
 and HEK 293T cells") Supplementary Figure 1.TRIM33 binds β-catenin in the nucleus. a & b, Co-IP of endogenous TRIM33 with β-catenin in HT-29 cells (a) and HEK 293T cells (b). TRIM33 was immunoprecipitated, and the amount of
Supplementary Figure 1.TRIM33 binds β-catenin in the nucleus. a & b, Co-IP of endogenous TRIM33 with β-catenin in HT-29 cells (a) and HEK 293T cells (b). TRIM33 was immunoprecipitated, and the amount of
Supplemental Figure 1. Western blot analysis indicated that MIF was detected in the fractions of
 Supplemental Figure Legends Supplemental Figure 1. Western blot analysis indicated that was detected in the fractions of plasma membrane and cytosol but not in nuclear fraction isolated from Pkd1 null
SUPPLEMENTARY INFORMATION
 DOI: 1.138/ncb3355 a S1A8 + cells/ total.1.8.6.4.2 b S1A8/?-Actin c % T-cell proliferation 3 25 2 15 1 5 T cells Supplementary Figure 1 Inter-tumoral heterogeneity of MDSC accumulation in mammary tumor
Type of file: PDF Title of file for HTML: Supplementary Information Description: Supplementary Figures
 Type of file: PDF Title of file for HTML: Supplementary Information Description: Supplementary Figures Type of file: MOV Title of file for HTML: Supplementary Movie 1 Description: NLRP3 is moving along
p = formed with HCI-001 p = Relative # of blood vessels that formed with HCI-002 Control Bevacizumab + 17AAG Bevacizumab 17AAG
 A.. Relative # of ECs associated with HCI-001 1.4 1.2 1.0 0.8 0.6 0.4 0.2 0.0 ol b p < 0.001 Relative # of blood vessels that formed with HCI-001 1.4 1.2 1.0 0.8 0.6 0.4 0.2 0.0 l b p = 0.002 Control IHC:
SUPPLEMENTARY INFORMATION. Supplementary Figures S1-S9. Supplementary Methods
 SUPPLEMENTARY INFORMATION SUMO1 modification of PTEN regulates tumorigenesis by controlling its association with the plasma membrane Jian Huang 1,2#, Jie Yan 1,2#, Jian Zhang 3#, Shiguo Zhu 1, Yanli Wang
SUPPLEMENTARY FIGURES
 SUPPLEMENTARY FIGURES Figure S1. Clinical significance of ZNF322A overexpression in Caucasian lung cancer patients. (A) Representative immunohistochemistry images of ZNF322A protein expression in tissue
Nature Neuroscience: doi: /nn Supplementary Figure 1
 Supplementary Figure 1 EGFR inhibition activates signaling pathways (a-b) EGFR inhibition activates signaling pathways (a) U251EGFR cells were treated with erlotinib (1µM) for the indicated times followed
Supplementary Figure 1. Basal level EGFR across a panel of ESCC lines. Immunoblots demonstrate the expression of phosphorylated and total EGFR as
 Supplementary Figure 1. Basal level EGFR across a panel of ESCC lines. Immunoblots demonstrate the expression of phosphorylated and total EGFR as well as their downstream effectors across a panel of ESCC
Supplementary Materials
 Supplementary Materials Figure S1. MTT Cell viability assay. To measure the cytotoxic potential of the oxidative treatment, the MTT [3-(4,5-dimethylthiazol- 2-yl)-2,5-diphenyl tetrazolium bromide] assay
hexahistidine tagged GRP78 devoid of the KDEL motif (GRP78-His) on SDS-PAGE. This
 on SDS-PAGE. This") SUPPLEMENTAL FIGURE LEGEND Fig. S1. Generation and characterization of. (A) Coomassie staining of soluble hexahistidine tagged GRP78 devoid of the KDEL motif (GRP78-His) on SDS-PAGE. This protein was expressed
SUPPLEMENTAL FIGURE LEGEND Fig. S1. Generation and characterization of. (A) Coomassie staining of soluble hexahistidine tagged GRP78 devoid of the KDEL motif (GRP78-His) on SDS-PAGE. This protein was expressed
The autoimmune disease-associated PTPN22 variant promotes calpain-mediated Lyp/Pep
 SUPPLEMENTARY INFORMATION The autoimmune disease-associated PTPN22 variant promotes calpain-mediated Lyp/Pep degradation associated with lymphocyte and dendritic cell hyperresponsiveness Jinyi Zhang, Naima
p47 negatively regulates IKK activation by inducing the lysosomal degradation of polyubiquitinated NEMO
 Supplementary Information p47 negatively regulates IKK activation by inducing the lysosomal degradation of polyubiquitinated NEMO Yuri Shibata, Masaaki Oyama, Hiroko Kozuka-Hata, Xiao Han, Yuetsu Tanaka,
Supplementary Fig. 1. Identification of acetylation of K68 of SOD2
 Supplementary Fig. 1. Identification of acetylation of K68 of SOD2 A B H. sapiens 54 KHHAAYVNNLNVTEEKYQEALAK 75 M. musculus 54 KHHAAYVNNLNATEEKYHEALAK 75 X. laevis 55 KHHATYVNNLNITEEKYAEALAK 77 D. rerio
HD1 (FLU) HD2 (EBV) HD2 (FLU)
 HD2 (EBV) HD2 (FLU)") ramer staining + anti-pe beads ramer staining a HD1 (FLU) HD2 (EBV) HD2 (FLU).73.11.56.46.24 1.12 b CD127 + c CD127 + d CD127 - e CD127 - PD1 - PD1 + PD1 + PD1-1 1 1 1 %CD127 + PD1-8 6 4 2 + anti-pe %CD127
ramer staining + anti-pe beads ramer staining a HD1 (FLU) HD2 (EBV) HD2 (FLU).73.11.56.46.24 1.12 b CD127 + c CD127 + d CD127 - e CD127 - PD1 - PD1 + PD1 + PD1-1 1 1 1 %CD127 + PD1-8 6 4 2 + anti-pe %CD127
Supplementary Materials and Methods
 Supplementary Materials and Methods Immunoblotting Immunoblot analysis was performed as described previously (1). Due to high-molecular weight of MUC4 (~ 950 kda) and MUC1 (~ 250 kda) proteins, electrophoresis
MicroRNAs Modulate the Noncanonical NF- B Pathway by Regulating IKK Expression During Macrophage Differentiation
 MicroRNAs Modulate the Noncanonical NF- B Pathway by Regulating IKK Expression During Macrophage Differentiation Tao Li 1 *, Michael J. Morgan 1 *, Swati Choksi 1, Yan Zhang 1, You-Sun Kim 2#, Zheng-gang
Supplementary. presence of the. (c) mrna expression. Error. in naive or
 mrna expression. Error. in naive or") Figure 1. (a) Naive CD4 + T cells were activated in the presence of the indicated cytokines for 3 days. Enpp2 mrna expression was measured by qrt-pcrhr, infected with (b, c) Naive CD4 + T cells were activated
Figure 1. (a) Naive CD4 + T cells were activated in the presence of the indicated cytokines for 3 days. Enpp2 mrna expression was measured by qrt-pcrhr, infected with (b, c) Naive CD4 + T cells were activated
Supplementary Figures for TSC1 controls macrophage polarization to prevent inflammatory disorder by Linnan Zhu et al
 Supplementary Figures for TSC1 controls macrophage polarization to prevent inflammatory disorder by Linnan Zhu et al Suppl. Fig. 1 Tissue DN C Proteins kd TSC1-17 TSC 1 loxp bp -48-285 ctin PEMs Neutrophils
William C. Comb, Jessica E. Hutti, Patricia Cogswell, Lewis C. Cantley, and Albert S. Baldwin
 Molecular Cell, Volume 45 Supplemental Information p85 SH2 Domain Phosphorylation by IKK Promotes Feedback Inhibition of PI3K and Akt in Response to Cellular Starvation William C. Comb, Jessica E. Hutti,
Rescue of mutant rhodopsin traffic by metformin-induced AMPK activation accelerates photoreceptor degeneration Athanasiou et al
 Supplementary Material Rescue of mutant rhodopsin traffic by metformin-induced AMPK activation accelerates photoreceptor degeneration Athanasiou et al Supplementary Figure 1. AICAR improves P23H rod opsin
Supplementary Fig. 1. GPRC5A post-transcriptionally down-regulates EGFR expression. (a) Plot of the changes in steady state mrna levels versus
 Plot of the changes in steady state mrna levels versus") Supplementary Fig. 1. GPRC5A post-transcriptionally down-regulates EGFR expression. (a) Plot of the changes in steady state mrna levels versus changes in corresponding proteins between wild type and Gprc5a-/-
Supplementary Fig. 1. GPRC5A post-transcriptionally down-regulates EGFR expression. (a) Plot of the changes in steady state mrna levels versus changes in corresponding proteins between wild type and Gprc5a-/-
Supplementary Figure 1
 Supplementary Figure 1 a γ-h2ax MDC1 RNF8 FK2 BRCA1 U2OS Cells sgrna-1 ** 60 sgrna 40 20 0 % positive Cells (>5 foci per cell) b ** 80 sgrna sgrna γ-h2ax MDC1 γ-h2ax RNF8 FK2 MDC1 BRCA1 RNF8 FK2 BRCA1
a b G75 G60 Sw-2 Sw-1 Supplementary Figure 1. Structure predictions by I-TASSER Server.
 a b G75 2 2 G60 Sw-2 Sw-1 Supplementary Figure 1. Structure predictions by I-TASSER Server. a. Overlay of top 10 models generated by I-TASSER illustrates the potential effect of 7 amino acid insertion
Supplementary Materials for
 www.sciencesignaling.org/cgi/content/full/7/308/ra4/dc1 Supplementary Materials for Antipsychotics Activate mtorc1-dependent Translation to Enhance Neuronal Morphological Complexity Heather Bowling, Guoan
Supplementary Table; Supplementary Figures and legends S1-S21; Supplementary Materials and Methods
 Silva et al. PTEN posttranslational inactivation and hyperactivation of the PI3K/Akt pathway sustain primary T cell leukemia viability Supplementary Table; Supplementary Figures and legends S1-S21; Supplementary
SUPPLEMENTARY INFORMATION
 doi:10.1038/nature12652 Supplementary Figure 1. PRDM16 interacts with endogenous EHMT1 in brown adipocytes. Immunoprecipitation of PRDM16 complex by flag antibody (M2) followed by Western blot analysis
Nature Medicine: doi: /nm.3922
 Title: Glucocorticoid-induced tumor necrosis factor receptor-related protein co-stimulation facilitates tumor regression by inducing IL-9-producing helper T cells Authors: Il-Kyu Kim, Byung-Seok Kim, Choong-Hyun
B-cell expansion and lymphomagenesis induced by chronic CD40-signaling is
 -cell expansion and lymphomagenesis induced by chronic CD4-signaling is strictly dependent on CD19 Caroline Hojer 1*, Samantha Frankenberger 1*, Lothar J. Strobl 1, Samantha Feicht 1, Kristina Djermanovic
Nature Immunology: doi: /ni.3866
 Nature Immunology: doi:10.1038/ni.3866 Supplementary Figure 1 The effect of TIPE2 on chemotaxis. a, The expression of TIPE2 in dhl-60c, dhl-60t, TIPE2-expressing and 15/16Q-expressing dhl-60t neutrophils
Supplemental Table I.
 Supplemental Table I Male / Mean ± SEM n Mean ± SEM n Body weight, g 29.2±0.4 17 29.7±0.5 17 Total cholesterol, mg/dl 534.0±30.8 17 561.6±26.1 17 HDL-cholesterol, mg/dl 9.6±0.8 17 10.1±0.7 17 Triglycerides,
HEK293FT cells were transiently transfected with reporters, N3-ICD construct and
 Supplementary Information Luciferase reporter assay HEK293FT cells were transiently transfected with reporters, N3-ICD construct and increased amounts of wild type or kinase inactive EGFR. Transfections
Human recombinat MIF protein (hrmif), MW: Da. m/z. hrmif ( Da) + 4-IPP (282 Da) MWtot ~ Da. m/z.
, MW: Da. m/z. hrmif ( Da) + 4-IPP (282 Da) MWtot ~ Da. m/z.") Intensity % Intensity % A Human recombinat MIF protein (hrmif), MW: 12428.31 Da m/z hrmif (12428.31 Da) + 4-IPP (282 Da) MWtot ~ 12715.21 Da m/z B HTC/C3 DAPI phistone-h3 Merge HTC/C3 DAPI phistone-h3
Intensity % Intensity % A Human recombinat MIF protein (hrmif), MW: 12428.31 Da m/z hrmif (12428.31 Da) + 4-IPP (282 Da) MWtot ~ 12715.21 Da m/z B HTC/C3 DAPI phistone-h3 Merge HTC/C3 DAPI phistone-h3
Quantification of intracellular payload release from
 Quantification of intracellular payload release from polymersome nanoparticles Edoardo Scarpa 1,2, Joanne L. Bailey 2, Agnieszka A. Janeczek 1,2, Patrick S. Stumpf 1,2, Alexander H. Johnston 2, Richard
Figure S1. PMVs from THP-1 cells expose phosphatidylserine and carry actin. A) Flow
 Flow") SUPPLEMENTARY DATA Supplementary Figure Legends Figure S1. PMVs from THP-1 cells expose phosphatidylserine and carry actin. A) Flow cytometry analysis of PMVs labelled with annexin-v-pe (Guava technologies)
SUPPLEMENTARY DATA Supplementary Figure Legends Figure S1. PMVs from THP-1 cells expose phosphatidylserine and carry actin. A) Flow cytometry analysis of PMVs labelled with annexin-v-pe (Guava technologies)
SUPPLEMENTARY MATERIAL
 SUPPLEMENTARY MATERIAL IL-1 signaling modulates activation of STAT transcription factors to antagonize retinoic acid signaling and control the T H 17 cell it reg cell balance Rajatava Basu 1,5, Sarah K.
gliomas. Fetal brain expected who each low-
 Supplementary Figure S1. Grade-specificity aberrant expression of HOXA genes in gliomas. (A) Representative RT-PCR analyses of HOXA gene expression in human astrocytomas. Exemplified glioma samples include
Supplementary Figure 1. IL-12 serum levels and frequency of subsets in FL patients. (A) IL-12
 IL-12") 1 Supplementary Data Figure legends Supplementary Figure 1. IL-12 serum levels and frequency of subsets in FL patients. (A) IL-12 serum levels measured by multiplex ELISA (Luminex) in FL patients before
1 Supplementary Data Figure legends Supplementary Figure 1. IL-12 serum levels and frequency of subsets in FL patients. (A) IL-12 serum levels measured by multiplex ELISA (Luminex) in FL patients before
TSH Receptor Monoclonal Antibody (49) Catalog Number MA3-218 Product data sheet
 Catalog Number MA3-218 Product data sheet") Website: thermofisher.com Customer Service (US): 1 800 955 6288 ext. 1 Technical Support (US): 1 800 955 6288 ext. 441 TSH Receptor Monoclonal Antibody (49) Catalog Number MA3-218 Product data sheet Details
Website: thermofisher.com Customer Service (US): 1 800 955 6288 ext. 1 Technical Support (US): 1 800 955 6288 ext. 441 TSH Receptor Monoclonal Antibody (49) Catalog Number MA3-218 Product data sheet Details
SUPPLEMENTARY INFORMATION
 Supplemental Figure 1. Furin is efficiently deleted in CD4 + and CD8 + T cells. a, Western blot for furin and actin proteins in CD4cre-fur f/f and fur f/f Th1 cells. Wild-type and furin-deficient CD4 +
Supplementary Data 1. Alanine substitutions and position variants of APNCYGNIPL. Applied in
 Supplementary Data 1. Alanine substitutions and position variants of APNCYGNIPL. Applied in Supplementary Fig. 2 Substitution Sequence Position variant Sequence original APNCYGNIPL original APNCYGNIPL
a surface permeabilized
 a surface permeabilized RAW 64.7 P388D1 J774 b CD11b + Ly-6G - Blood Monocytes WT Supplementary Figure 1. Cell surface expression on macrophages and DCs. (a) RAW64.7, P388D1, and J774 cells were subjected
7SK ChIRP-seq is specifically RNA dependent and conserved between mice and humans.
 Supplementary Figure 1 7SK ChIRP-seq is specifically RNA dependent and conserved between mice and humans. Regions targeted by the Even and Odd ChIRP probes mapped to a secondary structure model 56 of the
Supplementary Figure 1. Successful excision of genes from WBM lysates and
 Supplementary Information: Supplementary Figure 1. Successful excision of genes from WBM lysates and survival of mice with different genotypes. (a) The proper excision of Pten, p110α, p110α and p110δ was
EFFECTS OF HEMATURIA ON THE PROTEOMIC PROFILE OF URINARY
 Supporting Information EFFECTS OF HEMATURIA ON THE PROTEOMIC PROFILE OF URINARY EXTRACELLULAR VESICLES: TECHNICAL CHALLENGES. #Francesca Raimondo 1*, #Clizia Chinello 1, Martina Stella 1, Lucia Santorelli
Supplemental Figure 1. CD69 antigen-response curves of CAR engrafted Jurkat T cells. Supplemental Figure 2.
 Supplemental Figure 1. CD69 antigen-response curves of CAR engrafted Jurkat T cells. To evaluate the antigen sensitivity of mutant CARs transduced Jurkat T cells were stimulated with varying concentrations
Supplementary Figure 1
 Supplementary Figure 1 6 HE-50 HE-116 E-1 HE-108 Supplementary Figure 1. Targeted drug response curves of endometrial cancer cells. Endometrial cancer cell lines were incubated with serial dilutions of
Appendix. Table of Contents
 Appendix Table of Contents Appendix Figures Figure S1: Gp78 is not required for the degradation of mcherry-cl1 in Hela Cells. Figure S2: Indel formation in the MARCH6 sgrna targeted HeLa clones. Figure
Figure S1. Reduction in glomerular mir-146a levels correlate with progression to higher albuminuria in diabetic patients.
 Supplementary Materials Supplementary Figures Figure S1. Reduction in glomerular mir-146a levels correlate with progression to higher albuminuria in diabetic patients. Figure S2. Expression level of podocyte
Xenoestrogen-induced Regulation of EZH2 and Histone Methylation via Non-Genomic Estrogen
 Xenoestrogen-induced Regulation of EZH2 and Histone Methylation via Non-Genomic Estrogen Receptor Signaling to PI3K/AKT Tiffany G. Bredfeldt, Kristen L. Greathouse, Stephen H. Safe, Mien-Chie Hung, Mark
Eosinophils are required. for the maintenance of plasma cells in the bone marrow
 Eosinophils are required for the maintenance of plasma cells in the bone marrow Van Trung Chu, Anja Fröhlich, Gudrun Steinhauser, Tobias Scheel, Toralf Roch, Simon Fillatreau, James J. Lee, Max Löhning
Supplementary Figure S1 Supplementary Figure S2
 Supplementary Figure S A) The blots shown in Figure B were qualified by using Gel-Pro analyzer software (Rockville, MD, USA). The ratio of LC3II/LC3I to actin was then calculated. The data are represented
Expression constructs
 Gene expressed in bebe3 ZmBEa Expression constructs 35S ZmBEa Pnos:Hygromycin r 35S Pnos:Hygromycin r 35S ctp YFP Pnos:Hygromycin r B -1 Chl YFP- Merge Supplemental Figure S1: Constructs Used for the Expression
A dual PI3 kinase/mtor inhibitor reveals emergent efficacy in glioma
 Supplemental data A dual PI3 kinase/mtor inhibitor reveals emergent efficacy in glioma Qi-Wen Fan, Zachary A. Knight, David D. Goldenberg, Wei Yu, Keith E. Mostov, David Stokoe, Kevan M. Shokat, and William
Supplementary Figures
 Supplementary Figures Supplementary Figure 1. Confirmation of Dnmt1 conditional knockout out mice. a, Representative images of sorted stem (Lin - CD49f high CD24 + ), luminal (Lin - CD49f low CD24 + )
Low Avidity CMV + T Cells accumulate in Old Humans
 Supplementary Figure Legends Supplementary Figure 1. CD45RA expressing CMVpp65-specific T cell populations accumulate within HLA-A*0201 and HLA-B*0701 individuals Pooled data showing the size of the NLV/HLA-A*0201-specific
Supplementary Figure 1. Efficiency of Mll4 deletion and its effect on T cell populations in the periphery. Nature Immunology: doi: /ni.
 Supplementary Figure 1 Efficiency of Mll4 deletion and its effect on T cell populations in the periphery. Expression of Mll4 floxed alleles (16-19) in naive CD4 + T cells isolated from lymph nodes and
SUPPLEMENTARY INFORMATION
 SUPPLEMENTARY INFORMATION doi:10.1038/nature11429 S1a 6 7 8 9 Nlrc4 allele S1b Nlrc4 +/+ Nlrc4 +/F Nlrc4 F/F 9 Targeting construct 422 bp 273 bp FRT-neo-gb-PGK-FRT 3x.STOP S1c Nlrc4 +/+ Nlrc4 F/F casp1
Supplementary Information Titles Journal: Nature Medicine
 Supplementary Information Titles Journal: Nature Medicine Article Title: Corresponding Author: Supplementary Item & Number Supplementary Fig.1 Fig.2 Fig.3 Fig.4 Fig.5 Fig.6 Fig.7 Fig.8 Fig.9 Fig. Fig.11
Supplementary material. VAMP7 controls T cell activation by regulating recruitment and phosphorylation of vesicular
 Supplementary material VAMP7 controls T cell activation by regulating recruitment and phosphorylation of vesicular Lat to the TCR activation sites. Paola Larghi, David J Williamson, Jean-Marie Carpier,
Crucial role for human Toll-like receptor 4 in the development of contact allergy to nickel
 Supplementary Figures 1-8 Crucial role for human Toll-like receptor 4 in the development of contact allergy to nickel Marc Schmidt 1,2, Badrinarayanan Raghavan 1,2, Verena Müller 1,2, Thomas Vogl 3, György
Supplementary Information
 Supplementary Information Supplementary Figure 1! a! b! Nfatc1!! Nfatc1"! P1! P2! pa1! pa2! ex1! ex2! exons 3-9! ex1! ex11!!" #" Nfatc1A!!" Nfatc1B! #"!" Nfatc1C! #" DN1! DN2! DN1!!A! #A!!B! #B!!C! #C!!A!
Supplemental information
 Supplemental information PI(3)K p11δ controls the sucellular compartmentalization of TLR4 signaling and protects from endotoxic shock Ezra Aksoy, Salma Taoui, David Torres, Sandrine Delauve, Aderrahman
Procaspase-3. Cleaved caspase-3. actin. Cytochrome C (10 M) Z-VAD-fmk. Procaspase-3. Cleaved caspase-3. actin. Z-VAD-fmk
 Z-VAD-fmk. Procaspase-3. Cleaved caspase-3. actin. Z-VAD-fmk") A HeLa actin - + + - - + Cytochrome C (1 M) Z-VAD-fmk PMN - + + - - + actin Cytochrome C (1 M) Z-VAD-fmk Figure S1. (A) Pan-caspase inhibitor z-vad-fmk inhibits cytochrome c- mediated procaspase-3 cleavage.
A HeLa actin - + + - - + Cytochrome C (1 M) Z-VAD-fmk PMN - + + - - + actin Cytochrome C (1 M) Z-VAD-fmk Figure S1. (A) Pan-caspase inhibitor z-vad-fmk inhibits cytochrome c- mediated procaspase-3 cleavage.
Relative SOD1 activity. Relative SOD2 activity. Relative SOD activity (Infected:Mock) + CP + DDC
 + CP + DDC") Supplementary Figure 1. SOD1 activity is significantly increased relative to SOD1 levels. SOD1 and SOD2 activities in the infected mork13 cells are shown normalised to their corresponding levels and relative
Supplementary Figure 1. SOD1 activity is significantly increased relative to SOD1 levels. SOD1 and SOD2 activities in the infected mork13 cells are shown normalised to their corresponding levels and relative
Supplementary Figure 1 IMQ-Induced Mouse Model of Psoriasis. IMQ cream was
 Supplementary Figure 1 IMQ-Induced Mouse Model of Psoriasis. IMQ cream was painted on the shaved back skin of CBL/J and BALB/c mice for consecutive days. (a, b) Phenotypic presentation of mouse back skin
Supplementary Fig. 1 No relative growth advantage of Foxp3 negative cells.
 Supplementary Fig. 1 Supplementary Figure S1: No relative growth advantage of Foxp3 negative cells. itreg were induced from WT (A) or FIR (B) CD4 + T cells. FIR itregs were then removed from the TCR signal
Schwarz et al. Activity-Dependent Ubiquitination of GluA1 Mediates a Distinct AMPAR Endocytosis
 Schwarz et al Activity-Dependent Ubiquitination of GluA1 Mediates a Distinct AMPAR Endocytosis and Sorting Pathway Supplemental Data Supplemental Fie 1: AMPARs undergo activity-mediated ubiquitination
Supplementary Table 1. Metabolic parameters in GFP and OGT-treated mice
 Supplementary Table 1. Metabolic parameters in GFP and OGT-treated mice Fasted Refed GFP OGT GFP OGT Liver G6P (mmol/g) 0.03±0.01 0.04±0.02 0.60±0.04 0.42±0.10 A TGs (mg/g of liver) 20.08±5.17 16.29±0.8
SUPPLEMENTAL MATERIALS AND METHODS. Puromycin-synchronized metabolic labelling - Transfected HepG2 cells were depleted of
 SUPPLEMENTAL MATERIALS AND METHODS Puromycin-synchronized metabolic labelling - Transfected HepG2 cells were depleted of cysteine and methionine and then treated with 10 μm puromycin in depletion medium
Supplementary Figure 1. Efficient DC depletion in CD11c.DOG transgenic mice
 Supplementary Figure 1. Efficient DC depletion in CD11c.DOG transgenic mice (a) CD11c.DOG transgenic mice (tg) were treated with 8 ng/g body weight (b.w.) diphtheria toxin (DT) i.p. on day -1 and every
Zhu et al, page 1. Supplementary Figures
 Zhu et al, page 1 Supplementary Figures Supplementary Figure 1: Visual behavior and avoidance behavioral response in EPM trials. (a) Measures of visual behavior that performed the light avoidance behavior
NC bp. b 1481 bp
 Kcna3 NC 11 178 p 1481 p 346 p c *** *** d relative expression..4.3.2.1 CD4 T cells Kcna1 Kcna2 Kcna3 Kcna4 Kcna Kcna6 Kcna7 Kcnn4 relative expression..4.3.2.1 CD8 T cells Kcna1 Kcna2 Kcna3 Kcna4 Kcna
Tel: ; Fax: ;
 Tel.: +98 216 696 9291; Fax: +98 216 696 9291; E-mail: mrasadeghi@pasteur.ac.ir Tel: +98 916 113 7679; Fax: +98 613 333 6380; E-mail: abakhshi_e@ajums.ac.ir A Soluble Chromatin-bound MOI 0 1 5 0 1 5 HDAC2
Supplementary Figures
 Supplementary Figures Supplementary Figure 1 Characterization of stable expression of GlucB and sshbira in the CT26 cell line (a) Live cell imaging of stable CT26 cells expressing green fluorescent protein
Supplementary Materials for
 www.sciencesignaling.org/cgi/content/full/3/114/ra23/dc1 Supplementary Materials for Regulation of Zap70 Expression During Thymocyte Development Enables Temporal Separation of CD4 and CD8 Repertoire Selection
sequences of a styx mutant reveals a T to A transversion in the donor splice site of intron 5
 sfigure 1 Styx mutant mice recapitulate the phenotype of SHIP -/- mice. (A) Analysis of the genomic sequences of a styx mutant reveals a T to A transversion in the donor splice site of intron 5 (GTAAC