Table S1. Relative abundance of AGO1/4 proteins in different organs. Table S2. Summary of smrna datasets from various samples.
|
|
|
- Shona Little
- 5 years ago
- Views:
Transcription
1 Supplementary files Table S1. Relative abundance of AGO1/4 proteins in different organs. Table S2. Summary of smrna datasets from various samples. Table S3. Specificity of AGO1- and AGO4-preferred 24-nt smrnas. Table S4. Expression profiles of known mirnas. Table S5. Classification of known mirna precursors. Table S6. A list of new mirnas found in AGO1/AGO4 complexes. Table S7. A list of collateral mirnas and their AGO-association in various organs. Table S8. A list of isomirnas. Table S9. A list of new phased smrna clusters. Table S10. Cis-NAT pairs and sirnas. Figure S1. Cloning of AGO-associated smrnas and AGO1-associated smrnas. (A) The smrnas recovered from AGO complexes were spiked with 32 P-labeled internal 21- and 24-nt smrna controls and traced during the whole cloning processes. Sample orders listed are internal control; 1, AGO1 IP flower; 2, AGO1 TSP flower; 3, AGO1 TSP seedling; 4, AGO4 TSP flower; 5, AGO4 TSP seedling; 6, unfractionated flower and internal control. (B) Ethiumbromide staining of AGO1-associated smrnas. AGO1-complexes were immunoprecipitated from 4 g of flower or seedling samples with (+) or without (-) FLAG antibody. Figure S2. Coverage comparison of AGO-associated smrnas identified by TSP with those
2 detected by IP or reported by Mi et.al (2008). X-axis represents smrna clone numbers; Y-axis represents proportion of comparative smrna coverage. Comparison of AGO1-associated smrnas identified by TSP with those detected by IP in flowers (A) and roots (B), as well as comparison of AGO1 and AGO4-associated smrnas (C and D) recovered by TSP with those reported by Mi et.al (2008) are shown. Only smrnas with perfectly mapped genomic loci were used. Figure S3. Size distribution and first nucleotide preference of smrnas in unfractionated sample and AGO1/4 complexes from leaves, roots and seedlings. For details see legend of Figure 2. Figure S4. Heat map of known mirnas with clone numbers fewer than For details see legend of Figure 4. Figure S5. Phased smrna clusters on TAS1-4. Bar charts present non-redundant clone numbers of phased smrnas. For details see legend of Figure 7. Figure S6. Chromosome distribution of AGO1 and AGO4-associated 24-nt smrnas. X-axis gives chromosome positions on a scale of 10,000-nt. The log2 transformed total clone numbers of smrnas generated from each 10,000-nt region were shown by red bars (for smrna loci with total clone number great than 10,000) and blue bars (for smrna loci with total clone
3 numbers greater than 1,000 but less than 10,000). 1-F, AGO1-associated 24-nt smrnas in flowers; 1-L, AGO1-associated 24-nt smrnas in leaves; 1-R, AGO1-associated 24-nt smrnas in roots; 1-S, AGO1-associated 24-nt smrnas in seedlings. 4-F, AGO4-associated 24-nt smrnas in flowers; 4-L, AGO4-associated 24-nt smrnas in leaves; 4-R, AGO4-associated 24- nt smrnas in roots; 4-S, AGO4-associated 24-nt smrnas in seedlings; Figure S7. Pol IV and Pol V dependence of AGO1 and AGO4-associated smrnas. X-axis gives smrna dependence of Pol IV and Pol V. Pol IV, smrnas only dependent on Pol IV; Pol V, smrnas potentially only dependent on Pol V; Pol IV and Pol V, smrnas depend on both Pol IV and Pol V. Y-axis presents proportion of AGO preference in each category. Figure S8. Size distribution of smrnas in Pol IV and Pol V samples. (A) Size distribution of smrnas from WT, pol IV and pol V mutant plants. (B) Size distribution of Pol IV-dependent and potentially Pol V-dependent smrnas. X-axis gives smrna length (nt) and Y-axis presents total clone number of smrnas. Figure S9. Illustration of algorithm used for prediction of phased smrna clusters. smrna sequences are shown in different colors, and gaps between sequenced smrnas are represented by open rectangle.


 Figure S1 21 nt 24 nt")
4 M M RT-PCR 3 ligation 5 ligation Solexa Deep Sequencing 21 nt 24 nt 3 adapter-smrnas Un-ligated 3 adapter-smrnas-5 adapter Un-ligated AGO1 FLAG(-) FLAG(+) Figure S1 21 nt 24 nt Seedlings Seedlings Flowers
5 A C Figure S2 smrnas reported by Mi et al., (2008) also recovered by TSP smrnas identified by TSP also reported by Mi et al., (2008) smrnas identified by IP also recovered by TSP smrnas identified by TSP also recovered by IP B D smrnas reported by Mi et al., (2008) also recovered by TSP smrnas identified by TSP also reported by Mi et al., (2008) smrnas identified by IP also recovered by TSP smrnas identified by TSP also recovered by IP
6 proportion proportion proportion proportion A smrnas in leaves C Figure S UE AGO1 AGO G start C start U start A start UE AGO1 AGO4 B smrna length (nt) D UE AGO1 AGO G start C start U start A start smrna length (nt) UE AGO1 AGO4
 D 7 10 6 3 UE AGO1 AGO4 9 8 7 6 3 G start C start U start A start 20 21 22 23 24 25 smrna length (nt) UE AGO1")
7 proportion proportion proportion proportion A smrnas in roots C UE AGO1 AGO G start C start U start A start UE AGO1 AGO4 B smrna length (nt) D UE AGO1 AGO G start C start U start A start smrna length (nt) UE AGO1 AGO4

 UE AGO1")
8 proportion proportion proportion proportion A smrnas in seedlings C UE AGO1 AGO G start C start U start A start UE AGO1 AGO4 B smrna length (nt) D UE AGO1 AGO G start C start U start A start smrna length (nt) UE AGO1 AGO4
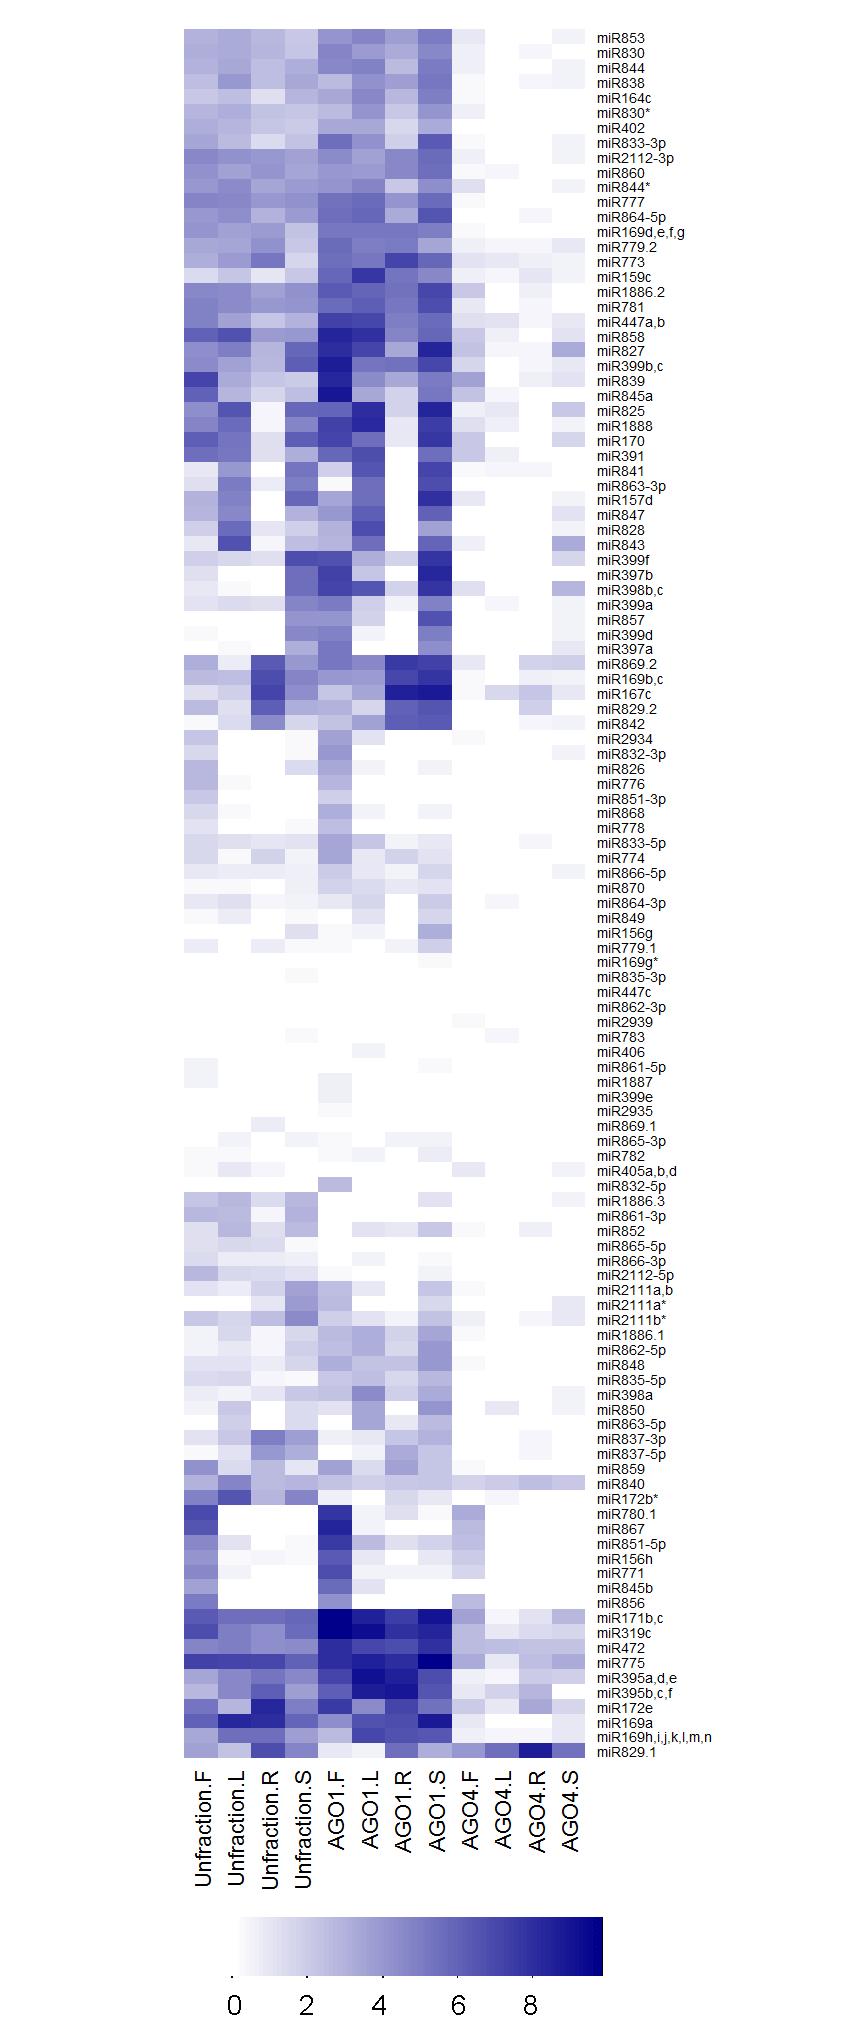
9 Figure S4
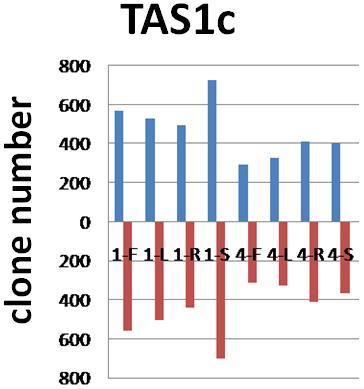
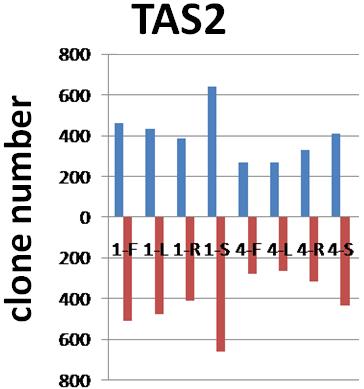
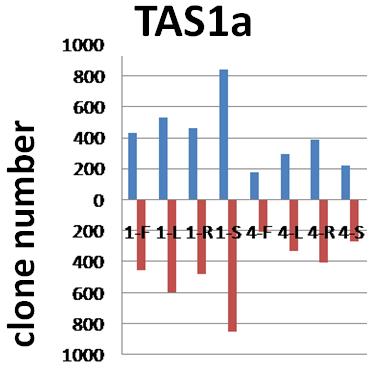
10 Figure S5
11 chromosome 1 Figure S6 1-F 1-L 1-R 1-S 4-F 4-L 4-R 4-S

12 chromosome 2 1-F 1-L 1-R 1-S 4-F 4-L 4-R 4-S
13 chromosome 3 1-F 1-L 1-R 1-S 4-F 4-L 4-R 4-S
14 chromosome 4 1-F 1-L 1-R 1-S 4-F 4-L 4-R 4-S
15 chromosome 5 1-F 1-L 1-R 1-S 4-F 4-L 4-R 4-S
16 proportion Figure S AGO4 AGO1 3 Pol IV Pol V Pol IV and Pol V
17 Figure S8 Col-0 Pol IV mutant Pol V mutant Pol IV-dependent Pol V-dependent
18 Figure S9
sirna count per 50 kb small RNAs matching the direct strand Repeat length (bp) per 50 kb repeats in the chromosome
 per 50 kb repeats in the chromosome") Qi et al. 26-3-2564C Qi et al., Figure S1 sirna count per 5 kb small RNAs matching the direct strand sirna count per 5 kb small RNAs matching the complementary strand Repeat length (bp) per 5 kb repeats
Qi et al. 26-3-2564C Qi et al., Figure S1 sirna count per 5 kb small RNAs matching the direct strand sirna count per 5 kb small RNAs matching the complementary strand Repeat length (bp) per 5 kb repeats
Supplemental Figure 1. Small RNA size distribution from different soybean tissues.
 Supplemental Figure 1. Small RNA size distribution from different soybean tissues. The size of small RNAs was plotted versus frequency (percentage) among total sequences (A, C, E and G) or distinct sequences
Supplementary Figure S1. Gene expression analysis of epidermal marker genes and TP63.
 Supplementary Figure Legends Supplementary Figure S1. Gene expression analysis of epidermal marker genes and TP63. A. Screenshot of the UCSC genome browser from normalized RNAPII and RNA-seq ChIP-seq data
Supplemental Figure 1. Genes showing ectopic H3K9 dimethylation in this study are DNA hypermethylated in Lister et al. study.
 mc mc mc mc SUP mc mc Supplemental Figure. Genes showing ectopic HK9 dimethylation in this study are DNA hypermethylated in Lister et al. study. Representative views of genes that gain HK9m marks in their
Supporting Information
 Supporting Information Lee et al. 10.1073/pnas.0910950106 Fig. S1. Fe (A), Zn (B), Cu (C), and Mn (D) concentrations in flag leaves from WT, osnas3-1, and OsNAS3-antisense (AN-2) plants. Each measurement
Supplementary Figure 1
 Supplementary Figure 1 Asymmetrical function of 5p and 3p arms of mir-181 and mir-30 families and mir-142 and mir-154. (a) Control experiments using mirna sensor vector and empty pri-mirna overexpression
7SK ChIRP-seq is specifically RNA dependent and conserved between mice and humans.
 Supplementary Figure 1 7SK ChIRP-seq is specifically RNA dependent and conserved between mice and humans. Regions targeted by the Even and Odd ChIRP probes mapped to a secondary structure model 56 of the
SUPPLEMENTARY INFORMATION
 doi:10.1038/nature10866 a b 1 2 3 4 5 6 7 Match No Match 1 2 3 4 5 6 7 Turcan et al. Supplementary Fig.1 Concepts mapping H3K27 targets in EF CBX8 targets in EF H3K27 targets in ES SUZ12 targets in ES
he micrornas of Caenorhabditis elegans (Lim et al. Genes & Development 2003)
") MicroRNAs: Genomics, Biogenesis, Mechanism, and Function (D. Bartel Cell 2004) he micrornas of Caenorhabditis elegans (Lim et al. Genes & Development 2003) Vertebrate MicroRNA Genes (Lim et al. Science
MicroRNAs: Genomics, Biogenesis, Mechanism, and Function (D. Bartel Cell 2004) he micrornas of Caenorhabditis elegans (Lim et al. Genes & Development 2003) Vertebrate MicroRNA Genes (Lim et al. Science
Nature Structural & Molecular Biology: doi: /nsmb Supplementary Figure 1. Differential expression of mirnas from the pri-mir-17-92a locus.
 Supplementary Figure 1 Differential expression of mirnas from the pri-mir-17-92a locus. (a) The mir-17-92a expression unit in the third intron of the host mir-17hg transcript. (b,c) Impact of knockdown
Supplementary Appendix
 Supplementary Appendix This appendix has been provided by the authors to give readers additional information about their work. Supplement to: Choi YL, Soda M, Yamashita Y, et al. EML4-ALK mutations in
(a) Significant biological processes (upper panel) and disease biomarkers (lower panel)
 Significant biological processes (upper panel) and disease biomarkers (lower panel)") Supplementary Figure 1. Functional enrichment analyses of secretomic proteins. (a) Significant biological processes (upper panel) and disease biomarkers (lower panel) 2 involved by hrab37-mediated secretory
Supplementary Figure 1. Functional enrichment analyses of secretomic proteins. (a) Significant biological processes (upper panel) and disease biomarkers (lower panel) 2 involved by hrab37-mediated secretory
Cross species analysis of genomics data. Computational Prediction of mirnas and their targets
 02-716 Cross species analysis of genomics data Computational Prediction of mirnas and their targets Outline Introduction Brief history mirna Biogenesis Why Computational Methods? Computational Methods
Nature Structural & Molecular Biology: doi: /nsmb.3218
 Supplementary Figure 1 Endogenous EGFR trafficking and responses depend on biased ligands. (a) Lysates from HeLa cells stimulated for 2 min. with increasing concentration of ligands were immunoblotted
SUPPLEMENTARY INFORMATION
 DOI: 10.1038/ncb2607 Figure S1 Elf5 loss promotes EMT in mammary epithelium while Elf5 overexpression inhibits TGFβ induced EMT. (a, c) Different confocal slices through the Z stack image. (b, d) 3D rendering
ONLINE SUPPLEMENTAL INFORMATION
 1 ONLINE SUPPLEMENTAL INFORMATION Small trna-derived RNAs are increased and more abundant than micrornas in chronic hepatitis B and C Sara R. Selitsky 1-3, Jeanette Baran-Gale 1,2, Masao Honda 4, Daisuke
Supplementary Figure 1.TRIM33 binds β-catenin in the nucleus. a & b, Co-IP of endogenous TRIM33 with β-catenin in HT-29 cells (a) and HEK 293T cells
 and HEK 293T cells") Supplementary Figure 1.TRIM33 binds β-catenin in the nucleus. a & b, Co-IP of endogenous TRIM33 with β-catenin in HT-29 cells (a) and HEK 293T cells (b). TRIM33 was immunoprecipitated, and the amount of
Supplementary Figure 1.TRIM33 binds β-catenin in the nucleus. a & b, Co-IP of endogenous TRIM33 with β-catenin in HT-29 cells (a) and HEK 293T cells (b). TRIM33 was immunoprecipitated, and the amount of
Nature Biotechnology: doi: /nbt Supplementary Figure 1. Experimental design and workflow utilized to generate the WMG Protein Atlas.
 Supplementary Figure 1 Experimental design and workflow utilized to generate the WMG Protein Atlas. (a) Illustration of the plant organs and nodule infection time points analyzed. (b) Proteomic workflow
SUPPLEMENTARY INFORMATION
 Supplementary Information included with Nature MS 2008-02-01484B by Colantonio et al., entitled The dynein regulatory complex is required for ciliary motility and otolith biogenesis in the inner ear. This
VirusDetect pipeline - virus detection with small RNA sequencing
 VirusDetect pipeline - virus detection with small RNA sequencing CSC webinar 16.1.2018 Eija Korpelainen, Kimmo Mattila, Maria Lehtivaara Big thanks to Jan Kreuze and Jari Valkonen! Outline Small interfering
SUPPLEMENTARY FIGURES
 SUPPLEMENTARY FIGURES Figure S1. Clinical significance of ZNF322A overexpression in Caucasian lung cancer patients. (A) Representative immunohistochemistry images of ZNF322A protein expression in tissue
Supplementary Figures
 Supplementary Figures a miel1-2 (SALK_41369).1kb miel1-1 (SALK_978) b TUB MIEL1 Supplementary Figure 1. MIEL1 expression in miel1 mutant and S:MIEL1-MYC transgenic plants. (a) Mapping of the T-DNA insertion
Supplementary Figure 1: Features of IGLL5 Mutations in CLL: a) Representative IGV screenshot of first
 Representative IGV screenshot of first") Supplementary Figure 1: Features of IGLL5 Mutations in CLL: a) Representative IGV screenshot of first intron IGLL5 mutation depicting biallelic mutations. Red arrows highlight the presence of out of phase
Supplementary Figure 1: Features of IGLL5 Mutations in CLL: a) Representative IGV screenshot of first intron IGLL5 mutation depicting biallelic mutations. Red arrows highlight the presence of out of phase
Circular RNAs (circrnas) act a stable mirna sponges
 act a stable mirna sponges") Circular RNAs (circrnas) act a stable mirna sponges cernas compete for mirnas Ancestal mrna (+3 UTR) Pseudogene RNA (+3 UTR homolgy region) The model holds true for all RNAs that share a mirna binding
Circular RNAs (circrnas) act a stable mirna sponges cernas compete for mirnas Ancestal mrna (+3 UTR) Pseudogene RNA (+3 UTR homolgy region) The model holds true for all RNAs that share a mirna binding
 DOI: 10.1038/ncb2210 b. ICAM1 ng ml -1 P = 0.0001 Small RNA (15-30nts) ng ml -1 Cell Lysate Exosome HDL Plasma HDL Normal Human HDL mirnas R = 0.45 P < 0.0001 Normal Human Exosome mirnas Figure S1. Characterization
Nature Biotechnology: doi: /nbt.1904
 Supplementary Information Comparison between assembly-based SV calls and array CGH results Genome-wide array assessment of copy number changes, such as array comparative genomic hybridization (acgh), is
Nature Structural and Molecular Biology: doi: /nsmb Supplementary Figure 1
 Supplementary Figure 1 Mutational analysis of the SA2-Scc1 interaction in vitro and in human cells. (a) Autoradiograph (top) and Coomassie stained gel (bottom) of 35 S-labeled Myc-SA2 proteins (input)
RNA interference induced hepatotoxicity results from loss of the first synthesized isoform of microrna-122 in mice
 SUPPLEMENTARY INFORMATION RNA interference induced hepatotoxicity results from loss of the first synthesized isoform of microrna-122 in mice Paul N Valdmanis, Shuo Gu, Kirk Chu, Lan Jin, Feijie Zhang,
Small RNAs and how to analyze them using sequencing
 Small RNAs and how to analyze them using sequencing RNA-seq Course November 8th 2017 Marc Friedländer ComputaAonal RNA Biology Group SciLifeLab / Stockholm University Special thanks to Jakub Westholm for
Lentiviral Delivery of Combinatorial mirna Expression Constructs Provides Efficient Target Gene Repression.
 Supplementary Figure 1 Lentiviral Delivery of Combinatorial mirna Expression Constructs Provides Efficient Target Gene Repression. a, Design for lentiviral combinatorial mirna expression and sensor constructs.
Nature Genetics: doi: /ng Supplementary Figure 1. Clinical timeline for the discovery WES cases.
 Supplementary Figure 1 Clinical timeline for the discovery WES cases. This illustrates the timeline of the disease events during the clinical course of each patient s disease, further indicating the available
Supplementary Figure 1: Experimental design. DISCOVERY PHASE VALIDATION PHASE (N = 88) (N = 20) Healthy = 20. Healthy = 6. Endometriosis = 33
 (N = 20) Healthy = 20. Healthy = 6. Endometriosis = 33") DISCOVERY PHASE (N = 20) Healthy = 6 Endometriosis = 7 EAOC = 7 Quantitative PCR (mirnas = 1113) a Quantitative PCR Verification of Candidate mirnas (N = 24) VALIDATION PHASE (N = 88) Healthy = 20 Endometriosis
DISCOVERY PHASE (N = 20) Healthy = 6 Endometriosis = 7 EAOC = 7 Quantitative PCR (mirnas = 1113) a Quantitative PCR Verification of Candidate mirnas (N = 24) VALIDATION PHASE (N = 88) Healthy = 20 Endometriosis
Supplemental Data. Beck et al. (2010). Plant Cell /tpc
. Plant Cell /tpc") Supplemental Figure 1. Phenotypic comparison of the rosette leaves of four-week-old mpk4 and Col-0 plants. A mpk4 vs Col-0 plants grown in soil. Note the extreme dwarfism of the mpk4 plants (white arrows)
Supplemental Figure 1. Phenotypic comparison of the rosette leaves of four-week-old mpk4 and Col-0 plants. A mpk4 vs Col-0 plants grown in soil. Note the extreme dwarfism of the mpk4 plants (white arrows)
Supplementary Figure 1. SC35M polymerase activity in the presence of Bat or SC35M NP encoded from the phw2000 rescue plasmid.
 1 2 3 4 5 6 7 8 9 10 11 12 13 14 15 16 17 18 19 20 21 22 23 24 25 26 27 Supplementary Figure 1. SC35M polymerase activity in the presence of Bat or SC35M NP encoded from the phw2000 rescue plasmid. HEK293T
Open Flower. Juvenile leaf Flowerbud. Carpel 35 NA NA NA NA 61 NA 95 NA NA 15 NA 41 3 NA
 PaxDB Root Juvenile leaf Flowerbud Open Flower Carpel Mature Pollen Silique Seed Sec3a Sec3b Sec5a Sec5b Sec6 Sec8 Sec10a/b Sec15a Sec15b Exo84a Exo84b Exo84c Exo70A1 Exo70A2 Exo70A3 49 47 8 75 104 79
Figure S2. Distribution of acgh probes on all ten chromosomes of the RIL M0022
 96 APPENDIX B. Supporting Information for chapter 4 "changes in genome content generated via segregation of non-allelic homologs" Figure S1. Potential de novo CNV probes and sizes of apparently de novo
NOD-like receptor signaling and inflammasome-related pathways are highlighted in psoriatic epidermis
 Supplementary Information NOD-like receptor signaling and inflammasome-related pathways are highlighted in psoriatic epidermis Mari H. Tervaniemi, Shintaro Katayama, Tiina Skoog, H. Annika Siitonen, Jyrki
Figure S1. Analysis of endo-sirna targets in different microarray datasets. The
 Supplemental Figures: Figure S1. Analysis of endo-sirna targets in different microarray datasets. The percentage of each array dataset that were predicted endo-sirna targets according to the Ambros dataset
Guangdong Medical University, Zhanjiang, China; 5 Guangxi Medical University, Nanning, China; 6 Department of Pathology, University of Michigan
 Overexpression of FAM83H-AS1 indicates poor patient survival and knockdown impairs cell proliferation and invasion via MET/EGFR signaling in lung cancer Jie Zhang 1,2, Shumei Feng 3, Wenmei Su 4, Shengbin
SUPPLEMENTARY INFORMATION
 DOI: 10.1038/ncb2566 Figure S1 CDKL5 protein expression pattern and localization in mouse brain. (a) Multiple-tissue western blot from a postnatal day (P) 21 mouse probed with an antibody against CDKL5.
Electron micrograph of phosphotungstanic acid-stained exosomes derived from murine
 1 SUPPLEMENTARY INFORMATION SUPPLEMENTARY FIGURES Supplementary Figure 1. Physical properties of murine DC-derived exosomes. a, Electron micrograph of phosphotungstanic acid-stained exosomes derived from
Supplementary Information and Figure legends
 Supplementary Information and Figure legends Table S1. Primers for quantitative RT-PCR Target Sequence (5 -> 3 ) Target Sequence (5 -> 3 ) DAB2IP F:TGGACGATGTGCTCTATGCC R:GGATGGTGATGGTTTGGTAG Snail F:CCTCCCTGTCAGATGAGGAC
GENOME-WIDE DETECTION OF ALTERNATIVE SPLICING IN EXPRESSED SEQUENCES USING PARTIAL ORDER MULTIPLE SEQUENCE ALIGNMENT GRAPHS
 GENOME-WIDE DETECTION OF ALTERNATIVE SPLICING IN EXPRESSED SEQUENCES USING PARTIAL ORDER MULTIPLE SEQUENCE ALIGNMENT GRAPHS C. GRASSO, B. MODREK, Y. XING, C. LEE Department of Chemistry and Biochemistry,
SUPPLEMENTARY MATERIAL
 SYPPLEMENTARY FIGURE LEGENDS SUPPLEMENTARY MATERIAL Figure S1. Phylogenic studies of the mir-183/96/182 cluster and 3 -UTR of Casp2. (A) Genomic arrangement of the mir-183/96/182 cluster in vertebrates.
microrna-200b and microrna-200c promote colorectal cancer cell proliferation via
 Supplementary Materials microrna-200b and microrna-200c promote colorectal cancer cell proliferation via targeting the reversion-inducing cysteine-rich protein with Kazal motifs Supplementary Table 1.
SUPPLEMENTARY INFORMATION
 doi:10.1038/nature10962 Supplementary Figure 1. Expression of AvrAC-FLAG in protoplasts. Total protein extracted from protoplasts described in Fig. 1a was subjected to anti-flag immunoblot to detect AvrAC-FLAG
Integrated network analysis reveals distinct regulatory roles of transcription factors and micrornas
 Integrated network analysis reveals distinct regulatory roles of transcription factors and micrornas Yu Guo 1,2,4, Katherine Alexander 1, Andrew G Clark 1, Andrew Grimson 1 and Haiyuan Yu 2,3* 1 Department
Mutation Detection and CNV Analysis for Illumina Sequencing data from HaloPlex Target Enrichment Panels using NextGENe Software for Clinical Research
 Mutation Detection and CNV Analysis for Illumina Sequencing data from HaloPlex Target Enrichment Panels using NextGENe Software for Clinical Research Application Note Authors John McGuigan, Megan Manion,
Supplementary Figure 1. Schematic diagram of o2n-seq. Double-stranded DNA was sheared, end-repaired, and underwent A-tailing by standard protocols.
 Supplementary Figure 1. Schematic diagram of o2n-seq. Double-stranded DNA was sheared, end-repaired, and underwent A-tailing by standard protocols. A-tailed DNA was ligated to T-tailed dutp adapters, circularized
Obstacles and challenges in the analysis of microrna sequencing data
 Obstacles and challenges in the analysis of microrna sequencing data (mirna-seq) David Humphreys Genomics core Dr Victor Chang AC 1936-1991, Pioneering Cardiothoracic Surgeon and Humanitarian The ABCs
Nature Structural & Molecular Biology: doi: /nsmb Supplementary Figure 1
 Supplementary Figure 1 Effect of HSP90 inhibition on expression of endogenous retroviruses. (a) Inducible shrna-mediated Hsp90 silencing in mouse ESCs. Immunoblots of total cell extract expressing the
Soft Agar Assay. For each cell pool, 100,000 cells were resuspended in 0.35% (w/v)
") SUPPLEMENTARY MATERIAL AND METHODS Soft Agar Assay. For each cell pool, 100,000 cells were resuspended in 0.35% (w/v) top agar (LONZA, SeaKem LE Agarose cat.5004) and plated onto 0.5% (w/v) basal agar.
SUPPLEMENTARY MATERIAL AND METHODS Soft Agar Assay. For each cell pool, 100,000 cells were resuspended in 0.35% (w/v) top agar (LONZA, SeaKem LE Agarose cat.5004) and plated onto 0.5% (w/v) basal agar.
Table S1. Total and mapped reads produced for each ChIP-seq sample
 Tale S1. Total and mapped reads produced for each ChIP-seq sample Sample Total Reads Mapped Reads Col- H3K27me3 rep1 125662 1334323 (85.76%) Col- H3K27me3 rep2 9176437 7986731 (87.4%) atmi1a//c H3K27m3
Nature Structural & Molecular Biology: doi: /nsmb.2419
 Supplementary Figure 1 Mapped sequence reads and nucleosome occupancies. (a) Distribution of sequencing reads on the mouse reference genome for chromosome 14 as an example. The number of reads in a 1 Mb
SCATTER PLOTS AND TREND LINES
 1 SCATTER PLOTS AND TREND LINES LEARNING MAP INFORMATION STANDARDS 8.SP.1 Construct and interpret scatter s for measurement to investigate patterns of between two quantities. Describe patterns such as
Supplementary information
 Supplementary information Human Cytomegalovirus MicroRNA mir-us4-1 Inhibits CD8 + T Cell Response by Targeting ERAP1 Sungchul Kim, Sanghyun Lee, Jinwook Shin, Youngkyun Kim, Irini Evnouchidou, Donghyun
Supplementary Materials for
 www.sciencesignaling.org/cgi/content/full/2/1/ra81/dc1 Supplementary Materials for Delivery of MicroRNA-126 by Apoptotic Bodies Induces CXCL12- Dependent Vascular Protection Alma Zernecke,* Kiril Bidzhekov,
2009 LANDES BIOSCIENCE. DO NOT DISTRIBUTE.
 [Epigenetics 4:2, 1-6; 16 February 2009]; 2009 Landes Bioscience Research Paper Determining the conservation of DNA methylation in Arabidopsis This manuscript has been published online, prior to printing.once
Supplementary Material
 Supplementary Material Summary: The supplementary information includes 1 table (Table S1) and 4 figures (Figure S1 to S4). Supplementary Figure Legends Figure S1 RTL-bearing nude mouse model. (A) Tumor
Supplemental Information. Spatial Auxin Signaling. Controls Leaf Flattening in Arabidopsis
 Current Biology, Volume 27 Supplemental Information Spatial Auxin Signaling Controls Leaf Flattening in Arabidopsis Chunmei Guan, Binbin Wu, Ting Yu, Qingqing Wang, Naden T. Krogan, Xigang Liu, and Yuling
Comparison of open chromatin regions between dentate granule cells and other tissues and neural cell types.
 Supplementary Figure 1 Comparison of open chromatin regions between dentate granule cells and other tissues and neural cell types. (a) Pearson correlation heatmap among open chromatin profiles of different
Arabidopsis thaliana small RNA Sequencing. Report
 Arabidopsis thaliana small RNA Sequencing Report September 2015 Project Information Client Name Client Company / Institution Macrogen Order Number Order ID Species Arabidopsis thaliana Reference UCSC hg19
Nature Genetics: doi: /ng Supplementary Figure 1. Mutational signatures in BCC compared to melanoma.
 Supplementary Figure 1 Mutational signatures in BCC compared to melanoma. (a) The effect of transcription-coupled repair as a function of gene expression in BCC. Tumor type specific gene expression levels
Supplementary Materials for
 www.sciencesignaling.org/cgi/content/full/8/407/ra127/dc1 Supplementary Materials for Loss of FTO in adipose tissue decreases Angptl4 translation and alters triglyceride metabolism Chao-Yung Wang,* Shian-Sen
Supplementary Figure 1 ITGB1 and ITGA11 increase with evidence for heterodimers following HSC activation. (a) Time course of rat HSC activation
 Time course of rat HSC activation") Supplementary Figure 1 ITGB1 and ITGA11 increase with evidence for heterodimers following HSC activation. (a) Time course of rat HSC activation indicated by the detection of -SMA and COL1 (log scale).
Supplementary Figure 1 ITGB1 and ITGA11 increase with evidence for heterodimers following HSC activation. (a) Time course of rat HSC activation indicated by the detection of -SMA and COL1 (log scale).
Supplemental Figure S1. Expression of Cirbp mrna in mouse tissues and NIH3T3 cells.
 SUPPLEMENTAL FIGURE AND TABLE LEGENDS Supplemental Figure S1. Expression of Cirbp mrna in mouse tissues and NIH3T3 cells. A) Cirbp mrna expression levels in various mouse tissues collected around the clock
SUPPLEMENTARY INFORMATION
 DOI: 10.1038/ncb2211 a! mir-143! b! mir-103/107! let-7a! mir-144! mir-122a! mir-126-3p! mir-194! mir-27a! mir-30c! Figure S1 Northern blot analysis of mir-143 expression dependent on feeding conditions.
SUPPLEMENTARY INFORMATION
 DOI: 1.138/ncb222 / b. WB anti- WB anti- ulin Mitotic index (%) 14 1 6 2 T (h) 32 48-1 1 2 3 4 6-1 4 16 22 28 3 33 e. 6 4 2 Time (min) 1-6- 11-1 > 1 % cells Figure S1 depletion leads to mitotic defects
Dr Rick Tearle Senior Applications Specialist, EMEA Complete Genomics Complete Genomics, Inc.
 Dr Rick Tearle Senior Applications Specialist, EMEA Complete Genomics Topics Overview of Data Processing Pipeline Overview of Data Files 2 DNA Nano-Ball (DNB) Read Structure Genome : acgtacatgcattcacacatgcttagctatctctcgccag
SUPPLEMENTARY INFORMATION
 doi:.38/nature8975 SUPPLEMENTAL TEXT Unique association of HOTAIR with patient outcome To determine whether the expression of other HOX lincrnas in addition to HOTAIR can predict patient outcome, we measured
Nature Immunology: doi: /ni Supplementary Figure 1. DNA-methylation machinery is essential for silencing of Cd4 in cytotoxic T cells.
 Supplementary Figure 1 DNA-methylation machinery is essential for silencing of Cd4 in cytotoxic T cells. (a) Scheme for the retroviral shrna screen. (b) Histogram showing CD4 expression (MFI) in WT cytotoxic
Figure legends of supplementary figures
 Figure legends of supplementary figures Figure 1. Phenotypic analysis of rice early flowering1 () plants and enhanced expression of floral identity genes in.. Leaf emergence of,, and plants with complementary
PBZ FT01_PBZ FT01_TZ FT01_NZ. interface zone (I) tumor zone (TZ) necrotic zone (NZ)
 tumor zone (TZ) necrotic zone (NZ)") Oncotarget, Supplementary Materials www.impactjournals.com/oncotarget/ SUPPLEMENTRY FLES ndividuals factor map (P) FT_ FT_ FT_ Dim (.%) Dim (.%) >% peripheral brain zone () around % interface zone () FT
Oncotarget, Supplementary Materials www.impactjournals.com/oncotarget/ SUPPLEMENTRY FLES ndividuals factor map (P) FT_ FT_ FT_ Dim (.%) Dim (.%) >% peripheral brain zone () around % interface zone () FT
Supplemental Data. Deinlein et al. Plant Cell. (2012) /tpc
 /tpc") µm Zn 2+ 15 µm Zn 2+ Growth (% of control) empty vector NS1 NS2 NS3 NS4 S. pombe zhfδ Supplemental Figure 1. Functional characterization of. halleri NS genes in Zn 2+ hypersensitive S. pombe Δzhf mutant
µm Zn 2+ 15 µm Zn 2+ Growth (% of control) empty vector NS1 NS2 NS3 NS4 S. pombe zhfδ Supplemental Figure 1. Functional characterization of. halleri NS genes in Zn 2+ hypersensitive S. pombe Δzhf mutant
Supplementary Figures
 Supplementary Figures 9 10 11 Supplementary Figure 1. Old plants are more resistant to insect herbivores than young plants. (a) Image of young (1-day-old, 1D) and old (-day-old, D) plants of Arabidopsis
Figure S1. Standard curves for amino acid bioassays. (A) The standard curve for leucine concentration versus OD600 values for L. casei.
 The standard curve for leucine concentration versus OD600 values for L. casei.") Figure S1. Standard curves for amino acid bioassays. (A) The standard curve for leucine concentration versus OD600 values for L. casei. (B) The standard curve for lysine concentrations versus OD600 values
Figure S1. Standard curves for amino acid bioassays. (A) The standard curve for leucine concentration versus OD600 values for L. casei. (B) The standard curve for lysine concentrations versus OD600 values
File name: Supplementary Information Description: Supplementary Figures, Supplementary Table and Supplementary References
 File name: Supplementary Information Description: Supplementary Figures, Supplementary Table and Supplementary References File name: Supplementary Data 1 Description: Summary datasheets showing the spatial
To test the possible source of the HBV infection outside the study family, we searched the Genbank
 Supplementary Discussion The source of hepatitis B virus infection To test the possible source of the HBV infection outside the study family, we searched the Genbank and HBV Database (http://hbvdb.ibcp.fr),
Supplementary Figure 1
 S U P P L E M E N TA R Y I N F O R M AT I O N DOI: 10.1038/ncb2896 Supplementary Figure 1 Supplementary Figure 1. Sequence alignment of TERB1 homologs in vertebrates. M. musculus TERB1 was derived from
SUPPLEMENTARY INFORMATION
 Supplementary igure 1. The expression level of PP4 (At4g16860) is diminished in the rpp4 mutant (SK017569). The mna was extracted to analyze the expression level of PP4 using quantitative PC (qpc). Gene
Supplemental Figure S1. PLAG1 kidneys contain fewer glomeruli (A) Quantitative PCR for Igf2 and PLAG1 in whole kidneys taken from mice at E15.
 Quantitative PCR for Igf2 and PLAG1 in whole kidneys taken from mice at E15.") Supplemental Figure S1. PLAG1 kidneys contain fewer glomeruli (A) Quantitative PCR for Igf2 and PLAG1 in whole kidneys taken from mice at E15.5, E18.5, P4, and P8. Values shown are means from four technical
Supplemental Figure S1. PLAG1 kidneys contain fewer glomeruli (A) Quantitative PCR for Igf2 and PLAG1 in whole kidneys taken from mice at E15.5, E18.5, P4, and P8. Values shown are means from four technical
gliomas. Fetal brain expected who each low-
 Supplementary Figure S1. Grade-specificity aberrant expression of HOXA genes in gliomas. (A) Representative RT-PCR analyses of HOXA gene expression in human astrocytomas. Exemplified glioma samples include
Nature Genetics: doi: /ng Supplementary Figure 1. SEER data for male and female cancer incidence from
 Supplementary Figure 1 SEER data for male and female cancer incidence from 1975 2013. (a,b) Incidence rates of oral cavity and pharynx cancer (a) and leukemia (b) are plotted, grouped by males (blue),
Supplementary Materials
 Supplementary Materials Supplementary Figure S1 Regulation of Ubl4A stability by its assembly partner A, The translation rate of Ubl4A is not affected in the absence of Bag6. Control, Bag6 and Ubl4A CRISPR
Supplementary Materials for
 www.sciencesignaling.org/cgi/content/full/9/439/ra78/dc1 Supplementary Materials for Small heterodimer partner mediates liver X receptor (LXR) dependent suppression of inflammatory signaling by promoting
DETECTION OF LOW FREQUENCY CXCR4-USING HIV-1 WITH ULTRA-DEEP PYROSEQUENCING. John Archer. Faculty of Life Sciences University of Manchester
 DETECTION OF LOW FREQUENCY CXCR4-USING HIV-1 WITH ULTRA-DEEP PYROSEQUENCING John Archer Faculty of Life Sciences University of Manchester HIV Dynamics and Evolution, 2008, Santa Fe, New Mexico. Overview
p.r623c p.p976l p.d2847fs p.t2671 p.d2847fs p.r2922w p.r2370h p.c1201y p.a868v p.s952* RING_C BP PHD Cbp HAT_KAT11
 ARID2 p.r623c KMT2D p.v650fs p.p976l p.r2922w p.l1212r p.d1400h DNA binding RFX DNA binding Zinc finger KMT2C p.a51s p.d372v p.c1103* p.d2847fs p.t2671 p.d2847fs p.r4586h PHD/ RING DHHC/ PHD PHD FYR N
Supplementary Materials for
 www.sciencesignaling.org/cgi/content/full/3/114/ra23/dc1 Supplementary Materials for Regulation of Zap70 Expression During Thymocyte Development Enables Temporal Separation of CD4 and CD8 Repertoire Selection
iplex genotyping IDH1 and IDH2 assays utilized the following primer sets (forward and reverse primers along with extension primers).
.") Supplementary Materials Supplementary Methods iplex genotyping IDH1 and IDH2 assays utilized the following primer sets (forward and reverse primers along with extension primers). IDH1 R132H and R132L Forward:
Supplementary Materials Supplementary Methods iplex genotyping IDH1 and IDH2 assays utilized the following primer sets (forward and reverse primers along with extension primers). IDH1 R132H and R132L Forward:
7.014 Problem Set 7 Solutions
 MIT Department of Biology 7.014 Introductory Biology, Spring 2005 7.014 Problem Set 7 Solutions Question 1 Part A Antigen binding site Antigen binding site Variable region Light chain Light chain Variable
Figure S1 Expression of AHL gene family members in diploid (Ler Col) and triploid (Ler
 and triploid (Ler") Supplemental material Supplemental figure legends Figure S Expression of AHL gene family members in diploid (Ler ) and triploid (Ler osd) seeds. AHLs from clade B are labelled with (I), and AHLs from clade
Supplemental material Supplemental figure legends Figure S Expression of AHL gene family members in diploid (Ler ) and triploid (Ler osd) seeds. AHLs from clade B are labelled with (I), and AHLs from clade
Nature Methods: doi: /nmeth.3115
 Supplementary Figure 1 Analysis of DNA methylation in a cancer cohort based on Infinium 450K data. RnBeads was used to rediscover a clinically distinct subgroup of glioblastoma patients characterized by
Nature Biotechnology: doi: /nbt Supplementary Figure 1. Binding capacity of DNA-barcoded MHC multimers and recovery of antigen specificity
 Supplementary Figure 1 Binding capacity of DNA-barcoded MHC multimers and recovery of antigen specificity (a, b) Fluorescent-based determination of the binding capacity of DNA-barcoded MHC multimers (+barcode)
Breeding scheme, transgenes, histological analysis and site distribution of SB-mutagenized osteosarcoma.
 Supplementary Figure 1 Breeding scheme, transgenes, histological analysis and site distribution of SB-mutagenized osteosarcoma. (a) Breeding scheme. R26-LSL-SB11 homozygous mice were bred to Trp53 LSL-R270H/+
UNIT 6 GENETICS 12/30/16
 12/30/16 UNIT 6 GENETICS III. Mendel and Heredity (6.3) A. Mendel laid the groundwork for genetics 1. Traits are distinguishing characteristics that are inherited. 2. Genetics is the study of biological
Supplementary information. The Light Intermediate Chain 2 Subpopulation of Dynein Regulates Mitotic. Spindle Orientation
 Supplementary information The Light Intermediate Chain 2 Subpopulation of Dynein Regulates Mitotic Spindle Orientation Running title: Dynein LICs distribute mitotic functions. Sagar Mahale a, d, *, Megha
mtor Inhibition Specifically Sensitizes Colorectal Cancers with KRAS or BRAF Mutations to BCL-2/BCL-
 Supplementary Material for mtor Inhibition Specifically Sensitizes Colorectal Cancers with KRAS or BRAF Mutations to BCL-2/BCL- XL Inhibition by Suppressing MCL-1 Anthony C. Faber 1,2 *, Erin M. Coffee
Supplementary Figure 1: si-craf but not si-braf sensitizes tumor cells to radiation.
 Supplementary Figure 1: si-craf but not si-braf sensitizes tumor cells to radiation. (a) Embryonic fibroblasts isolated from wildtype (WT), BRAF -/-, or CRAF -/- mice were irradiated (6 Gy) and DNA damage
Supplementary Figure 1. Spitzoid Melanoma with PPFIBP1-MET fusion. (a) Histopathology (4x) shows a domed papule with melanocytes extending into the
 Histopathology (4x) shows a domed papule with melanocytes extending into the") Supplementary Figure 1. Spitzoid Melanoma with PPFIBP1-MET fusion. (a) Histopathology (4x) shows a domed papule with melanocytes extending into the deep dermis. (b) The melanocytes demonstrate abundant
Supplementary Figure 1. Spitzoid Melanoma with PPFIBP1-MET fusion. (a) Histopathology (4x) shows a domed papule with melanocytes extending into the deep dermis. (b) The melanocytes demonstrate abundant
Delacroix et al Renal effects of renal denervation Supplementary Figure 1: Changes in Ambulatory Blood Pressures and Heart Rate
 Supplementary Figure 1: Changes in Ambulatory Blood Pressures and Heart Rate Supplementary Table 1: Ranking each patient based on the number of measurements showing a numerical improvement. Rank at each