The Role of DNA Methyltransferases in Normal and Malignant Hematopoiesis
|
|
|
- Darcy Moody
- 5 years ago
- Views:
Transcription


1 University of Nebraska Medical Center Theses & Dissertations Graduate Studies Spring The Role of DNA Methyltransferases in Normal and Malignant Hematopoiesis Staci Haney University of Nebraska Medical Center Follow this and additional works at: Part of the Cancer Biology Commons Recommended Citation Haney, Staci, "The Role of DNA Methyltransferases in Normal and Malignant Hematopoiesis" (2016). Theses & Dissertations. Paper 82. This Dissertation is brought to you for free and open access by the Graduate Studies at It has been accepted for inclusion in Theses & Dissertations by an authorized administrator of For more information, please contact
2 THE ROLE OF DNA METHYLTRANSFERASES IN NORMAL AND MALIGNANT MOUSE HEMATOPOIESIS By Staci L. Haney A DISSERTATION Presented to the Faculty of The University of Nebraska Graduate College In Partial Fulfillment of the Requirements For the Degree of Doctor of Philosophy Genetics, Cell Biology, and Anatomy Graduate Program Under the Supervision of Professor Rene Opavsky University of Nebraska Medical Center Omaha, NE April, 2016 Supervisory Committee: Shantaram Joshi, Ph.D. David Klinkebiel, Ph.D. Runqing Lu, Ph.D. Jenny Wang, Ph.D
3 i ACKNOWLEDGEMENTS First, I would like to thank my advisor, Rene Opavsky, for not only accepting me into his lab but for providing outstanding mentorship over the past 5 years. I am also eternally grateful to the other members of our lab, Ryan Hlady, Jana Opavska, and Michael Upchurch for all of their hard work. Next, I would like to thank Dave Klinkebiel for his help with analyzing global methylation data. This project would not have been possible without his expertise. I would also like to thank the other members of my committee: Dr. Jenny Wang, Dr. Shantaram Joshi, and Dr. Runqing Lu for their support and guidance over the years. Lastly, I would like to thank my family, especially my husband, Ryan, for always believing me and encouraging me to do whatever makes me happy
4 ii THE ROLE OF DNA METHYLTRANSFERASES IN NORMAL AND MALIGNANT MOUSE HEMATOPOIESIS Staci L Haney, Ph.D. University of Nebraska Medical Center, 2016 Supervisor: Rene Opavsky, Ph.D. DNA methylation is an epigenetic modification that regulates gene transcription. The addition of a methyl group to cytosine is catalyzed by a family of enzymes known as DNA methyltransferases (Dnmts). The three catalytically active Dnmts in humans and mice are Dnmt1, Dnmt3a, and Dnmt3b. DNA methylation is clinically relevant, as aberrations in the methylation landscape are a hallmark of nearly all human cancers. Cancer methylomes are typically characterized by genome wide hypomethylation and regional specific hypermethylation, both of which have been linked to alterations in gene expression. In order to understand the contribution of epimutations to the development of hematological malignancies we created several mouse models in which one or more Dnmt is deleted in hematopoietic stem cells and all downstream lineages. This allowed us to address the role of individual Dnmts in normal and malignant hematopoiesis. We found that Dnmts contribute to the cancer methylome through both de novo and maintenance methylation, and that activities of individual Dnmts seldom overlap with one another. We identified Dnmt1 as being critical for T cell development and maintenance of the tumor phenotype in T cell lymphomas. Furthermore, we identified Dnmt3a and Dnmt3b as critical tumor suppressor genes in the prevention of chronic lymphocytic leukemia in mice. Collectively, these studies provide insight into the effects of Dnmt deregulation in tumorigenesis.
5 iii TABLE OF CONTENTS ACKNOWLEDGEMENTS ABSTRACT TABLE OF CONTENTS.. LIST OF FIGURES... LIST OF ABBREVIATIONS. i ii iii v x INTRODUCTION.. 1 DNA methylation in mammalian cells.. 1 Methylation independent repressor function of Dnmts.. 2 DNA methylation and cancer. 3 The role of Dnmt3a in hematological malignancies... 5 The role of Dnmt1 in tumorigenesis.. 7 The role of Dnmt3b in tumorigenesis 8 Hypothesis 9 CHAPTER 1: Essential Role for Dnmt1 in the Prevention and Maintenance of MYC-Induced T-Cell Lymphomas Introduction Methods. 13 Results.. 18 Discussion. 39
6 iv CHAPTER 2: Methylation-independent repression of Dnmt3b contributes to oncogenic activity of Dnmt3a in mouse MYC-induced T-cell lymphomagenesis Introduction Methods. 48 Results.. 51 Discussion. 87 CHAPTER 3: Tumor suppressor functions of Dnmt3a and Dnmt3b in the prevention of malignant mouse lymphopoiesis Introduction Methods. 93 Results.. 95 Discussion. 110 CHAPTER 4: Promoter hypomethylation and expression is conserved in mouse chronic lymphocytic leukemia induced by decreased or inactivated Dnmt3a Introduction Methods. 114 Results Discussion. 148 DISCUSSION 153 BIBLIOGRAPHY
7 v LIST OF FIGURES CHAPTER 1: Figure 1. Loss of Dnmt1 delays MYC-induced T-cell lymphomagenesis Figure 2. Loss of Dnmt1 results in decreased proliferation and is critical for tumor cell survival. 24 Figure 3. Loss of Dnmt1 impairs T-cell development 27 Figure 4. Impaired hematopoiesis in MYC; Dnmt1 / mice.. 29 Figure 5. Analysis of DNA methylation in Dnmt1-deficient tumors.. 32 Figure 6. Significantly deregulated genes in MYC; Dnmt1 / tumors.. 35 Figure 7. H2-Ab1 is a target of Dnmt1-mediated methylation in lymphomas 38 CHAPTER 2: Figure 1. Ablation of Dnmt3a delays T-cell lymphomagenesis Figure 2. Dnmt3a inactivation decreases cellular proliferation during disease progression. 57 Figure 3. Dnmt3a ablation results in genome-wide methylation changes in MYC;Dnmt3a Δ/Δ lymphomas Figure 4. Loss of Dnmt3a leads to deregulated transcription.. 69 Figure 5. DNA methylation-independent upregulation of tumor suppressor genes in Dnmt3a-deficient lymphomas. 73 Figure 6. Dnmt3a represses Dnmt3b expression independently of its catalytic activity. 77
8 vi Figure 7. Loss of Dnmt3b accelerates lymphomagenesis in Dnmt3adeficient mice 80 Supplementary Figure S1. MYC expression is similar between control and Dnmt3a-deficient lymphomas. 54 Supplementary Figure S2. Tumor burden in control and Dnmt3a-deficient mice. 55 Supplementary Figure S3. Loss of Dnmt3a does not effect T-cell development.. 58 Supplementary Figure S4. EGFP expression in thymocytes from control and Dnmt3a-deficient mice. 59 Supplementary Figure S5. Analysis of Annexin V staining by FACS 60 Supplementary Figure S5. Analysis of Annexin V staining by FACS 2 61 Supplementary Figure S7. Summary of differentially methylated genes in Dnmt3a-deficient tumors. 65 Supplementary Figure S8. Global methylation profiling by MSCC using 1 tag analysis 66 Supplementary Figure S9. Summary of Ingenuity pathway analysis 70 Supplementary Figure S10. MSCC analysis of promoter methylation for the 17 gene signature obtained from IPA. 73 Supplementary Figure S11. Quantification of total gene body methylation for the 17 gene signature obtained from IPA Supplementary Figure S12. MSCC analysis of gene body methylation of four tumor suppressor genes. 75 Supplementary Figure S13. Relative Dnmt3b protein levels in three cell lines after Dnmt3a expression 78
9 vii Supplementary Figure S14. Representative Annexin V and BrdU staining in control and DKO thymocytes 81 Supplementary Figure S15. Analysis of T-cell development in control and DKO mice.. 82 Supplementary Figure S16. Summary of tumor burden in control and DKO mice.. 83 Supplementary Figure S17. MYC expression is similar between control and DKO tumors.. 84 Supplementary Figure S18. Summary of tumor immunophenotypes in control and DKO mice. 85 Supplementary Figure S19. Representative FACS analysis of T-cell lymphomas in control and DKO mice 86 CHAPTER 3: Figure 1. Loss of Dnmt3a induces CLL in mice. 99 Figure 2. Loss of Dnmt3b accelerates tumor development in Dnmt3a / mice and alters the disease spectrum 108 Figure S1. Analysis of EGFP and cell surface marker expression in Dnmt3a +/+ and Dnmt3a -/- mice 101 Figure S2. Cellularity of Dnmt3a and Dnmt3a/Dnmt3b knockout mice Figure S3. Deletion efficiency of Dnmt3a conditional knockout allele in Dnmt3a -/- tumors Figure S4. Histological analysis of Dnmt3a -/- splenic tumors Figure S5. Dnmt3a -/- splenic tumor cells induce splenomegaly and CLL disease in recipient mice. 105
10 viii Figure S6. Methylation analysis of gene bodies and repetitive elements Figure S7. Schematic representation of the genetic setting to delete conditional alleles of Dnmt3a and Dnmt3b in hematopoietic system CHAPTER 4: Figure 1. Dnmt3a heterozygous mice develop CLL 122 Figure 2. Dnmt3a +/- mice also develop non-malignant myeloproliferative disorder. 129 Figure 3. DNA methylome and transcriptome of normal mouse B-1a cells Figure 4. DNA methylome of CLL induced by decrease or absence of Dnmt3a Figure 5. Dnmt3a has a cancer-specific maintenance function Figure 6. Decreased Dnmt3a levels result in deregulated transcription in Dnmt3a +/Δ CLL similar to Dnmt3a Δ/Δ CLL Figure 6. Decreased Dnmt3a levels result in deregulated transcription in Dnmt3a +/Δ CLL similar to Dnmt3a Δ/Δ CLL Figure S1. Dnmt3a heterozygous mice develop CLL Figure S2. Normal hematopoiesis in 6-week old Dnmt3a +/- mice. 125 Figure S3. Deregulated methylation in Dnmt3a Δ/Δ and Dnmt3a +/Δ CLL. 137 Figure S4. Related to Figures 6 and 7. Ingenuity pathway analysis of differentially expressed genes.. 147
11 ix LIST OF ABBREVIATIONS 4-OHT AML Bp CLL COBRA DKO DMC DMR Dnmts EGFP FDR HDACs HSC IPA LSK MBL MPD MSCC MTCL PTCL RRBS TCLs TS 4-hydroxytamoxifen acute myeloid leukemia base pair chronic lymphocytic leukemia combined bisulfite restriction analysis double knockout differentially methylated cytosine differentially methylated region DNA methyltransferases enhanced green fluorescent protein false discovery rate histone deacetylases hematopoietic stem cell Ingenuity Pathway analysis Lineage-negative, Sca1-positive, ckit-negative monoclonal B cell lymphocytosis myeloproliferative disorder methyl sensitive cut counting Myc-induced T cell lymphoma peripheral T cell lymphoma reduced representation bisulfite sequencing T cell lymphomas tumor suppressor
12 x TSS WGBS transcriptional start site whole genome bisulfite sequencing
13 INTRODUCTION DNA methylation in mammalian cells. DNA methylation plays a critical role in many biological processes, including regulating gene expression, silencing of retroviruses, X-chromosome inactivation, genomic imprinting, and differentiation (1). DNA methylation primarily occurs in the context of CpG dinucleotides, is asymmetrical and cell-type specific (1). In general, DNA methylation at promoter regions is associated with the inhibition of gene transcription (2), while increased gene body methylation is postulated to promote gene transcription (3). The three active mammalian DNA methyltransferases, Dnmt1, Dnmt3a, and Dnmt3b, are responsible for catalyzing the addition of a methyl group to the 5 th position of the cytosine ring. All three Dnmts are critical for development, as demonstrated by knockouts generated in mice. Deletion of Dnmt1 and Dnmt3b are embryonically lethal, while loss of Dnmt3a results in death of mice around 4 months of age, likely due to multi organ failure (4, 5). Dnmt3a and Dnmt3b are largely responsible for de novo methylation during early embryogenesis. While both enzymes are responsible for the establishment of methylation patterns, they each display non-overlapping functions during mouse embryonic development. Dnmt3b for example is almost exclusively involved in the methylation of minor satellite repeats at centromeres (5). The sequence-specificity of Dnmts is further demonstrated by findings in mouse embryonic stem cells (ES cells) in which the expression of only Dnmt1, and not Dnmt3a or Dnmt3b, results in a lack of methylation at imprinted genes and genomic repeats, suggesting that these loci are de novo methylated by either Dnmt3b or Dnmt3a (6). In contrast, Dnmt1 was initially classified as a maintenance enzyme, due to its high affinity for hemi-methylated sites (7).
14 2 The unique regulatory domain of Dnmt1 functions by binding to PCNA during cellular divisions, thus allowing it to read existing methylation patterns and duplicate them on the newly synthesized DNA strand (8). While the de novo and maintenance classifications are convenient, further investigation into the discrete roles of Dnmts has changed the way we think about the formation and maintenance of the methylation landscape. Several reports suggest that Dnmt1 can also function as a de novo methyltransferase. For example, overexpression of Dnmt1 induced locus-specific de novo methylation in human fibroblasts that was associated with specific sequence motifs (9, 10). Additionally, knockout of Dnmt1 in ES cells suggests de novo activity for Dnmt1 at repeat elements and single-copy genes (11). We found that Dnmt3a and Dnmt3b function in the cancer-specific maintenance methylation of gene promoters (12, 13), while others showed that Dnmt3a maintained lowly methylated canyon regions (14). Despite an ever increasing body of research, a complete understanding of the individual roles of Dnmts in normal cells and various disease states remains elusive. Methylation independent repressor function of Dnmts. In addition to their roles as methyltransferases, Dnmts can function to repress gene transcription in a methylation independent manner (18). The methylation independent repressor activity has been well demonstrated for Dnmt3a. The conserved C-terminal domain of Dnmt3a mediates the addition of methyl groups to DNA, while the N-terminal regulatory domain mediates interactions with DNA and other proteins (15). While Dnmt3a can regulate transcription via methylation at CpG dinucleotides found in the promoter and other regulatory regions (15), it can also repress transcription in a methylation-independent manner through interaction with histone deacetylases (HDACs) and other repressor proteins via its ATRX-like domain (16). For instance, Dnmt3a interacts with the methyl CpG binding domain of Mbd3 and Brg1 to silence expression of
15 3 the metallothionein-i gene in mouse lymphosarcoma cells (17). Likewise, in vitro studies found that RP58, a transcriptional repressor, targeted Dnmt3a to a synthetic promoter to silence gene expression in a methylation-independent manner (16). In addition to Dnmt3a s ability to interact with transcriptional repressors, it may also interfere with the ability of transcription factors to bind to regulatory elements on chromosomes to activate transcription. For instance, p53-mediated transactivation of the CDKN1A gene was inhibited by direct Dnmt3a binding with p53 without changes in DNA methylation (18). Which proteins facilitate the recruitment of Dnmt3a to specific loci is difficult to predict, given that Dnmt3a can interact with at least 68 transcription factors (19). Overall, the methylation-independent activity of Dnmts is a lesser studied area and its prevalence and effects on physiological processes not fully known. DNA methylation and cancer. Due to its role in several critical biological processes, it is not surprising that aberrant DNA methylation is a hallmark of nearly all cancers. For decades the DNA methylation field has focused on the identification of tumor suppressors that become inactivated by promoter hypermethylation in tumors. The discovery that loci encoding tumor suppressors, p21 and p15, are both hypermethylated and silenced in human hematological malignancies (20, 21) led many to believe that all methyltransferases function as oncogenes. Since DNA methylation if reversible, removal of this hypermethylation could lead to the re-expression of tumor suppressor genes. These concepts lead to the creation of Dnmt inhibitors, such as 5-azacytidine and decitabine, which shows modest success in the treatment of myelodysplastic syndrome and acute myeloid leukemia (22). However, the use of such hypomethylating agents overlooks three important aspects: 1) the unique roles of individual Dnmts in the generation and maintenance of the cancer methylome, as methylation inhibitors are non-specific and
16 4 believed to inhibit all methyltransferases equally, 2) promoter hypomethylation and oncogene expression and 3) genomic instability induced by hypomethylation. Thus, further understanding of the role of individuals Dnmts in the generation and maintenance of the cancer epigenome, as well as the effect of inhibition of these enzymes is needed. While the DNA methylation field has focused mainly on the identification of hypermethylated tumor suppressors, little attention has been paid to the role of promoter hypomethylation and expression of oncogenic modifiers. Studies in solid tumors found that putative oncogenes WNT5A, S100P, and CRIP1 are demethylated and overexpressed in human prostate cancer (23). Others found that promoter hypomethylation of protease urokinase results in its overexpression, which is associated with tumor progression in breast and prostate cancers (24, 25). In addition to oncogene re-expression, DNA hypomethylation may also result in genomic instability and an increased susceptibility to spontaneous mutations, chromosomal breaks, and re-expression of normally silenced retroviral elements (26). Some suggest that as the genome increased in complexity and size the risk brought forth by unrestricted movable elements increased dramatically and that DNA methylation evolved as a way to protect the genome from the spread outside elements (27). Several reports in mice and humans support the idea that DNA methylation protects the genome. For instance, in vivo studies in mice carrying a hypomorphic allele of Dnmt1 were found to develop T-cell lymphomas, likely due to hypomethylation and genomic instability that resulted in the generation of oncogenic Notch1 (28). Studies in human prostate cancer found a significant correlation between alterations on chromosome 8 and genome wide hypomethylation (29), while a similar study noted an association between hypomethylated Sat2 sequences and 1q copy gain with a 1q12 breakpoint in hepatocellular carcinoma (30). Together, these studies demonstrate the importance of
17 5 hypomethylation in tumorigenesis and highlight the need for additional studies investigating the potential tumor suppressor role of Dnmts. Hypomethylation in tumors may results from inactivation or reduction in the levels of Dnmts. To understand the role of Dnmts in tumorigenesis, numerous conditional Dnmt knockouts were created. For instance, Dnmt1 chip/ mice which have drastically low levels of Dnmt1 develop T-cell lymphomas around 8 months of age, despite severely compromised T-cell development (31, 32). To gain deeper insight into the function of Dnmt1 in lymphoid malignancies, we genetically inactivated Dnmt1 in a mouse model of MYC-induced T-cell lymphomagenesis and found that Dnmt1 is critical for the prevention and maintenance of T-cell lymphomas (33). Using the same model, we demonstrated that loss of Dnmt3b accelerated tumorigenesis and lead to the hypomethylation and ovexpression of the oncogenic modifier Ment, suggesting that Dnmt3b functions as a tumor suppressor (13). The tumor suppressor activity for Dnmt3b is further supported in mouse models of B-cell malignancies, by us and others (34, 35). Work from our lab and others show that loss of Dnmt3a expression in hematopoietic stem cells is sufficient to induce a wide range of hematological malignancies in mice, including chronic lymphocytic leukemia, myelodysplastic syndrome, and T-cell lymphoma (34, 36, 37). Such results, coupled with the high mutation rates of DNMT3A in human hematological malignancies has led to profound interest into the tumor suppressor properties of Dnmt3a in malignant hematopoiesis. The role of Dnmt3a in hematological malignancies. Next generation sequencing of human tumors has identified DNMT3A as a mutational hotspot in human hematological malignancies. Mutations in the DNMT3A coding sequence have been reported in 22% of patients with acute myeloid leukemia (38), 8% of myelodysplastic syndrome (39), 7% of primary myelofibrosis (40), 7% of
18 6 chronic myelomonocytic leukemia (41) and 11% of T-cell lymphomas (42). Two studies have suggested that DNMT3A mutations occur very early in pre-leukemic cells and likely serve as an initiating mutation (43, 44). Importantly, pre-leukemic cells with DNMT3A mutations were found in the blood of patients in remission from AML, indicating they can survive chemotherapy treatment and upon acquisition of additional mutations may spur a relapse (43, 44). This idea is supported by the fact that Dnmt3a deficient hematopoietic stem cells (HSC) have an increased ability to cell renew and their expansion over time may lead to an increased ability to promote pre-leukemic cells (45). While mutations have been found throughout the DNMT3A loci, they largely cluster in the c-terminal catalytic domain. Mutations are almost always heterozygous, and not homozygous (46). Arginine 882 is a mutational hotspot, accounting for 58% of mutations in AML and 23% of mutations in T-call acute lymphoblastic leukemia (46). In vitro studies showed that the R882H mutation functions in a dominate-negative manner by inhibiting the wild-type proteins ability to form tetramers (47). In mice, overexpression on the R882H DNMT3A mutant in hematopoietic stem cells resulted in the development of chronic myelomonocytic leukemia within 12 months (48). In patients with AML, the R882 mutation is associated with global hypomethylation (49). This loss of methylation is most prominent at promoters, with loci encoding HOX genes being significantly affected (49). These studies suggest that mutations found in human tumors, in particular R882H, disrupt normal Dnmt3a function which result in epimutations that likely play a role in tumorigenesis. Furthermore, understanding the functional consequence of these mutations may be of critical importance for the development of new therapies. Due to the significant mutation rate of DNMT3A in human hematological malignancies, our lab was interested in further elucidating the role of Dnmt3a in malignant hematopoiesis. To do so we utilized a conditional knock out model, in which
19 7 Dnmt3a is deleted in hematopoietic stem cells and all downstream lineages (34). Surprisingly, all Dnmt3a-deficient mice developed a disease similar to chronic lymphocytic leukemia (CLL) by one year of age. Next, we asked whether Dnmt3a haploinsufficiency can induce a CLL-like disease or other hematologic malignancies by observing Dnmt3a +/- mice. Likewise, long-term Dnmt3a decrease results in the development of a CLL-like disease in 65% of mice and myeloproliferative disease in 15% of mice within 16 months. Whole-genome bisulfite sequencing (WGBS) revealed significant hypomethylation in tumors. Later studies performed by Mayle et al., and Celik et al., found that deletion of Dnmt3a in the hematopoietic compartment of mice resulted in the development of a wide-range of malignancies, including myelodysplastic syndrome, acute myeloid leukemia, primary myelofibrosis, and T- and B-cell acute lymphocytic leukemia. Altogether, these findings demonstrate that reduction in Dnmt3a levels has profound phenotypic consequence on both the cellular and molecular levels, and identify Dnmt3a as a tumor suppressor gene in the prevention of myeloid, B- and T- cell transformation. The role of Dnmt1 in tumorigenesis. While DNMT3A is heavily mutated in human tumors, DNMT1 is mutated less frequently. DNMT1 is mutated in about 7% of cases of colorectal adenocarcinoma and 1.6% of prostate cancer (50-53), while mutations in hematologic malignancies are very rare, with only one mutation found to date in AML (54). Studies in human T cell, B cell, and myeloid malignancies revealed an increase in the levels of DNMT1 in tumors, suggesting a possible role in tumor maintenance (55, 56). Functional studies in mice have provided profound insight in the roles of Dnmt1 in tumorigenesis. One study using a mouse model of colorectal cancer found that decreased levels of Dnmt1 in Apc Min/+ mice resulted in an increased tumor incidence at early stages of colon cancer (57).
20 8 Dnmt1 was also found to function as a tumor suppressor in a simian virus 40 (SV40)- induced tumorigenesis model of prostate cancer (57, 58). In addition to its role in solid tumors, several reports suggested an important role for Dnmt1 in normal and malignant hematopoiesis. Using Dnmt1 chip/- mice, near complete reduction in Dnmt1 levels in mice resulted in the development of CD4+CD8+ T cell lymphomas (31, 32). In an AML model driven by MLL-AF9 overexpression, a reduction in Dnmt1 delayed leukemogenesis and impaired leukemic stem cell self-renewal, indicating a key role for Dnmt1 in the maintenance and establishment of leukemia (59). To further elucidate the role of Dnmt1 in malignant hematopoiesis, we deleted Dnmt1 in a mouse model of MYC-induced T-cell lymphomagenesis (MTCL). Reduction in Dnmt1 delayed lymphomagenesis by suppression of normal hematopoiesis and by impairing proliferation of tumor cells. Collectively, these studies illustrate a critical role for Dnmt1 in both tumor development and maintenance for solid and hematological malignancies. The role of Dnmt3b in tumorigenesis. Despite similarities in sequence homology and function, unlike DNMT3A, DNMT3B is very rarely mutated in human tumors. While not linked with tumorigenesis, germline mutations in DNMT3B are associated with the very rare immunodeficiencycentromeric instability-facial anomalies (ICF) syndrome, which is characterized by global hypomethylation and chromosome instability (60). In addition, Shen et al., identified single-nucleotide polymorphisms (SNPs) in DNMT3B that were associated with increased risk of developing lung cancer (61). Despite the lack of observed mutation, there are several lines of evidence to suggest that alterations in the levels or activity of Dnmt3b plays a role in tumorigenesis. In mice, two separate studies using MYC-induced models of T- and B-cell lymphoma identified Dnmt3b as a tumor suppressor gene (13, 35). Likewise, we found that loss of
21 9 Dnmt3b accelerated the development of CLL in Dnmt3a-deficient mice (34). In fact, additional evidence exists suggesting that Dnmt3b may play a role in CLL pathogenesis. Down-regulation of DNTM3B in CLL was first noted almost a decade ago (62). Furthermore, analysis of available microarray data from 448 human CLL samples revealed that DNMT3A and DNMT3B are in the top 1% of the most frequently underexpressed genes (63). Consistent with the down-regulation of Dnmts, whole-genome bisulfite sequencing of human CLL samples reveled massive hypomethylation of the genome, suggesting that loss of methylation may play a pivotal role in the pathogenesis of the disease (64). Furthermore, in the TCL1 transgenic mouse model of CLL, it was reported that Tcl1 binds Dnmt3a and Dnmt3b and inhibits their activity, resulting in hypomethylation even prior to leukemia onset, suggesting that inhibition of Dnmts is likely partially responsible for CLL pathogenesis in this model (65). Collectively, these findings suggest that suppression of Dnmt3b likely plays a critical role in the transformation of multiple hematopoietic lineages, including B cells. There is also evidence to suggest an oncogenic role for Dnmt3b. One study found that the overexpression of Dnmt3b was responsible for the hypermethylation phenotype observed in breast cancer cells (66). Likewise, Dnmt3b and Dnmt1 were found to cooperate to maintain DNA methylation and gene silencing in human cancer cells (67). Such hypermethylation may result in the inactivation of tumor suppressor genes, whose absence could contribute to disease pathogenesis. Hypothesis. Given that aberrant DNA methylation is hallmark of virtually all human tumors, and that alterations in the methylation landscape can have a direct effect on gene transcription and genomic stability, we sought to further elucidate the roles of individual
22 10 Dnmts in tumorigenesis. To accomplish this, several tumor studies using various Dnmt knockout mice were generated. In Chapter 1, to further elucidate the role of Dnmt1 in malignant hematopoiesis and to determine Dnmt1's contribution to aberrant DNA methylation in cancer, we used a conditional knockout approach to inactivate Dnmt1 in a mouse model of MYC-induced T- cell lymphomagenesis with the hypothesis that loss of Dnmt1 will accelerate tumorigenesis in mice. Conversely, we show that loss of Dnmt1 delayed lymphomagenesis by suppression of normal hematopoiesis and by impairing proliferation of tumor cells, illustrating that Dnmt1 is required for maintenance of the tumor phenotype (33). In Chapter 2, to understand the role of Dnmt3a in lymphomagenesis, we again use the MYC-induced T-cell lymphoma model in conjunction with a Dnmt3a - allele. We hypothesized that Dnmt3a will function as a tumor suppressor in this model, given the broad range of human malignancies that harbor DNMT3A mutations. Surprisingly, loss of Dnmt3a extends the survival of mice due to a decrease in cellular proliferation and the upregulation of a subset of tumor suppressor genes likely regulated by Dnmt3a s methylation independent repressor function (12). In Chapters 3 and 4, we use a conditional Dnmt3a knockout (in the absence of MYC), and conventional Dnmt3a-heterozygous mice to examine the role of Dnmt3a in normal and malignant hematopoiesis. We hypothesized that loss or decrease in Dnmt3a levels would have profound effect on long-term hematopoiesis, resulting in the development of hematological malignancies similar to those observed in humans with DNMT3A mutations. Interestingly, we found that Dnmt3a is a haploinsufficient tumor suppressor in the prevention of chronic lymphocytic leukemia and myeloproliferative disorder.
23 11 CHAPTER 1: Essential Role for Dnmt1 in the Prevention and Maintenance of MYC-Induced T-Cell Lymphomas 1 Introduction Cytosine methylation is an epigenetic mark that is abundant throughout intragenic and intergenic regions within the mammalian genome. The methylation of gene promoters has been associated with gene repression, while the methylation of gene bodies may promote proper transcription (68, 69). Due to its genome-wide distribution and effects on transcriptional regulation, DNA methylation plays a critical role in a wide range of physiological processes, including silencing of endogenous retroviral elements, X-chromosome inactivation, imprinting, proliferation, differentiation, and apoptosis (70, 71). The disruption of normal methylation patterns contributes to the pathogenesis of a variety of human diseases such as neurodegenerative, developmental, and autoimmune disorders (72, 73). In particular, global deregulation of cytosine methylation is apparent in cancer, where genome-wide hypomethylation is suggested to promote tumorigenesis by invoking genomic instability and upregulating oncogenes, whereas aberrant promoter hypermethylation supports tumorigenesis by silencing tumor suppressor genes (15). Whereas the association of deregulated methylation with cancer is well established, the individual roles of the enzymes catalyzing DNA methylation, DNA methyltransferases (Dnmts), in the pathogenesis of human cancer are unclear. Three catalytically active Dnmts (Dnmt1, Dnmt3a, and Dnmt3b) are responsible for the 1 The material presented in this chapter were previously published: Peters SL, Hlady RA, Opavska J, Klinkebiel D, Novakova S, Smith LM, et al. Essential role for Dnmt1 in the prevention and maintenance of MYC-induced T-cell lymphomas. Molecular and cellular biology. 2013;33(21):
24 12 generation and maintenance of methylation patterns in the mammalian genome. While Dnmt3a and Dnmt3b are associated with de novo methylation because of their involvement in the establishment of normal methylation patterns (5, 74), Dnmt1 is essential for maintenance of the methylation landscape due to its ability to recognize hemimethylated DNA and conserve methylation during somatic cellular division (75). However, the discrete roles of Dnmts in the formation and maintenance of the methylation landscape are more complex. Several studies have suggested that Dnmt1 may function as a de novo enzyme. For example, overexpression of Dnmt1 induced locus-specific de novo methylation in human fibroblasts that was associated with specific sequence motifs (9, 10). Additionally, knockout of Dnmt1 in embryonic stem cells suggests de novo activity for Dnmt1 at repeat elements and single-copy genes (11). Although the main function of Dnmt1 appears to be related to cytosine methylation, Dnmt1 also interacts with a large number of repressor proteins, such as histone deacetylases and DNA methyltransferase-associated protein 1 (DMAP1), to inhibit transcription in a methylation-independent manner (76-78). Recent studies have identified somatic mutations in DNMT1 in cancer; however, they are infrequent. DNMT1 is mutated in about 7% of cases of colorectal adenocarcinoma and 1.6% of prostate cancer as well as a small subset of cases of acute myeloid leukemia (AML) (50-53). Furthermore, increased DNMT1 expression is observed in subsets of human T-cell, B-cell, and myeloid malignancies, suggesting that DNMT1 may be important for tumor maintenance (55, 56). Functional studies in mice have shown that decreased levels of Dnmt1 resulted in an increased tumor incidence at early stages of colon cancer in Apc Min/+ mice and simian virus 40 (SV40)-induced tumorigenesis in the prostate, suggesting a tumor suppressor function for Dnmt1 in these models (57, 58). Mutations in hematologic malignancies are very rare, with only
25 13 one mutation found to date in AML (54). Studies in mice suggested an important role for Dnmt1 in myeloid malignant hematopoiesis. In an AML model driven by MLL-AF9 overexpression, a reduction in Dnmt1 delayed leukemogenesis and impaired leukemic stem cell self-renewal, indicating a key role for Dnmt1 in the maintenance and establishment of leukemia (59). In contrast, a severe reduction in levels of Dnmt1 clearly promotes transformation of T cells. A combination of a hypomorphic Dnmt1chip allele (expressing only 10% of Dnmt1 levels relative to the wild-type allele) with a conventional Dnmt1 knockout allele in Dnmt1chip/ mice resulted in the development of T-cell lymphomas (TCLs) by 8 months of age, despite severely impaired T-cell development (31, 32). To further elucidate the role of Dnmt1 in malignant hematopoiesis and to determine Dnmt1's contribution to aberrant DNA methylation in cancer, we used a conditional knockout approach to inactivate Dnmt1 in a mouse model of MYC-induced T- cell lymphomagenesis. Here we show that loss of Dnmt1 delayed lymphomagenesis by suppression of normal hematopoiesis and by impairing proliferation of tumor cells. Global approaches identified 730 gene promoters differentially methylated in normal thymocytes, MYC-induced T-cell lymphomas (MTCLs), and MTCLs deficient for Dnmt1, suggesting that Dnmt1 contributes to the cancer methylome by both de novo and maintenance activity. Thus, our studies not only provide a biological mechanism explaining delayed lymphomagenesis in the absence of Dnmt1 but also identify Dnmt1 target genes for the first time in the relevant in vivo setting. Methods Mouse studies: EμSRα-tTA; Teto-MYC and Dnmt12lox mice were acquired from D. W. Felsher (Stanford University, Stanford, CA) and R. Jaenisch (Whitehead Institute, Cambridge, MA), respectively. ROSA26EGFP mice (79) and Teto-Cre mice (80) were obtained from The Jackson Laboratory. All mice were back-bred for five generations into
26 14 the FVB/NJ background. Standard genetic crosses were performed to generate the appropriate transgenic mice for these experiments, and the results were confirmed by PCR-based genotyping. Genomic DNA for genotyping was obtained from mouse tails. Tumor-bearing mice were carefully monitored for their overall health and harvested when they became terminally ill. Mice used for tumor studies were EμSRα-tTA; Teto-MYC; Teto-Cre; Rosa26LOXP EGFP/EGFP ; Dnmt1 flox/flox and EμSRα-tTA; Teto-MYC; Rosa26LOXP EGFP/EGFP ; Dnmt1 flox/flox mice (referred to as MYC; Dnmt1 / and MYC; Dnmt1 flox/flox mice, respectively). Further studies were performed utilizing EμSRα-tTA; Teto-MYC; Teto-Cre; ROSA26 EGFP/EGFP ; Dnmt1 +/+, EμSRα-tTA; Teto-MYC; Teto-Cre; ROSA26EGFP/EGFP; Dnmt3a flox/flox, and EμSRα-tTA; Teto-MYC; Teto-Cre; ROSA26 EGFP/EGFP ; Dnmt3b flox/flox mice (referred to as MYC; Dnmt1 +/+, MYC; Dnmt3a /, and MYC; Dnmt3b / mice, respectively). Fluorescence-activated cell sorter (FACS) analysis, proliferation, and apoptosis: Single-cell suspensions from in vitro cultures or from the thymus, spleen, lymph node, and bone marrow were prepared and stained with the appropriate antibodies. For bromodeoxyuridine (BrdU) incorporation assays, cells were incubated with BrdU and labeled using allophycocyanin (APC)-conjugated anti-brdu (BrdU-Flow kit; BD Biosciences) according to the manufacturer's instructions and analyzed using BD FACSDiva analysis software after processing samples on the FACSCalibur II flow cytometer. Similarly, tumor cells were stained with annexin V-APC (ebioscience) antibody and events were acquired on the FACSCalibur II flow cytometer. Cell cycle analysis was performed utilizing Vybrant DyeCycle Orange stain (Invitrogen) according to standard protocols and acquired on the LSR II cytometer. Thymi, spleens, lymph nodes, and bone marrow from developmental and tumor studies were stained with the
27 15 following antibodies to analyze cell surface marker expression: CD4, CD8, CD11b, B220, CD3, TER119, Sca-1, c-kit, CD19, gamma-delta T-cell receptor (TCRγδ), and TCRβ conjugated to phycoerythrin (PE), PE-Cy5, or APC. All antibodies were obtained from ebioscience. Populations of Lin Sca-1+ c-kit+ (LSK; negative for lineage markers CD4, CD8, CD11b, CD19, TER119, CD3, gamma-delta T-cell receptor [TCRγδ], and TCRβ and positive for Sca-1 and c-kit) cells were distinguished by gating against lineage markers (CD4, CD8, CD11b, B220, CD3, and TER119) and subsequent gating for Sca- 1+ c-kit+ cells. Sorting of enhanced green fluorescent protein (EGFP)-positive CD4 CD8, CD4+ CD8+, CD4+, and CD8+ thymocytes was performed on the FACSAria cell sorter. MSCC and data analysis: Methyl sensitive cut counting was performed using methods developed by Ball et al. (81). This technique uses the methyl-sensitive restriction endonucleases HpaII and HpyCh4IV to cut genomic DNA at all unmethylated CCGG and ACGT sites, respectively. Libraries were generated by digesting 2 μg of gdna with 20 U of the restriction enzymes. Next, an adapter containing an Mme1 recognition site was ligated to the fragmented DNA. Libraries were digested with Mmel enzyme, which cuts 18 bp downstream of its recognition site. The fragments were then ligated to a second adapter to allow PCR amplification, gel purified, and sequenced using a high-throughput sequencer. The resulting 18-bp sequence tags were aligned with the mouse genome (mm9) using the short read sequence aligner Bowtie (82). The method results in output of sequencing tags, in which a high nuber of reads (termed counts) correlates with low methylation and vice versa. Count data was batch analyzed by edger (a bioconductor package for R programming language), which uses Bayesian estimation and exact tests based on the negative binomial distribution to generate pairwise comparisons between groups (83). False discovery rates (FDR) were
28 16 generated using the Benjamini Hochberg method (FDR < 0.05 was considered significant). The data in the methylation heat maps (see Figure 5C and D and Figure 6C) represent averages for raw counts of all statistically significant changes of 2-fold or greater within individual promoters between MYC; Dnmt1 flox/flox and MYC; Dnmt1 / mice. The promoter is defined as at bp 1500 to +350 relative to the transcription start site. All genes considered to be hypomethylated or hypermethylated included two or more independent HpaII/HpyCh4IV sites that showed changes of 2-fold or greater with a false discovery rate (FDR) of less than Tissue culture: Mouse MYC; Dnmt1 flox/flox cells were maintained in RPMI 1640 (Invitrogen) containing 10% fetal bovine serum (Invitrogen) and mm 2- mercaptoethanol. Cell lines were cultured at 37 C in a humidified 5% CO2 atmosphere. Cre-mediated deletion of Dnmt1 was achieved using an established MYC; Dnmt1 flox/flox cell line infected with murine stem cell virus (MSCV)-internal ribosome entry site (IRES)- puro-creert2 (Addgene plasmid [35]). Retroviral infections were done as described previously (13). Cre-mediated excision of Dnmt1 was induced by addition of 4- hydroxytamoxifen (4-OHT; Sigma-Aldrich) at a concentration of 150 nm. DNA for PCRbased determinations of Dnmt1 deletion efficiency was prepared from cells harvested after 24 and 72 h. For the colony PCR genotyping analysis, cells from two primary MYC; Dnmt1 / lymphomas were plated into 48-well culture plates in RPMI medium with 10% fetal calf serum (FCS) at dilutions of one cell or fewer per well and cultured for several weeks. DNA was extracted from individual cones and subjected to genotyping. Total methylcytosine: Measurement of 5-methyl-2 -deoxycytidine levels was performed at the University at Buffalo Pharmaceutical Sciences Instrumentation Facility, as described previously (84).
29 17 Affymetrix microarray analyses: RNA was isolated using Trizol and RNAeasy kit (Invitrogen and Qiagen, respetively). A total of 200 ng of RNA was reverse transcribed using the Ambion WT Expression Kit (Ambion). The crna was then hybridized to the Affymetrix GeneChip Mouse Gene 1.0 ST Array and chips were scanned using a GeneChip 3,000 6G scanner by the UNMC DNA Microarray Core Facility. GCOS software was used to scale dataset and assess quality assurance parameters such as background, hybridization kinetics, and reverse transcription efficiency. Intensities were imported into Partek Genomics Suite software using Robust Multi-chip Averaging (RMA) background correction and quantile normalization on a linear scale. Regularized t test analysis of control versus treatment comparisons was performed using a Bayesian approach to estimate the within-treatment variation among replicates using Cyber-T software (85). This principle uses the weighted average of local standard deviations for genes with similar expression levels, resulting in a stabilized within-treatment variance estimate. Heat maps were generated using the average levels of expression of three MYC; Dnmt1 flox/flox tumors as a reference. Ingenuity pathway analysis (IPA) (Ingenuity Systems) core analysis was used to interrogate microarray data based upon their functions and association with canonical pathways. Significant gene expression changes (FDR < 0.05) between MYC; Dnmt1 flox/flox and MYC; Dnmt1 / mice were imported into IPA with a threshold of 1.75-fold change. Statistics: The survival data in Figure 1B were analyzed using the Kaplan-Meier method for overall survival and the log-rank test for survival distributions. Continuous variables were compared using 2-sample Student's t tests, with error bars representing 1 standard error of the mean. Bisulfite sequencing data were analyzed using paired t tests. P values and FDR of less than 0.05 were considered statistically significant.
30 18 Western blot analysis: The following antibodies were used for Western blot analysis: Dnmt3b (52A1018; Imgenex), Dnmt1 (H-300; Santa Cruz), Dnmt3a (H-295; Santa Cruz), and γ-tubulin (H-183; Santa Cruz). For Western blotting, protein lysates were separated in SDS acrylamide gels and blotted into Immobilon P membranes (Millipore). Blots were incubated in blocking buffer (5% skim milk) at a concentration of 1 mg/ml. The primary antibody was then detected using horseradish-peroxidase-conjugated secondary antibodies and the ECL reagent as described by the manufacturer (Pierce). Quantitative qrt-pcr: cdna was prepared from RNA using Bio-Rad iscript according to the manufacturer's protocol. cdna was combined with SYBR green Supermix (Bio-Rad) with a final volume of 20 μl, and experiments were done in duplicate. Reaction conditions were optimized by the use of standard curves for each primer pair. Thermocycling was performed using a CFX96 system (Bio-Rad). Threshold cycle (CT) values were normalized based upon the expression of ubiquitin. Primer sequences: The primer sequences used in these experiments are listed below. For determinations of Dnmt1 deletion efficiency, GGGCCAGTTGTGTGACTTGG, ATGCATAGGAACAGATGTGTGC, and CTTGGGCCTGGATCTTGGGGA were used. For Akt3 quantitative real-time RT-PCR (qrt-pcr), CATCTGAAACAGACACCCGATA and GTTGTCCATGCCGTCCAT were used. For Nrbf2 qrt-pcr, TCTCTGAAGCCATGAAGCTG and GTGCTCTGCTGCGCTTTC were used. For Rasgef1a qrt-pcr, AGGACAGCTGGAAGGCACT and ATCTGTCGCAATGTCACCAA were used. For Upb1 qrt-pcr, TCTCTGCCAGCAGATCAATG and TAGTTGGGTTTGACCGCTTC were used. For H2-Ab1 combined bisulfite restriction analysis (COBRA) and bisulfite sequencing, TGGTTTTTTATTTGGGATTAATTTT and TAAACCCTACTATCTCCCCATACAC were used. For Abhd14a COBRA,
31 19 GTTAAGTTTGGTTATTAGGGAAGAA and ATAAATCTTTTACACCCTTCCTAAC were used. Bisulfite sequencing and COBRA: Sodium bisulfite treatment of genomic DNA was carried out utilizing an EpiTect bisulfite kit (Qiagen). Primers for bisulfite PCR for both COBRA and bisulfite sequencing were designed through the use of MethPrimer (86). For COBRA, bisulfite PCR products were digested with TaqI (NEB). The resulting fragments were then loaded onto an 8% PAGE gel, separated by electrophoresis, and detected with SYBR green Gold (Invitrogen). Bisulfite PCR fragments were also processed for bisulfite sequencing by cloning into pgem-t Easy vector (Promega). DNA was purified from clones and sequenced at the University of Nebraska Medical Center High-throughput DNA Sequencing and Genotyping Core Facility. Results Loss of Dnmt1 delays MYC-induced T-cell lymphomagenesis. In this study, we utilized the genetic setting outlined in Figure 1A and described previously (13). Briefly, the EμSRα promoter is active in 40% of all hematopoietic lineages, including stem cells, and drives the expression of the tetracycline transcriptional transactivator (tta). Expression of tta drives simultaneous expression of the MYC oncogene and Cre recombinase from the Teto promoter. Activation of Cre results in the excision of the stop cassette located upstream of the Rosa26LOXP EGFP locus, leading to the synthesis of EGFP. Thus, EGFP allows monitoring of tta/creexpressing cells by flow cytometry (fluorescence-activated cell sorter [FACS]) analysis. Importantly, Cre expression also results in the excision of the conditional knockout allele of Dnmt1 (referred to herein as Dnmt1 flox ).
32 20 To assess the effects of Dnmt1 loss on MYC-induced lymphomagenesis, we compared levels of tumor development in cohorts of EμSRα-tTA; Teto-MYC; Teto-Cre; Rosa26LOXP EGFP/EGFP ; Dnmt1 flox/flox and EμSRα-tTA; Teto-MYC; Rosa26LOXP EGFP/EGFP ; Dnmt1 flox/flox mice (designated MYC; Dnmt1 / and MYC; Dnmt1 flox/flox mice, respectively). As shown in Figure 1B, lymphomagenesis was significantly delayed in the cohort of MYC; Dnmt1 / mice relative to MYC; Dnmt1 flox/flox mice (median survival, 166 and 90 days, respectively). Analysis of DNA and protein revealed that tumors arising in MYC; Dnmt1 / mice retained 50% of Dnmt1 levels (Figure 1C and D). Furthermore, analysis of individual clones grown in vitro from single cells isolated from MYC; Dnmt1 / tumors revealed that a vast majority of cells had the Dnmt1 flox/ genotype, suggesting that primary tumors mainly consisted of cells heterozygous for the Dnmt1 knockout allele (Figure 1E). Taken together, these data suggest that Dnmt1 is required for the survival of tumor cells. Reduced Dnmt1 levels did not affect the levels of Dnmt3a and Dnmt3b, suggesting that these enzymes are unlikely to exert compensatory effects on the process of lymphomagenesis (Figure 1F). FACS analysis confirmed similar immunophenotypes of lymphomas developed in MYC; Dnmt1 / and MYC; Dnmt1 flox/flox mice. Specifically, MTCLs from both genetic groups consisted of cells that were either CD4 + CD8 + CD44 + CD25 or CD4 + CD8 CD44 + CD25, suggesting that loss of Dnmt1 does not affect the immunophenotype of the tumors (Figure 1G and H). We previously observed no measurable effects of Cre and EGFP expression on the process of lymphomagenesis in this model (13, 87). In addition, loss of Dnmt1 had no measurable effects on MYC expression (data not shown). Therefore, these results suggest that differences in survival between cohorts of MYC; Dnmt1 / and MYC; Dnmt1 flox/flox mice
 Transgene schematic depicting genetic setting used in these studies.")
 Kaplan-Meier survival curves MYC; Dnmt1 flox/flox (F/F) and MYC; Dnmt1 flox/flox ( / ) mice.")
 PCR-based analysis of deletion efficiency of the Dnmt1 conditional knockout allele in MYC; Dnmt1 / tumors.")
. (D) Immunoblot analysis of Dnmt1 expression in normal thymocytes (Th) and in MYC; Dnmt1 flox/flox and MYC; Dnmt1 / lymphomas.")
33 21 can be attributed to the loss of Dnmt1 and that this loss does not result in an altered immunophenotype(s) in this mouse model. Figure 1. Loss of Dnmt1 delays MYC-induced T-cell lymphomagenesis. (A) Transgene schematic depicting genetic setting used in these studies. tta is expressed in 40% of cells and drives expression at the Teto promoter, resulting in transcription of the MYC oncogene and activating Cre-lox recombination to conditionally delete Dnmt1 and activate EGFP expression. (B) Kaplan-Meier survival curves MYC; Dnmt1 flox/flox (F/F) and MYC; Dnmt1 flox/flox ( / ) mice. Median survival rates (MS), numbers of mice (n), and P values (log-rank test) are shown. (C) PCR-based analysis of deletion efficiency of the Dnmt1 conditional knockout allele in MYC; Dnmt1 / tumors. F and KO indicate DNA fragments derived from the floxed and knockout alleles, respectively. Dnmt1 flox/flox and Dnmt1 flox/ genomic DNAs served as controls. NC indicates negative control (no DNA). (D) Immunoblot analysis of Dnmt1 expression in normal thymocytes (Th) and in MYC; Dnmt1 flox/flox and MYC; Dnmt1 / lymphomas. γ-tubulin served as a loading control. (E) PCR-based analysis of deletion efficiency of the Dnmt1 conditional knockout allele in cellular clones from MYC; Dnmt1 / tumors. The top and bottom panels represent two tumors with 10 clones each. F and KO indicate floxed and knockout alleles, respectively. Dnmt1 flox/flox and Dnmt1 flox/ genomic DNAs served as controls. NC indicates negative control (no DNA).
 Immunoblot analysis of Dnmt3a and Dnmt3b expression in normal thymocytes (Th) and in MYC; Dnmt1 flox/flox and MYC; Dnmt1 / lymphomas.")

34 Figure 1 cont. Loss of Dnmt1 delays MYC-induced T-cell lymphomagenesis. (F) Immunoblot analysis of Dnmt3a and Dnmt3b expression in normal thymocytes (Th) and in MYC; Dnmt1 flox/flox and MYC; Dnmt1 / lymphomas. (G) Representative examples of FACS analysis from immunophenotyping of MYC; Dnmt1 / tumors using anti-cd4 and anti-cd8 antibodies. Examples of CD4 single-positive and CD4/CD8 double-positive tumors are shown. (H) Summary of immunophenotypes for CD4 single-positive and CD4/CD8 doublepositive tumors as determined by FACS analysis using CD4 and CD8 expression in MYC; Dnmt1 flox/flox and MYC; Dnmt1 / lymphomas. 22
35 23 Dnmt1 is required for cellular proliferation and maintenance of tumor phenotypes in MTCLs. To examine the underlying cellular basis for the extended survival of MYC; Dnmt1 / mice, we measured annexin V expression and bromodeoxyuridine (BrdU) incorporation in cell lines established from lymphomas of terminally sick MYC; Dnmt1 / and MYC; Dnmt1 flox/flox mice. Flow cytometry quantification of annexin V revealed similar expression levels for MYC; Dnmt1 flox/flox and MYC; Dnmt1 / mice. However, a modest but statistically significant reduction in BrdU incorporation was observed in cells from MYC; Dnmt1 / lymphomas (Figure 2A and B). These data suggest that defective tumor cell proliferation may, in part, be responsible for the delayed tumorigenesis seen in MYC; Dnmt1 / mice. To determine whether Dnmt1 is required for maintenance of the tumor phenotype, we generated two inducible MYC; Dnmt1 flox/flox ; Cre-ER cell lines, in which Cre-mediated excision of the Dnmt1 conditional allele is achieved by the addition of 4- hydroxytamoxifen (4-OHT) to cell cultures. Importantly, while the cellular viability of two MYC; Dnmt1 +/+ ; Cre-ER control cell lines treated with 4-OHT was not affected (data not shown), loss of Dnmt1 resulted in death of MYC; Dnmt1 flox/flox lymphoma cells within 72 h (Figure 2C). As shown in Figure 2D, activation of Cre-ER in vitro yielded efficient deletion of the Dnmt1 conditional allele at as early as 24 h and remained high at 72 h. Collectively, these data support the idea of a requirement for Dnmt1 in the maintenance of the tumor phenotype in vitro.
 Analysis of apoptosis by annexin V staining (A) and BrdU incorporation assay (B) of four independent T-cell lines derived from MYC; Dnmt1 flox/flox")
.")


36 Figure 2. Loss of Dnmt1 results in decreased proliferation and is critical for tumor cell survival. (A and B) Analysis of apoptosis by annexin V staining (A) and BrdU incorporation assay (B) of four independent T-cell lines derived from MYC; Dnmt1 flox/flox and MYC; Dnmt1 / primary MYC-induced lymphomas. Representative FACS diagrams are shown with average percentages and standard deviations in the upper right quadrant (P < 0.05 (Student's t test). Quantification of obtained results for each assay is shown as an average value with error bars representing standard errors of the means (SEM). Statistically significant differences are indicated by an asterisk. (C) A representative example of cell cycle analysis of a MYC; Dnmt1 flox/flox cell line expressing Cre-ER without 4-hydroxytamoxifen (4-OHT) and after 24, 48, and 72 h of incubation with 4-OHT. The cell cycle was measured by Invitrogen Vybrant DyeCycle Orange stain. The percentage of dead cells (blue) is indicated on FACS diagrams. (D) PCR-based analysis of deletion efficiency of the Dnmt1 conditional KO allele in MYC; Dnmt1 flox/flox cell lines infected with Cre-ER and treated with 4-OHT at 24 and 72 h. F and KO indicate DNA fragments derived from the floxed and knockout alleles, respectively. 24
37 25 Loss of Dnmt1 impairs T-cell development. The presence of the Rosa26LOXP EGFP reporter transgene in MYC; Dnmt1 / mice allows evaluation of biological and molecular events occurring in hematopoietic cells by FACS. To further investigate the processes responsible for delayed lymphomagenesis, we evaluated T-cell development in MYC; Dnmt1 / mice by measuring levels of EGFP in thymi. Both percentages and numbers of EGFP-positive cells were decreased 20-fold in MYC; Dnmt1 / mice relative to thymi isolated from control EμSRα-tTA; Teto-MYC; Teto-Cre; Rosa26LOXP EGFP/EGFP ; Dnmt1 +/+ mice (designated MYC; Dnmt1 +/+ mice) (Figure 3A and B). PCR-based genotyping revealed low levels of deletion efficiency of the conditional Dnmt1 allele in the thymi of MYC; Dnmt1 / mice, whereas EGFP-positive thymocytes sorted by FACS analysis retained 50% of the conditional Dnmt1 allele (Figure 3C). A marked decrease in cell numbers was evident at all stages of T-cell development in EGFP-positive MYC; Dnmt1 / thymi, including DN1 to -4, CD4 CD8, CD4 + CD8 +, CD4 +, and CD8 + cells (Figure 3D to F). Dnmt1 was particularly important for the transition from CD4 CD8 double-negative (DN1 to -4) cells to the CD4 + CD8 + double-positive (DP) stage during differentiation, since CD4 + CD8 + cells showed the highest fold reduction (Figure 3G). Consistently, the number of T cells in spleen and lymph nodes was substantially reduced (Figure 3G). PCR-based genotyping of sorted EGFP + DN, DP, CD4 +, and CD8 + MYC; Dnmt1 / cells showed the lowest level of Dnmt1 knockout efficiency in the DN population, with progressive increases in DP, CD4, and CD8 cells (Figure 3H), suggesting that the requirement of Dnmt1 for cellular survival during normal thymocyte development is highest in the least-differentiated DN cells but becomes less stringent in the more-differentiated stages. This is consistent with the CD4 + CD8 + immunophenotype and deletion efficiency of Dnmt1 observed in the majority of MYC; Dnmt1 / lymphomas
38 26 (Figure 1C and H). Altogether, these results suggest that T cells lacking Dnmt1 are selected against during T-cell development and that an efficient transition from the DN stage to the DP stage of thymocyte differentiation requires Dnmt1.
 Total numbers of EGFP+cells isolated from thymi of 24- day-old MYC;Dnmt1 +/+ and MYC;Dnmt1 / mice.")
39 Figure 3. Loss of Dnmt1 impairs T-cell development. (A) Representative FACS profiles with total percentages of EGFP expression. (B) Total numbers of EGFP+cells isolated from thymi of 24- day-old MYC;Dnmt1 +/+ and MYC;Dnmt1 / mice. (C) PCR-based analysis of deletion efficiency of the Dnmt1 conditional KO allele in unsorted (U) and EGFP-positive sorted (S) cells isolated from thymi of MYC; Dnmt1 / mice (n = 2). F and KO indicate DNA fragments derived from the floxed and knockout alleles, respectively. (D) CD4 and CD8 expression in EGFP+ and EGFP- cells from thymi of 24-day-old MYC; Dnmt1 / mice. (E) The total number of EGFP+ T-cell populations within the thymus of MYC; Dnmt1 +/+ and MYC; Dnmt1 / mice. Double-negative (DN), CD4/CD8 doublepositive (DP), CD4 single-positive (CD4), and CD8 single-positive (CD8) cell results are shown. (F) Further analysis of thymocyte development within the CD4/CD8 double-negative population (DN1 to DN4) by FACS in MYC; Dnmt1 +/+ and MYC; Dnmt1 / thymi. (G) The left bar graph shows the fold reduction of EGFP+ double-negative (DN1 to -4), CD4/CD8 double-positive (DP), CD4 singlepositive, and CD8 single-positive cells in the thymi of 24-day-old MYC; Dnmt1 / mice relative to EGFP-positive MYC; Dnmt1 +/+ cells. The right bar graph depicts fold reduction of EGFP+ CD4 and CD8 single-positive cells in the spleen and lymph node (LN) relative to EGFP+ MYC; Dnmt1 +/+ cells. Error bars represent SEM; (*) denotes P < 0.05 (Student's t test). n represents the number of biological replicates. (H) PCR-based analysis of deletion efficiency of the Dnmt1 conditional KO allele in FACS-sorted DN, DP, CD4, and CD8 single-positive EGFP-positive thymic cells from 24- day-old MYC; Dnmt1 / mice. F and KO indicate DNA fragments derived from the floxed and knockout alleles, respectively. Dnmt1 flox/flox and Dnmt1 flox/ genomic DNA served as controls. 27
40 28 Ablation of Dnmt1 alters hematopoietic development. We next investigated whether loss of Dnmt1 negatively impacted development of other hematopoietic lineages. Indeed, cell surface marker expression revealed decreased levels of EGFP-positive B -cells and myeloid cells in the spleen, lymph node, and bone marrow in MYC; Dnmt1 / mice (Figure 4A and B). Interestingly, the fold reduction of B220 + cells was substantially greater than that of CD11b + cells in all three tissues, indicating that the lymphoid lineage may be more sensitive to reductions in the Dnmt1 level. This finding is consistent with previous work in which Dnmt1 was found to be essential for normal B-cell differentiation but not myeloid differentiation (27). DNA isolated from the bone marrow and spleen showed low efficiency of Dnmt1 knockout (Figure 4C), further supporting the idea that Dnmt1 is required for normal hematopoiesis. The Eμ-tTA transgene that activates Cre-mediated excision of the conditional Dnmt1 allele is expressed in hematopoietic stem cells and early hematopoietic progenitor cells (HSC/HPCs), which are defined by a Lin Sca-1 + c-kit + marker profile (LSK; cells negative for lineage markers CD4, CD8, CD11b, CD19, TER119, CD3, gamma-delta T-cell receptor [TCRγδ], and TCRβ and positive for Sca-1 and c-kit). Thus, the substantial decrease in EGFP-positive cells in hematopoietic organs of MYC; Dnmt1 / mice could be caused by an essential role of Dnmt1 in either the differentiation or the maintenance of HSC/HPCs. To assess this, we analyzed LSK populations in the bone marrow. Numbers of EGFP-positive LSK cells in MYC; Dnmt1 / mice were significantly lower than of those isolated from MYC; Dnmt1 +/+ mice (Figure 4D and E). The relative absence of EGFP-positive MYC; Dnmt1 / LSK cells indicated these cells have a competitive disadvantage in comparison to their EGFP-negative counterparts with respect to maintenance of their physiological levels in the bone marrow and during
 The total numbers of EGFPpositive cells within the spleen, lymph node (LN), and bone marrow (BM) of MYC; Dnmt1 +/+ and MYC; Dnmt1 / mice.")
41 29 differentiation into hematopoietic lineages, likely due to the critical role of Dnmt1 in these processes. Figure 4. Impaired hematopoiesis in MYC; Dnmt1 / mice. (A) The total numbers of EGFPpositive cells within the spleen, lymph node (LN), and bone marrow (BM) of MYC; Dnmt1 +/+ and MYC; Dnmt1 / mice. (B) Fold reductions in total numbers of EGFP-positive B-lymphoid (B220) and myeloid (CD11b) cells relative to EGFP-negative B-lymphoid and myeloid cells in spleens, lymph nodes, and bone marrow of 24-day-old MYC; Dnmt1 / mice. (C) PCR-based analysis of deletion efficiency of the Dnmt1 F allele in total DNA isolated from bone marrow (BM) and spleen (SP) of 24-day-old MYC; Dnmt1 / mice. Dnmt1 flox/flox and Dnmt1 flox/ genomic DNA controls as well as a negative control (NC) are shown. F and KO indicate DNA fragments derived from the floxed and knockout alleles, respectively. (D) FACS analysis of c- kit and Sca-1 expression in lineage-negative (Lin ) EGFP-negative and Lin EGFP-positive cells (LSK cells: Lin Sca1 + c-kit + ) in the bone marrow of MYC; Dnmt1 / mice. Average percentages of LSK cells are indicated in the FACS diagrams. (E) The total numbers of LSK cells in EGFP-positive populations in bone marrow of MYC; Dnmt flox/flox and MYC; Dnmt1 / mice. Error bars represent SEM; P < 0.05 (Student's t test). Statistically significant differences are indicated by an asterisk. The number of samples is indicated by n.
42 30 Reduction of Dnmt1 in MTCLs leads to altered locus-specific methylation. To investigate how decreased levels of Dnmt1 affect DNA methylation in tumors, we first analyzed the content of 5-methyl-2 -deoxycytosine in DNA from primary mouse MTCLs using an established mass spectrometry method (84). MYC; Dnmt1 flox/flox and MYC; Dnmt1 / lymphomas had decreased levels of global 5-methylcytosine relative to normal thymocytes, suggesting that tumors underwent global DNA hypomethylation (Figure 5A). No significant differences between MYC; Dnmt1 flox/flox and MYC; Dnmt1 / lymphomas were observed. This result is consistent with the moderate effects observed in an HCT116 cell line with knockout of Dnmt1 alleles (88). To determine locus-specific effects of Dnmt1 on DNA methylation, we profiled the methylation status of HpaII and HpyCh4IV restriction sites using methyl-sensitive cut counting (MSCC) in genomic DNA isolated from MYC; Dnmt1 flox/flox and MYC; Dnmt1 / lymphomas as described previously (30). Analysis of Line-L1, Line-L2, and Sine/Alu repeat elements revealed hypomethylation in both tumor groups relative to normal thymocytes but no significant differences in repeat element methylation between tumor groups (Figure 5B). We next analyzed MSCC data to determine how Dnmt1 affected the DNA methylation landscape in MYC; Dnmt1 flox/flox tumors. A total of 24,236 promoters in the mouse genome have at least two restriction sites as seen from HpaII and/or HpyCh4IV digests. To rigorously assess the methylation status of promoters, we considered a change in methylation to be significant only if it occurred in two or more independent restriction sites in promoter areas at from bp 1500 to +350 relative to the transcription start site, with a 2-fold or greater change at a false discovery rate (FDR) of less than A comparison of the methylation landscapes of MYC; Dnmt1 flox/flox and MYC; Dnmt1 / cells revealed that 730 promoters were differentially methylated between these
43 31 two tumor groups (Figure 5C; see also Data Set S1 in the supplemental material). Of these, 303 promoters showed increased levels of methylation in MYC; Dnmt1 / lymphomas, possibly as a result of deregulation of DNA methylation machinery. Of the 427 promoters that showed decreased methylation levels in MYC; Dnmt1 / lymphomas, 214 promoters were also hypomethylated in normal thymocytes, suggesting that these promoters might be de novo targets of Dnmt1 in tumorigenesis. The remaining 213 promoters were highly methylated in normal thymocytes and MYC; Dnmt1 flox/flox lymphomas but hypomethylated in MYC; Dnmt1 / lymphomas, suggesting that Dnmt1 is involved in the maintenance of methylation at these promoters. Decreased levels of Dnmt1 resulted in methylation changes of 777 genes, with 440 hypomethylation and 337 hypermethylation events in gene bodies (Figure 5D). Additionally, we have seen a relatively small amount of overlap of genes that are hypomethylated in both the promoter and the gene body ( 6%), suggesting that Dnmt1 activity is locus specific. Collectively, these data indicate that the contribution of Dnmt1 to the promoter methylation consists not only of maintenance methylation patterns but also of cancer-specific de novo activity. Since MYC; Dnmt1 flox/flox tumors retain 50% of Dnmt1 protein levels, our data also suggest that gene promoters require higher levels of Dnmt1 than gene bodies or intragenic regions to maintain proper methylation patterns.
 and the HCT116 DNMT1 / ; DNMT3B / cell line (H13B) served as controls.")
44 Figure 5. Analysis of DNA methylation in Dnmt1-deficient tumors. (A) Total 5- methylcytosine levels in normal thymocytes (Th), MYC; Dnmt1 flox/flox (F/F) tumors, and MYC; Dnmt1 / ( / ) tumors. The human colorectal carcinoma parental cell line HCT116 (H) and the HCT116 DNMT1 / ; DNMT3B / cell line (H13B) served as controls. (B) In silico analysis of relative methylation levels of Line-L1, Line-L2, and Sine/Alu repeats in normal thymus (Th), MYC; Dnmt1 flox/flox tumors, and MYC; Dnmt1 / tumors by MSCC. (C) A heat map analysis of MSCC data displaying 427 hypomethylated and 303 hypermethylated promoters in MYC; Dnmt1 / tumors relative to MYC; Dnmt1 flox/flox tumors (FDR < 0.05 [negative binomial]). Genes proposed to have Dnmt1 de novo (214 genes) and Dnmt1 maintenance (213 genes) activity are labeled. A color bar is shown, with black representing a high degree of methylation and yellow representing lower levels. Th indicates normal thymocytes. n represents the number of biological replicates. (D) A heat map displaying the numbers of hypermethylated (n = 337) and hypomethylated (n = 440) gene bodies in MYC; Dnmt1 / tumors relative to MYC; Dnmt1 flox/flox tumors. Normal thymus (Th) levels are also shown. Changes represent a P of <0.05 with a 2-fold or greater change. 32
45 33 Deregulated transcription in Dnmt1-deficient lymphomas. To further understand the molecular basis for increased survival of MYC; Dnmt1 / mice, as well as the effects of Dnmt1 on gene transcription, we next compared microarray-based gene expression profiles of MYC; Dnmt1 / lymphomas to those of normal thymocytes and MTCLs. We identified 1,260 genes whose expression levels were significantly different (1.75-fold; FDR < 0.05) between MYC; Dnmt1 flox/flox and MYC; Dnmt1 / lymphomas (Figure 6A; see also Data Set S2 in the supplemental material). Loss of Dnmt1 resulted in transcriptional upregulation of 780 genes, which is consistent with the function of Dnmt1 as a repressor protein. Although we cannot rule out the possibility that Dnmt1 plays a role in transcriptional activation, 480 genes downregulated in MYC; Dnmt1 / lymphomas likely represent secondary changes rather than being a direct consequence of Dnmt1 inactivation. Real-time quantitative RT-PCR (qrt-pcr) confirmed that Akt3, Nrfb2, and Rasgef1a genes are upregulated whereas Upb1 is downregulated in MYC; Dnmt1 / lymphomas (Figure 6B). Unsupervised hierarchical clustering analysis using global gene transcription profiles of all genes resulted in perfect segregation of tumors in a Dnmt1-specific manner, with MYC; Dnmt1 flox/flox tumors clustering closer to MYC; Dnmt1 / lymphomas than to normal thymocytes (Figure 6A). Tight clustering of MYC; Dnmt1 / lymphomas suggests that Dnmt1 plays an important role in regulating the transcriptome in MTCLs, likely through specific target genes. To gain further insight into the pathogenesis of MYC; Dnmt1 / lymphomas, we performed IPA using 780 genes whose transcription was significantly changed (upregulated 1.75-fold or more, FDR < 0.05) relative to MYC; Dnmt1 flox/flox lymphomas. The top five disease groups associated with higher expression in MYC; Dnmt1 / lymphomas relative to control MYC; Dnmt1 flox/flox lymphomas were cancer, hematological disease, developmental disorders, immunological disease, and renal and urological
46 34 disease (data not shown). Of these, the most significant functional disease network was that of cancer. Eight genes (Dcn, Rag1, Brca2, Cdkn1a, Zeb1, Ccnd3, Runx1, and Ssbp2) from the hematologic disease network tumorigenesis in thymic lymphomas were overexpressed in Dnmt1-deficient lymphomas, and their upregulation was suggested by IPA to be involved in the suppression of T-cell lymphomagenesis (Figure 6C). In addition, IPA showed that negative regulators of cell cycle, such as retinoblastoma (Rb1), were upregulated in Dnmt1-deficient lymphomas. Considering all
.")
47 Figure 6. Significantly deregulated genes in MYC; Dnmt1 / tumors. (A) A heat map derived from global transcription profiling by microarray displaying 1,260 genes that are 1.75-fold changed in MYC; Dnmt1 / tumors relative to MYC; Dnmt1 flox/flox tumors. A total of 780 genes show upregulation, while 480 show downregulation (FDR < 0.05 [Bayesian t test]). A color bar is shown to reference upregulation in red and downregulation in green. Above the heat map, an unsupervised hierarchical clustering of normal thymi (Th), MYC; Dnmt1 flox/flox (F/F) tumors, and MYC; Dnmt1 / ( / ) tumors is shown. (B) qrt-pcr displaying the relative mrna levels of 4 differentially expressed genes in MYC; Dnmt1 flox/flox and MYC; Dnmt1 / tumors. The average results of two replicates are shown for n = 2 samples for each group. Error bars represent SEM. (C) The network tumorigenesis in thymic lymphomas derived from Ingenuity pathway analysis of 780 upregulated genes from MYC; Dnmt1 / cells. All eight genes within the network are predicted to suppress thymic lymphomagenesis. (D) Heat maps for genes with at least a 2-fold decrease in promoter methylation as determined by MSCC and at least a 1.75-fold induction in expression as determined by microarray in MYC; Dnmt1 / lymphomas. Average values from normal thymocytes (Th) and MYC; Dnmt1 flox/flox and MYC; Dnmt1 / tumors are shown. 35
48 36 these results together, these molecular events may contribute to the delayed lymphomagenesis observed in MYC; Dnmt1 / mice. To determine the effects of Dnmt1-dependent methylation on gene transcription, we next analyzed levels of gene expression in Dnmt1 target genes. This comparison revealed that expression of 17 of 427 hypomethylated genes correlated with promoter hypomethylation, suggesting that differential methylation affects a relatively small ( 4.0%) subset of genes (Figure 6D). H2-Ab1 is a target of cancer-specific de novo methylation by Dnmt1 in vivo. The major histocompatibility class 2 gene (H2-Ab1) is involved in antigen processing and presentation (89). Its locus encodes two distinct isoforms (Figure 7A). Our MSCC data showed that the promoter region driving expression of the longer H2- Ab1 isoform may be a target of Dnmt1, as it was consistently hypomethylated in MYC; Dnmt1 / tumors (Figure 7B). To determine if H2-Ab1 is a maintenance or de novo target of Dnmt1, we performed combined bisulfite restriction analysis (COBRA) and bisulfite sequencing of the 43 to +471 region of this promoter in normal thymocytes and MYC; Dnmt1 flox/flox and MYC; Dnmt1 / tumors. In both assays, MYC; Dnmt1 flox/flox tumors were consistently hypermethylated relative to normal thymocytes, while Dnmt1-deficient tumors showed near-complete ablation of promoter methylation (Figure 7C and D). These changes in methylation correlated with gene transcription of the major isoform of H2-Ab1, which was severely repressed in MYC; Dnmt1 flox/flox tumors compared to normal thymocytes but was derepressed in MYC; Dnmt1 / tumors (Figure 7E). Importantly, this potential de novo activity of Dnmt1 is independent of the presence of Dnmt3a and Dnmt3b, as levels of methylation of the H2-Ab1 locus remained high in thymic lymphomas with genetic inactivation of either Dnmt3a or Dnmt3b (Figure 7D).
49 37 Importantly, a potential de novo activity of Dnmt1 is not limited to H2-Ab1 since the promoter of the Abhd14a gene is also hypermethylated in MYC; Dnmt1 flox/flox but is unmethylated in MYC; Dnmt1 / lymphomas (Figure 7E). Furthermore, global methylation profiling of MYC; Dnmt1 / and MYC; Dnmt3b / tumors showed an overlap of only 3% in Dnmt1 target genes (Figure 7G, (13), and data not shown). In addition, only 35 of 780 (4%) Dnmt1 target genes were overexpressed in both Dnmt1 / and Dnmt3b / MTCLs (Figure 7G). Thus, Dnmt1 appears to have cancer-specific target genes whose methylation and/or expression is largely independent of the presence of Dnmt3b and perhaps Dnmt3a.

50 38 iscussion Figure 7. H2-Ab1 is a target of Dnmt1-mediated methylation in lymphomas. (A) An illustration of the exons and introns comprising the two H2-Ab1 isoforms. Black arrows represent the transcription start site. Red arrows denote the location of qrt-pcr primers. (B) A methylation bar graph depicting average methylation levels across three CpG sites analyzed by MSCC in the promoter of H2-Ab1 for normal thymocytes (Th) and MYC; Dnmt1 flox/flox and MYC; Dnmt1 / tumors. (C) COBRA of the H2-Ab1 promoter in normal thymocytes and in MYC; Dnmt1 flox/flox (F/F) and MYC; Dnmt1 / lymphomas. Undigested (U) and digested (D) fragments correspond to unmethylated and methylated DNA, respectively. CpG indicates a fully methylated control. (D) Bisulfite sequencing of the H2-Ab1 promoter in normal thymocytes (Th) and in MYC; Dnmt1 flox/flox, MYC; Dnmt1 /, MYC; Dnmt3a flox/flox (3a / ), and MYC; Dnmt3b flox/flox (3b / ) lymphomas. The dashed lines denote the location of the CpG dinucleotides within the locus. Each pie denotes an individual CpG dinucleotide within the locus, and each wedge of the pie represents the sequence of an individual allele. Black denotes the percentage of methylated alleles, while white represents unmethylated alleles. (E) qrt-pcr analysis of H2-Ab1 longer-isoform expression in normal thymocytes, MYC; Dnmt1 flox/flox tumors, and MYC; Dnmt1 / tumors. Error bars represent SEM; (*) denotes P < 0.05 (Student's t test). (F) COBRA of the Abhd14a promoter in normal thymocytes (Th) and in MYC; Dnmt1 flox/flox and MYC; Dnmt1 / lymphomas. (G) Overlap of 260 genes identified in Dnmt3b-deficient MTCLs and 427 potential Dnmt1-dependent targets, as determined by MSCC, are shown in the left Venn diagram. The right Venn diagram shows 253 genes that were at least 1.75-fold upregulated in the absence of Dnmt3b in MTCLs overlaid with the 780 genes that were upregulated in MYC; Dnmt1 / tumors. The overlapping genes are listed below each diagram.
51 39 Discussion In the present study, we used a MYC model to characterize the role of Dnmt1 in T-cell lymphomagenesis. We show that Dnmt1 plays a crucial role in the prevention and maintenance of the tumor phenotype in MTCLs as well as in normal hematopoiesis. Importantly, we identified locus-specific maintenance and de novo activity for Dnmt1. Our results suggest that Dnmt1, in addition to its involvement in maintenance of DNA methylation patterns during cellular division, also plays an irreplaceable role in promoter and gene body methylation during tumorigenesis. This report represents the first in which the cancer-specific de novo and maintenance activity of Dnmt1 in the in vivo setting is presented. Suppressed tumorigenesis in MYC; Dnmt1 / mice is surprising in view of previous work that has suggested that T cells are particularly sensitive to low levels of Dnmt1. Whereas a global decrease in Dnmt1 levels is achieved in all cells in Dnmt1 chip/ mice, these mice almost exclusively (91%) develop T-cell lymphomas over the course of 8 months, despite the fact that this all occurs in the context of reduced numbers of HSC/HPCs and thymocytes in Dnmt1 chip/ mice. This is likely occurring through the induction of genomic instability and activation of oncogenes such as Notch by intracisternal A particles (28, 31, 32). There are at least two biological processes that may explain the increased latency of Dnmt1 tumors in our model. First, deletion of Dnmt1 in MYC; Dnmt1 / mice results in considerable defects in hematopoietic development which may limit the pool of cells susceptible to MYC-induced lymphomagenesis. Inefficient hematopoiesis is largely a consequence of a severe reduction in the number of HSC/HPCs. The total quantity of EGFP-positive LSK cells in MYC; Dnmt1 / mice is decreased 4-fold relative to the EGFP-negative population, suggesting that HSC/HPCs encountering loss of Dnmt1 are
52 40 at a competitive disadvantage relative to EGFP-negative cells in terms of their ability to self-renew within the same microenvironment. Additionally, decreased cellularity of EGFP-positive cells of lymphoid and myeloid origins suggests that the differentiation potential of the remaining LSK cells likely with only partial Dnmt1 expression is also skewed. Our data are consistent with observations showing an essential role for Dnmt1 in the self-renewal and differentiation of HSCs (31, 90). c-myc has been reported to be involved in differentiation of HSCs, as loss of c-myc results in pooling of stem cells (91, 92). Since our data were obtained in a setting where high levels of transgenic MYC were present, it also appears that MYC overexpression is insufficient to rescue Dnmt1-driven defects in hematopoietic differentiation. Our results show an accumulation of Dnmt1- deficient T cells in the double-negative stage of T-cell differentiation, similar to what was observed in Lck-Cre; Dnmt1 / mice, whereby Cre actively deletes Dnmt1 alleles at the DN2 stage of thymocyte differentiation and results in impaired differentiation (93). Altogether, these data indicate serious defects in hematopoiesis in the absence of Dnmt1, which ultimately diminishes the pool of hematopoietic cells available for MYCinduced transformation. Second, a biological process that may contribute to increased survival of MYC; Dnmt1 / mice is the decreased proliferation potential of MYC; Dnmt1 / cells. This may reflect increases in the levels of key antiproliferative genes such as retinoblastoma (Rb) that were observed in MYC; Dnmt1 / lymphomas. Rb is a negative regulator of cell cycle and is a tumor suppressor in hematopoietic cancers (94, 95). Another possibility is that a larger cadre of genes contributes to this phenomenon. For example, Ingenuity pathway analysis of genes upregulated in MYC; Dnmt1 / lymphomas unveiled an eight-gene (Dcn, Rag1, Brca2, Cdkn1a, Zeb1, Runx1, Ssbp2, and Ccnd3) signature (tumorigenesis in thymic lymphomas) where all eight genes are predicted to decrease thymic
53 41 lymphomagenesis. Indeed, inactivation of seven of these eight genes has been functionally linked to promotion of thymic lymphomagenesis. Loss of Ssbp2 or Dcn accelerated T-cell lymphomagenesis in p53 / mice, while ablation of Rag1 accelerated Eμ-MYC tumorigenesis (96-98). Germ line inactivation of Brca2, Cdkn1a, Runx1, or Zeb1 is sufficient to result in hematologic malignancies in mice (99-103). Thus, these putative Dnmt1 target genes have been independently linked to their ability to suppress lymphomagenesis in mouse tumor prevention settings. Therefore, within one cellular compartment (T cells), Dnmt1 plays a dichotomous role by preventing tumorigenesis through maintaining the integrity of the genome and silencing oncogenes (Dnmt1 chip/ studies [(28, 32)]) and promoting lymphomagenesis by retention of cells susceptible to transformation (MYC; Dnmt1 / studies). This is likely due to the fact that low levels of Dnmt1 allow cells to survive and accumulate genetic and epigenetic changes promoting tumorigenesis whereas complete deletion of Dnmt1 is incompatible with the viability of normal hematopoietic cells. Thus, Dnmt1 may both promote and inhibit tumorigenesis even within the same tumor type, depending on the degree of its activity. At present, we cannot rule out the possibility that germ line inactivation of one Dnmt1 allele in Dnmt1 chip/ mice promotes T-cell transformation in a non-cell-autonomous way. Thus, further studies are required to determine if microenvironments deficient for Dnmt1 can enhance T-cell lymphomagenesis. This study also uncovered an important role for Dnmt1 in the maintenance of the tumor phenotype. For example, all tumors that developed in MYC; Dnmt1 / mice retained 50% of Dnmt1 levels and exhibited decreased proliferation, suggesting that Dnmt1 is crucial for the survival of tumor cells. This was further confirmed through functional inactivation of Dnmt1 in fully developed MYC; Dnmt1 flox/flox lymphomas, which led to severely impaired cellular survival. In addition to being critical for the maintenance
54 42 of the tumor phenotypes either in AML induced by MLL-AF9 or in B-cell leukemia induced by combined overexpression of Myc and Bcl2 (31, 59), Dnmt1 function is also fundamental for the maintenance of mouse MTCLs. Our data further indicate that even incomplete inactivation of Dnmt1 has a profound effect on the molecular landscape of MTCLs. By comparing methylation patterns of normal thymocytes, MYC; Dnmt1 flox/flox lymphomas, and MYC; Dnmt1 / lymphomas, we identified 427 promoters whose methylation appeared to depend upon Dnmt1. Of these, 214 promoters are likely targets of Dnmt1 de novo activity, as their methylation is low in normal thymocytes and MYC; Dnmt1 / lymphomas but is increased in MYC; Dnmt1 flox/flox tumors. The remaining 213 gene promoters are methylated in normal thymocytes and MYC; Dnmt1 flox/flox lymphomas but hypomethylated in MYC; Dnmt1 / lymphomas, suggesting that Dnmt1 is involved in maintenance of the methylation at these loci throughout tumorigenesis. Furthermore, Dnmt1 target loci appear to be largely independent of Dnmt3b, as a comparison with our previously published Dnmt3b targets (13) showed only a 3% overlap with newly unveiled Dnmt1 targets in this study. Along the same lines, locus-specific de novo methylation by Dnmt1 at the H2-Ab1 target gene is independent of both Dnmt3a and Dnmt3b, as lymphomas deficient for either methyltransferase gain methylation at levels similar to those seen with MYC; Dnmt1 flox/flox lymphomas. Results showing differing spectra of Dnmt1 and Dnmt3b target genes identified in MTCLs are consistent with the opposing effects of Dnmt1 and Dnmt3b on MYC-induced lymphomagenesis, during which, as our recent studies showed, Dnmt3b functions as a tumor suppressor gene (13). Our data also show increased methylation of 303 promoter regions in MYC; Dnmt1 / lymphomas. At present, it is unclear why a decrease in Dnmt1 levels results in promoter hypermethylation. However, locus-specific increases in methylation levels have been
55 43 recently observed upon loss of methyltransferase activity of Dnmt3a in mouse hematopoietic stem cells (45). The present knowledge base of target loci of Dnmt1 is minimal. Previous studies have identified targets of Dnmt1-dependent methylation and transcription in the HCT116 colon cancer cell line (93, 104). When we compared these target genes with Dnmt1 targets identified in this study, we observed only a 2% overlap (data not shown), suggesting that Dnmt1 may have tissue- or species-specific target loci. The apparent lack of a significant overlap in Dnmt1 target genes between the HCT116 cell line and MTCLs may also stem from the different growth conditions under which the cells were maintained. For example, the spectrum of Dnmt1 target genes in HCT116 cell line may reflect the different selection pressures that cells experience during in vitro culturing. In contrast, the methylation profiles of the MTCLs are more likely to faithfully reflect physiological patterns, as they were obtained from primary lymphomas grown in vivo. In any case, in addition to Dnmt1's canonical function as a maintenance methyltransferase during DNA replication, Dnmt1 may localize to specific loci in a cell- or tissue-specific manner. Juxtaposition of 427 Dnmt1-dependent methylation targets and 780 genes upregulated in MYC; Dnmt1 / tumors identified only a 4% correlation of promoter methylation with the transcription status. This number is likely underestimated, perhaps due to limitations in MSCC analysis as well as in array-based gene transcription profiling. The use of two restriction enzymes (HpaII and HpyCh4IV) increased the coverage of DNA methylation profiling to 16% of all CpGs in the mouse genome but still may not have been sufficient to fully reveal the effects of Dnmt1 on the cancer methylome (105). Similarly, Affymetrix gene transcription profiling is unable to reliably distinguish between the levels of expression of various gene isoforms. For example, the
56 44 Dnmt1 target gene H2-Ab1 encodes at least two isoforms whose transcripts significantly overlap. As a result, global microarray profiling has not identified differences in expression of this gene between MYC; Dnmt1 flox/flox and MYC; Dnmt1 / lymphomas. However, isoform-specific qrt-pcr clearly showed upregulation of the longer isoform which is driven by a specific promoter upon hypomethylation in Dnmt1-deficient MTCLs. Thus, future studies will focus on the use of more-sensitive methods, such as wholegenome bisulfite sequencing for methylation profiling and transcriptome sequencing (RNA-seq) for transcriptional profiling, to further analyze the relationship of DNA methylation to transcription. It is possible that inhibitory effects of DNA methylation on transcription are limited in some biological settings. Indeed, recent studies have identified a low correlation between changes in promoter methylation and differential gene expression in mouse hematopoiesis and human AML (38, 45). Thus, additional discrete studies should be performed to address this point. Our present findings highlight the importance of Dnmt1 in the prevention and maintenance of T-cell malignancies and complex activities of Dnmt1 in the tumor methylome and transcriptome.
57 45 CHAPTER 2: Methylation-independent repression of Dnmt3b contributes to oncogenic activity of Dnmt3a in mouse MYC-induced T-cell lymphomagenesis 2 Introduction Methylation of CpG dinucleotides in DNA is an essential epigenetic modification involved in X-chromosome inactivation, genomic imprinting and tissue-specific gene regulation (15).Three DNA methyltransferases (Dnmts) catalyze the addition of a methyl group to cytosine in mammalian cells: Dnmt1, Dnmt3a and Dnmt3b. Dnmt1 is primarily responsible for maintenance of methylation patterns during cellular divisions through its ability to read and transfer methylation groups to the newly synthesized DNA strand during replication (7). Consistently with the importance of maintaining epigenetic integrity in dividing cells, homozygous deletion of Dnmt1 is lethal at early stages of embryogenesis (4). Dnmt3a and Dnmt3b function primarily as de novo enzymes (5). Dnmt3b is responsible for early de novo methylation and repression of germ line genes (74), and its inactivation is embryonically lethal. Dnmt3a is dispensable for embryogenesis, but Dnmt3a-knockout mice die shortly after birth due to multiple organ failure (5). Emerging evidence suggests that all three enzymes may have a role in maintenance and de novo activity in a locus-specific manner (15), but their ability to affect promoter methylation in normal and pathological settings is still poorly understood. 2 The material presented in this chapter were previously published: Haney SL, Hlady RA, Opavska J, Klinkebiel D, Pirruccello SJ, Dutta S, et al. Methylation-independent repression of Dnmt3b contributes to oncogenic activity of Dnmt3a in mouse MYC-induced T-cell lymphomagenesis. Oncogene. 2015;34(43):
58 46 Dnmt3a and Dnmt3b share several sequence and structural similarities, including a conserved C-terminal domain, which mediates addition of methyl groups to DNA, and the N-terminal regulatory domain, which mediates interactions with DNA and other proteins (15). Methylation at CpG dinucleotides found in the promoter and other regulatory regions is often associated with transcriptional silencing (15). In addition to their methyltransferase activities, Dnmt3a and Dnmt3b can repress transcription in a methylation-independent manner. Critical to this process is their interaction with histone deacetylases (HDACs) and other repressor proteins via their ATRX-like domain (16). For instance, Dnmt3a interacts with the methyl CpG binding domain of Mbd3 and Brg1 to silence metallothionein-i transcription in mouse lymphosarcoma cells (17). However, how methylation-independent repressor activity affects physiological processes remains elusive. Genome-wide deregulation of the DNA methylation landscape, including locusspecific hyper- and global hypo-methylation, is a consistently observed phenomenon in human tumors. This deregulation, in particular hypomethylation, likely comes from genetic alterations of DNMTs found in cancer. Although mutations in DNMTs were identified in a variety of human tumors, they are most often found in hematologic malignancies. For example, DNMT3A is one of the most frequently mutated genes in myeloid and T-cell malignancies with the frequency ranging from 8% cases of myelodysplastic syndrome to 33% of angioimmunoblastic T-cell lymphoma (38, 39, 106, 107). In T-cell malignancies, approximately two-third of mutations are missense, with the remainder being frame shifts, nonsense mutations and deletions (42, 106, 107). The majority of mutations cluster in the catalytic domain, suggesting that the change in methylase activity is important for tumor development. The substitution of arginine for histidine in the catalytic domain (R882H mutation) accounts for ~60% of the mutations in
59 47 acute myeloid leukemia. In addition to being hypomorphic, this mutant is believed to function as a dominant-negative protein (108). The effects of aberrations found outside the catalytic domain, and those common to T-cell malignancies, are not known. In contrast to DNMT3A, DNMT3B or DNMT1 is rarely mutated in hematologic malignancies. Why in hematologic diseases genetic alterations are present in DNMT3A but not in other DNMTs is unclear. Like mutations in DNMT3A, increased activity of the proto-oncogene MYC is frequently observed in human T-cell malignancies, either through mutations in oncogenes, such as NOTCH1 for which MYC is a transcriptional target, or through genetic alterations of the MYC locus itself (109). For example, a subset of peripheral T- cell lymphomas (TCLs) has a frequent gain of the MYC locus (8q24) with subsequent overexpression, suggesting that MYC has a role in the pathogenesis of the disease (110). The sensitivity of T-cells to MYC-induced transformation was previously demonstrated using a bitransgenic EμSRα-tTA;Teto-MYC mouse model in which tetracycline transcriptional transactivator (tta) drives MYC expression resulting in the development of immature TCLs (111). Using a model of MYC-induced T-cell lymphomagensis (MTCL), we recently demonstrated that conditional inactivation of Dnmt1 compromised normal and malignant hematopoiesis and delayed MYC-induced T- cell lymphomagenesis (33). In contrast, Dnmt3b functions as a tumor suppressor (TS) as its loss does not affect normal T-cell development but accelerates MTCL (13). Utilizing a model of MTCL, we show that loss of Dnmt3a extends the survival of mice due to a decrease in cellular proliferation with no effect on the disease spectrum. Using genome-wide approaches, we observed upregulation of TS genes, including Dnmt3b, E2f2 and Pten, whose expression is elevated in Dnmt3a-deficient lymphomas
60 48 without apparent changes in DNA methylation in their promoters or gene bodies. We further show that catalytically inactive Dnmt3a inhibits Dnmt3b in vitro. Finally, genetic inactivation of Dnmt3b accelerated MTCL, suggesting that delayed lymphomagenesis is at least in part mediated by Dnmt3b. Altogether, our data provide evidence for an unexpected oncogenic function of Dnmt3a in MTCL, through methylation independent repressor activity critical for the proliferation of tumor cells. Methods Mouse studies: EμSRα-tTA;Teto-MYC and Dnmt3a F/F mice were obtained from D.W. Felsher (Stanford University) and R. Jaenisch (Whitehead Institute), respectively. ROSA26 EGFP and Teto-Cre mice were purchased from The Jackson Laboratory (Bar Harbor, ME, USA). All experiments were performed using mice of FVB/NJ background. Genotypes were confirmed by PCR using genomic DNA isolated from mouse tails. For analysis of T-cell development (including cell surface marker analysis, EGFP expression, and weights and cellularity of thymus, lymph node and spleen), 21-day-old mice from the EμSRα-tTA;Teto-MYC;Teto-Cre;Rosa26LOXP EGFP/EGFP ;Dnmt3a F/F (MYC;Dnmt3a Δ/Δ ) and EμSRα-tTA;Teto-MYC;Teto-Cre;ROSA26 EGFP/EGFP Dnmt3a +/+ (MYC;Dnmt3a +/+ ) cohorts were used. FACS-sorted EGFP + thymocytes isolated from 21- day-old EμSRα-tTA;Teto-Cre;Rosa26LOXP EGFP/EGFP (Dnmt3a +/+ ) and EμSRα-tTA;Teto- Cre;Rosa26LOXP EGFP/EGFP ;Dnmt3a F/F mice (Dnmt3a Δ/Δ ) were used as controls for MSCC analysis. For tumor studies, the survival of EμSRα-tTA;Teto- MYC;Rosa26LOXP EGFP/EGFP ;Dnmt3a F/F mice (MYC;Dnmt3a F/F ) was compared with MYC;Dnmt3a Δ/Δ or EμSRα-tTA;Teto-MYC;Teto-Cre;Rosa26LOXP EGFP/EGFP ;Dnmt3a F/+ (MYC;Dnmt3a Δ/+ ) mice, and survival of EμSRα-tTA;Teto- MYC;Rosa26LOXP EGFP/EGFP ;Dnmt3a F/F ;Dnmt3b F/F (MYC;Dnmt3a F/F ;Dnmt3b F/F ) was compared with that of EμSRα-tTA;Teto-MYC;Teto-
61 49 Cre;Rosa26LOXP EGFP/EGFP ;Dnmt3a F/F ;Dnmt3b F/F (MYC; Dnmt3a Δ/Δ ;Dnmt3b Δ/Δ ). Full genotypes with abbreviations and genetic crosses to produce mice are listed in Supplementary Tables S1 and S2. Differences in survival were calculated using the Kaplan Meier method and the log-rank test for survival distributions. A two-sided Student s t-test was used to analyze differences in tumor burden, EGFP percentage and cell surface marker expression. MSCC and data analysis: MSCC library preparation, data collection and data analysis were performed as previously described (13, 33, 34, 81). The method results in an output of sequencing tags, or counts, which inversely correlate with the methylation status of a particular CpG. The R programming language and bioconductor package edger was used for statistical analysis of count data (83, 112). An FDR was estimated using the Benjamini Hochberg method. To carefully assess the methylation status of promoters, we considered a change in methylation to be significant only if it occurred in two or more independent HpaII and/or HpyCh4IV restriction sites, with a fold change 2, at an FDR of <0.05. The promoter was defined as 1500 to +500 base pairs relative to the transcription start site. Results were confirmed using COBRA as previously described (13, 33). Affymetrix microarray analyses: Microarray was performed at the UNMC Microarray core facility as previously described (13). Statistical analysis was done using Cyber-T software (85). Genes differentially expressed (P<0.05 and fold change >1.5) in MYC;Dnmt3a Δ/Δ tumors relative to MYC;Dnmt3a F/F tumors were analyzed using IPA (Qiagen, Valencia, CA, USA) to identify common pathways and disease associations. Microarray data were deposited in NCBI s Gene Expression Omnibus (accession no. GSE59338).
62 50 Generation of retroviruses and infection of cell lines: Retroviral vectors were created by subcloning the coding sequences of wild-type Dnmt3a and catalytically dead Dnmt3a (Dnmt3aCD) into the MSCV-IRES-RFP vector (113). Dnmt3a P705V/C706D has two amino-acid substitutions in the catalytic domain, which eliminate methylase activity of the enzyme. Constructs were verified by sequencing. Tumor cells isolated from MYC;Dnmt3a Δ/Δ mice were cultured in vitro in RPMI 1640 medium supplemented with 10% FBS and mm 2-mercaptoethanol. Retroviral infection of cells was performed as previously described (13). Cells were infected using one of three retroviral vectors (MSCV-IRES-RFP, MSCV-IRES-Dnmt3a-RFP or MSCV-IRES-Dnmt3aCD-RFP), and RFP+ cells were sorted 72 h after infection for RNA isolation and qrt PCR analysis. FACS analysis, proliferation, and apoptosis: Flow cytometry, BrdU, and Annexin V measurements were performed as previously described (13, 33). All antibodies were obtained from ebioscience (San Diego, CA, USA). BrdU was performed using the APC BrdU-Flow Kit (BD-Pharmigen, San Jose, CA, USA) according to the manufacturer s instructions and data was analyzed using BD-FACS Diva software. Apoptosis was measured using the Annexin V-APC antibody (ebioscience). A two-sided Student s t test was used to analyze differences in proliferation and apoptosis. Thymocytes isolated from 21 day old Dnmt3a +/+ and Dnmt3a / (EμSRα-tTA;Teto- Cre;Rosa26LOXP EGFP/EGFP and EμSRα-tTA;Teto-Cre; Rosa26LOXP EGFP/EGFP ;Dnmt3a F/F mice, respectively) were sorted for EGFP + cells using the FACS Aria. Western blot: The following antibodies were used for Western blot: Dnmt3b (52A1018, Imgenex, Littleton, CO, USA), Dnmt3a (H-295, Santa Cruz, Santa Cruz, CA, USA), -Tubulin (H-183, Santa Cruz), and PCNA (PC10, Santa Cruz). Western blots were carried out as described previously (13). Briefly, For Western blotting, protein lysates were separated in SDS acrylamide gels and blotted into Immobilon P
63 51 membranes (Millipore). Blots were incubated in blocking buffer (5% skim milk) at a concentration of 1 mg/ml. The primary antibody was then detected using horseradishperoxidase-conjugated secondary antibodies and the ECL reagent as described by the manufacturer (Pierce). For Figure 6d and Supplementary Figure S13 protein levels were quantified by measuring band density of Dnmt3b and normalized to PCNA and -tubulin, respectively (ImageJ software). Real-time quantitative RT-PCR (qrt-pcr): RNA was converted to cdna using oligo dt primers and Superscript reverse transcriptase per manufacturer s instruction (Invitrogen, Grand Island, NY, USA). qrt-pcr was carried out using SYBR Green Supermix (Bio-Rad, Hercules, CA, USA) at a final volume of 20 l and performed in triplicates. Thermocycling was performed using the CFX96 cycler (Bio-Rad). Gapdh expression values were used for normalization of C T values. Primer sequences are listed in Supplementary File S3. Results Oncogenic role of Dnmt3a in MTCL. To evaluate the role of Dnmt3a in MTCL, we generated EμSRα-tTA;Teto- MYC;Rosa26LOXP EGFP/EGFP ;Dnmt3a F/F (designated MYC;Dnmt3a F/F or control mice), EμSRα-tTA;Teto-MYC;Teto-Cre;Rosa26LOXP EGFP/EGFP ; Dnmt3a +/F (designated MYC;Dnmt3a +lδ or heterozygous mice) and EμSRα-tTA;Teto-MYC;Teto- Cre;Rosa26LOXP EGFP/EGFP ; Dnmt3a F/F (designated MYC;Dnmt3a Δ/Δ or Dnmt3a-deficient; Figure 1a) mice and measured survival. Although loss of one allele of Dnmt3a had no effect on MTCL, we found that the biallelic inactivation of Dnmt3a significantly extended the survival of mice relative to controls (Figure 1b). Analysis of protein and DNA confirmed the complete ablation of Dnmt3a in tumors arising in MYC;Dnmt3a Δ/Δ mice
64 52 (Figures 1c and d). Loss of Dnmt3a had no effect on MYC expression (Supplementary Figure S1), suggesting that the delayed MTCL in Dnmt3a-deficient mice was not caused by downregulation of transgenic MYC. Tumor burden in various hematopoietic organs was similar between control and Dnmt3a-deficient mice, indicating that loss of Dnmt3a did not affect mouse survival in a tissue-specific manner (Supplementary Figure S2). Like control lymphomas, tumors from MYC;Dnmt3a Δ/Δ were either CD4+/CD8+ or CD4+, with no measurable differences in expression of other T-cell (CD3, TCRβ, TCRγδ), B-cell (B220, CD19), myeloid (CD11b, Gr-1) or erythroid (TER119) markers (Figure 1e and data not shown). Altogether, this suggests that loss of Dnmt3a did not affect the disease spectrum in this MTCL model. Thus, contrary to our expectations, these data show that loss of Dnmt3a suppresses MTCL, suggesting an oncogenic function for Dnmt3a in T- cells.
 is expressed and promotes simultaneous expression of the Teto-MYC and Teto-Cre transgenes.")
65 Figure 1. Ablation of Dnmt3a delays T-cell lymphomagenesis. (a) Genetic setting used to conditionally delete Dnmt3a. The tetracycline activator protein (tta) is expressed and promotes simultaneous expression of the Teto-MYC and Teto-Cre transgenes. Expression of Cre results in excision of the stop cassette located upstream of the Rosa26LOXPEGFP reporter locus and deletion of Dnmt3a within the same subpopulation of cells. Thus, inclusion of the EGFP transgene allows for monitoring cells expressing tta, Cre and MYC, as well as to identify cells deleted for Dnmt3a. In the pre-tumor stage (from birth to approximately day 21), the EμSRα-tTA transgene is expressed in 30 50% of cell in all hematopoietic lineages, including hematopoietic stem cells. During tumorigenesis, MYC-expressing cells expand rapidly, resulting in EGFP-positive tumors. (b) Kaplan Meier survival curve for control (MYC;Dnmt3a F/F, blue), Dnmt3a-deficient (MYC;Dnmt3a Δ/Δ, red) and Dnmt3a heterozygous (MYC;Dnmt3a +/Δ, green) mice. Number of mice (n) and median survival (MS) is shown. Comparison of MYC;Dnmt3a F/F with MYC;Dnmt3a Δ/Δ was statistically significant (P=0.0002). (c) Immunoblot showing Dnmt3a expression in normal thymocytes (N), control tumors (MYC;Dnmt3a F/F ) and Dnmt3a-deficient tumors (MYC;Dnmt3a Δ/Δ ). γ-tubulin is shown as a loading control. (d) PCR-based deletion efficiency of Dnmt3a in MYC;Dnmt3a Δ/Δ tumors. Dnmt3a F/Δ served as a control. F and Δ indicate floxed and knockout alleles, respectively. (e) FACS analysis of immunophenotypes is plotted to show percentage of CD4+ and CD4+CD8+ malignanies in MYC;Dnmt3a F/F (F/F) and MYC;Dnmt3a Δ/Δ (Δ/Δ) mice. 53
66 Relative Expression MYC;Dnmt3a F/F D/D 1 0 Supplementary Figure S1. MYC expression is similar between control and Dnmt3adeficient lymphomas. qrt-pcr analysis of MYC levels in MYC;Dnmt3a F/F tumors (blue, n=4) and MYC;Dnmt3a / (red, n=4). Error bars denote ± SEM.
 and MYC;Dnmt3a / ( /, red) terminally ill mice.")
67 Supplementary Figure S2. Tumor burden in control and Dnmt3a-deficient mice. Analysis of tumor burden in MYC;Dnmt3a F/F (F/F, blue) and MYC;Dnmt3a / ( /, red) terminally ill mice. Weights of thymus (TH), spleen (SP), and lymph node (LN) were averaged. Error bars denote ± SEM. Number of mice (n) used for each group is shown. 55
68 56 Dnmt3a inactivation decreases cellular proliferation during disease progression. We next sought to determine the nature of biological processes affecting MTCL in the absence of Dnmt3a. We first looked at T-cell development in 21-day-old EμSRαtTA;Teto-MYC;Teto-Cre;ROSA26 EGFP/EGFP ;Dnmt3a +/+ (MYC;Dnmt3a +/+ ) and MYC;Dnmt3a Δ/Δ mice. Although Dnmt3a was efficiently deleted in EGFP + cells isolated from the thymi of MYC;Dnmt3a Δ/Δ mice (Figure 2a), no substantial differences were found in size or cellularity of thymi and spleens when compared with MYC;Dnmt3a +/+ in 21-day-old mice (data not shown). T-cell development evaluated by expression of CD4, CD8, CD25 and CD44 markers and the percentage of cells expressing EGFP was not affected by loss of Dnmt3a at 21 days (Figure 2b, Supplementary Figures S3 and S4). These data suggest that Dnmt3a is dispensable for T-cell development, consistent with our previous report (34). Similarly, no differences in the levels of apoptosis were observed between MYC;Dnmt3a +/+ and MYC;Dnmt3a Δ/Δ mice at any stage of tumor development (Figure 2c). In contrast, whereas BrdU incorporation was similar at early stages of tumor development (21 days), a substantial decrease in cells incorporating BrdU was observed at later stages of tumor development (35 days and terminally ill mice; Figures 2d and e, Supplementary Figures S5 and S6). Together, these results imply that the extended survival of MYC;Dnmt3a Δ/Δ mice is caused by decreased proliferation during disease progression.
69 Figure 2. Dnmt3a inactivation decreases cellular proliferation during disease progression. (a) PCR-based deletion efficiency of Dnmt3a in EGFP + sorted thymoctyes isolated from 21-day-old MYC;Dnmt3a Δ/Δ mice. Dnmt3a F/Δ served as a control. F and Δ indicate floxed and knockout alleles, respectively. (b) FACS analysis of T-cell development in thymocytes isolated from 21-day-old MYC;Dnmt3a +/+ (blue) and MYC;Dnmt3a Δ/Δ (red) mice. Number of mice (n) in each cohort is shown. Quantification of obtained results is shown as an average value with error bars representing±s.e.m. (c) Analysis of apoptosis by Annexin V staining in cells isolated from the thymi of 21-day-old, 35-day-old and final tumors in MYC;Dnmt3a +/+ (blue) and MYC;Dnmt3a Δ/Δ (red) mice. Error bars denote±s.e.m. Number of mice used for each group is shown inside the bars. (d) Representative FACS diagrams showing BrdU labeling in MYC;Dnmt3a +/+ (blue) and MYC;Dnmt3a Δ/Δ (red) final thymic tumors. The percentage of cells staining positive is shown. (e) Quantification of BrdU-positive cells isolated from the thymi of 21-day-old, 35-day-old and final tumors in MYC;Dnmt3a +/+ (blue) and MYC;Dnmt3a Δ/Δ (red) mice. Quantification of results for each time point is shown as an average value with error bars representing±s.e.m. Number of mice used for each comparison is shown inside the bar. P<0.05 is denoted by a (*). 57
 thymocytes populations isolated from 21 day old MYC;Dnmt3a +/+ (+/+, blue) and MYC;Dnmt3a / ( /, red) mice.")
70 Supplementary Figure S3. Loss of Dnmt3a does not effect T-cell development. FACS analysis of T-cell development in CD4 neg CD8 neg (double negative, DN) thymocytes populations isolated from 21 day old MYC;Dnmt3a +/+ (+/+, blue) and MYC;Dnmt3a / ( /, red) mice. Immunophenotypes of DN populations in thymocytes are as follows: CD4 neg CD8 neg CD25 neg CD44 + (DN1), CD4 neg CD8 neg CD25 + CD44 + (DN2), CD4 neg CD8 neg CD25 + CD44 neg (DN3), and CD4 neg CD8 neg CD25 neg CD44 neg (DN4). Number of mice (n) in each group is shown. Quantification of obtained results is shown as an average value with error bars representing ± SEM 58
 and MYC;Dnmt3a / (red) mice, as determined by FACS.")
71 Supplementary Figure S4. EGFP expression in thymocytes from control and Dnmt3adeficient mice. Average percentage of EGFP + cells in the thymi of 21 day old, 35 day old, and final tumors in MYC;Dnmt3a +/+ (blue) and MYC;Dnmt3a / (red) mice, as determined by FACS. Error bars represent ± SEM. Number of mice used for each group is shown inside the bars. (*) denotes P<

72 Supplementary Figure S5. Analysis of Annexin V staining by FACS. Representative FACS diagrams showing analysis of apoptosis by Annexin V staining in thymocytes isolated from 21 day old, 35 day old, and final tumors in MYC;Dnmt3a +/+ (blue) and MYC;Dnmt3a / (red) mice. The percent of cells staining positive is shown in upper quadrant 60

73 Supplementary Figure S6. Analysis of BrdU incorporation by FACS. Representative FACS diagrams showing BrdU labeling for thymocytes isolated from 21 day old and 35 day old MYC;Dnmt3a +/+ (blue) and MYC;Dnmt3a / (red) mice. 61
74 62 Dnmt3a ablation results in genome-wide methylation changes in lymphomas. To investigate the locus-specific effects of Dnmt3a on DNA methylation, we used methyl-sensitive cut counting (MSCC) to profile the methylation patterns of MYC;Dnmt3a F/F and MYC;Dnmt3a Δ/Δ lymphomas along with normal Dnmt3a +/+ and Dnmt3a Δ/Δ thymocytes as previously described (13, 33, 34, 81). In this next-generation sequencing-based method, the methylation evaluated based on the number of sequence tags (termed counts) inversely correlates with the degree of methylation at HpaII and HpyCh4IV sites (81). A total of promoters in the mouse genome have at least two HpaII and/or HpyCh4IV restriction sites. To rigorously assess the methylation status of promoters, we considered a change in methylation to be significant only if it occurred in two or more independent restriction sites in promoter areas from 1500 to +500 base pairs relative to the transcription start site (two fold, false discovery rate (FDR) <0.05). We first compared promoter-specific methylation between MYC;Dnmt3a F/F and MYC;Dnmt3a Δ/Δ lymphomas. This analysis revealed that 370 gene promoters were hypomethylated in MYC;Dnmt3a Δ/Δ lymphomas, suggesting that these promoters may represent potential targets of Dnmt3a-specific methylase activity (Figure 3a and Supplementary File S1). In contrast, the promoters of 64 genes were hypermethylated in MYC;Dnmt3a Δ/Δ lymphomas, likely as an indirect effect of Dnmt3a loss (Figure 3a). Next, we analyzed the methylation status of these promoters in normal thymocytes and Dnmt3a-deficient thymocytes. Out of the 370 promoters hypomethylated in MYC;Dnmt3a Δ/Δ lymphomas, 353 were also hypomethylated when compared with either normal or Dnmt3a Δ/Δ thymocytes, implying that Dnmt3a is dispensable for their de novo methylation during normal development, but may have a role in their maintenance methylation during tumorigenesis (Figure 3a and Supplementary Figure S7). In contrast,
75 63 17 promoters were specifically hypermethylated in MYC;Dnmt3a F/F tumors, indicating that they may represent potential targets of Dnmt3a cancer-specific de novo methylation (Figure 3a and Supplementary Figure S7). Finally, promoters of 10 genes were hypomethylated in normal Dnmt3a-deficient thymocytes, suggesting that their methylation is already decreased during normal development and thus their hypomethylation in MYC;Dnmt3a Δ/Δ lymphomas is not tumor-specific (Supplementary Figure S7). Methylation read-outs from MSCC analysis were confirmed for selected promoters using locus-specific combined bisulfite restriction analysis (COBRA). For example, the predicted gene AK appeared to be a target of Dnmt3a s cancerspecific de novo activity, as its promoter region was not methylated in normal thymocytes and MYC;Dnmt3a Δ/Δ tumors but was methylated in MYC;Dnmt3a F/F tumors (Figure 3b). Conversely, Leng1 may be a target of Dnmt3a maintenance activity as the area near its promoter was hypermethylated in normal thymocytes and MYC;Dnmt3a F/F lymphomas but not in MYC;Dnmt3a Δ/Δ lymphomas (Figure 3b). These data indicate that the contribution of Dnmt3a to the tumor-specific methylation patterns consists of both de novo and maintenance activities. It is worth noting that the magnitude of Dnmt3a effects on genome-wide methylation may be larger, as analysis of promoters using single HpaII or HpyCh4IV sites showed 1854 hypomethylated promoters in MYC;Dnmt3a Δ/Δ lymphomas (Supplementary Figure S8). Thus, a higher resolution genome-wide methylation profiling studies such as whole-genome bisulfite sequencing may better address this point in future studies.
 Analysis of MSCC data showing 370 hypomethylated and 64 hypermethylated promoters in MYC;Dnmt3a Δ/Δ tumors relative to MYC;Dnmt3a F/F tumors.")
76 Figure 3. Dnmt3a ablation results in genome-wide methylation changes in MYC;Dnmt3a Δ/Δ lymphomas. (a) Analysis of MSCC data showing 370 hypomethylated and 64 hypermethylated promoters in MYC;Dnmt3a Δ/Δ tumors relative to MYC;Dnmt3a F/F tumors. Proposed de novo (17 genes) and maintenance (353 genes) targets are labeled. Methylation status of normal thymocytes (N) is also shown. Promoter is defined as +500 to 1500 relative to the transcription start site. Differentially methylated sites had a fold change of two or greater and an FDR<0.05 at two independent CpG sites. Number of samples per group (n) is shown. A color bar depicting fold change is shown with blue representing a high degree of methylation and yellow representing lower levels. (b) COBRA analysis of the AK and Leng1 promoters in normal thymocytes (N), MYC;Dnmt3a F/F and MYC;Dnmt3a Δ/Δ tumors. PCR fragments were digested with the restriction enzyme BstUI. Undigested {U} and digested {D} fragments correspond to un-methylated and methylated DNA, respectively. C indicates a fully methylated control. Position of primers relative to the transcription start site for each gene is shown in brackets to the left. 64
 tumors relative to MYC;Dnmt3a F/F (F/F) tumors as determined by analysis of MSCC data.")
77 65 Supplementary Figure S7. Summary of differentially methylated genes in Dnmt3adeficient tumors. Pie chart showing breakdown of differentially methylated genes in MYC;Dnmt3a / ( / ) tumors relative to MYC;Dnmt3a F/F (F/F) tumors as determined by analysis of MSCC data. Methylation changes for normal thymocytes (N) and Dnmt3a-deficient thymocytes (N3a) are also shown. All differentially methylated genes are based on 2 tag analysis, a fold change of 2 or greater and an FDR<0.05. Red denotes proposed maintenance targets and blue represents de novo targets.
78 66 Supplementary Figure S8. Global methylation profiling by MSCC using 1 tag analysis. Analysis of MSCC data showing 1,854 hypomethylated and 1,055 hypermethylated promoters in MYC;Dnmt3a / tumors ( / ) relative to MYC;Dnmt3a F/F tumors (F/F). Proposed de novo (137 genes) and maintenance (1,717 genes) targets are labeled. Methylation status of normal thymocytes (Th) is also shown. Promoter is defined as +500 to -1,500 relative to the transcription start site. Differentially methylated sites had at least one tag with a fold change of 2 or greater and an FDR<0.05. Number of samples per group (n) is shown. A color bar depicting fold change is shown with black representing a high degree of methylation and yellow representing lower levels. MYC;Dnmt3a n=4 n=7 n=8 de novo (137 genes) maintance (1717 genes) hypomethylated (1854 genes) hypermethylated (1055 genes) Th F/F D/D R i k counts 0 10
79 67 DNA methylation-independent upregulation of TS genes in Dnmt3a-deficient lymphomas. To further understand the molecular basis for the extended survival of MYC;Dnmt3a Δ/Δ mice, we compared microarray-based gene expression profiles of MYC;Dnmt3a Δ/Δ lymphomas with those of normal thymocytes and MYC;Dnmt3a F/F lymphomas. We identified 2246 genes whose expression levels were significantly different (1.5-fold; P<0.05) between MYC;Dnmt3a F/F and MYC;Dnmt3a Δ/Δ lymphomas (Figure 4a, Supplementary File S2). Loss of Dnmt3a resulted in the transcriptional upregulation of 1421 genes, which is consistent with the function of Dnmt3a as a repressor protein. qrt PCR confirmed that Cd79b, E2f2 and Pten were upregulated in MYC;Dnmt3a Δ/Δ lymphomas (Figure 4b). Microarray analysis also identified 825 genes downregulated in MYC;Dnmt3a Δ/Δ tumors (Figure 4a). Although we cannot rule out the possibility that Dnmt3a has a role in transcriptional activation, these genes likely represent secondary changes resulting from deregulated transcription upon loss of Dnmt3a. To gain further molecular insight into the pathogenesis of MYC;Dnmt3a Δ/Δ lymphomas, we performed Ingenuity Pathway Analysis (IPA) using the 1421 genes that were significantly upregulated relative to MYC;Dnmt3a F/F lymphomas. The top five disease groups associated with upregulated genes were immunological disease, cancer, inflammatory disease, infectious disease and hematological disease (Supplementary Figure S9). This search also identified a 17-gene signature under the disease network Lymphomagenesis whose upregulation was predicted to suppress lymphomagenesis (Figure 5a). This signature consisted of Bcl2l11, Brca2, Dna2, Dnmt3b, E2f1, E2f2, Exo1, Irf1, Irf8, Nqo1, Prdm2, Pten, Recql4, Smurf2, Ssbp2, Tyk2 and Xrcc2. In contrast, analysis using genes downregulated in MYC;Dnmt3a Δ/Δ lymphomas did not yield any significant change under the disease network Lymphomagenesis. Surprisingly, both
80 68 promoter and gene body methylation was unaffected for all 17 genes (Figure 5b and Supplementary Figure S10), suggesting that the increased expression of these genes is independent of changes in DNA methylation. Furthermore, methylation of gene bodies (defined as +500 to the end of the gene) was largely unaffected by loss of Dnmt3a (Supplementary Figures S11 and S12). The 17-gene TS signature observed in Dnmt3adeficient MTCLs may represent molecular events functionally contributing to the extended survival observed in MYC;Dnmt3a Δ/Δ mice.
 A heat map derived from global transcription profiling by microarray displaying 1421 overexpressed and 825 underexpressed genes in MYC;Dnmt3a Δ/Δ tumors relative to MYC;Dnmt3a F/F tumors (fold")
81 Figure 4. Loss of Dnmt3a leads to deregulated transcription. (a) A heat map derived from global transcription profiling by microarray displaying 1421 overexpressed and 825 underexpressed genes in MYC;Dnmt3a Δ/Δ tumors relative to MYC;Dnmt3a F/F tumors (fold changegreater than or equal to1.5 and P<0.05 by Bayesian t-test). Expression in normal thymocytes (N) is also shown. A color bar is shown to reference fold change with upregulation in red and downregulation in green. Number of samples (n) is shown. (b) On the left, expression data obtained from microarray for three differentially expressed genes in MYC;Dnmt3a Δ/Δ (red) relative to MYC;Dnmt3a F/F (blue) tumors are shown. On the right, qrt PCR data displaying the relative mrna levels of the three genes are shown. Quantification of obtained results is shown as an average value with error bars representing±s.e.m. Number of samples used for each comparison is shown inside the bars. P-values are shown with statistical significance denoted by a (*). 69
82 Supplementary Figure S9. Summary of Ingenuity pathway analysis. IPA core analysis was performed on 2,246 genes differentially expressed between MYC;Dnmt3a / and MYC;Dnmt3a F/F tumors. 70

83 71

84 Supplementary Figure S10. MSCC analysis of promoter methylation for the 17 gene signature obtained from IPA. Analysis of methylation levels at individual CpGs present in the promoter regions of the 17 gene signature. Average counts from MSCC data in MYC;Dnmt3a F/F (blue) and MYC;Dnmt3a / (red) were used with error bars designating ± SEM. Counts inversely correlate with methylation status. Promoter is defined at -1,500 to +500 base pairs relative to the TSS. (*) denotes a P <
 The 17-gene signature Lymphomagenesis derived from Ingenuity Pathway Analysis (IPA) of 1421 upregulated genes in MYC;Dnmt3a Δ/Δ tumors.")
85 Figure 5. DNA methylation-independent upregulation of tumor suppressor genes in Dnmt3a-deficient lymphomas. (a) The 17-gene signature Lymphomagenesis derived from Ingenuity Pathway Analysis (IPA) of 1421 upregulated genes in MYC;Dnmt3a Δ/Δ tumors. Upregulation of these 17 genes are predicted to suppress lymphomagenesis. Fold changes derived from microarray data, as well as Z-score and P-value generated by IPA, are shown. (b) Bar graph showing quantification of promoter methylation for the 17 genes using average counts from MSCC data in MYC;Dnmt3a F/F (blue) and MYC;Dnmt3a Δ/Δ (red) tumors. Proposed Dnmt3a target gene, AK046742, is shown as a positive control. The promoter is defined as 1500 to +500 relative to the transcription start site. Error bars denote±s.e.m. P<0.05 is shown by a (*). 73
 and MYC;Dnmt3a / (red) tumors were averaged. Error bars denote ± SEM.")
86 Supplementary Figure S11. Quantification of total gene body methylation for the 17 gene signature obtained from IPA. Counts from MSCC data for MYC;Dnmt3a F/F (blue) and MYC;Dnmt3a / (red) tumors were averaged. Error bars denote ± SEM. Counts inversely correlate with methylation status 74
87 Supplementary Figure S12. MSCC analysis of gene body methylation of four tumor suppressor genes. Bar graph showing quantification of methylation levels for individual CpGs present in the gene body of Dnmt3b, E2f1, E2f2, and Pten. Average counts from MSCC data in MYC;Dnmt3a F/F (blue) and MYC;Dnmt3a / (red) were used and error bars represent ± SEM. Counts inversely correlate with methylation status. 75
88 76 Dnmt3a represses Dnmt3b expression independently of its catalytic activity. Our global approach identified TS genes under the disease network Lymphomagenesis whose increased expression is associated with little-to-no changes in DNA methylation. Thus, their increased expression could either be in a direct response to loss of Dnmt3a repressor function or could be an indirect consequence of lymphomagenesis. We have recently reported that a close relative of Dnmt3a, Dnmt3b, is a TS gene in this MTCL model due to its ability to negatively regulate cellular proliferation during disease progression (13). As our data indicate that a key biological process behind delayed MTCL is decreased proliferation and our global gene expression data showed upregulation of Dnmt3b in MYC;Dnmt3a Δ/Δ tumors, we wondered whether Dnmt3a regulates Dnmt3b expression. To address this we first looked at the expression of Dnmt3b in MYC;Dnmt3a Δ/Δ lymphomas. This analysis revealed upregulation of mrna and protein levels of Dnmt3b, suggesting that Dnmt3a may repress Dnmt3b (Figures 6a and b). Re-introduction of wild-type Dnmt3a into cell lines derived from MYC;Dnmt3a Δ/Δ lymphomas resulted in moderate but significant decrease in Dnmt3b RNA and protein levels (Figures 6c e, Supplementary Figure S13). As we did not detect differences in methylation levels of the Dnmt3b promoter or gene body, we asked whether Dnmt3a inhibition of Dnmt3b could be independent of its methylase activity. To test this directly we infected MYC;Dnmt3a Δ/Δ lymphoma cells with Dnmt3a in which two key amino acids in the catalytic domain were mutated to produce a catalytically dead Dnmt3a protein (Dnmt3aCD (113)). Overexpression of Dnmt3aCD repressed Dnmt3b expression to a similar extent as wild-type Dnmt3a. Altogether, these data suggest that Dnmt3a represses Dnmt3b in a methylation-independent manner (Figures 6c e).
 qrt PCR analysis of Dnmt3b transcript levels in control MYC;Dnmt3a F/F tumors (blue) and MYC;Dnmt3a Δ/Δ tumors (red).")
 Immunoblot showing Dnmt3b protein levels in MYC;Dnmt3a F/F tumors, MYC;Dnmt3a Δ/Δ tumors, and a Dnmt3bdeficient control (b).")
 Immunoblot analysis showing Dnmt3b and Dnmt3a expression in three independent MYC;Dnmt3a Δ/Δ cell lines (A, B, C) infected with")

 to one and using this as a baseline for")
89 Figure 6. Dnmt3a represses Dnmt3b expression independently of its catalytic activity. (a) qrt PCR analysis of Dnmt3b transcript levels in control MYC;Dnmt3a F/F tumors (blue) and MYC;Dnmt3a Δ/Δ tumors (red). The number of samples used for each group is shown inside the bars. Error bars denote±s.e.m. P<0.05 is shown by a (*). (b) Immunoblot showing Dnmt3b protein levels in MYC;Dnmt3a F/F tumors, MYC;Dnmt3a Δ/Δ tumors, and a Dnmt3bdeficient control (b). PCNA served as a loading control. (c) Immunoblot analysis showing Dnmt3b and Dnmt3a expression in three independent MYC;Dnmt3a Δ/Δ cell lines (A, B, C) infected with empty vector (Vec), wild-type Dnmt3a (3a) or catalytically dead Dnmt3a (3aCD). Lane 4 shows a Dnmt3b-deficient control (NC). PCNA and γ-tubulin are shown as loading controls. (d) Quantification of Dnmt3b protein levels in MYC;Dnmt3a Δ/Δ cell lines (A, B, C) for (c). Dnmt3b levels were normalized to PCNA. Relative protein levels were calculated by adjusting values for empty vector control (Vec) to one and using this as a baseline for all other comparisons. (e) qrt PCR analysis of Dnmt3a (left) and Dnmt3b (right) transcript levels in cell lines derived from MYC;Dnmt3a Δ/Δ tumors infected with empty vector control (black), wild-type Dnmt3a (red) or catalytically dead Dnmt3a (yellow). 77
90 Relative Protein Levels 78 d Dnmt3b Dnmt3b Vec 3a 3aCD 0 A B C MYC;Dnmt3aD/D; cell lines Supplementary Figure S13. Relative Dnmt3b protein levels in three cell lines after Dnmt3a expression. Quantification of Dnmt3b protein levels in MYC;Dnmt3a D/D cell lines (A, B, C) infected with empty vector (black), Dnmt3a (red) or catalytically dead Dnmt3a (3aCD). Dnmt3b levels were normalized to -Tubulin. Relative protein levels were calculated by adjusting values for empty vector control (Vec) to one and using this as a baseline for all other comparisons
91 79 Loss of Dnmt3b accelerates lymphomagenesis in Dnmt3a-deficient mice. We next hypothesized that upregulation of Dnmt3b may be an important molecular event inhibiting MTCL in the absence of Dnmt3a. To test this directly, we generated and compared the survival of MYC;Dnmt3a Δ/Δ ;Dnmt3b Δ/Δ (Double-knockout; DKO) mice with MYC;Dnmt3a F/F ;Dnmt3b F/F mice (Figure 7a). In contrast to the prolonged survival seen in MYC;Dnmt3a Δ/Δ mice, DKO mice displayed indistinguishable survival compared with MYC;Dnmt3a F/F ;Dnmt3b F/F control mice (Figure 7b). Both Dnmt3a and Dnmt3b were efficiently inactivated in DKO lymphomas (Figures 7c and d). Apoptosis, T- cell development, tumor burden, transgenic MYC expression and tumor spectrum were similar between terminally sick control and DKO mice (Supplementary Figures S14 19), indicating that the additional loss of Dnmt3b did not impact these processes. Interestingly, proliferation of lymphoma cells, a process impaired in MYC;Dnmt3a Δ/Δ mice, was similar between terminally sick control and DKO mice (Figure 7e), which is consistent with the decreased survival of DKO mice relative to Dnmt3a-deficient mice. The distinct roles of Dnmt3a and Dnmt3b in MTCL are consistent with molecular changes observed in Dnmt3a- or Dnmt3b-deficient lymphomas. Out of 370 promoters hypomethylated in MYC;Dnmt3a Δ/Δ lymphomas, only 3% were hypomethylated in Dnmt3b-deficient lymphomas (13), indicating that Dnmt3a and Dnmt3b have distinct targets in vivo (Figure 7f). Similarly, only 11% of genes upregulated in Dnmt3a-deficient lymphoma were also overexpressed in Dnmt3b-deficient lymphomas (Figure 7f (13)). Collectively, these data illustrate both cellular and molecular differences between Dnmt3a and Dnmt3b in MTCL.
 Kaplan Meier survival curve for MYC;Dnmt3a F/F ;Dnmt3b F/F (blue), MYC;Dnmt3a Δ/Δ ;MYC;Dnmt3b Δ/Δ (green) and MYC;Dnmt3a Δ/Δ (red, also shown in Figure 1b) mice.")
92 Figure 7. Loss of Dnmt3b accelerates lymphomagenesis in Dnmt3a-deficient mice. (a) Genetic setting used to delete conditional alleles of Dnmt3a and Dnmt3b. (b) Kaplan Meier survival curve for MYC;Dnmt3a F/F ;Dnmt3b F/F (blue), MYC;Dnmt3a Δ/Δ ;MYC;Dnmt3b Δ/Δ (green) and MYC;Dnmt3a Δ/Δ (red, also shown in Figure 1b) mice. Median survival (MS) and number of mice (n) is shown. (c) Immunoblot showing Dnmt3a and Dnmt3b expression in control tumors (MYC;Dnmt3a F/F ;Dnmt3b F/F ), Dnmt3a;Dnmt3b-deficient tumors (MYC;Dnmt3a Δ/Δ ;MYC;Dnmt3b Δ/Δ ) and a Dnmt3b-deficient control (b). γ-tubulin is shown as a loading control. (d) PCR-based deletion efficiency of Dnmt3a and Dnmt3b in MYC;Dnmt3a Δ/Δ ;Dnmt3b Δ/Δ tumors. Dnmt3a F/Δ and Dnmt3b F/Δ served as controls. F and Δ indicate floxed and knockout alleles, respectively. (e) Quantification of BrdU-positive cells isolated from final thymic tumors in MYC;Dnmt3a F/F ;Dnmt3b F/F (blue) and MYC;Dnmt3a Δ/Δ ;Dnmt3b Δ/Δ (green) mice. Error bars represent±s.e.m. Number of mice used for each comparison is shown inside the bars. (f) Venn diagrams displaying the overlap between genes hypomethylated (left) and overexpressed (right) in both Dnmt3b- and Dnmt3a-deficient tumors. The number of genes identified by methylation analysis usingmscc (fold change 2, FDR<0.05, Benjamini Hochberg) and expression analysis using microarray (fold change 1.5, P<0.05, Bayesian t -test) are shown. 80
 and MYC;Dnmt3a / ; Dnmt3b / (green) mice.")
93 Supplementary Figure S14. Representative Annexin V and BrdU staining in control and DKO thymocytes. Cells were isolated from the thymi of 21 day old, and final tumors in MYC;Dnmt3a +/+ ;Dnmt3b +/+ (blue) and MYC;Dnmt3a / ; Dnmt3b / (green) mice. Percent of cells staining positive is shown in the upper quadrant. 81
94 82 Supplementary Figure S15. Analysis of T-cell development in control and DKO mice. Top panel shows FACS analysis of T-cell development in CD4 neg CD8 neg (DN) thymocytes populations isolated from 21 day old MYC;Dnmt3a +/+ ;Dnmt3b +/+ (blue) and MYC;Dnmt3a / ;Dnmt3b / (green) mice. Immunophenotypes of DN populations in thymocytes are as follows: CD4 neg CD8 neg CD25 neg CD44 + (DN1), CD4 neg CD8 neg CD25 + CD44 + (DN2), CD4 neg CD8 neg CD25 + CD44 neg (DN3), and CD4 neg CD8 neg CD25 neg CD44 neg (DN4). Bottom panel shows quantification of CD4 and CD8 labeling in thymocytes. Number of mice (n) in each cohort is shown. Quantification of obtained results is shown as an average value with error bars representing ± SEM.
95 Supplementary Figure S16. Summary of tumor burden in control and DKO mice. Organs were isolated from MYC;Dnmt3a F/F ;Dnmt3b F/F (blue) and MYC;Dnmt3a / ;Dnmt3b / (green) terminally ill mice. Weights of thymus (TH), lymph node (Ln) and spleen (SP) were averaged and error bars represent ± SEM. Number of mice (n) used for each group is shown. 83
96 Supplementary Figure S17. MYC expression is similar between control and DKO tumors. qrt-pcr analysis of MYC levels in MYC;Dnmt3a F/F ;Dnmt3b F/F tumors (blue, n=4) and MYC;Dnmt3a / ;Dnmt3b / (green, n=3). Error bars denote ± SEM. 84
 and MYC;Dnmt3a / ;Dnmt3b / ( / ) mice.")
97 Supplementary Figure S18. Summary of tumor immunophenotypes in control and DKO mice. Immunophenotypes of tumors in MYC;Dnmt3a F/F ;Dnmt3b F/F (F/F) and MYC;Dnmt3a / ;Dnmt3b / ( / ) mice. Relative percentage of CD4+ and CD4+CD8+ malignancies is shown. 85
 and MYC;Dnmt3a /")
98 Supplementary Figure S19. Representative FACS analysis of T-cell lymphomas in control and DKO mice. Flow diagrams showing CD4 and CD8 staining in thymic tumors isolated from MYC;Dnmt3a F/F ;Dnmt3b F/F (blue) and MYC;Dnmt3a / ;Dnmt3b / (green) mice. 86
99 87 Discussion Since the discovery of DNMT3A mutations in myelodysplastic syndrome and acute myeloid leukemia (38, 39) a number of alterations in DNMT3A were found in other human hematologic malignancies, including T-cell leukemias and lymphomas (42, 106, 107). In both myeloid and lymphoid malignancies, mutations in DNMT3A primarily occur in the catalytic domain (38, 39, 42, 106, 107), suggesting that inactivation of the methyltransferase activity contributes to transformation. A recent biochemical analysis showed that the most common mutation, DNMT3A R882H, decreases methylase activity by ~80% at least partially by disrupting the ability of Dnmt3a to homotetramerize (47). Overexpression of mouse R878H mutant (analogous to human R882H) in embryonic stem cells decreased the activity of wild-type Dnmt3a and Dnmt3b likely by functioning as a dominant-negative and forming complexes with wild-type Dnmt3a and Dnmt3b (108). Ectopic expression of DNMT3A R882H in hematopoietic stem cells followed by transplantation into lethally irradiated mice induced a disease resembling chronic myelogenous leukemia within 1 year, demonstrating direct functional involvement of mutated DNMT3A in the development of myeloid leukemia. Here we used a mouse genetic model that allowed us to evaluate the effects of Dnmt3a inactivation along with MYC overexpression in all hematopoietic lineages. Although overexpression of MYC typically results in the development of TCLs, the development of acute myeloid leukemia in this model was reported in 13% of mice (111). We observed that Dnmt3a inactivation did not alter normal hematopoietic development, tumor spectrum or tumor type. Rather, Dnmt3a deficiency inhibited MTCL due to inhibitory effects on proliferation during disease progression and in tumor cells. Several interesting implications arise from these studies. For instance, Dnmt3a functions as both an oncogene and TS in the hematopoietic compartment. This finding is
100 88 surprising in view of our recent study that long-term loss of Dnmt3a in hematopoietic cells results in B-cell transformation and the development of chronic lymphocytic leukemia (CLL) in mice (34). Thus, the Dnmt3a locus harbors both oncogenic (promotion of MTCL due to its pro-proliferative function) and TS (prevention of CLL development) functions in the hematopoietic compartment. What is the molecular basis for such different activities in similar cell types? We speculate that the differences may stem from two biological functions of Dnmt3a, methylation-independent and methylation-dependent repressor activities, respectively. This concept is supported in the MTCL model by IPA of microarray data, which identified 17 genes under the category of Lymphomagenesis whose upregulation in Dnmt3a-deficient lymphomas was predicted to suppress lymphomagenesis. Importantly, whereas all of these genes were overexpressed in MYC;Dnmt3a Δ/Δ tumors, we have not observed changes in their promoters or gene body methylation. The lymphomagenesis signature consisted of genes whose TS functions were either reported in spontaneous B- and T-cell lymphomagenesis (Brca2, Dna2, Exo1, Prdm2, Smurf2 and Ssbp2 (99, )), p53-deficient or oncogene-provoked lymphomagenesis (Bcl2l11, E2f1, Xrcc2, Recql4 and Tyk2 ( )), including MTCL (Pten, E2f2 and Dnmt3b (13, 87, 123)), or other aspects of lymphomagenesis (Nqo1, Irf1 and Irf8 ( )). Whether upregulation of any of these genes is involved in MTCL in the absence of Dnmt3a remains to be seen; however, individual inactivation of E2f2 or Pten accelerated MTCL (87, 123). Furthermore, given that Xrcc2 deficiency accelerated lymphomagenesis induced by loss of p53 (120), and Brca2 deficiency results in the development of TCLs (99), other TS genes may be contributing to the extended survival of MYC;Dnmt3a Δ/Δ mice. In contrast to MTCL, loss of Dnmt3a induces CLL and is associated with widespread promoter hypomethylation in this context (34). In view of these data, coupled
101 89 with recently reported extensive promoter and gene body hypomethylation in human CLL (64), it seems that the basis for Dnmt3a TS function in CLL is its methyltransferase activity. Such a conclusion is further supported by the recent finding that the Tcl1 oncoprotein, whose overexpression induces CLL in mice, inhibits Dnmt3a catalytic activity, which likely contributes to disease development (65). An alternative possibility is that methylation-dependent and independent repressor activities of Dnmt3a have opposing roles in T- and B-cell transformation, but T-cells are differentially sensitive due to cell-type-specific differences. Dnmt3a was reported to function as a TS in lung cancer and as an oncogene in colorectal carcinoma (127, 128), further supporting that the role of Dnmt3a in tumorigenesis is highly complex and likely context specific. Here we show that Dnmt3a functions as an oncogene in MTCL, likely through the methylationindependent repression of TS genes. Another conclusion from our studies is that Dnmt3a and its close relative Dnmt3b have distinct functions in MTCL. We have recently reported that loss of Dnmt3b, unlike Dnmt3a, accelerated MTCL (13). Others have shown that Dnmt3b haploinsufficiency promoted MYC-induced B-cell lymphomagenesis (35), clearly demonstrating a TS role for Dnmt3b. It was reported that loss of Dnmt3a results in exhaustion of stem cell selfrenewal and defective differentiation (45). However, our data presented here and previously, point to a lack of differences of Dnmt3a or Dnmt3b deficiency on thymocyte development, likely due to different biological settings (13, 34). Thus, opposing roles of Dnmt3a and Dnmt3b on MTCL cannot be explained by changes in hematopoiesis. Rather, Dnmt3a and Dnmt3b seem to have contrasting effects on proliferation of TCLs, with Dnmt3a promoting and Dnmt3b inhibiting proliferation of tumor cells. Molecularly, the scope of tumor-specific changes in methylation and gene expression are larger for Dnmt3a compared with Dnmt3b. Consistent with the differential effects of these
102 90 enzymes on MTCL, out of the 17 genes in the Dnmt3a-specific Lymphomagenesis signature, only one gene (Bcl2l11) is upregulated in Dnmt3b-deficient MTCLs, further supporting the idea that at least some of these genes are responsible for the extended survival in MYC;Dnmt3a Δ/Δ mice. Whether these broader molecular effects of Dnmt3a in MTCL reflect different protein levels or qualitative differences in the functions of Dnmt3a and Dnmt3b remains to be seen. Importantly, we present genetic evidence that the oncogenic function of Dnmt3a is at least in part due to the negative regulation of the TS Dnmt3b. The lack of methylation changes in the promoter and gene body, coupled with the ability of both wild-type and a catalytically dead mutant of Dnmt3a to repress Dnmt3b in vitro, suggests that methylation-independent repressor activity is important for its oncogenic functions. We show that repression is likely relevant in vivo, as genetic inactivation of Dnmt3b accelerates MTCL. One critical question that remains to be answered is how the methylationindependent activity of Dnmt3a represses Dnmt3b. Dnmt3a interacts with a number of repressor proteins, including HDAC1, Rb and Daxx (16, 77, 129). Thus, recruitment of Dnmt3a to the Dnmt3b promoter could bring repressors that inhibit Dnmt3b transcription. Direct binding of Dnmt3a to sequences in the Dnmt3b promoter seems unlikely given that no clear Dnmt3a binding site has been identified, although weak consensus sequences were reported (19). Instead, interaction of Dnmt3a with transcription factors and subsequent recruitment to the Dnmt3b promoter seems more likely. Indeed, it was previously reported that the transcriptional repressor RP58 targeted Dnmt3a to a synthetic promoter to silence gene expression in a methylation-independent manner (16). Dnmt3a could also interfere with the ability of transcription factors to activate transcription. For example, p53-mediated transactivation of the CDKN1A gene was
103 91 suppressed by direct Dnmt3a interaction with p53 without changes in DNA methylation (18). Which protein mediates the potential recruitment of Dnmt3a to the Dnmt3b promoter is difficult to predict, given that Dnmt3a can interact with at least 68 transcription factors (19), including c-myc, Ets1, Gata1, Creb and NF-KappaB, all of which have predicted binding sites in the Dnmt3b promoter region. Thus, future studies need to address this point. It is also possible that rather than interacting with transcription factors, Dnmt3a interacts with histone-modifying enzymes to induce repressive histone modifications. For examples, the N terminal of Dnmt3a interacts with the histone methyltransferase SETDB1 to form a complex, which binds at a synthetic promoter region, and methylation of H3-K9 histones, but not of DNA, results in promoter inactivation (130). Finally, Dnmt3a was shown to directly interact with chromatin-remodeling factor Brg1, a subunit of the SWI/SNF complex that has a role in both activation and repression of gene transcription (17). Thus, this interaction could induce nucleosomal rearrangement in the Dnmt3b promoter that would inhibit gene transcription in a DNA methylation-independent manner. Whatever the precise mechanism of Dnmt3a-mediated repression is, the unexpected role of Dnmt3a in MTCL raises the possibility that some of the mutations in DNMT3A located outside of the methyltransferase domain may enhance biological processes contributing to methylation-independent repression. To our knowledge, this is the first report highlighting the distinct but interconnected roles of Dnmt3a and Dnmt3b in cancer through methylation-independent repressor activity of Dnmt3a.
104 92 CHAPTER 3: Tumor suppressor functions of Dnmt3a and Dnmt3b in the prevention of malignant mouse lymphopoiesis 3 Introduction DNA methyltransferases 3a (DNMT3A) and 3b (DNMT3B) are enzymes catalyzing the formation of methylcytosine in mammalian genomic DNA. Mutations in the coding sequence of DNMT3A are frequently found in human myeloid and lymphoid malignancies (131, 132). Allelic losses were recently reported in 48% of non-hodgkin lymphomas (131). Long-term DNMT3A inactivation in mice impaired differentiation of hematopoietic stem cells (HSCs), resulting in accumulation of undifferentiated cells (45). Such findings indicate that DNMT3A loss may promote tumorigenesis in multiple hematopoietic lineages. Unlike DNMT3A, DNMT3B is rarely mutated in human hematologic malignancies. However, transcription of aberrant isoforms (for example, DNMT3B7) acting as negative regulators of Dnmt3b activity has been reported (133). Consistently, DNMT3B7 overexpression accelerated MYC-induced B-cell lymphomas (133). Importantly, we and others have identified a tumor suppressor function for Dnmt3b in mouse T- and B-cell lymphomagenesis (13, 35). 3 The material presented in this chapter were previously published: Peters SL, Hlady RA, Opavska J, Klinkebiel D, Pirruccello SJ, Talmon GA, et al. Tumor suppressor functions of Dnmt3a and Dnmt3b in the prevention of malignant mouse lymphopoiesis. Leukemia. 2014;28(5):
105 93 Methods Mouse Studies: EμSRα-tTA, Dnmt3a 2loxP, and Dnmt3b 2LoxP mice were obtained from, D.W. Felsher (Stanford University, Stanford, California, USA) R. Jaenisch (Whitehead Institute, Cambridge, Massachusetts, USA), and E. Li, (Novartis Institutes for Biomedical Research, Cambridge, Massachusetts, USA), respectively. ROSA26 EGFP (79) and Teto-Cre mice (80) were acquired from The Jackson Laboratory. Mice were back-crossed onto the FVB/NJ background for five generations. Transgenic mice used for these experiments were obtained by standard genetic crosses and genotypes were confirmed by PCR-based genotyping using gdna from tails (13, 134). Mice were carefully monitored for signs of tumor formation and harvested when terminally ill. Western Blot: Western blots were performed using the following antibodies: Dnmt3a (H-295, Santa Cruz), γ-tubulin (H-183, Santa Cruz). Protein lysates were separated in SDS acrylamide gels and blotted into Immobilon P membranes (Millipore). Blots were incubated in blocking buffer (5% skim milk) at a concentration of 1 mg/ml. The primary antibody was then detected using horseradish-peroxidase-conjugated secondary antibodies and the ECL reagent as described by the manufacturer (Pierce). FACS analysis: All antibodies were obtained from ebioscience with the exception of Ig kappa and Ig lambda (Southern Biotech). Cell counts were performed using Count Bright Absolute Counting Beads (Invitrogen). Flow cytometry was performed using the LSR II (BD Biosciences) and analyzed using BD FACSDiva (BD Biosciences). Identification of fetal liver HCSs was performed using lineage markers against B220, CD3, CD5, CD8, Gr-1 and Ter119, followed by subsequent gating for Thy1.1 lo,sca-1+,cd11b+ cells. 5 For experiments in mouse bone marrow lineage cocktails included antibodies against CD4, CD8, CD11b, B220, CD3, and TER119 to
106 94 define lineage positive populations. Sorting of the following population was accomplished used the FACS Aria: LSK cells (Lineage negative, Sca-1+,c-kit+), Pre-Pro B-cells (CD43+, CD25-, IgM-, B220+), immature B-cells (CD43+, CD25-, IgM-, B220+), mature B-cells (CD43-, CD25-, IgM+, B220+), B-cells (B220+), CD11b cells (CD11b+), Ter119 cells (Ter119+), CD4 cells (CD4+), CD8 cells (CD8+). For methylation analysis, control B1 cells from 2 Dnmt3a +/+ mice were isolated by FACs sorting using B220, CD19 and CD5 antibodies. Histology: H&E staining was performed using standard protocols by the University of Nebraska Medical Center Tissue Science Facility. Methyl-sensitive Cut Counting (MSCC) and data analysis: MSCC was performed as previously described (13, 81). Briefly, two independent enzymes, HpaII and HpyCh4IV, were used to assess the methylation landscapes. Next generation sequencing results in an output of tags where a higher number of counts correlate with hypomethylation and lower counts indicate hypermethylation. The R programming language bioconductor package edger was used for all statistical analysis (83, 112). Genes were only considered to by hypomethylated or hypermethylated if two or more independent HpaII/HpyCh4IV sites showed a 2-fold change or greater with a false discovery rate <0.05. The methylation heat map was generated by taking the averages for raw counts of all 2-fold or greater statistically significant changes within individual promoters between Dnmta3a +/+ B1 cells and Dnmt3a -/- tumors. The promoter is defined as to +500 base pairs relative to the transcription start site. Analysis of Sine and Line elements in was performed as previously described. 3 In brief, MSCC tags associated with SINE and LINE elements were identified using a perl script (UNMC Center for Bioinformatics and Systems Biology and the Institute for System Biology [ mm9, July 2007, RepeatMasker, 3.2.8,
107 95 Repeat Library ]). The total number of tags specific to gene body (defined as 500 base pairs from transcription start site to the 3 end) or repeat elements obtained from next generation sequencing of MSCC libraries were summed. Average counts for control Dnmt3a +/+ B1 samples were used for normalization. As the number of MSCC tags inversely correlates with methylation levels the inverse values represent relative methylation levels. MSCC data is available upon request. Combined Bisulfite Restriction Analysis (COBRA): COBRA analysis was performed as previously described. 3,6 Briefly, sodium bisulfite treatment of genomic DNA was carried out utilizing an EpiTect bisulfite kit (Qiagen). Primers for bisulfite PCR for both COBRA and bisulfite sequencing were designed through the use of MethPrimer (86). For COBRA, bisulfite PCR products were digested with TaqI, TaiI, or BstuI (NEB). The resulting fragments were then loaded onto an 8% PAGE gel, separated by electrophoresis, and detected with SYBR green Gold (Invitrogen). Primer sequences for promoter analysis are listed below: Hus1b: TTTTTTTATTAAAAGATTTGGAGTTTG (forward), AAAAAACACATTCATAACTTACTTTATCTC (reverse) Nfam1: GAAAAGGGTTAAAAGAAATTTTAGTTT (forward), CCCAATAAATAACTTATCACCTACAA (reverse) Quantitative Real-Time RT-PCR: cdna was prepared from RNA using Bio-Rad iscript according to the manufacturer's protocol. cdna was combined with SYBR green Supermix (Bio-Rad) with a final volume of 20 μl, and experiments were done in duplicate. Reaction conditions were optimized by the use of standard curves for each primer pair. Thermocycling was performed using a CFX96 system (Bio-Rad). Threshold cycle (CT) values were normalized based upon the expression of Gapdh. Primer sequences used in these experiments are as follows: Hus1b: GCAAACCTCAATGGCAGAAT (forward), AAGGCCATTGTGGGGTTTAT (reverse)
108 96 Nfam1: GACGGAGGTCTACGCCTGTA (forward), CAAGTCTCGGAGCCTGTAGAA (reverse) Results To determine the impact of Dnmt3a on malignant hematopoiesis we utilized an EμSRα-tTA;Teto-Cre;Rosa26LOXP EGFP/EGFP tri-transgenic system (Figure 1a). In this system, the enhanced green fluorescent protein (EGFP) reporter is activated by Cremediated excision of a transcriptional STOP cassette allowing for monitoring of tta- and Cre-expressing cells by fluorescence activated cell sorting (FACS). Using this system we detected EGFP in HSCs (Lineage Thy1.1 lo,sca-1+,cd11b+) in fetal liver cells from E15.5 embryos (Supplementary Figure 1a). Importantly, EGFP was expressed in bone marrow-derived LSK cells (Lineage neg,sca-1+,c-kit+), a population enriched in hematopoietic cells and early progenitors (Supplementary Figure 1b and c). EGFP was also detected in 30 50% of hematopoietic lineages in the spleen and thymus (Supplementary Figure 1d). Altogether, these data suggest that EμSRα-tTA drives expression of Teto-Cre in both embryonic and adult stem and progenitor cells and thus in connection with a conditional knockout allele is capable of generating hematopoietic lineages deficient for the gene of interest. Using this system along with a conditional allele of DNMT3A (Dnmt3a F (134) we generated EμSRα-tTA;Teto-Cre;Rosa26LOXP EGFP/EGFP ;Dnmt3a +/+ (Dnmt3a +/+ ) and EμSRα-tTA;Teto-Cre;Rosa26LOXP EGFP/EGFP ;Dnmt3a F/F mice (Dnmt3a / ). No significant difference in EGFP expression in LSK cells or hematopoietic lineages was observed among 21-day-old Dnmt3a +/+ and Dnmt3a / mice (Figure 1b and Supplementary Figure 1b and c). Similarly, short-term loss of Dnmt3a had no impact on marker expression or cell numbers (Supplementary Table S1 and Supplementary Figure 2) despite efficient deletion of Dnmt3a in EGFP-positive LSK cells as well as lymphoid, myeloid and
109 97 erythroid cells from Dnmt3a / mice (Figure 1c). However, whereas control Dnmt3a +/+ mice remained healthy over 500 days, 100% of Dnmt3a / mice died, with a median survival of 371 days (Figure 1d). Terminally ill mice were lethargic and had enlarged abdomens due to splenomegaly (Figures 1e and f). Dnmt3a was efficiently deleted in splenic cells of terminally ill mice (Figure 1g and Supplementary Figure 3). Analysis of spleens from 10 terminally ill mice showed that splenomegaly was largely caused by expansion of EGFP+ mature B1 B cells. Cells expressed the surface markers B220, CD5, CD19, CD43, CD11b and immunoglobulin light chain kappa or lambda (Figures 1h and i, and Supplementary Table 1). These cells were also present in the peripheral blood, bone marrow and, occasionally, liver (Figure 1h and data not shown). Consistently, sections of the spleen showed diffuse involvement by a monomorphic population of small neoplastic lymphocytes, similar in size to resting lymphocytes (Supplementary Figure 4). The tumor cell nuclei had slightly irregular borders with clumped chromatin and indistinct nucleoli, morphologically similar to the cells of small lymphocytic lymphoma/chronic lymphocytic leukemia (CLL). Two of the B1 populations expressed only immunoglobulin lambda light chain, whereas the remaining eight expressed purely kappa light chain, indicating that the B-cell expansions are most likely clonal (Figure 1i). Sequencing analysis from two independent tumors showed identical rearrangement of V H alleles, further indicating clonal B-cell expansions (not shown). Upon intraperitoneal injection into FVB mice, splenic cells from terminally ill Dnmt3a / mice induced a phenotypically indistinguishable disease from donor mice over the course of 3 months, suggesting that Dnmt3a / cells have tumorigenic potential (Supplementary Figure 5a-c). Similarly, splenic cells from primary transplants induced disease in secondary FVB recipients, and the process could be successfully repeated at least five times, suggesting a long-term capability of these cells to self-renew and induce disease (Figure 1j and not shown). Altogether, our data indicate that, although loss of
110 98 Dnmt3a is insufficient to immediately induce cellular transformation of hematopoietic cells, long-term Dnmt3a deficiency results in the development of a B-cell malignancy. The obvious disease parallel in humans to the phenotype observed in the Dnmt3a / mouse model is CLL, which is the most common type of chronic leukemia in adults in the Western hemisphere. Owing to Dnmt3a s role as a methyltransferase, we performed genome-wide methylation profiling in mouse CLL of HpaII and HpyCh4IV sites using methyl-sensitive cut counting, as described previously (13, 33). Comparison of Dnmt3a / CLL samples with B220+, CD19+, CD5+ splenocytes isolated from control Dnmt3a +/+ mice revealed promoter hypomethylation in 428 and hypermethylation in 37 genes (Figure 1k). Combined bisulfite restriction analysis (COBRA) confirmed promoter hypomethylation of two randomly selected genes (Nfam1 and Hus1b) in CLL that was accompanied by upregulation of gene expression (Figures 1l and m). In addition to promoter hypomethylation, we observed an ~20% decrease in overall gene body methylation, as well as hypomethylation of repetitive elements (Supplementary Figures 6a and b). Altogether these data suggest that inactivation of Dnmt3a results in profound methylation changes manifested mainly by hypomethylation, similar to that observed in human CLL, which effects expression in at least some genes. The effect of aberrant methylation on global transcription in CLL remains to be seen.
 EGFP expression as determined by FACS analysis of cells isolated from bone marrow, spleen, lymph node, thymus and blood of Dnmt3a +/+ (blue, n=5) and Dnmt3a / (red, n=4) 21-day-old mice.")
 PCR-based genotyping of DNA isolated from unsorted (U) or FACS-sorted EGFP-positive (+) and EGFPnegative ( ) populations of cells obtained from the bone marrow (BM), spleen (Sp) and")

, Pre-Pro B-cells (CD43+, CD25, IgM, B220+), immature B-cells (CD43+, CD25, IgM, B220+),")
 and knockout (KO) alleles are shown. Dnmt3a /+ and Dnmt3a F/F genomic DNA served as a control.")
111 Figure 1. Loss of Dnmt3a induces CLL in mice. (a) The genetic setting for deleting a conditional allele of Dnmt3a. (b) EGFP expression as determined by FACS analysis of cells isolated from bone marrow, spleen, lymph node, thymus and blood of Dnmt3a +/+ (blue, n=5) and Dnmt3a / (red, n=4) 21-day-old mice. Data were analyzed by Student s t-test and are presented as average percentages with error bars representing±s.e.m. (c) PCR-based genotyping of DNA isolated from unsorted (U) or FACS-sorted EGFP-positive (+) and EGFPnegative ( ) populations of cells obtained from the bone marrow (BM), spleen (Sp) and thymus (Th) of 6-week-old Dnmt3a / mouse. PCR reactions were perfomed on samples in the following order: U BM, +LSK BM, LSK BM, U Sp, +Sp Pre-Pro B-cells, +Sp immature B- cells, +Sp mature B-cells, Sp B-cells, +Sp CD11b, Sp CD11b, +SP Ter119, Sp Ter119, U Th, +Th CD4, Th CD4, +Th CD8, Th CD8. Immunophenotypes of sorted populations are as follows: LSK cells (Lineage negative, Sca-1+, c-kit+), Pre-Pro B-cells (CD43+, CD25, IgM, B220+), immature B-cells (CD43+, CD25, IgM, B220+), mature B-cells (CD43, CD25, IgM+, B220+), B-cells (B220+), CD11b cells (CD11b+), Ter119 cells (Ter119+), CD4 cells (CD4+), CD8 cells (CD8+). Fragments from floxed (F) and knockout (KO) alleles are shown. Dnmt3a /+ and Dnmt3a F/F genomic DNA served as a control. (d) Kaplan Meier survival curves for Dnmt3a +/+ (black line) and Dnmt3a / (red line) mice. Median survival (MS), number of mice (n) and P-value (log-rank test) are indicated. (e) Representative spleens and average weight (f) of age-matched Dnmt3a +/+ (black) and Dnmt3a / (red) mice at 21 days (21 d), 250 days (250 d) and at the terminally ill stage of disease (final). * denotes P<0.05. (g) Dnmt3a expression in spleens of Dnmt3a +/+ and Dnmt3a / mice as determined by immunoblot using anti-dnmt3a antibody. γ-tubulin serves as a loading control. 99
 Expression of CD5 and B220 markers as determined by FACS analysis in indicated tissues isolated from Dnmt3a +/+ mice (top panels) and terminally ill Dnmt3a / mice (bottom panels).")
 The time to CLL development for primary (1), secondary (2) and tertiary (3) serially transplanted FVB-recipient mice injected with Dnmt3a / CLL cells.")
 A heatmap displaying 428 hypomethylated and 37 hypermethylated promoters in Dnmt3a / CLL samples (n=3) relative to control B1 cells (n=2) as determined by analysis of MSCC data (FDR<0.05, edger).")

112 Figure 1 cont. Loss of Dnmt3a induces CLL in mice. (h) Expression of CD5 and B220 markers as determined by FACS analysis in indicated tissues isolated from Dnmt3a +/+ mice (top panels) and terminally ill Dnmt3a / mice (bottom panels). (i) Expression of lambda and kappa light chains in selected CLL cases. (j) The time to CLL development for primary (1), secondary (2) and tertiary (3) serially transplanted FVB-recipient mice injected with Dnmt3a / CLL cells. Data are presented as average time to tumor development and were derived from three independent Dnmt3a / CLL samples. The number of mice (n) is shown. Error bars represent ±s.e.m. (P<0.05). (k) A heatmap displaying 428 hypomethylated and 37 hypermethylated promoters in Dnmt3a / CLL samples (n=3) relative to control B1 cells (n=2) as determined by analysis of MSCC data (FDR<0.05, edger). A color bar is shown with blue representing a high degree of methylation and yellow representing lower levels. B1 indicates control B220+,CD19+ and CD5+ splenocytes isolated from Dnmt3a +/+ mice, whereas CLL denotes Dnmt3a / tumors. (l) COBRA analysis of the Nfam1 and Hus1b promoters using gdna The percentage of positive cells for representative samples is indicated within the FACS quadrants isolated from splenic Dnmt3a +/+ B1 cells and Dnmt3a / CLL samples. PCR fragments were digested with restriction enzyme TaqI. Undigested {U} and digested {D} fragments correspond to unmethylated and methylated DNA, respectively. CpG indicates a fully methylated control. (m) qrt-pcr analysis of Nfam1 and Hus1b expression in splenic Dnmt3a +/+ B1 and Dnmt3a / CLL samples. Error bars represent ±s.e.m., P<0.05 (*). 100
113 Figure S1. Analysis of EGFP and cell surface marker expression in Dnmt3a +/+ and Dnmt3a -/- mice. (a) FACS analysis of EGFP expression in fetal liver cells isolated from 15.5 day embryos with indicated genotypes. EGFP-positive cells were further analyzed for expression of B220, CD3, CD5, CD8, Gr-1, Ter119 lineage markers to define lineage-positive cells. Lineage-negative cells were analyzed for expression of Thy1.1, CD11b and Sca-1. Lineage-negative, Thy1.1 lo, CD11b +, Sca-1 + represent fetal liver HSCs. The percentage of positive cells is indicated in the FACS diagrams. (b) Representative FACS analysis of EGFP+ LSK cells in the bone marrow of 21days old Dnmt3a +/+ and Dnmt3a -/- mice. Representative FACS diagrams show percentage of EGFP+ LSK cells identified as Lineagenegative,Sca1 +,c-kit +. Lineage-negative populations were identified by CD4, CD8, CD11b, B220, CD3, TER119 lineage marker expression. (c) Total percentage of EGFP+ LSK cells in the bone marrow of 21 days old Dnmt3a +/+ (n=4) and Dnmt3a -/- (n=5) mice. Error bars represent the SEM. (d) Representative FACS diagrams showing expression of EGFP, Ter119, B220, CD11b, CD4 and CD8 in spleens (SP) and thymi (Th) of Dnmt3a +/+ mice. 101
, Dnmt3a -/- (red) Dnmt3a -/- ;Dnmt3b -/- (green) spleens and bone")
114 Figure S2. Cellularity of Dnmt3a and Dnmt3a/Dnmt3b knockout mice. The average cell counts of aged-matched Dnmt3a +/+ (black), Dnmt3a -/- (red) Dnmt3a -/- ;Dnmt3b -/- (green) spleens and bone marrow at age 21 days (21d). Error bars represent the SEM. 102

115 Figure S3. Deletion efficiency of Dnmt3a conditional knockout allele in Dnmt3a -/- tumors. PCR-based analysis of deletion efficiency of the Dnmt3a conditional knockout allele in DNA from splenic cells isolated from Dnmt3a -/- mice with CLL. Fragments derived from floxed (F) and knockout (KO) alleles are shown. Dnmt3a F/F genomic DNA served as a control. 103
 and red pulp (short arrow) are indicated (H&E 100x). (b) Dnmt3a -/- tumors showing diffuse effacement of the splenic architecture with expansion of the white pulp (H&E 100x).")
116 Figure S4. Histological analysis of Dnmt3a -/- splenic tumors. (a) A spleen from a Dnmt3a +/+ mouse with normal architecture. White pulp (long arrow) and red pulp (short arrow) are indicated (H&E 100x). (b) Dnmt3a -/- tumors showing diffuse effacement of the splenic architecture with expansion of the white pulp (H&E 100x). (c) Dnmt3a -/- tumor showing neoplastic cell populations (long arrow), resting lymphocytes (short arrow) and prolymphocytes (block arrow) (H&E 400x). 104
117 Figure S5. Dnmt3a -/- splenic tumor cells induce splenomegaly and CLL disease in recipient mice. (a) A picture showing spleens from a Dnmt3a +/+ control and a Dnmt3a -/- recipient at 90 days post intraperitoneal injection. (b) A bar graph representing the average spleen weight in grams from Dnmt3a +/+ controls and Dnmt3a -/- recipients at 90 day post i.p. injection. n denotes the number of mice. Error bars represent the SEM. (c) A representative flow diagram depicting B220 and CD5 expression in splenic tumor cells from Dnmt3a -/- recipient at 90 day post i.p. injection. 105
 A picture showing spleens from a Dnmt3a +/+ control and a Dnmt3a -/- recipient at 90 days post intraperitoneal injection.")
118 106 Figure S5. Dnmt3a -/- splenic tumor cells induce splenomegaly and CLL disease in recipient mice. (a) A picture showing spleens from a Dnmt3a +/+ control and a Dnmt3a -/- recipient at 90 days post intraperitoneal injection. (b) A bar graph representing the average spleen weight in grams from Dnmt3a +/+ controls and Dnmt3a -/- recipients at 90 day post i.p. injection. n denotes the number of mice. Error bars represent the SEM. (c) A representative flow diagram depicting B220 and CD5 expression in splenic tumor cells from Dnmt3a -/- recipient at 90 day post i.p. injection. Figure S6. Methylation analysis of gene bodies and repetitive elements. Bar graphs depicting in silico analysis of relative methylation of gene body, Line/L1, Line/L2, and Sine/Alu repeats in Dnmt3a +/+ B1 cells and Dnmt3a -/- tumors (CLL) as determined by MSCC. The total number of tags obtained from next generation sequencing of MSCC libraries (HpaII and HpyCh4IV) generated from Dnmt3a +/+ B1 cells (n=2) and Dnmt3a -/- CLL samples (n=3) specific to gene body (defined as +500 base pairs from transcription start site to the end of the gene) or repeat elements were summed. Averages of B1 tags were used for normalization of the data. As the number of MSCC tags inversely correlates with methylation levels the inverse values represent relative methylation levels. Error bars represent ± SEM (* denotes P<0.05).
119 107 Loss of Dnmt3b accelerates CLL development in Dnmt3a / mice. In our previous studies, we have not observed any hematopoietic defects associated with long-term Dnmt3b deficiency (Figure 2a (13)). To determine whether loss of Dnmt3b affects CLL development in Dnmt3a / mice, we generated and monitored a cohort of EμSRα-tTA;Teto-Cre;Rosa26LOXP EGFP/EGFP ;Dnmt3a F/F ;Dnmt3b F/F mice (Dnmt3a / ;Dnmt3b /, Supplementary Figure 7). The median survival of these mice (322 days) was significantly decreased relative to Dnmt3a / mice (371 days) (Figure 2a). Consistent with decreased survival, 10-month-old Dnmt3a / ;Dnmt3b / mice had more profound splenomegaly than Dnmt3a / mice, unlike 21-day-old mice that had no difference in spleen sizes, cell counts or marker expression (Figures 2b and c, Supplementary Figure 1 and Supplementary Table S1). Both Dnmt3a and Dnmt3b were efficiently deleted, as demonstrated by PCR-based genotyping (Figure 2d). Five out of eight analyzed Dnmt3a / ;Dnmt3b / mice developed a CLL disease immunophenotypically identical to that observed in Dnmt3a / mice (Figures 2e and f and Supplementary Table S1). Importantly, the remaining three Dnmt3a / ;Dnmt3b / mice developed CD8+, CD3+ and TCRβ+ T-cell malignancies (Figures 2e and f) that were also serially transplantable (not shown). Altogether, these data indicate that, in the absence of Dnmt3a, Dnmt3b functions as a tumor suppressor in CLL and T-cell malignancies.
 Kaplan Meier survival curves for Dnmt3a / mice (red line) and Dnmt3a / ; Dnmt3b / mice (blue line).")

 The average weight of age-matched Dnmt3a +/+ (black), Dnmt3a / (red) Dnmt3a / ;Dnmt3b / (green) mice at 21 days (21 d) and 10")
 Deletion efficiency of conditional Dnmt3a F and Dnmt3b F knockout alleles as determined by PCR-based genotyping.")
120 Figure 2. Loss of Dnmt3b accelerates tumor development in Dnmt3a / mice and alters the disease spectrum. (a) Kaplan Meier survival curves for Dnmt3a / mice (red line) and Dnmt3a / ; Dnmt3b / mice (blue line). Median survival (MS), number of mice (n) and P-value (log-rank test) are indicated. The red line denoting Dnmt3a / mice is the same used in Figure 1d. (b) Representative spleen images from Dnmt3a +/+ ;Dnmt3b +/+, Dnmt3a / and Dnmt3a / ;Dnmt3b / mice at 10 months. (c) The average weight of age-matched Dnmt3a +/+ (black), Dnmt3a / (red) Dnmt3a / ;Dnmt3b / (green) mice at 21 days (21 d) and 10 months (10 mo). * denotes P<0.05. n denotes the number of mice. (d) Deletion efficiency of conditional Dnmt3a F and Dnmt3b F knockout alleles as determined by PCR-based genotyping. Dnmt3a F/F and Dnmt3b F/F served as controls. (e) Representative flow cytometric profiles of surface marker expression for B- and T-cell malignancies from Dnmt3a / ;Dnmt3b / mice. (f) Graphical presentation of the percentage of T- and B-cell malignanies in Dnmt3a / and Dnmt3a / ;Dnmt3b / mice. 108

121 Figure S7. Schematic representation of the genetic setting to delete conditional alleles of Dnmt3a and Dnmt3b in hematopoietic system. 109
122 110 Discussion Our data suggest that lymphoid cells are more sensitive to Dnmt3a and Dnmt3b levels than are myeloid cells, perhaps because deregulation of cytosine methylation has a higher transformation potential in B- and T-cells. Indeed, genome-wide studies identified a higher number of differentially methylated regions during the development of lymphoid relative to myeloid lineages (135). As a result, their deregulation may preferentially promote transformation of lymphoid cells. Tumor suppressor functions of Dnmt3a and Dnmt3b in the prevention of mouse CLL are consistent with observations that both genes are in the top 1% of underexpressed genes, as determined by global gene expression profiling of 448 human CLL samples (63). Consistent with low Dnmt3a and Dnmt3b expression in CLL, recent genome-wide bisulfite sequencing of human CLL samples revealed a massive decrease in CpG methylation relative to normal control samples, suggesting that hypomethylation may play a role in the pathogenesis of CLL (64). A recent study also showed that the Tcl1 protein, whose transgenic overexpression induces CLL in Eμ-TCL1 mice, functions as an inhibitor of DNA methyltransferases Dnmt3a and Dnmt3b, resulting in hypomethylation in the early stages of CLL (65). These studies, along with our demonstration that loss of Dnmt3a alone or with Dnmt3b is sufficient to induce CLL in mice, which is characterized by large-scale genome-wide hypomethylation, suggest that CLL to a large extent is an epigenetic disease. Further functional studies will need to be perfomed to identify epigenetic drivers involved in the pathogenesis of CLL. Interestingly, we have not observed the development of myeloid malignancies in this model, despite the fact that Dnmt3a and Dnmt3b are conditionally ablated in all hematopoietic lineages and that Dnmt3a mutations are most common in the myeloid compartment (39). The preferential presence of Dnmt3a mutations in human acute
123 111 myeloid leukemia may reflect a necessity for tight collaboration with NPM1, FLT3 and IDH1 genes, which are co-mutated with Dnmt3a (136). Alternatively, such mutations in Dnmt3a may result not only in inactivation of methyltransferase activity but possibly also in gain of function. In studies performed by Challen et al. (45), a critical role for Dnmt3a in the differentiation of HSCs was observed utilizing Mx1-Cre-mediated excision of Dnmt3a. Although some bias toward B-cell differentiation was observed in Dnmt3a / cells, no tumor development was reported. Although the genetic settings in both studies are similar in the sense that Cre-mediated excision is achieved in HSCs/early progenitors, several differences may explain the development of CLL in EμSRα-tTA;Teto-Cre; Rosa26LOXP EGFP/EGFP ; Dnmt3a F/F mice but not in Mx1-Cre;Dnmt3a F/F mice. First, we used FVB rather than C57BL/6 mice to inactivate Dnmt3a. As mouse strains differ in levels of gene expression, the Dnmt3a phenotypes may be strain specific. Second, we utilized a conditional Dnmt3a knockout allele targeting exons (134) rather than exon 19 (137). Although in principle Cre-mediated excision of both alleles results in inactivation of Dnmt3a, we cannot rule out the possibility of allele-specific effects. Other differences may come from different experimental approaches for example, use of primary Dnmt3a / mice versus recipients receiving Dnmt3a / cells in adoptive transfer experiments, length of observational period, etc. Despite differences in our studies, for the first time we provide evidence that Dnmt3a and Dnmt3b function as tumor suppressor genes in the prevention of lymphoid malignancies in mice. Thus, this mouse model will be a particularly useful tool for studying the acquired epimutations that functionally contribute to CLL development.
124 112 CHAPTER 4: Promoter hypomethylation and expression is conserved in mouse chronic lymphocytic leukemia induced by decreased or inactivated Dnmt3a Introduction DNA methyltransferase 3a (Dnmt3a) is an enzyme important for the generation and maintenance of 5-methyl-cytosine in mammalian genomic DNA. The methylation of gene promoters is typically associated with gene repression and plays an important role in silencing of endogenous retroviral elements, X-chromosome inactivation, imprinting and differentiation. In particular, cytosine methylation plays a critical role in hematopoiesis and its deregulation contributes to hematologic malignancies (138). This is highlighted by the presence of mutations in the DNMT3A gene in a wide variety of human hematologic malignancies of myeloid and T cell origin (138). Although the precise biological and molecular functions by which DNMT3A prevents cellular transformation are poorly understood, functional studies in mice have begun to uncover the role of Dnmt3a in hematopoiesis. Long-term Dnmt3a deficiency inhibits the ability of hematopoietic stem cells (HSCs) to differentiate into hematopoietic lineages, promoting the development of various hematologic malignancies, including myelodysplastic syndrome, acute myeloid leukemia, and acute lymphoblastic leukemia of T and B cell origin (37, 45, 139). Introduction of genetic alterations found in hematologic malignancies into a Dnmt3a deficient background often results in enhanced phenotypes. For example, Dnmt3a deficiency in combination with c-kit overexpression induces acute T and B cell leukemia (36), and when associated with Kras G12D/+ promotes progression of juvenile and chronic myelomonocytic leukemia (140). Given the multiple genome-wide activities associated with Dnmt3a, such as de novo methylation (5), maintenance methylation (14), and methylation-independent repression (17), it is not surprising that
125 113 under some circumstances Dnmt3a may promote the development of hematologic malignancies. For example, upregulation of Dnmt3a promotes AML/ETO induced leukemia through de novo hypermethylation (141) and methylation-independent repressor function enhances T cell lymphomagenesis (12). Such studies highlight the importance of context-dependent activities of Dnmt3a in hematologic malignancies. DNMT3A mutations in human hematologic malignancies are usually heterozygous and most commonly occur at amino acid 882. DNMT3A R882H mutants show both decreased methyltransferase activity (47) and dominant negative functions as its overexpression results in hypomethylation (108). Therefore, a partial, rather than complete inactivation of DNMT3A is likely more relevant in the pathogenesis of human hematologic malignancies. The effects of decreased levels of Dnmt3a in prevention of hematologic malignancies, however, are poorly understood. We have previously utilized EμSRα-tTA;Teto-Cre;Dnmt3a fl/fl ;Rosa26 LOXP EGFP/EGFP quadruple transgenic mice (designated here as Dnmt3a Δ/Δ mice) to conditionally inactivate Dnmt3a in hematopoietic stem cells and hematopoietic lineages (34). Surprisingly, all Dnmt3a Δ/Δ mice developed disease similar to chronic lymphocytic leukemia (CLL) with a median survival of 371 days characterized by an expansion of EGFP+ mature B220+CD19+CD5+ B cells (B-1a cells) in hematopoietic organs. Here we asked whether Dnmt3a haploinsufficiency can result in the development of a CLL-like disease or other hematologic malignancies by observing Dnmt3a +/- mice. We show that whereas a decrease in Dnmt3a levels is insufficient to immediately induce cellular transformation of hematopoietic cells, long-term Dnmt3a decrease results in the development of a CLL-like disease in 65% of mice and myeloproliferative disease in 15% of mice within 16 months. Whole-genome bisulfite sequencing (WGBS) and RNAseq revealed that a significant cohort of methylation and expression changes were
126 114 conserved in Dnmt3a +/- and Dnmt3a Δ/Δ CLL. Ingenuity Pathway Analysis (IPA) analysis revealed a signature of putative oncogenes that may drive CLL development. Altogether, our data demonstrate that a small reduction of Dnmt3a levels has profound phenotypic consequence on both cellular and molecular levels, identifying Dnmt3a as a critical gene preventing B-1a cell transformation. Methods Mouse Studies: All mice used in these studies were of the FVB/N background and were generated using standard genetic crosses. To obtain mice with a germline transmission of the Dnmt3a - allele, we crossed EμSRα-tTA;Teto-Cre;Dnmt3a fl/fl mice with FVB mice, taking advantage of our observation that the EμSRα-tTA transgene is expressed in germ cells (data not shown). To generate Dnmt3a +/- we subsequently bread out transgenes by crossing obtained mice with FVB mice). PCR-based genotyping of genomic DNA isolated from the tails was used to confirm genotypes. Mice were harvested at the experimental end point of 16 months. Transgenic mice used in these studies were obtained from the following laboratories: EμSRα-tTA (D.W. Felsher at Standford University), Dnmt3a 2loxP (R. Jaenisch at the Whitehead Institute), ROSA26EGFP and Teto-Cre (The Jackson Laboratory). Transplantation studies were carried out by injecting splenic cells isolated from 16 month old Dnmt3a +/- mice into the intraperitoneal cavity of FBV/N mice. FACS analysis: FACS analysis was performed at the UNMC Flow Cytometry Facility. All antibodies used in these studies were purchased from ebioscience. Data was collected using the LSR II (BD Biosciences) and analyzed using BD FACSDiva software (BD Biosciences). B-1a cells used for methylation and expression analysis were isolated from the spleens of either FVB/N (controls), Dnmt3a +/Δ, Dnmt3a +/- or Dnmt3a Δ/Δ mice and sorted for CD19, B220, and CD5 positivity using the FACS Aria II
127 115 (BD Bioscience). Mice diagnosed with MBL had between 2 to 20% B-1a in the blood at time of harvest, while those diagnosed with CLL had greater than 20% B-1a in the blood. Mice diagnosed with MPD had profound expansion of CD11b+Gr-1+ cells in the blood (>70%), and spleen (>40%). Whole genome Bisulfite sequencing (WGBS): Splenic B-1a cells were isolated by FACS sorting from Dnmt3a +/+, Dnmt3a +/ Δ tumor, and Dnmt3a Δ/Δ tumor samples (n=1 per genetic group). WGBS data is available for download through the NCBI Gene Expression Omnibus. Details regarding the number of aligned sequencing reads per sample can be found in Table S9. Splenic B-1a cells (EGFP+CD5+CD19+B220+) were isolated by FACS sorting from Dnmt3a +/ Δ and Dnmt3a Δ/Δ suffering from with CLL (n=1 per genetic group). Age-matched control B-1a cells were FACS-sorted from spleens of EμSRα-tTA;Teto-Cre;Dnmt3a +/+ ;Rosa26LOXP EGFP/EGFP mice (n=1). Genomic DNA was isolated using standard protocols. The WGBS libraries were prepared and sequenced in DNA Services facility at the University of Illinois at Urbana-Champaign, Roy J. Carver Biotechnology Center / W.M. Keck Center using two lanes for each sample on the Illumina HiSeq2500 sequencer with paired-end 160bp reads. Each lane produced over 310 million reads. Sequence tags were aligned with the mouse genome (Dec mus musculus assembly mm10, Build 38) using the methylated sequence aligner Bismark (142) by the University of Nebraska Epigenomics Core facility. The resulting data file contains the percent methylation at each CpG measured. Each individual CpG was retained and percent methylation determined only if it was represented by 5 individual sequences. Correlation based, average linkage hierarchical clustering of genome location matching CpG methylation percentages per sample was performed using the R software package RnBeads (143). Genome location matching differentially methylated loci (DMLs) and differentially methylated regions (DMRs) were determined using the R
128 116 software package DSS (144). DMLs were determined by first smoothing the raw percent methylation values based on a moving average algorithm and smoothing span of 500 bases. DMRs were then determined based on average DML methylation change of 30 percent or greater, at least 50 percent or greater individual DML P-values less than 0.05, minimum base pair length of 100, minimum of three DMLs represented, and the resulting DMRs were aveaged if they were closer than 50 bases. Circos plots (145) were generated to visualize DMRs that had at least a 100 base overlap with genomic promoters defined as 1500 bases upstream of the transcription start site (TSS) to 500 bases downstream of the TSS. DMRs were aligned with the mouse genomic repeats. Genomic repeats were acquired from the UCSC Genome table browser based on the RepeatMasker program (Smit et al., ). The repeat was retained if the overlap between the DMR and repeat was more than 25 percent of the length of the repeat. WGBS data is available for download through the NCBI Gene Expression Omnibus. FACS and BrdU: Cell counts were obtained using Count Bright Absolute Counting Beads from Invitrogen. B-1 cells (B220+CD19+CD5+) B-2 cells (B220+CD19+CD5-), CD4+ T cell (CD4+CD3+), CD8+ T cells (CD8+CD3+), and myeloid cells (Cd11b+), were isolated from the spleens of 6 week old FVB mice and sorted for their corresponding marker expression using FACS. BrdU labeling of B-1a cells was performed by injecting BrdU (100 mg/g per body weight) into the IP cavity of mice 2 hours prior to harvest. B-1a cells were stained with fluorescently conjugated antibodies against CD19, B220, and CD5, and BrdU-positive cells were quantified using APC-conjugated anti-brdu and FACS analysis.
129 117 Western Blot: Western blots were performed as previously described (13) with use of the following antibodies: Dnmt3a (H-295, Santa Cruz), γ-tubulin (H-183, Santa Cruz). Combined Bisulfite Restriction Analysis (COBRA) and Bisulfite sequencing: COBRA and Bisulfite sequencing analysis were carried out as described previously (13, 33). Briefly, genomic DNA from tumor and sorted cell populations was treated with sodium bisulfite and isolated using the Qiagen Epitech Bisulfite Kit. PCR amplified products were digested with the restriction enzymes TaiI (Fermentas), TaqAI, or BstUI (New England Bioscience). Digests were run on a TBE-polyacrylamide gel and stained with SYBR Gold (Invitrogen). COBRA primers used in this study are presented in Table S10. RNA-seq: RNA was isolated as previously described (Hlady et al., 2012) from sorted splenic B-1a cells of FVB/N mice (n=2) and Dnmt3a +/Δ (n=1), Dnmt3a +/- (n=3) and Dnmt3a Δ/Δ (n=8) tumor mice. Library generation (TruSeq mrna kit) and sequencing were performed by SeqMatic (Fremont, CA). The resulting libraries were sequenced on the Illumina HiSeq 2000 platform using paired-end 100bp runs. The sequencing data was first aligned using TopHat (version 1.0.0) and mapped to the Mus musculus UCSC mm10 reference genome using the TopHat 2 aligner. Cufflinks 2 was used to estimate FPKM of known transcripts, perform de novo assembly, of novel transcripts, and calculate differential expression. For differentially expressed genes, we considered those genes with a fold change 2 and a q-value < 0.05 to be significant. RNA-seq data is available for download through the NCBI Gene Expression Omnibus. RNA-seq analysis of human CLL data: Publically available RNA-seq data generated using human CLL (n=10) and normal B cells (n=5) samples was downloaded from the NCBI GEO database (GSE70830). These data were used to identify
130 118 significantly overexpressed HOC genes in Figure 7B. Only those genes with a p-value <0.05 (CuffDiff) were considered significant. Reduced Representation Bisulfite Sequencing (RRBS): Splenic B-1a cells were isolated by FACS sorting from two Dnmt3a Δ/Δ mice with CLL. Age-matched control B-1a cells were FACS-sorted from spleens of FVB/N mice (n=2). Genomic DNA was isolated using standard protocols. The RRBS libraries were prepared and sequenced at the Medical Genome Facility at the Mayo Clinic and ran on an Illumina HiSeq2500 sequencer. The Streamlined Analysis and Annotation Pipeline for RRBS data (SAAP- RRBS) was specifically designed to analyze RRBS data (Sun et al., 2012). This software was used to align and determine the methylation status of CpGs associated with this type of restriction digest high throughput method. Sequences were initially aligned with genome mm9 then converted to mm10 using the UCSC Genome Browser Batch Coordinate Conversion (liftover) utility. Details regarding the number of sequencing read alignments can be found in Table S9. The methylation heat map was generated by taking the averages for all differentially methylated CpGs for a promoter (-1500 to +500 base pairs relative to the transcription start site). Promoters were only considered to be differentially methylated if one or more CpG sites showed a 30% change in methylation. Methyl Sensitive Cut Counting (MSCC): Libraries were generated using gdna from FACS sorted Dnmt3a +/+ splenic B-1a cells (n=2), and Dnmt3a D/D CLL cells (n=3) and ran on an Illumina HiSeq2500 sequencer at the Univeristy of Nebraska Medical Center Sequencing Core. Data were analyzed as described previously (13, 33). In brief, promoters were only considered to be differentially methylated if one or more independent HpaII/HpyCh4IV sites showed a 2-fold change or greater with a P-value <0.05. The methylation heat map was generated by taking the averages for raw counts for all significant change and calculating a fold change in methylation between
131 119 Dnmta3a +/+ B1 cells and Dnmt3a-deficient tumors. The promoter is defined as to +500 base pairs relative to the transcription start site. Quantitative Real-Time qrt-pcr: qrt-pcr was performed as previously described (13, 33). Primer sequences used in experiments presented here are as follows: mouse Dnmt3a: GCAAAGTGAGGACCATTACCA (forward), CTGTGTAGTGGACGGGGAAG (reverse). Human DNMT3A: CAATGACCTCTCCATCGTCAAC (forward), CATGCAGGAGGCGGTAGAA (reverse). Mouse Nfam1: GAAAAGGGTTAAAAGAAATTTTAGTTT (forward), CCCAATAAATAACTTATCACCTACAA (reverse). cdna sequencing of Dnmt3a: RNA from three independent FACS sorted Dnmt3a +/- CLL tumors and pooled wild-type FVB splenic B1 cells was reverse transcribed into cdna (BioRad iscript). Using Phusion DNA polymerase (Thermo Scientific) and primers spanning the translational start and stop codons, Dnmt3a was PCR amplified. The 2.7kb band representing the full length wild-type allele was gel extracted and sequenced. Tumor sample sequences were compared to wild-type B1 and NCBI reference cdna gene sequences. The following primer sequences were used for amplification of the transcript from cdna: ATGCCCTCCAGCGG (forward), TTACACACAAGCAAAATATTCCTTCAG (reverse), and confirmation by sequencing: TCGATGTTGGTCTGCTTCTG (reverse 1), CAGGAGAGGGCAAAGAACAG (forward 1), ACCAGGCCACCTACAACAAG (forward 2), GAACTGCTTCTTGGAGTGTGC (forward 3), AGGGTACTGGCCGCCTCT (forward 4). Histology: H&E staining was performed using standard protocols by the University of Nebraska Medical Center Tissue Science Facility.
132 120 Results The majority of Dnmt3a +/- mice develop a CLL-like disease. During the course of our studies utilizing Dnmt3a Δ/Δ mice (Peters et al., Leukemia 2014) we also observed an EμSRα-tTA;Teto-Cre;Dnmt3 +/fl ;Rosa26LOXP EGFP/EGFP mouse in which only one allele of Dnmt3a was conditionally inactivated (referred herein as Dnmt3a +/Δ or conditional heterozygous mouse). This mouse became moribund at 16 months and analysis of the organs revealed expansion of EGFP-positive (EGFP+) B220+CD19+CD5+ (B-1a) cells in the spleen, suggesting that this mouse developed a CLL-like disease (Figure 1A). Serial transplantation of Dnmt3a +/Δ splenic cells induced CLL within 4 months in primary, secondary and tertiary transplanted mice, illustrating their selective advantage to grow and induce disease (Figures S1A and S1B). Dnmt3a +/Δ CLL cells showed reduced Dnmt3a protein and mrna levels (Figures 1B and 1C), suggesting that decreased Dnmt3a dosage is sufficient to promote B-1a cell transformation. Dnmt3a +/Δ tumor cells incorporated BrdU in vivo less efficiently than Dnmt3a Δ/Δ cells (Figure S1C). These data suggest that Dnmt3a haploinsufficiency in hematopoietic cells, like full Dnmt3a inactivation, might be sufficient to induce a less aggressive CLL-like disease in mice. To test this we generated Dnmt3a +/- mice harboring a conventional Dnmt3a knockout allele (referred to herein as Dnmt3a - ) via germline cre-mediated excision of Dnmt3a exons (Figure S2A) (Dnmt3a fl ; Nguyen et al., 2007). Generation of the Dnmt3a - allele was confirmed by PCR-based genotyping (Figure S2B). Analysis of protein levels in normal thymus and spleen isolated from 6 week-old Dnmt3a +/- mice showed ~50% reduction in Dnmt3a protein levels (Figure 1D). This decrease had no measurable effect on hematopoiesis in 6 week old Dnmt3a +/- mice (Figures S2C-2G).
133 121 At 16 months of age, all Dnmt3a +/+ control mice were healthy with no signs of deregulated hematopoiesis. In contrast, only 20% of Dnmt3a +/- mice were disease-free at 16 months (Figure 1E and data not shown). Five out of 20 Dnmt3a +/- mice developed a CLL-like disease, characterized by B-1a cell expansion greater than 20% in the blood, spleen and bone marrow (Figures 1E-1I, and data not shown). Eight Dnmt3a +/- mice showed signs of monoclonal B cell lymphocytosis (MBL) a less progressed form of CLL in which the percentage of B-1a cells in the blood are between 2% to 20%, with simultaneous expansion in the spleen and bone marrow (Figures 1E-1I and data not shown). Importantly, splenic cells either from mice with MBL or CLL were able to induce disease in recipient mice (Figures 1I-1J), demonstrating that both populations contain true leukemic cells. Therefore, we refer to both conditions as CLL-like disease. Similar to Dnmt3a +/Δ CLL, leukemic B-1a cells isolated from Dnmt3a +/- mice retained approximately 50% expression of Dnmt3a, suggesting that the remaining allele is expressed in fully transformed cells (Figures 1K-L). Importantly, sequencing analysis of cdna generated from three independent Dnmt3a +/- CLL revealed no mutations in the coding sequence of Dnmt3a (data not shown), demonstrating that the expressed Dnmt3a allele is in the wildtype configuration. Altogether these data suggest that Dnmt3a is a haploinsufficient tumor suppressor gene in prevention of CLL in mice.


134 Figure 1. Dnmt3a heterozygous mice develop CLL. A. Flow diagram of CD5 and CD19 expression is shown for EGFP-negative (black) and EGFP-positive (green) cells from a Dnmt3a +/Δ spleen. The percentage of positive cells is indicated in quadrants. B. Dnmt3a expression in Dnmt3a +/Δ spleen as determined by immunoblot using anti-dnmt3a antibody. N indicates Dnmt3a +/+ CD19+ splenic cells. +/Δ and Δ/Δ indicate splenic CLL cells from Dnmt3a +/Δ and Dnmt3a Δ/Δ mice, respectively. 3a represents a positive control in which Dnmt3a protein was overexpressed in Dnmt3a -/- cells. -tubulin served as a loading control. C. qrt-pcr analysis of Dnmt3a expression in normal splenic B-1a (B1) cells and Dnmt3a +/Δ (+/Δ) CLL. Average of two independent experiment is presented. Error bars represent ± standard deviation (SD). P<0.05, Student s t-test. Statistically significant difference is indicated by (*). D. Dnmt3a expression in thymi (Th) and spleens of 6 week old Dnmt3a +/+ (+/+) and Dnmt3a +/- (+/-) mice as determined by immunoblot using anti-dnmt3a antibody. (-/-) represents Dnmt3a-defficient cells. -tubulin served as a loading control. E. Disease spectrum observed in ~16 months old Dnmt3a +/- mice (n=20). MBL/CLL monoclonal B cell lymphopoiesis/cll-like disease, MPD myeloproliferative disease, no disease disease free mice. F. Flow diagram of CD5 and CD19 expression in spleens of Dnmt3a +/- (+/-) and agedmatched Dnmt3a +/+ (+/+) mice. 122
 is shown. P<0.05 is indicated by (*), Student s t-test. I.")
. Five primary MBL/CLL mice are shown. K.")
135 Figure 1 cont. Dnmt3a heterozygous mice develop CLL. G. H&E stained sections of Dnmt3a +/+ (normal) and Dnmt3a +/- (CLL) spleens (200X). H. Percentage of B-1a cells in the spleens and blood of ~16 months old Dnmt3a +/+ (blue) and Dnmt3a +/- (red) mice as determined by FACS. Number of mice (n) is shown. P<0.05 is indicated by (*), Student s t-test. I. Flow diagram of CD5 and CD19 expression in the spleen of a Dnmt3a +/- mouse with Monoclonal B cell lymphopoeisis (MBL) (top) and terminally ill FVB recipient mouse injected with MBL splenic cells. J. Kaplan-Meier survival curves for FVB mice injected with Dnmt3a +/- MBL/CLL splenic cells (3 mice per line). Five primary MBL/CLL mice are shown. K. Dnmt3a expression in spleens of Dnmt3a +/ (+/ ) and Dnmt3a D/D (D/D) mice as determined by immunoblot using anti-dnmt3a antibody. N indicates Dnmt3a +/+ CD19+ splenic cells. -tubulin served as a loading control. L. qrt-pcr analysis of Dnmt3a expression in normal and leukemic Dnmt3a +/- B-1a cells. Average of two independent experiment is shown. 123
136 Figure S1. Dnmt3a heterozygous mice develop CLL. A. The time to CLL development for primary (1), secondary (2) and tertiary (3) serially transplanted FVB-recipient mice injected with splenic cells isolated from a terminally sick Dnmt3a +/Δ mouse. Data are presented as average time to tumor development. The number of recipient mice is indicated within bars. B. FACS analysis of EGFP expression in splenic cells of a terminally sick primary FVB-recipient mouse injected with splenic cells from a Dnmt3a +/Δ mouse. Expression of CD5 and CD19 is shown for EGFP-negative (black) and EGFP-positive (green) cells. C. BrdU incorporation assay, as determined by FACS analysis, of B-1a splenic cells isolated from normal Dnmt3a +/+ (n=3), terminally sick Dnmt3a Δ/Δ (n=3) and Dnmt3a +/Δ (n=3) mice. Error bars represent ± standard deviation (SD). 124
137 Figure S2. Normal hematopoiesis in 6-week old Dnmt3a +/- mice. A. A graphical presentation of a generation of a conventional knockout allele of Dnmt3a using EµSRα-tTA; Tet-o-Cre; Dnmt3 fl/fl x FVB cross. A conditional knockout allele of Dnmt3a has exons 18 (E18) through exon 20 (E20) flanked by LoxP sites (Nguyen et al, Dev Dyn 2007). EµSRα-tTA; Teto-Cre mice express Cre in germ cells. Cre-mediated excision of DNA between LoxP sites results in the generation of a conventional Dnmt3a knockout allele that lacks E18- E20. B. PCR of genomic DNA obtained from offspring of EμSRα-tTA;Teto-Cre;Dnmt3a fl/fl crossed with FVB. KO indicates a DNA fragment obtained from Dnmt3a conventional knockout allele, F indicates a DNA fragment obtained from Dnmt3a conditional knockout allele and W indicates a DNA fragment obtained from Dnmt3a wild-type allele. For C-G, cells were isolated from the organs of 6-weeks-old Dnmt3a +/+ (n=4) and Dnmt3a +/- (n=4) and analyzed by FACS. No significant differences were observed in any of comparisons shown on this figure. Data were analyzed using Student s t test. The average number of cells is shown with + SEM. C. Organ weights of thymi (TH), spleens (SP) and lymph nodes (LN). D. The number of CD19+CD5- (B-cells), CD11b+ (Myeloid), and Ter119+ (erythroid) cells isolated from bone marrow of 6-weeks-old Dnmt3a +/+ (n=4) and Dnmt3a +/- (n=4). 125
138 Figure S2 cont. Normal hematopoiesis in 6-week old Dnmt3a +/- mice. E. The number of cells with CD4+CD8-, CD4-CD8+ or CD4+CD8+ (DP) immunophenotypes isolated from thymi of 6-weeks-old Dnmt3a +/+ (n=4) and Dnmt3a +/- (n=4). F. The number of cells with Lineage neg, Sca-1+, c-kit+ (LSK) immunophenotypes isolated from bone marrow of 6-weeks-old Dnmt3a +/+ (n=4) and Dnmt3a +/- (n=4). G. The number of cells with CD4+CD3+ (T-cells); CD8+CD3+ (T-cells); CD19+CD5- (B-cells), CD19+CD5+ (B-1a cells), Gr-1+CD11b+ (Myeloid cells), Ter119+ (erythroid cells) immunophenotypes isolated from spleens of 6- weeks-old Dnmt3a +/+ (n=4) and Dnmt3a +/- (n=4). 126
139 127 Dnmt3a +/- mice also develop myeloproliferative disease. In addition to CLL, we also observed the development of a myeloproliferative disease (MPD) in 15% of Dnmt3a +/- mice (Figure 1E). These mice showed expansion of Gr-1+CD11b+ myeloid cells in the blood, spleen and bone marrow (Figure 2A-2C and data not shown). In contrast to CLL-like cells, Gr-1+CD11b+ splenic cells did not induce disease upon injection into sublethally irradiated FVB recipient mice, suggesting that this population of cells do not contain leukemia initiating cells (Figure 2D-E). Thus, our studies of Dnmt3a +/- mice show that long-term mono-allelic loss of Dnmt3a can induce a frank B cell malignancy, non-malignant myeloproliferative disorder with a combined 80% penetrance by 16 months of age. In order to understand why Dnmt3a heterozygosity affects primarily B-1a and myeloid cells, we measured Dnmt3a mrna levels in FACSsorted normal Dnmt3a +/+ B-1a, B2, T cells and myeloid cells and found that Dnmt3a expression was lower in B-1a cells when compared to B2 cells and relatively equal when compared to T cells (Figure 2F). Thus, the preferential transformation of B-1a cells or myeloid cells does not seem to be associated with significantly different Dnmt3a levels relative to other normal hematopoietic cells. The reason why B-1a and, to some extent, myeloid cells are in particular sensitive to transformation upon decreased Dnmt3a levels therefore remains unclear. Given that Dnmt3a +/- mice develop CLL, we next asked whether or not DNMT3A deficiency is observed in human CLL. Previous analysis of available gene expression data (Haferlach et al., 2010) identified DNMT3A as belonging to the top 1% of underexpressed genes in CLL (Peters et al., 2014). Our further analysis showed that in 4/5 cases of primary human CLL, DNMT3A expression was significantly decreased relative to normal human CD19+ B cells (Figure 2G). These data support the idea that
140 128 decreased DNMT3A may promote the development of human CLL. Further investigation is needed to more carefully address this point.
. C. H&E stained sections of Dnmt3a +/+ and Dnmt3a +/- femurs (200x). D. Flow diagram of Gr-1 and CD11b expression in spleen of Dnmt3a +/- mouse with MPD (left).")
141 Figure 2. Dnmt3a +/- mice also develop non-malignant myeloproliferative disorder. A. Flow diagram of CD11b and Gr-1 expression in spleens of normal Dnmt3a +/+ (+/+) and Dnmt3a +/- (+/-) mice with MPD. B. H&E stained sections of Dnmt3a +/+ and Dnmt3a +/- spleens (200x). C. H&E stained sections of Dnmt3a +/+ and Dnmt3a +/- femurs (200x). D. Flow diagram of Gr-1 and CD11b expression in spleen of Dnmt3a +/- mouse with MPD (left). Gr-1 and CD11b expression 9 months post injection (right). E. Kaplan-Meier survival curves for FVB recipients injected with two independent Dnmt3a +/- MPD lines (3 mice per line). F. qrt-pcr analysis of Dnmt3a expression in sorted B-1a, B2, CD4+ T cells, CD8+ T cells, and myeloid cells isolated from FVB spleen. Two biological replicates are shown. Data was normalized to Gapdh and error bars represent ± SD. G. qrt-pcr analysis of DNMT3A expression in five human CLL samples (1-5). Two biological replicates for CD19+ peripheral blood from healthy donors were used as controls. Average of two independent experiments is shown. Error bars represent ± SD. 129
142 130 DNA methylome and transcriptome of normal mouse B-1a cells. To identify DNA methylation and transcriptional changes associated with CLL development, we performed global methylation profiling by WGBS and gene expression profiling by RNA-seq of B-1a cells isolated from normal Dnmt3a +/+ spleens, as this cellular population is immunophenotypically the closest normal counterpart of CLL cells. We focused on splenic B-1a cells rather than B-1a cells residing in the intraperitoneal cavity because: a.) the observed CLL disease consistently presented with splenomegaly and the spleen served as a source of tumor cells b.) the microenvironment can effect gene expression and presumably methylation patterns. WGBS analysis of normal B-1a cells revealed that out of 22,452,960 CpG dinucleotides covered by our analysis 20,316,133 CpGs were methylated > 50%, whereas only 2,136,827 CpGs were methylated < 50% and only 133,765 CpGs 20% (Figure 3A). When we analyzed only CpG dinculeotides that aligned to core promoter regions (-300 to +150bp relative to transcription start site; TSS) we found that from the 25,742 promoters analyzed, 15,203 were methylated at > 50%. (Figure 3B; Table S1) and only 7,436 promoters were methylated at 20%. A combined analysis of gene expression and methylation revealed that 50% of genes with 20% promoter methylation were expressed (FPKM > 5; Figure 3C, Table S2). In contrast, 84% of genes with promoter hypermethylation ( 50%) were not expressed (FPKM 5; Figure 3C, Table S2). Consistently, the degree of promoter methylation inversely correlated with gene expression (Figure 3D). For example, promoters with less than 25% methylation were expressed at significantly higher levels than promoters with higher levels of methylation (Figure 3D). IPA of 3,700 highly expressed genes (FPKM 10) revealed a significant enrichment in genes relating to hematopoiesis and lymphoid tissue structure and development (Figure 3E). Altogether, these data demonstrates that most gene promoters in normal splenic B-1a cells are
143 131 hypermethylated and silenced whereas promoters that are hypomethylated are largely expressed and their physiological relevance is linked to the hematopoietic system.
. B. A heat map displaying methylation status of 25,742 promoters as determined by WGBS.")
144 Figure 3. DNA methylome and transcriptome of normal mouse B-1a cells. A. Methylation status of 22,452,960 CpG dinucleotides in normal B-1a cells as determined by whole-genome bisulfite sequencing (WGBS). B. A heat map displaying methylation status of 25,742 promoters as determined by WGBS. Methylation percentage for individual CpGs were annotated to the promoter regions -300bp to +150bp relative to the transcription start site (TSS). Methylation percentages for all CpGs across the 450bp region were averaged to give a mean methylation value for each gene promoter. C. Heat map presentation of promoter methylation (analyzed as in Figure 2B) and corresponding gene expression (average FPKM values from RNA-seq) in mouse splenic B-1a cells for 16,770 genes. Genes with high FPKM values are shown in red and genes with low FPKM values are shown in green. Upper limit for color-coding in gene expression heat map is FPKM 5 as indicated. Heat maps are organized in the same gene order to match data for methylation and gene expression. D. Analysis of promoter (-300 to +150bp) methylation in relation to gene expression in mouse splenic B-1a cells for 16,770 genes. Genes were divided into four groups based on percentage of promoter methylation (0-25%, 26-50%, 51-75% and %). P<0.05 for all pair-wise comparisons except to group (Bonferroni's multiple comparison test). E. Ingenuity Pathway analysis of 3,700 highly expressed genes (FPKM 10). The top subcategories obtained in Physiological System, Development and Functions are shown with the number of genes indicated above individual bars (P<0.05, for all subcategories). 132
145 133 DNA methylome of Dnmt3a +/Δ and Dnmt3a Δ/Δ CLL. We next performed WGBS on DNA isolated from Dnmt3a +/Δ CLL cells and Dnmt3a Δ/Δ CLL cells to determine the effects of loss of Dnmt3a on the CLL methylome. Mono-allelic loss of Dnmt3a resulted in a ~1% relative hypomethylation and a 0.1% hypermethylation in individual CpGs relative to B-1a (Figure 4A, Table S3). Bi-allelic loss of Dnmt3a resulted in a substantial 4.1% decrease and a 0.1% increase CpG methylation (Figure 4A, Table S3). Relative to Dnmt3a +/Δ CLL, hypomethylation in the Dnmt3a-deficient CLL genome was most pronounced in repetitive elements and gene bodies (3.5 to 5.5 fold) (Figures 4B, S3A and B). In contrast, the increased incidence of hypomethylated long promoters (-1500 bp to +500 bp relative to TSS) was only 2.2 fold greater in Dnmt3a Δ/Δ CLL compared to Dnmt3a +/Δ CLL (Figures 4C, S3B, Table S4). This ratio was even smaller (1.9 fold) when analysis was restricted to core promoters (-300 bp to +150 bp) (Figures 4C, S3B, Table S4). These data suggest that Dnmt3a levels are more critical for promoter methylation than other parts of the genome, such as repetitive elements or gene bodies and that 699 hypomethylated promoters in Dnmt3a +/Δ are likely hypersensitive to levels of Dnmt3a (Figure 4C). Overall, 386 hypomethylated promoters and 43 hypermethylated promoters were shared between Dnmt3a +/Δ and Dnmt3a Δ/Δ CLL (Figure 4D and Table S4). Differentially methylated promoters were equally distributed across the genome, with exception of the X chromosome in which no hypo- or hypermethylated promoters were shared between Dnmt3a +/Δ and Dnmt3a Δ/Δ CLL cells relative to B-1a control cells (Figure 4D, Table S5). In contrast, chromosome 11 and 19 had the highest number of commonly hypomethylated promoters, with 48 and 23, respectively (Figure 4D, Table S5). Commonly hypomethylated promoters likely represent targets of Dnmt3a maintenance methylation function, whereas
146 134 hypermethylated promoters in Dnmt3a Δ/Δ CLL are likely de novo methylated by other Dnmts. To determine whether the methylation landscape generated by WGBS is specific to the CLL samples profiled or rather represents common changes that occur in Dnmt3adeficient CLL, we validated hypo- and hypermethylated promoters using locus-specific Combined Bisulfite Restriction Analysis (COBRA) assays, as well as two global methods methyl sensitive cut counting (MSCC) and reduced representation bisulfite sequencing (RRBS). COBRA analysis of 6 promoters confirmed the hypomethylation identified by WGBS, suggesting that changes in promoter methylation likely represent common events occurring in mouse CLL (Figure 4G, Figure S3C). Next, we validated hypo- and hypermethylated promoters using two global methods MSCC and RRBS. The choice of two independent approaches was driven by the fact that each method has lower genome-wide coverage and is biased against regions with low-cg content (146). Thus, their concurrent use allowed us to obtain a more comprehensive and complementary methylation dataset. Importantly, were confirmed 53% of hypomethylated and 98% of hypermethyated DMRS in promoters in Dnmt3a Δ/Δ CLL identified by WGBS using one or both methods (Figure 4G, Table S6). These data demonstrate that methylation changes detected by WGBS on a small sample set likely represent events shared among larger sets of Dnmt3a Δ/Δ CLL.

147 135
148 Figure 4. DNA methylome of CLL induced by decrease or absence of Dnmt3a. A. A graphical presentation of differentially methylated cytosines (DMCS) in Dnmt3a +/Δ and Dnmt3a Δ/Δ CLL relative to B-1a control. Methylation changes were evaluated in 15,533,510 CpGs and are shown in both absolute numbers and percentages. B. The number of differentially methylated regions (DMRS) associated with gene bodies in Dnmt3a +/Δ and Dnmt3a Δ/Δ CLL samples when compared to B-1a control sample. C. The number of DMRs associated with long promoters (-1500 to +500 bp relative to the TSS) and core promoters (TSS; -300 to +150bp relative to the TSS) in Dnmt3a +/Δ and Dnmt3a Δ/Δ CLL relative to B-1a control. D. Circos plot of DMRs associated with long promoters in Dnmt3a +/Δ or Dnmt3a Δ/Δ CLL. Outer circle is a graphical presentation of mouse chromosomes and inner circles indicate DMRs and their positions on mouse chromosomes observed in Dnmt3a +/Δ (+/Δ) or Dnmt3a Δ/Δ CLL (Δ/Δ) relative to B-1a control. Yellow lines indicate hypomethylated promoters whereas blue lines indicate hypermethylated promoters. Circle C represents hypo- (red lines) and hypermethylated (green lines) promoters commonly observed in both CLL samples. E. COBRA analysis of putative Dnmt3a target gene promoters in splenic B-1a cells (B1), Dnmt3a +/Δ CLL (+/Δ), Dnmt3a +/- CLL (+/-) and Dnmt3a Δ/Δ CLL (Δ/Δ) samples. Undigested (U) and digested (D) fragments correspond to unmethylated and methylated DNA, respectively. CpG and M indicates a fully methylated control and undigested PCR fragments, respectively. F. (left) Heatmap showing 249 hypomethylated and 104 hypermethylated promoters identified through WGBS and confirmed by RRBS. Data is shown as an average percent methylation for Dnmt3a +/+ B-1a (n=2) and Dnmt3a Δ/Δ CLL (n=2) for differentially methylated CpGs (minimum 30% change in methylation) annotated to the promoter region (-1500 to +500bp). (right) Heatmap showing 336 hypomethylated and 34 hypermethylated promoters identified through WGBS and confirmed by MSCC. Data is shown as a fold change in methylation for Dnmt3a Δ/Δ CLL (n=3) relative to Dnmt3a +/+ B-1a (n=2). Differentially methylated CpGs (fold change > 2 and a P < 0.05, negative binomial analysis) were annotated to the promoter region. G. RRBS and MSCC confirmation of differentially methylated promoters (red) identified through WGBS. The number and percent of confirmed hypomethylated (top) and hypermethylated (bottom) genes by RRBS (yellow), MSCC (blue) or both (green) is shown. Gray represents genes identified through WGBS not confirmed by MSCC or RRBS. 136
149 Figure S3. Related to Figure 4. Deregulated methylation in Dnmt3a Δ/Δ and Dnmt3a +/Δ CLL. A. The number of LINE, SINE and LTR Repeat Elements that are associated with DMRs in Dnmt3a +/Δ and Dnmt3a Δ/Δ CLL samples when compared to B-1a control. B. Ratio between the number hypomethylated genomic elements observed in Dnmt3a Δ/Δ CLL and in Dnmt3a +/Δ CLL calculated from values in panels A-C of Figure 4 and Figure S3A. C. Bisulfite sequencing of the HemT promoter region in normal B-1a, Dnmt3a +/Δ CLL and Dnmt3a Δ/Δ CLL samples. Each line represents the sequence of an individual allele and circles denote individual CpGs, with black showing methylation and white shown lack of methylation. 137
150 138 Promoter hypomethylation in CLL is likely due to the lack of cancer-specific maintenance activity of Dnmt3a and is independent of proliferation. Promoter hypomethylation observed in Dnmt3a +/- and Dnmt3a Δ/Δ CLL could results from Dnmt3a inactivation in normal B-1a cells, either due to lack of Dnmt3a s de novo or maintenance activity. In such a scenario, promoters would be hypomethylated in normal B-1a cells prior to CLL development. To address this, we performed COBRA assays to analyze promoter methylation of 14 genes in normal Dnmt3a +/+ and Dnmt3a +/- B-1a cells. Interestingly, we have not seen any evidence of decreased promoter methylation in any of loci tested in Dnmt3a +/- B-1a cells, suggesting that a partial inactivation of Dnmt3a does not affect the methylation status of promoters during the development of normal B-1a cells (Figure 5A). Thus, the decrease in methylation observed in Dnmt3a +/- and Dnmt3a Δ/Δ CLL appears to be tumor-specific. We next sought to determine if promoter hypomethylation observed in Dnmt3a +/- and Dnmt3a Δ/Δ CLL could be the result of increased proliferation of CLL cells rather than the result of Dnmt3a-deficiency. We therefore examined promoter methylation in selected loci in two independent mouse models of CLL, IRF4 / ;Vh11 and Eµ-TCL1 (147, 148). In IRF4 / ;Vh11 CLL samples, no changes in Dnmt3a levels were observed by global gene expression (data not shown). To verify this, we measured transcript levels of Dnmt3a but did not observe changes in Dnmt3a transcript levels in IRF4 / ;Vh11 CLL (Figure 5B). Thus, this CLL model likely represent one in which Dnmt3a activity is not altered. In contrast, it has been reported recently, that TCL-1 binds to and inhibits Dnmt3a activity, resulting in suppression of Dnmt3a activity and hypomethylation in the Eµ-TCL1 mice (65). Thus, Eµ-TCL1 CLL represents a model in which biochemical inhibition of Dnmt3a occurs. We analyzed promoter methylation of four genes found to be hypomethylated in Dnmt3a +/- and Dnmt3a Δ/Δ CLL using DNA from IRF4 / ;Vh11 and
151 139 Eµ-TCL1 CLL samples. This analysis revealed that all tested promoters were partially hypomethylated in Eµ-TCL1 CLL and not hypomethylated in IRF4 / ;Vh11 CLL samples (Figure 5C), suggesting that promoter hypomethylation in Dnmt3a +/- and Dnmt3a Δ/Δ CLL is directly linked to the lack of Dnmt3a rather than to increased cellular proliferation. Expression of Nfam1 correlated with its promoter methylation, as this gene was expressed in Dnmt3a +/- and Dnmt3a Δ/Δ CLL but not in IRF4 -/- ;Vh11 CLL, suggesting that at least some genes that become hypomethylated during CLL development become overexpressed (Figure 5D). These data suggest that Dnmt3a may have a tumor-specific maintenance activity similar to the one we described previously for Dnmt3b in MYCinduced T cell lymphomagenesis (13).
 and digested (D) fragments correspond to unmethylated and methylated DNA, respectively. CpG and M indicates a fully methylated control and undigested PCR fragments, respectively. B.")
152 Figure 5. Dnmt3a has a cancer-specific maintenance function. A. COBRA analysis of 14 putative Dnmt3a target gene promoters in splenic Dnmt3a +/+ and Dnmt3a +/Δ B-1a cells. Undigested (U) and digested (D) fragments correspond to unmethylated and methylated DNA, respectively. CpG and M indicates a fully methylated control and undigested PCR fragments, respectively. B. qrt-pcr analysis of Dnmt3a expression in normal B-1a and IRF4 -/- ;Vh11 CLL samples. Average of two independent experiments is presented. Error bars represent ± SD. C. COBRA analysis of 4 putative Dnmt3a target gene promoters in Dnmt3a +/Δ (+/D), Dnmt3a D/D (D/D), E -TCL1, and IRF4 -/- ;Vh11 CLL. D. qrt-pcr analysis of Nfam1 expression in B-1a, IRF4 -/- ;Vh11, Dnmt3a +/- (+/-), and Dnmt3a D/D (D/D) CLL. Average of two independent experiments is presented. Error bars represent ± SD. 140
153 141 Gene expression is conserved in Dnmt3a +/Δ and Dnmt3a Δ/Δ CLL. To better understand the molecular basis for CLL development, global gene expression profiles of normal B-1a cells, Dnmt3a +/- and Dnmt3a Δ/Δ CLL cells were determined by RNA-seq. We identified 413 overexpressed and 282 underexpressed genes in Dnmt3a +/- CLL relative to B-1a cells (Figure 6A, Table S7). Inactivation of both Dnmt3a alleles in Dnmt3a Δ/Δ CLL resulted in overexpression of 790 genes and underexpression of 398 genes. Interestingly, the majority of genes upregulated in Dnmt3a +/- CLL were also upregulated in Dnmt3a Δ/Δ CLL cells (67%), whereas downregulated genes were less conserved between the two genetic settings (57%; Figure 6B, Table S7). To gain insight into the nature of deregulated processes in CLL induced by decreased levels of Dnmt3a, we next performed IPA analysis of differentially expressed genes between Dnmt3a +/- and Dnmt3a Δ/Δ CLL relative to control B-1a cells. Notably, the top five subcategories under Disease and disorder and Physiological System Development and Functions were identical in Dnmt3a +/- and Dnmt3a Δ/Δ CLL (Figure S4A). In addition, three out of five subcategories under Canonical pathways were conserved between Dnmt3a +/- and Dnmt3a Δ/Δ CLL. Altogether, this suggests that despite the higher number of differentially expressed genes present in Dnmt3a Δ/Δ CLL, similar pathways are affected in both settings. However, the physiological relevance of these categories to CLL development is less clear as this analysis did not provide clear links to pathways or molecules driving CLL development.
 relative to control")
. B.")
154 Figure 6. Decreased Dnmt3a levels result in deregulated transcription in Dnmt3a +/Δ CLL similar to Dnmt3a Δ/Δ CLL. A. Heat maps derived from RNA-seq analysis displaying 413 overexpressed and 282 underexpressed genes in Dnmt3a +/ Δ and Dnmt3a +/- CLL (n=4) relative to control B-1a cells (n=2) (left) and 790 overexpressed and 398 underexpressed genes in Dnmt3a Δ/Δ CLL (n=8). Only genes with a fold change 2 and a q-value < 0.05 are shown (CuffDiff analysis). B. The number of genes differentially expressed in Dnmt3a Δ/Δ CLL (white box), Dnmt3a +/- CLL (black box) and genes common between Dnmt3a Δ/Δ and Dnmt3a +/- CLL (grey box). 142
155 143 Genes commonly hypomethylated and overexpressed in Dnmt3a +/- and Dnmt3a Δ/Δ CLL (HOC) are putative drivers of CLL. Since loss of one allele of Dnmt3a is sufficient to induce CLL, we hypothesized that genes most likely involved in pathogenesis of the disease are those whose promoter methylation affect gene expression in both Dnmt3a +/- and Dnmt3a Δ/Δ CLL. A comparison of promoter methylation and gene expression revealed that 10% of genes in both Dnmt3a +/- and Dnmt3a Δ/Δ CLL were hypomethylated and overexpressed (Figure 7A, Table S8). In contrast, only 3% and 1% of hypermethylated genes showed reduced expression in Dnmt3a +/- and Dnmt3a Δ/Δ CLL, respectively (Figure 7A). We next performed IPA using genes whose expression and methylation was commonly changed in both Dnmt3a +/- and Dnmt3a Δ/Δ CLL. This analysis identified a signature of 26 genes commonly hypomethylated and overexpressed in both Dnmt3a +/- and Dnmt3a Δ/Δ CLL (Hypomethylated and overexpressed in CLL; HOC genes; Figure 7B). With exception of Mgmt, promoter hypomethylation of all HOC genes was confirmed by locus-specific COBRA assay in the vast majority Dnmt3a +/- CLL and Dnmt3a Δ/Δ CLL samples tested, suggesting that HOC promoter hypomethylation is a conserved event in CLL induced by a decrease in Dnmt3a. These genes therefore may play a role in disease development. Consistently, IPA analysis placed twenty-four genes in the category cancer (Figure S4B). In contrast to the strong association of HOC genes with the cancer category, IPA analysis of multiple randomly selected groups of 26 overexpressed genes in Dnmt3a +/- CLL did not identify the category of cancer as top category and failed to yield a single gene associated with cancer (data not shown), further supporting the idea that HOC genes may promote the development of CLL. Thus, combined methylation and gene expression analysis identified genes likely regulated by Dnmt3a maintenance
156 144 methylation activity that have strong association to cancer and may contain oncogenic drivers of CLL.

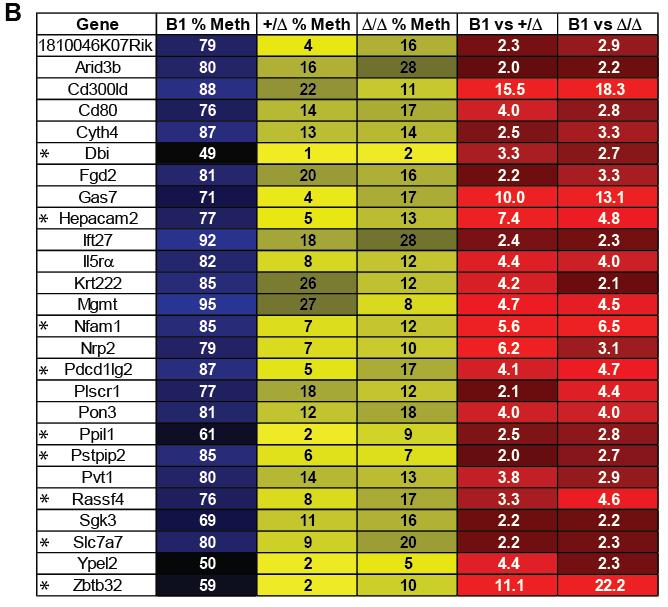
157 145

158 Figure 7. Genes commonly hypomethylated and overexpressed in Dnmt3a +/- and Dnmt3a Δ/Δ CLL (HOC) are putative drivers of CLL. A. The number of genes differentially expressed and differentially methylated at the promoter region in Dnmt3a Δ/Δ CLL and Dnmt3a +/- CLL. The number of genes with corresponding methylation and expression changes are shown in the grey boxes. B. Promoter methylation for HOC genes in B-1a, Dnmt3a +/Δ CLL, and Dnmt3a Δ/Δ CLL is shown within boxes. Similarly, fold differences in gene expression between Dnmt3a +/Δ CLL relative to B-1a and Dnmt3a Δ/Δ CLL relative to B-1a is shown. (*) denotes genes overexpressed in human CLL. C. COBRA analysis of 26 HOC gene promoters in Dnmt3a +/Δ CLL (+/Δ), Dnmt3a +/- CLL (+/-) and Dnmt3a Δ/Δ CLL (Δ/Δ) samples. Undigested (U) and digested (D) fragments correspond to unmethylated and methylated DNA, respectively. CpG and M indicates a fully methylated control and undigested PCR fragments, respectively. (*) denotes unconfirmed target. 146
Loss of Dnmt3b function upregulates the tumor modifier Ment and accelerates mouse lymphomagenesis
 Research article Loss of Dnmt3b function upregulates the tumor modifier Ment and accelerates mouse lymphomagenesis Ryan A. Hlady, 1 Slavomira Novakova, 1 Jana Opavska, 1 David Klinkebiel, 2 Staci L. Peters,
Nature Immunology: doi: /ni Supplementary Figure 1. Huwe1 has high expression in HSCs and is necessary for quiescence.
 Supplementary Figure 1 Huwe1 has high expression in HSCs and is necessary for quiescence. (a) Heat map visualizing expression of genes with a known function in ubiquitin-mediated proteolysis (KEGG: Ubiquitin
Supplementary Figures
 Supplementary Figures Supplementary Figure 1. Confirmation of Dnmt1 conditional knockout out mice. a, Representative images of sorted stem (Lin - CD49f high CD24 + ), luminal (Lin - CD49f low CD24 + )
September 20, Submitted electronically to: Cc: To Whom It May Concern:
 History Study (NOT-HL-12-147), p. 1 September 20, 2012 Re: Request for Information (RFI): Building a National Resource to Study Myelodysplastic Syndromes (MDS) The MDS Cohort Natural History Study (NOT-HL-12-147).
Not IN Our Genes - A Different Kind of Inheritance.! Christopher Phiel, Ph.D. University of Colorado Denver Mini-STEM School February 4, 2014
 Not IN Our Genes - A Different Kind of Inheritance! Christopher Phiel, Ph.D. University of Colorado Denver Mini-STEM School February 4, 2014 Epigenetics in Mainstream Media Epigenetics *Current definition:
MicroRNA-29a Reveals Oncogenic Role on Myeloid Malignancies by Regulating DNMT3A
 MicroRNA-29a Reveals Oncogenic Role on Myeloid Malignancies by Regulating DNMT3A Heba Alkhatabi, PhD Assistant Professor Department of Medical Laboratory Collage of Applied Medical science King Abdul Aziz
R. Piazza (MD, PhD), Dept. of Medicine and Surgery, University of Milano-Bicocca EPIGENETICS
, Dept. of Medicine and Surgery, University of Milano-Bicocca EPIGENETICS") R. Piazza (MD, PhD), Dept. of Medicine and Surgery, University of Milano-Bicocca EPIGENETICS EPIGENETICS THE STUDY OF CHANGES IN GENE EXPRESSION THAT ARE POTENTIALLY HERITABLE AND THAT DO NOT ENTAIL A
R. Piazza (MD, PhD), Dept. of Medicine and Surgery, University of Milano-Bicocca EPIGENETICS EPIGENETICS THE STUDY OF CHANGES IN GENE EXPRESSION THAT ARE POTENTIALLY HERITABLE AND THAT DO NOT ENTAIL A
The role of DNMT3A and HOXA9 hypomethylation in acute myeloid leukemia (AML)
") Campbell Drohan BIOL 463 December 2016 The role of DNMT3A and HOXA9 hypomethylation in acute myeloid leukemia (AML) Introduction Epigenetic modifications of DNA and histones are key to gene regulation
Campbell Drohan BIOL 463 December 2016 The role of DNMT3A and HOXA9 hypomethylation in acute myeloid leukemia (AML) Introduction Epigenetic modifications of DNA and histones are key to gene regulation
Jayanti Tokas 1, Puneet Tokas 2, Shailini Jain 3 and Hariom Yadav 3
 Jayanti Tokas 1, Puneet Tokas 2, Shailini Jain 3 and Hariom Yadav 3 1 Department of Biotechnology, JMIT, Radaur, Haryana, India 2 KITM, Kurukshetra, Haryana, India 3 NIDDK, National Institute of Health,
Nature Immunology: doi: /ni Supplementary Figure 1. DNA-methylation machinery is essential for silencing of Cd4 in cytotoxic T cells.
 Supplementary Figure 1 DNA-methylation machinery is essential for silencing of Cd4 in cytotoxic T cells. (a) Scheme for the retroviral shrna screen. (b) Histogram showing CD4 expression (MFI) in WT cytotoxic
Genetics and Genomics in Medicine Chapter 6 Questions
 Genetics and Genomics in Medicine Chapter 6 Questions Multiple Choice Questions Question 6.1 With respect to the interconversion between open and condensed chromatin shown below: Which of the directions
Figure S1. Generation of inducible PTEN deficient mice and the BMMCs (A) B6.129 Pten loxp/loxp mice were mated with B6.
 B6.129 Pten loxp/loxp mice were mated with B6.") Figure S1. Generation of inducible PTEN deficient mice and the BMMCs (A) B6.129 Pten loxp/loxp mice were mated with B6.129-Gt(ROSA)26Sor tm1(cre/ert2)tyj /J mice. To induce deletion of the Pten locus,
Figure S1. Generation of inducible PTEN deficient mice and the BMMCs (A) B6.129 Pten loxp/loxp mice were mated with B6.129-Gt(ROSA)26Sor tm1(cre/ert2)tyj /J mice. To induce deletion of the Pten locus,
Introduction to Cancer Biology
 Introduction to Cancer Biology Robin Hesketh Multiple choice questions (choose the one correct answer from the five choices) Which ONE of the following is a tumour suppressor? a. AKT b. APC c. BCL2 d.
CANCER. Inherited Cancer Syndromes. Affects 25% of US population. Kills 19% of US population (2nd largest killer after heart disease)
") CANCER Affects 25% of US population Kills 19% of US population (2nd largest killer after heart disease) NOT one disease but 200-300 different defects Etiologic Factors In Cancer: Relative contributions
CANCER Affects 25% of US population Kills 19% of US population (2nd largest killer after heart disease) NOT one disease but 200-300 different defects Etiologic Factors In Cancer: Relative contributions
mirna Dr. S Hosseini-Asl
 mirna Dr. S Hosseini-Asl 1 2 MicroRNAs (mirnas) are small noncoding RNAs which enhance the cleavage or translational repression of specific mrna with recognition site(s) in the 3 - untranslated region
Supplementary Figure 1 CD4 + T cells from PKC-θ null mice are defective in NF-κB activation during T cell receptor signaling. CD4 + T cells were
 Supplementary Figure 1 CD4 + T cells from PKC-θ null mice are defective in NF-κB activation during T cell receptor signaling. CD4 + T cells were isolated from wild type (PKC-θ- WT) or PKC-θ null (PKC-θ-KO)
Supplementary Information
 Supplementary Information Supplementary Figure 1! a! b! Nfatc1!! Nfatc1"! P1! P2! pa1! pa2! ex1! ex2! exons 3-9! ex1! ex11!!" #" Nfatc1A!!" Nfatc1B! #"!" Nfatc1C! #" DN1! DN2! DN1!!A! #A!!B! #B!!C! #C!!A!
Fragile X Syndrome. Genetics, Epigenetics & the Role of Unprogrammed Events in the expression of a Phenotype
 Fragile X Syndrome Genetics, Epigenetics & the Role of Unprogrammed Events in the expression of a Phenotype A loss of function of the FMR-1 gene results in severe learning problems, intellectual disability
0.0 All T-lymph B-lymph Sarcomas Carcinomas Germ cell. Tumor type
 Fig S1 A B Tumors per mouse 1.2 1.0 0.8 0.6 0.4 0.2 0.0 All T-lymph B-lymph Sarcomas Carcinomas Germ cell Tumor type -/- (n = 46) Q/- (n = 76) Q/Q (n = 31) Tumors per mouse 1.2 1.0 0.8 0.6 0.4 0.2 0.0
Epigenetics. Lyle Armstrong. UJ Taylor & Francis Group. f'ci Garland Science NEW YORK AND LONDON
 ... Epigenetics Lyle Armstrong f'ci Garland Science UJ Taylor & Francis Group NEW YORK AND LONDON Contents CHAPTER 1 INTRODUCTION TO 3.2 CHROMATIN ARCHITECTURE 21 THE STUDY OF EPIGENETICS 1.1 THE CORE
Computer Science, Biology, and Biomedical Informatics (CoSBBI) Outline. Molecular Biology of Cancer AND. Goals/Expectations. David Boone 7/1/2015
 Outline. Molecular Biology of Cancer AND. Goals/Expectations. David Boone 7/1/2015") Goals/Expectations Computer Science, Biology, and Biomedical (CoSBBI) We want to excite you about the world of computer science, biology, and biomedical informatics. Experience what it is like to be a
Goals/Expectations Computer Science, Biology, and Biomedical (CoSBBI) We want to excite you about the world of computer science, biology, and biomedical informatics. Experience what it is like to be a
sequences of a styx mutant reveals a T to A transversion in the donor splice site of intron 5
 sfigure 1 Styx mutant mice recapitulate the phenotype of SHIP -/- mice. (A) Analysis of the genomic sequences of a styx mutant reveals a T to A transversion in the donor splice site of intron 5 (GTAAC
Nature Genetics: doi: /ng Supplementary Figure 1
 Supplementary Figure 1 MSI2 interactors are associated with the riboproteome and are functionally relevant. (a) Coomassie blue staining of FLAG-MSI2 immunoprecipitated complexes. (b) GO analysis of MSI2-interacting
Epigenetics DNA methylation. Biosciences 741: Genomics Fall, 2013 Week 13. DNA Methylation
 Epigenetics DNA methylation Biosciences 741: Genomics Fall, 2013 Week 13 DNA Methylation Most methylated cytosines are found in the dinucleotide sequence CG, denoted mcpg. The restriction enzyme HpaII
Supplementary Figure 1. Successful excision of genes from WBM lysates and
 Supplementary Information: Supplementary Figure 1. Successful excision of genes from WBM lysates and survival of mice with different genotypes. (a) The proper excision of Pten, p110α, p110α and p110δ was
RUNX1 and FPD/AML Translational Research. The Leukemia and Lymphoma Society / Babich Family Foundation Partnership. September 2016
 www.lls.org www.runx1.com RUNX1 and FPD/AML Translational Research The Leukemia and Lymphoma Society / Babich Family Foundation Partnership September 2016 Prepared by L. Greenberger, PhD Chief Scientific
p53 cooperates with DNA methylation and a suicidal interferon response to maintain epigenetic silencing of repeats and noncoding RNAs
 p53 cooperates with DNA methylation and a suicidal interferon response to maintain epigenetic silencing of repeats and noncoding RNAs 2013, Katerina I. Leonova et al. Kolmogorov Mikhail Noncoding DNA Mammalian
HEK293FT cells were transiently transfected with reporters, N3-ICD construct and
 Supplementary Information Luciferase reporter assay HEK293FT cells were transiently transfected with reporters, N3-ICD construct and increased amounts of wild type or kinase inactive EGFR. Transfections
A Hepatocyte Growth Factor Receptor (Met) Insulin Receptor hybrid governs hepatic glucose metabolism SUPPLEMENTARY FIGURES, LEGENDS AND METHODS
 Insulin Receptor hybrid governs hepatic glucose metabolism SUPPLEMENTARY FIGURES, LEGENDS AND METHODS") A Hepatocyte Growth Factor Receptor (Met) Insulin Receptor hybrid governs hepatic glucose metabolism Arlee Fafalios, Jihong Ma, Xinping Tan, John Stoops, Jianhua Luo, Marie C. DeFrances and Reza Zarnegar
A Hepatocyte Growth Factor Receptor (Met) Insulin Receptor hybrid governs hepatic glucose metabolism Arlee Fafalios, Jihong Ma, Xinping Tan, John Stoops, Jianhua Luo, Marie C. DeFrances and Reza Zarnegar
DNA methylation & demethylation
 DNA methylation & demethylation Lars Schomacher (Group Christof Niehrs) What is Epigenetics? Epigenetics is the study of heritable changes in gene expression (active versus inactive genes) that do not
Supplementary Information Titles Journal: Nature Medicine
 Supplementary Information Titles Journal: Nature Medicine Article Title: Corresponding Author: Supplementary Item & Number Supplementary Fig.1 Fig.2 Fig.3 Fig.4 Fig.5 Fig.6 Fig.7 Fig.8 Fig.9 Fig. Fig.11
The autoimmune disease-associated PTPN22 variant promotes calpain-mediated Lyp/Pep
 SUPPLEMENTARY INFORMATION The autoimmune disease-associated PTPN22 variant promotes calpain-mediated Lyp/Pep degradation associated with lymphocyte and dendritic cell hyperresponsiveness Jinyi Zhang, Naima
Analysis of Massively Parallel Sequencing Data Application of Illumina Sequencing to the Genetics of Human Cancers
 Analysis of Massively Parallel Sequencing Data Application of Illumina Sequencing to the Genetics of Human Cancers Gordon Blackshields Senior Bioinformatician Source BioScience 1 To Cancer Genetics Studies
Supplementary Figure 1
 Supplementary Figure 1 Asymmetrical function of 5p and 3p arms of mir-181 and mir-30 families and mir-142 and mir-154. (a) Control experiments using mirna sensor vector and empty pri-mirna overexpression
Breeding scheme, transgenes, histological analysis and site distribution of SB-mutagenized osteosarcoma.
 Supplementary Figure 1 Breeding scheme, transgenes, histological analysis and site distribution of SB-mutagenized osteosarcoma. (a) Breeding scheme. R26-LSL-SB11 homozygous mice were bred to Trp53 LSL-R270H/+
EPIGENETIC RE-EXPRESSION OF HIF-2α SUPPRESSES SOFT TISSUE SARCOMA GROWTH
 EPIGENETIC RE-EXPRESSION OF HIF-2α SUPPRESSES SOFT TISSUE SARCOMA GROWTH Supplementary Figure 1. Supplementary Figure 1. Characterization of KP and KPH2 autochthonous UPS tumors. a) Genotyping of KPH2
Soft Agar Assay. For each cell pool, 100,000 cells were resuspended in 0.35% (w/v)
") SUPPLEMENTARY MATERIAL AND METHODS Soft Agar Assay. For each cell pool, 100,000 cells were resuspended in 0.35% (w/v) top agar (LONZA, SeaKem LE Agarose cat.5004) and plated onto 0.5% (w/v) basal agar.
SUPPLEMENTARY MATERIAL AND METHODS Soft Agar Assay. For each cell pool, 100,000 cells were resuspended in 0.35% (w/v) top agar (LONZA, SeaKem LE Agarose cat.5004) and plated onto 0.5% (w/v) basal agar.
MATERIALS AND METHODS. Neutralizing antibodies specific to mouse Dll1, Dll4, J1 and J2 were prepared as described. 1,2 All
 MATERIALS AND METHODS Antibodies (Abs), flow cytometry analysis and cell lines Neutralizing antibodies specific to mouse Dll1, Dll4, J1 and J2 were prepared as described. 1,2 All other antibodies used
Supplementary Figure 1: Expression of NFAT proteins in Nfat2-deleted B cells (a+b) Protein expression of NFAT2 (a) and NFAT1 (b) in isolated splenic
 Protein expression of NFAT2 (a) and NFAT1 (b) in isolated splenic") Supplementary Figure 1: Expression of NFAT proteins in Nfat2-deleted B cells (a+b) Protein expression of NFAT2 (a) and NFAT1 (b) in isolated splenic B cells from WT Nfat2 +/+, TCL1 Nfat2 +/+ and TCL1 Nfat2
Supplementary Figure 1: Expression of NFAT proteins in Nfat2-deleted B cells (a+b) Protein expression of NFAT2 (a) and NFAT1 (b) in isolated splenic B cells from WT Nfat2 +/+, TCL1 Nfat2 +/+ and TCL1 Nfat2
Epigenetics: Basic Principals and role in health and disease
 Epigenetics: Basic Principals and role in health and disease Cambridge Masterclass Workshop on Epigenetics in GI Health and Disease 3 rd September 2013 Matt Zilbauer Overview Basic principals of Epigenetics
Supplementary Table; Supplementary Figures and legends S1-S21; Supplementary Materials and Methods
 Silva et al. PTEN posttranslational inactivation and hyperactivation of the PI3K/Akt pathway sustain primary T cell leukemia viability Supplementary Table; Supplementary Figures and legends S1-S21; Supplementary
Stem Cell Epigenetics
 Stem Cell Epigenetics Philippe Collas University of Oslo Institute of Basic Medical Sciences Norwegian Center for Stem Cell Research www.collaslab.com Source of stem cells in the body Somatic ( adult )
MicroRNA expression profiling and functional analysis in prostate cancer. Marco Folini s.c. Ricerca Traslazionale DOSL
 MicroRNA expression profiling and functional analysis in prostate cancer Marco Folini s.c. Ricerca Traslazionale DOSL What are micrornas? For almost three decades, the alteration of protein-coding genes
Supplementary Figure 1: Comparison of acgh-based and expression-based CNA analysis of tumors from breast cancer GEMMs.
 Supplementary Figure 1: Comparison of acgh-based and expression-based CNA analysis of tumors from breast cancer GEMMs. (a) CNA analysis of expression microarray data obtained from 15 tumors in the SV40Tag
Nature Immunology: doi: /ni.3412
 Supplementary Figure 1 Gata1 expression in heamatopoietic stem and progenitor populations. (a) Unsupervised clustering according to 100 top variable genes across single pre-gm cells. The two main cell
Studying The Role Of DNA Mismatch Repair In Brain Cancer Malignancy
 Kavya Puchhalapalli CALS Honors Project Report Spring 2017 Studying The Role Of DNA Mismatch Repair In Brain Cancer Malignancy Abstract Malignant brain tumors including medulloblastomas and primitive neuroectodermal
p.r623c p.p976l p.d2847fs p.t2671 p.d2847fs p.r2922w p.r2370h p.c1201y p.a868v p.s952* RING_C BP PHD Cbp HAT_KAT11
 ARID2 p.r623c KMT2D p.v650fs p.p976l p.r2922w p.l1212r p.d1400h DNA binding RFX DNA binding Zinc finger KMT2C p.a51s p.d372v p.c1103* p.d2847fs p.t2671 p.d2847fs p.r4586h PHD/ RING DHHC/ PHD PHD FYR N
Supplementary Figure 1. Efficiency of Mll4 deletion and its effect on T cell populations in the periphery. Nature Immunology: doi: /ni.
 Supplementary Figure 1 Efficiency of Mll4 deletion and its effect on T cell populations in the periphery. Expression of Mll4 floxed alleles (16-19) in naive CD4 + T cells isolated from lymph nodes and
Meeting Report. From December 8 to 11, 2012 at Atlanta, GA, U.S.A
 Meeting Report Affiliation Department of Transfusion Medicine and Cell Therapy Name Hisayuki Yao Name of the meeting Period and venue Type of your presentation Title of your presentation The 54 th Annual
Sirt1 Hmg20b Gm (0.17) 24 (17.3) 877 (857)
 24 (17.3) 877 (857)") 3 (0.17) 24 (17.3) Sirt1 Hmg20 Gm4763 877 (857) c d Suppl. Figure 1. Screen validation for top candidate antagonists of Dot1L (a) Numer of genes with one (gray), two (cyan) or three (red) shrna scored
3 (0.17) 24 (17.3) Sirt1 Hmg20 Gm4763 877 (857) c d Suppl. Figure 1. Screen validation for top candidate antagonists of Dot1L (a) Numer of genes with one (gray), two (cyan) or three (red) shrna scored
The Biology and Genetics of Cells and Organisms The Biology of Cancer
 The Biology and Genetics of Cells and Organisms The Biology of Cancer Mendel and Genetics How many distinct genes are present in the genomes of mammals? - 21,000 for human. - Genetic information is carried
Epigenetic programming in chronic lymphocytic leukemia
 Epigenetic programming in chronic lymphocytic leukemia Christopher Oakes 10 th Canadian CLL Research Meeting September 18-19 th, 2014 Epigenetics and DNA methylation programming in normal and tumor cells:
SUPPLEMENTARY INFORMATION
 doi:10.1038/nature11095 Supplementary Table 1. Summary of the binding between Angptls and various Igdomain containing receptors as determined by flow cytometry analysis. The results were summarized from
The silence of the genes: clinical applications of (colorectal) cancer epigenetics
 cancer epigenetics") The silence of the genes: clinical applications of (colorectal) cancer epigenetics Manon van Engeland, PhD Dept. of Pathology GROW - School for Oncology & Developmental Biology Maastricht University Medical
The silence of the genes: clinical applications of (colorectal) cancer epigenetics Manon van Engeland, PhD Dept. of Pathology GROW - School for Oncology & Developmental Biology Maastricht University Medical
Results. Abstract. Introduc4on. Conclusions. Methods. Funding
 . expression that plays a role in many cellular processes affecting a variety of traits. In this study DNA methylation was assessed in neuronal tissue from three pigs (frontal lobe) and one great tit (whole
BIO360 Fall 2013 Quiz 1
 BIO360 Fall 2013 Quiz 1 1. Examine the diagram below. There are two homologous copies of chromosome one and the allele of YFG carried on the light gray chromosome has undergone a loss-of-function mutation.
Supporting Information
 Supporting Information Franco et al. 10.1073/pnas.1015557108 SI Materials and Methods Drug Administration. PD352901 was dissolved in 0.5% (wt/vol) hydroxyl-propyl-methylcellulose, 0.2% (vol/vol) Tween
Supplementary Figure 1. Generation of knockin mice expressing L-selectinN138G. (a) Schematics of the Sellg allele (top), the targeting vector, the
 Schematics of the Sellg allele (top), the targeting vector, the") Supplementary Figure 1. Generation of knockin mice expressing L-selectinN138G. (a) Schematics of the Sellg allele (top), the targeting vector, the targeted allele in ES cells, and the mutant allele in
Supplementary Figure 1. Generation of knockin mice expressing L-selectinN138G. (a) Schematics of the Sellg allele (top), the targeting vector, the targeted allele in ES cells, and the mutant allele in
Supporting Information Table of Contents
 Supporting Information Table of Contents Supporting Information Figure 1 Page 2 Supporting Information Figure 2 Page 4 Supporting Information Figure 3 Page 5 Supporting Information Figure 4 Page 6 Supporting
7SK ChIRP-seq is specifically RNA dependent and conserved between mice and humans.
 Supplementary Figure 1 7SK ChIRP-seq is specifically RNA dependent and conserved between mice and humans. Regions targeted by the Even and Odd ChIRP probes mapped to a secondary structure model 56 of the
Tissue of origin determines cancer-associated CpG island promoter hypermethylation patterns
 RESEARCH Open Access Tissue of origin determines cancer-associated CpG island promoter hypermethylation patterns Duncan Sproul 1,2, Robert R Kitchen 1,3, Colm E Nestor 1,2, J Michael Dixon 1, Andrew H
Structural Variation and Medical Genomics
 Structural Variation and Medical Genomics Andrew King Department of Biomedical Informatics July 8, 2014 You already know about small scale genetic mutations Single nucleotide polymorphism (SNPs) Deletions,
SUPPLEMENTARY INFORMATION
 doi:10.1038/nature10866 a b 1 2 3 4 5 6 7 Match No Match 1 2 3 4 5 6 7 Turcan et al. Supplementary Fig.1 Concepts mapping H3K27 targets in EF CBX8 targets in EF H3K27 targets in ES SUZ12 targets in ES
(A) PCR primers (arrows) designed to distinguish wild type (P1+P2), targeted (P1+P2) and excised (P1+P3)14-
 PCR primers (arrows) designed to distinguish wild type (P1+P2), targeted (P1+P2) and excised (P1+P3)14-") 1 Supplemental Figure Legends Figure S1. Mammary tumors of ErbB2 KI mice with 14-3-3σ ablation have elevated ErbB2 transcript levels and cell proliferation (A) PCR primers (arrows) designed to distinguish
1 Supplemental Figure Legends Figure S1. Mammary tumors of ErbB2 KI mice with 14-3-3σ ablation have elevated ErbB2 transcript levels and cell proliferation (A) PCR primers (arrows) designed to distinguish
SUPPLEMENTARY INFORMATION
 doi:10.1038/nature12215 Supplementary Figure 1. The effects of full and dissociated GR agonists in supporting BFU-E self-renewal divisions. BFU-Es were cultured in self-renewal medium with indicated GR
TITLE: A Mouse Model to Investigate the Role of DBC2 in Breast Cancer
 AD Award Number: W81XWH-04-1-0325 TITLE: A Mouse Model to Investigate the Role of DBC2 in Breast Cancer PRINCIPAL INVESTIGATOR: Valerie Boka CONTRACTING ORGANIZATION: University of Texas Health Science
Supplementary Appendix
 Supplementary Appendix This appendix has been provided by the authors to give readers additional information about their work. Supplement to: Choi YL, Soda M, Yamashita Y, et al. EML4-ALK mutations in
Molecular Markers. Marcie Riches, MD, MS Associate Professor University of North Carolina Scientific Director, Infection and Immune Reconstitution WC
 Molecular Markers Marcie Riches, MD, MS Associate Professor University of North Carolina Scientific Director, Infection and Immune Reconstitution WC Overview Testing methods Rationale for molecular testing
Epigenetics Armstrong_Prelims.indd 1 04/11/2013 3:28 pm
 Epigenetics Epigenetics Lyle Armstrong vi Online resources Accessible from www.garlandscience.com, the Student and Instructor Resource Websites provide learning and teaching tools created for Epigenetics.
York criteria, 6 RA patients and 10 age- and gender-matched healthy controls (HCs).
.") MATERIALS AND METHODS Study population Blood samples were obtained from 15 patients with AS fulfilling the modified New York criteria, 6 RA patients and 10 age- and gender-matched healthy controls (HCs).
MATERIALS AND METHODS Study population Blood samples were obtained from 15 patients with AS fulfilling the modified New York criteria, 6 RA patients and 10 age- and gender-matched healthy controls (HCs).
Quantification of early stage lesions for loss of p53 should be shown in the main figures.
 Reviewer #1 (Remarks to the Author): Expert in prostate cancer The manuscript "Clonal dynamics following p53 loss of heterozygosity in Kras-driven cancers" uses a number of novel genetically engineered
Supporting Online Material for
 www.sciencemag.org/cgi/content/full/1171320/dc1 Supporting Online Material for A Frazzled/DCC-Dependent Transcriptional Switch Regulates Midline Axon Guidance Long Yang, David S. Garbe, Greg J. Bashaw*
DNA Methylation and Cancer
 DNA Methylation and Cancer October 25, 2016 Dominic Smiraglia, Ph.D. Department of Cancer Genetics From Alan Wolffe, Science and Medicine, 1999 Vital Statistics Human genome contains 3 billion bp ~ 50,000
Profiles of gene expression & diagnosis/prognosis of cancer. MCs in Advanced Genetics Ainoa Planas Riverola
 Profiles of gene expression & diagnosis/prognosis of cancer MCs in Advanced Genetics Ainoa Planas Riverola Gene expression profiles Gene expression profiling Used in molecular biology, it measures the
Protein SD Units (P-value) Cluster order
 Cluster order") SUPPLEMENTAL TABLE AND FIGURES Table S1. Signature Phosphoproteome of CD22 E12 Transgenic Mouse BPL Cells. T-test vs. Other Protein SD Units (P-value) Cluster order ATPase (Ab-16) 1.41 0.000880 1 mtor
SUPPLEMENTAL TABLE AND FIGURES Table S1. Signature Phosphoproteome of CD22 E12 Transgenic Mouse BPL Cells. T-test vs. Other Protein SD Units (P-value) Cluster order ATPase (Ab-16) 1.41 0.000880 1 mtor
(a) Significant biological processes (upper panel) and disease biomarkers (lower panel)
 Significant biological processes (upper panel) and disease biomarkers (lower panel)") Supplementary Figure 1. Functional enrichment analyses of secretomic proteins. (a) Significant biological processes (upper panel) and disease biomarkers (lower panel) 2 involved by hrab37-mediated secretory
Supplementary Figure 1. Functional enrichment analyses of secretomic proteins. (a) Significant biological processes (upper panel) and disease biomarkers (lower panel) 2 involved by hrab37-mediated secretory
Supplementary Figure 1. Genotyping strategies for Mcm3 +/+, Mcm3 +/Lox and Mcm3 +/- mice and luciferase activity in Mcm3 +/Lox mice. A.
 Supplementary Figure 1. Genotyping strategies for Mcm3 +/+, Mcm3 +/Lox and Mcm3 +/- mice and luciferase activity in Mcm3 +/Lox mice. A. Upper part, three-primer PCR strategy at the Mcm3 locus yielding
Introduction. Cancer Biology. Tumor-suppressor genes. Proto-oncogenes. DNA stability genes. Mechanisms of carcinogenesis.
 Cancer Biology Chapter 18 Eric J. Hall., Amato Giaccia, Radiobiology for the Radiologist Introduction Tissue homeostasis depends on the regulated cell division and self-elimination (programmed cell death)
Chromatin-Based Regulation of Gene Expression
 Chromatin-Based Regulation of Gene Expression.George J. Quellhorst, Jr., PhD.Associate Director, R&D.Biological Content Development Topics to be Discussed Importance of Chromatin-Based Regulation Mechanism
BIO360 Quiz #1. September 14, Name five of the six Hallmarks of Cancer (not emerging hallmarks or enabling characteristics ): (5 points)
: (5 points)") Name: BIO360 Quiz #1 September 14, 2012 1. Name five of the six Hallmarks of Cancer (not emerging hallmarks or enabling characteristics ): (5 points) 2. The controversial hypothesis that only a small subset
Name: BIO360 Quiz #1 September 14, 2012 1. Name five of the six Hallmarks of Cancer (not emerging hallmarks or enabling characteristics ): (5 points) 2. The controversial hypothesis that only a small subset
Supplementary Materials for
 immunology.sciencemag.org/cgi/content/full/2/16/eaan6049/dc1 Supplementary Materials for Enzymatic synthesis of core 2 O-glycans governs the tissue-trafficking potential of memory CD8 + T cells Jossef
Generating Mouse Models of Pancreatic Cancer
 Generating Mouse Models of Pancreatic Cancer Aom Isbell http://www2.massgeneral.org/cancerresourceroom/types/gi/index.asp Spring/Summer 1, 2012 Alexandros Tzatsos, MD PhD Bardeesy Lab: Goals and Objectives
Nature Immunology: doi: /ni Supplementary Figure 1. Gene expression profile of CD4 + T cells and CTL responses in Bcl6-deficient mice.
 Supplementary Figure 1 Gene expression profile of CD4 + T cells and CTL responses in Bcl6-deficient mice. (a) Gene expression profile in the resting CD4 + T cells were analyzed by an Affymetrix microarray
Whitehead Institute for Biomedical Research and Department of Biology, Massachusetts Institute of Technology (MIT), Cambridge, Massachusetts, USA.
, Cambridge, Massachusetts, USA.") Eveline J. Steine, 1 Mathias Ehrich, 2 George W. Bell, 1 Arjun Raj, 3 Seshamma Reddy, 1 Alexander van Oudenaarden, 3 Rudolf Jaenisch, 1 and Heinz G. Linhart 1,4,5 1 Whitehead Institute for Biomedical Research
Eveline J. Steine, 1 Mathias Ehrich, 2 George W. Bell, 1 Arjun Raj, 3 Seshamma Reddy, 1 Alexander van Oudenaarden, 3 Rudolf Jaenisch, 1 and Heinz G. Linhart 1,4,5 1 Whitehead Institute for Biomedical Research
Supplemental Figure S1. RANK expression on human lung cancer cells.
 Supplemental Figure S1. RANK expression on human lung cancer cells. (A) Incidence and H-Scores of RANK expression determined from IHC in the indicated primary lung cancer subgroups. The overall expression
Supplementary Figure 1 IL-27 IL
 Tim-3 Supplementary Figure 1 Tc0 49.5 0.6 Tc1 63.5 0.84 Un 49.8 0.16 35.5 0.16 10 4 61.2 5.53 10 3 64.5 5.66 10 2 10 1 10 0 31 2.22 10 0 10 1 10 2 10 3 10 4 IL-10 28.2 1.69 IL-27 Supplementary Figure 1.
Breast cancer. Risk factors you cannot change include: Treatment Plan Selection. Inferring Transcriptional Module from Breast Cancer Profile Data
 Breast cancer Inferring Transcriptional Module from Breast Cancer Profile Data Breast Cancer and Targeted Therapy Microarray Profile Data Inferring Transcriptional Module Methods CSC 177 Data Warehousing
Nature Immunology: doi: /ni Supplementary Figure 1. Characteristics of SEs in T reg and T conv cells.
 Supplementary Figure 1 Characteristics of SEs in T reg and T conv cells. (a) Patterns of indicated transcription factor-binding at SEs and surrounding regions in T reg and T conv cells. Average normalized
Analysis of small RNAs from Drosophila Schneider cells using the Small RNA assay on the Agilent 2100 bioanalyzer. Application Note
 Analysis of small RNAs from Drosophila Schneider cells using the Small RNA assay on the Agilent 2100 bioanalyzer Application Note Odile Sismeiro, Jean-Yves Coppée, Christophe Antoniewski, and Hélène Thomassin
Nature Immunology: doi: /ni Supplementary Figure 1. Transcriptional program of the TE and MP CD8 + T cell subsets.
 Supplementary Figure 1 Transcriptional program of the TE and MP CD8 + T cell subsets. (a) Comparison of gene expression of TE and MP CD8 + T cell subsets by microarray. Genes that are 1.5-fold upregulated
fl/+ KRas;Atg5 fl/+ KRas;Atg5 fl/fl KRas;Atg5 fl/fl KRas;Atg5 Supplementary Figure 1. Gene set enrichment analyses. (a) (b)
 (b)") KRas;At KRas;At KRas;At KRas;At a b Supplementary Figure 1. Gene set enrichment analyses. (a) GO gene sets (MSigDB v3. c5) enriched in KRas;Atg5 fl/+ as compared to KRas;Atg5 fl/fl tumors using gene set
KRas;At KRas;At KRas;At KRas;At a b Supplementary Figure 1. Gene set enrichment analyses. (a) GO gene sets (MSigDB v3. c5) enriched in KRas;Atg5 fl/+ as compared to KRas;Atg5 fl/fl tumors using gene set
Aberrant Promoter CpG Methylation is a Mechanism for Lack of Hypoxic Induction of
 Aberrant Promoter CpG Methylation is a Mechanism for Lack of Hypoxic Induction of PHD3 in a Diverse Set of Malignant Cells Abstract The prolyl-hydroxylase domain family of enzymes (PHD1-3) plays an important
Genetic suppressors and enhancers provide clues to gene regulation and genetic pathways
 Genetic suppressors and enhancers provide clues to gene regulation and genetic pathways Suppressor mutation: a second mutation results in a less severe phenotype than the original mutation Suppressor mutations
Supplementary Figure S1. Venn diagram analysis of mrna microarray data and mirna target analysis. (a) Western blot analysis of T lymphoblasts (CLS)
 Western blot analysis of T lymphoblasts (CLS)") Supplementary Figure S1. Venn diagram analysis of mrna microarray data and mirna target analysis. (a) Western blot analysis of T lymphoblasts (CLS) and their exosomes (EXO) in resting (REST) and activated
Supplementary Figure S1. Venn diagram analysis of mrna microarray data and mirna target analysis. (a) Western blot analysis of T lymphoblasts (CLS) and their exosomes (EXO) in resting (REST) and activated
Supplementary Materials for
 www.sciencesignaling.org/cgi/content/full/9/430/ra57/dc1 Supplementary Materials for The 4E-BP eif4e axis promotes rapamycinsensitive growth and proliferation in lymphocytes Lomon So, Jongdae Lee, Miguel
Gene Expression DNA RNA. Protein. Metabolites, stress, environment
 Gene Expression DNA RNA Protein Metabolites, stress, environment 1 EPIGENETICS The study of alterations in gene function that cannot be explained by changes in DNA sequence. Epigenetic gene regulatory
Tumor suppressor genes D R. S H O S S E I N I - A S L
 Tumor suppressor genes 1 D R. S H O S S E I N I - A S L What is a Tumor Suppressor Gene? 2 A tumor suppressor gene is a type of cancer gene that is created by loss-of function mutations. In contrast to
Computational Analysis of UHT Sequences Histone modifications, CAGE, RNA-Seq
 Computational Analysis of UHT Sequences Histone modifications, CAGE, RNA-Seq Philipp Bucher Wednesday January 21, 2009 SIB graduate school course EPFL, Lausanne ChIP-seq against histone variants: Biological
Epigenetic regulation of macrophage polarization and inflammation by DNA methylation in obesity
 Downloaded from http:// on December 17, 2017. https://doi.org/10.1172/jci.insight.87748 Epigenetic regulation of macrophage polarization and inflammation by DNA methylation in obesity Xianfeng Wang, 1
Supplementary Figure 1. DNA methylation of the adiponectin promoter R1, Pparg2, and Tnfa promoter in adipocytes is not affected by obesity.
 Supplementary Figure 1. DNA methylation of the adiponectin promoter R1, Pparg2, and Tnfa promoter in adipocytes is not affected by obesity. (a) Relative amounts of adiponectin, Ppar 2, C/ebp, and Tnf mrna