Nature Neuroscience: doi: /nn Supplementary Figure 1. Iliopsoas and quadratus lumborum motor neurons in the L2 spinal segment.
|
|
|
- Winfred McLaughlin
- 6 years ago
- Views:
Transcription
 using the ex vivo spinal cord preparation to identify the rostral and caudal borders (dotted line) of the L2 spinal")
1 Supplementary Figure 1 Iliopsoas and quadratus lumborum motor neurons in the L2 spinal segment. (A) IL and QL motor neurons were labeled after CTb-488 (green) muscle injections at birth. At P4, the L2 motor neurons were retrogradely filled with Texas Red Dextran (red) using the ex vivo spinal cord preparation to identify the rostral and caudal borders (dotted line) of the L2 spinal segment. IL and QL motor neurons (CTb-488, green) were quantified as a percentage of ChAT (blue) immunoreactive motor neurons. (B) Transverse sections of the L2 motor neuron nucleus containing IL/QL motor neurons (CTb-488, green) and ChAT immunoreactivity (red). Merged image is shown at the bottom. R: rostral, C: caudal, D: dorsal, V: ventral, M: medial, L: lateral.
2 Supplementary Figure 2 Resistant (L5) SMA motor neurons are not hyperexcitable, whereas vulnerable (L2) SMA motor neurons exhibit the first signs of dysfunction at P2. (A) Schematic of experimental protocol. Extracellular electrodes in the L2 ventral root (1) and L2 dorsal root (2) were used for stimulation. Responses from individual motor neurons were recorded intracellularly (3) (whole-cell patch clamp) using the intact ex vivo spinal cord preparation. Traces on the right show: an antidromically evoked action potential following ventral root stimulation (1), a synaptic response from a motor neuron following dorsal root stimulation (2) and current-to-voltage relationship in whole-cell
3 configuration (3). (B) Input resistance-time constant relationship for L2 WT and SMA motor neurons at P2. The SMA-affected motor neurons exhibit high input resistance and high values of time constant (marked by red dotted lines). The SMA-unaffected motor neurons exhibit similar values of input resistance and time constant with WT motor neurons (marked by blue dotted lines). (C) Membrane responses following current injections in a WT and an SMA L5 motor neuron at P4. (D) Current/voltage relationships for the two motor neurons shown in (C). (E) The average input resistance (R in), membrane time constant (τ) and rheobase current (I Rh) for WT (n=4) and SMA (n=5) L5 motor neurons at P4. (F) Intracellular responses to supramaximal stimulation of the L5 dorsal root in a WT and a SMA motor neuron at P4. The peak amplitude of monosynaptic EPSP is indicated by arrows. The arrowheads show the stimulus artifact. (G) The average peak EPSP amplitude for WT (n=4) and SMA (n=5) L5 motor neurons. (H) Relationship between transverse area of L2 motor neurons and the number of VGluT1 synapses in WT and SMA motor neurons at P2. (I) The average transverse area of WT and SMA motor neurons at P2.
 Transverse sections from WT and SMA spinal cords at P0, P4 and P11 showing parvalbumin (green) and ChAT (blue) immunoreactivity. Arrows indicate parvalbumin+ interneurons at P11.")
4 Supplementary Figure 3 Parvalbumin expression in the spinal cord and brain during first postnatal week. (A) Transverse sections from WT and SMA spinal cords at P0, P4 and P11 showing parvalbumin (green) and ChAT (blue) immunoreactivity. Arrows indicate parvalbumin+ interneurons at P11. DRG: dorsal root ganglion. (B) Parvalbumin (green) and NeuN (red) expression in the cerebellum, hippocampus and cortex in P5 WT mice. (C) Sagittal section of the brain following transection at a high medulla level in a P3 WT mouse. Arrow indicates the level of complete
5 transection. (D) Average righting times before and 3 hours after transection. NS: no significant difference (p=0.20, Mann-Whitney test).
 and P12 (B). Nuclear stain DAPI in blue.")
6 Supplementary Figure 4 Absence of parvalbumin from the quadratus lumborum muscle during the first 2 postnatal weeks. Sections from QL and EDL muscles immunoreacted against parvalbumin at P5 (A) and P12 (B). Nuclear stain DAPI in blue.
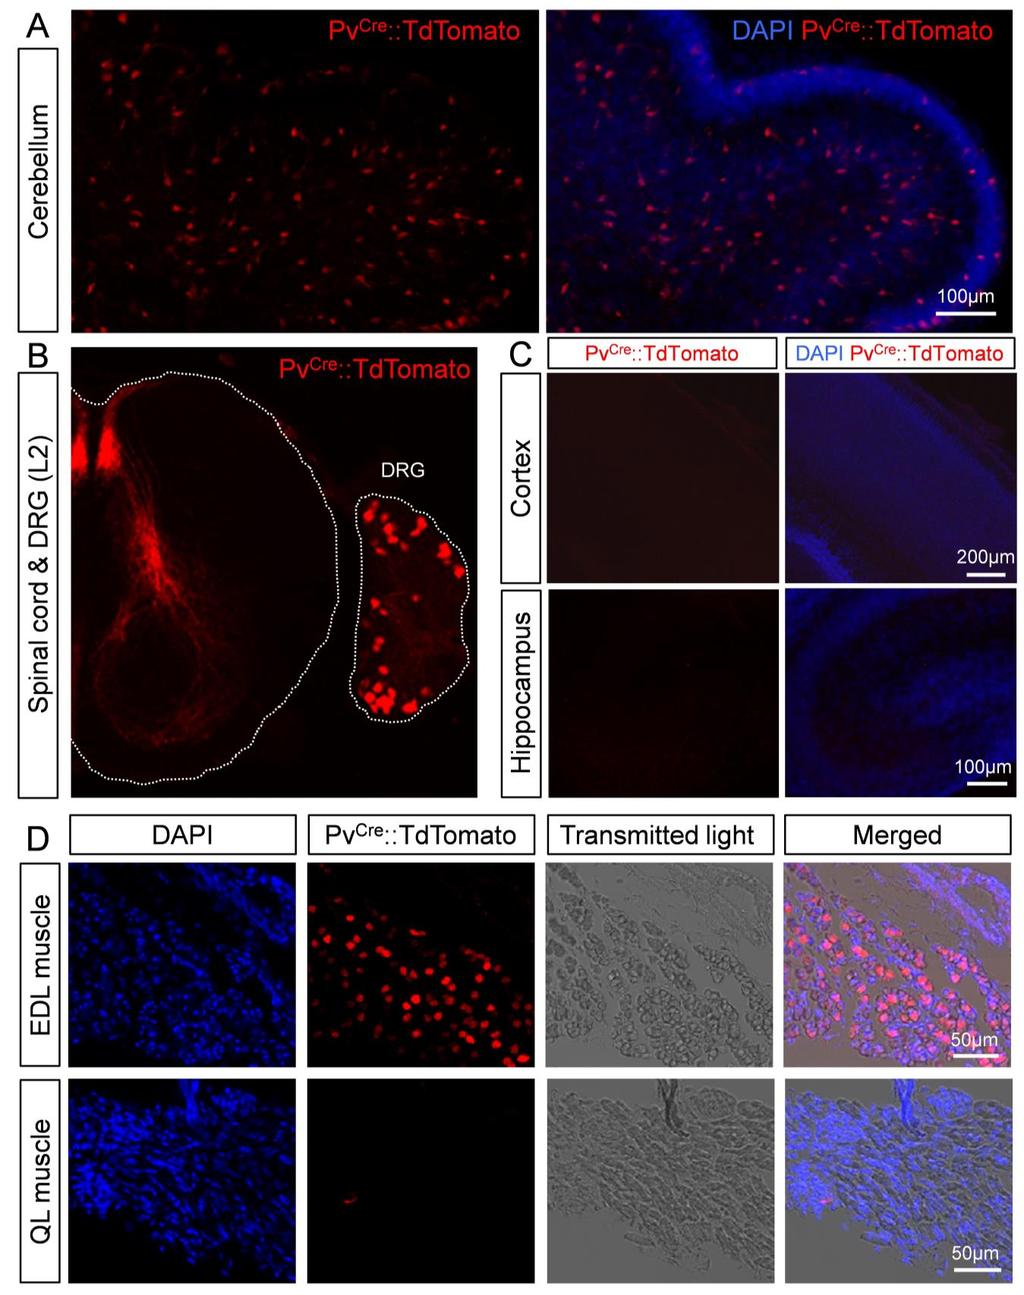
7 Supplementary Figure 5
8 Expression of the fluorescent reporter TdTomato in Pv Cre mice. Expression of TdTomato (red) and DAPI (blue) in cerebellum (A), spinal cord and DRG in the L2 segment (B) and its absence in cortex and hippocampus (C).(D) shows examples from EDL and QL muscles. TdTomato was only observed in EDL muscle.
 driven by ChAT::Cre, ChAT immunoreactivity (green) and retrogradely filled motor neurons with Cascade Blue Dextran (blue) from the ventral root and their merged image.")
9 Supplementary Figure 6 Validation of selective upregulation of SMN protein in proprioceptive and motor neurons (A) Confocal images from L2 spinal segment at P11 showing motor neurons expressing TdTomato (red) driven by ChAT::Cre, ChAT immunoreactivity (green) and retrogradely filled motor neurons with Cascade Blue Dextran (blue) from the ventral root and their merged image. Graph shows the percentage expression of TdTomato+ to ChAT+ motor neurons. (B) Confocal images from an L2 dorsal root ganglion at P11 showing TdTomato (red) expression driven by Pv Cre, Parvalbumin (Pv) immunoreactivity (green) and their merged image. Graph shows the percentage expression of TdTomato+ to Paralbumin+ neurons. (C) Confocal images from L2 ChAT+ motor neurons (red) and Cre immunoreactivity (green) in ChAT Cre mice at P11 and their merged image. Graph indicates the percentage of ChAT+ motor neurons expressing Cre. (D) Confocal images from an L2 dorsal root ganglion showing Parvalbumin (white) and Cre (red) immunoreactivity in Pv Cre mice at P11. Yellow arrows indicate co-localization and blue arrow indicates no co-localization. Graph indicates the percentage of Parvalbumin+ neurons expressing Cre. (E) Expression of Gems (arrows) revealed by SMN immunoreactivity (yellow) in nuclei (nuclear stain DAPI in blue) of proprioceptive neurons labeled by parvalbumin (red) in L2 dorsal root ganglia in WT, SMA and SMA+Pv Cre mice at P4. (F) Similar to (A) but for motor neurons labeled by ChAT immunoreactivity (red) in the L2 segment of the spinal cord in WT, SMA and SMA+ChAT Cre mice at P4. (G) The average percentage expression of Gems in proprioceptive neurons in WT, SMA, SMA+Pv Cre and SMA+ChAT Cre mice at P4. (H) The average percentage expression of Gems in motor neurons in WT, SMA, SMA+Pv Cre and SMA+ChAT Cre mice at P4.
 Location of intracellularly recorded L2 WT and SMA motor neurons within the motor neuron nucleus at P4. The grey line indicates the approximate border of the motor neuron nucleus.")
10 Supplementary Figure 7 Changes in motor neuron input resistance do not depend on motor neuron soma size. (A) Location of intracellularly recorded L2 WT and SMA motor neurons within the motor neuron nucleus at P4. The grey line indicates the approximate border of the motor neuron nucleus. The blue dotted line indicates the approximate grey-white matter border. The solid blue line indicates the edge of the spinal cord. The location of the medial motor nucleus (MMC) is noted in a few instances. Scale bars: 50 μm. D: dorsal, V: ventral, M: medial, L: lateral. (B) Confocal images (single optical plane) of a WT and an SMA P4 L2 motor neuron filled with Neurobiotin following intracellular recording. Scale bar applies to both images. (C) Graph shows the relationship between the input resistance and the corresponding soma size for 5 WT and 4 SMA motor neurons. (D) Average soma size (left graph) and input resistance (right graph) for the WT and SMA motor neurons shown in (C). * P= 0.02, t-test. All data are represented as mean ± s.e.m. For details, see online methods checklist.
 Z-stack projection of confocal images from retrogradely labeled L2 motor neurons (blue) and VGluT1 synaptic boutons (green) from WT, SMA, SMA+Pv Cre, SMA+ChAT Cre and SMA+(Pv+ChAT) Cre mice at")
11 Supplementary Figure 8 Maintenance of rescued VGluT1 synapses at P11. (A) Z-stack projection of confocal images from retrogradely labeled L2 motor neurons (blue) and VGluT1 synaptic boutons (green) from WT, SMA, SMA+Pv Cre, SMA+ChAT Cre and SMA+(Pv+ChAT) Cre mice at P11. The total distance in the z-axis for all images was 7 μm (20 optical planes at 0.35 µm intervals). (B) The average number of VGluT1 boutons on somata of L2 WT, SMA, SMA+Pv Cre, SMA+ChAT Cre and SMA+(Pv+ChAT) Cre motor neurons at P11. # P<0.05, ## P<0.01, ### P<0.001, one-way ANOVA, Tukey's post hoc analysis [SMA v SMA+Pv Cre, SMA v SMA+ChAT Cre and SMA v SMA+(Pv+ChAT) Cre ]. * P<0.05, ** P<0.01, *** P<0.001, one-way ANOVA, Tukey's post hoc analysis [WT v SMA, WT v SMA+Pv Cre, SMA v SMA+ChAT Cre and WT v SMA+(Pv+ChAT) Cre ]. All data are represented as mean ± s.e.m. For details, see online methods checklist. (C) VGluT1 synaptic density on 50 μm dendritic compartments from the soma, for the same groups shown in (B). # P<0.05, ## P<0.01, ### P<0.001, one-way ANOVA, Tukey's post hoc analysis [SMA v SMA+Pv Cre, SMA v SMA+ChAT Cre and SMA v SMA+(Pv+ChAT) Cre ]. *** P<0.001, one-way ANOVA, Tukey's post hoc analysis [WT v SMA, SMA v SMA+ChAT Cre ]. All data are represented as mean ± s.e.m. For details, see online methods checklist.
12 Supplementary Figure 9 Variability in rheobase, required for motor neuron repetitive firing at P2, and absence of changes in firing frequencies for resistant SMA motor neurons at P4.
13 (A) Frequency to current plots for seven WT motor neurons at P2. (B) Frequency to current plots for six SMA-unaffected motor neurons at P2. (C) Frequency to current plots for four SMA-affected motor neurons at P2. (D) Repetitive firing following 50 pa current injection above the minimum current required for continuous spiking, in a WT and an SMA L5 motor neuron at P4. (E) Frequency-to-current relationships for the two groups shown in (D).
14 Supplementary Figure 10 NMJ functional assays and lifespan of SMA mice with selective restoration of SMN in either proprioceptive neurons, motor neurons or both neuronal classes. (A) Schematic showing the set-up used to record the compound muscle action potential (CMAP) from the QL muscle following stimulation of the L2 ventral root at P4. (B) CMAP responses at 20 Hz stimulation frequency. (C) CMAP response before (black) and after 30 µm pancuronium (red). Arrow indicates the stimulus artifact. (D) Average lifespan in SMA+Pv Cre+ compared to SMA+Pv Cre- mice. ** P=0.013, unpaired t-test. (E) Average lifespan in SMA+ChAT Cre+ and SMA+(Pv+ChAT) Cre+ compared to SMA+ChAT Cre- mice. * P<0.05, one-way ANOVA, Tukey's post hoc analysis SMA+ChAT Cre- v SMA+ChAT Cre+ ; *** P<0.001, one-way ANOVA, Tukey's post hoc analysis, SMA+ChAT Cre- v SMA+(Pv+ChAT) Cre+.
 Confocal images of NMJs from the QL muscle labeled by the presynaptic markers synaptophysin (green), neurofilament (blue) and the postsynaptic marker bungarotoxin (red) in Pv TeNT mouse at P4.")
15 Supplementary Figure 11 Input resistance, motor neuron numbers, NMJ innervation and function in Pv TeNT mice. (A) Average number of L2 motor neurons in WT and Pv TeNT mice. (B) Confocal images of NMJs from the QL muscle labeled by the presynaptic markers synaptophysin (green), neurofilament (blue) and the postsynaptic marker bungarotoxin (red) in Pv TeNT mouse at P4. (C) Percentage of innervation of the QL muscle in Pv TeNT mouse. No denervation was observed. (D) A compound muscle action potential (CMAP) recorded from the QL muscle following stimulation of the L2 ventral root in a Pv TeNT mouse at P4. (E) The average peak CMAP amplitude in WT and Pv TeNT mice at P4. (F) Current-to-voltage relationship in an L5 WT and Pv TeNT motor neurons. (G) I-V plots for the motor neurons shown in (F). (H) Average of input resistance for L5 WT (black) and Pv TeNT (purple) motor neurons. ** p<0.01, t-test.
16
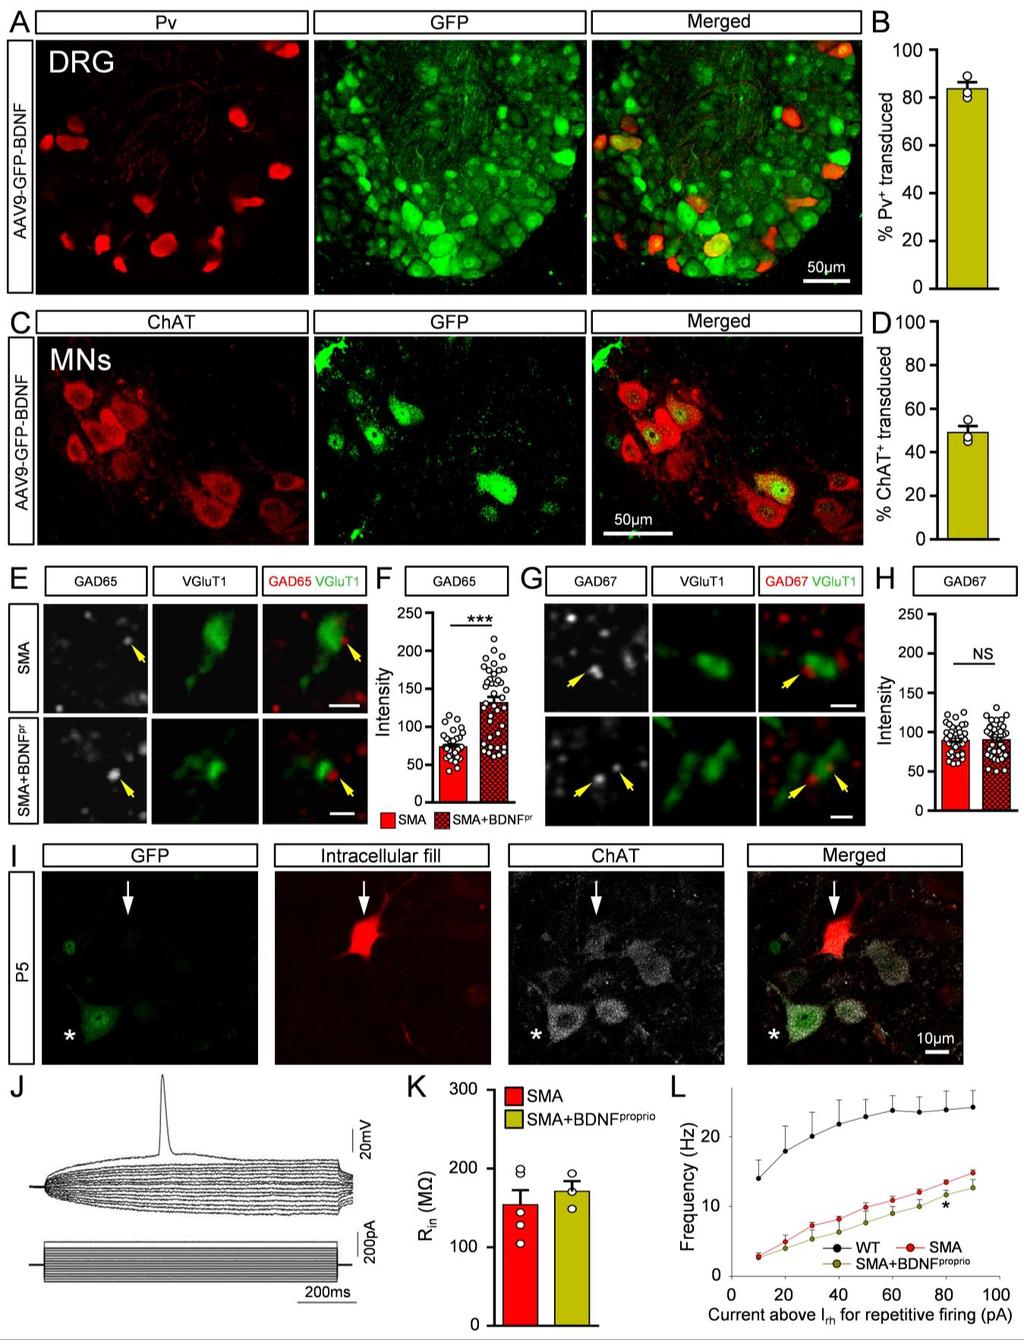
17 Supplementary Figure 12 Overexpression of BDNF in SMA proprioceptive neurons does not affect the input resistance or firing frequency of SMA motor neurons. (A) Images from L2 DRG (at P5) with parvalbumin (red) and GFP (green) immunoreactivity, following ICV injection with AAV9-GFP- BDNF at P0. (B) Percentage of parvalbumin+ neurons transduced by AAV9-GFP-BDNF. (C) Images of ChAT+ motor neurons (red) and GFP (green) following injection with AAV9-GFP-BDNF. (D) Percentage of motor neurons transduced by AAV9-GFP-BDNF. (E) Immunoreactivity of GAD65 (red) in GABApre terminals contacting VGluT1 (green) proprioceptive afferent terminals in SMA (top row) and SMA+AAV9-BDNF (bottom row) P5 mice. Yellow arrows indicate GABApre terminals. (F) Synaptic marker intensity measurements in GAD65+ GABApre terminals at P5. (GAD65: 39 terminals, 3 mice/experimental group). *** P<0.001, Mann-Whitney test. (G) Immunoreactivity of GAD67 (red) in GABApre terminals contacting VGluT1 (green) proprioceptive afferent terminals in SMA (top row) and SMA+AAV9-BDNF (bottom row) P5 mice. Yellow arrows indicate GABApre terminals. (H) Synaptic marker intensity measurements (arbitrary units) in GAD67+ GABApre terminals at P5. (GAD67: 39 terminals, 3 mice/experimental group). NS: no significance (P=0.72, Mann-Whitney test). (I) Intracellular recorded and subsequently filled motor neuron (red) combined with GFP (green) and ChAT (white). Arrow indicates that the recorded motor neuron was not transduced by the virus. Asterisk indicates a nearby transduced motor neuron. (J) Current to voltage relationship for motor neuron shown in (I). (K) The average input resistance for 3 non-transduced SMA motor neurons (yellow; SMA+AAV9-BDNF proprio ) compared with SMA motor neurons (red; SMA-uninjected). (L) The firing frequency in 3 non-transduced SMA motor neurons was similar to SMA motor neurons.
18 Supplementary Figure 13 Afterhyperpolarization properties, effects of GxTx-1E on input resistance and trough voltage analysis in WT and SMA motor neurons. (A) Afterhyperpolarization (AHP) in a WT and SMA motor neuron at P4. The AHP was measured from the first action potential evoked following current injection. The AHP duration is indicated between the two grey vertical lines. The AHP amplitude was calculated between the red dotted line (membrane voltage prior to spike initiation) to the peak negative potential. (B) The average AHP duration (left) and amplitude (right) in WT and SMA motor neurons at P4. (C) Superimposed membrane responses (top) to current injections (bottom) before and after GxTx-1E exposure. (D) Current-to-voltage relationship before (black) and after GxTx-1E (red) exposure. (E) Average values of input resistance before and after GxTx-1E in WT and SMA motor neurons. Lines indicate the change in input
19 resistance for the individual motor neurons. (F) Superimposed recordings from repetitive firing at a low frequency (black) and twice that frequency (blue) in a WT (top) and an SMA (bottom) motor neuron. On the right, traces at higher voltage to indicate the change in trough voltage (dotted red lines). (G) The average trough voltage change in WT (n=8) and SMA (n=6) motor neurons. ** P=0.0023, Mann-Whitney test.
20 Supplementary Figure 14
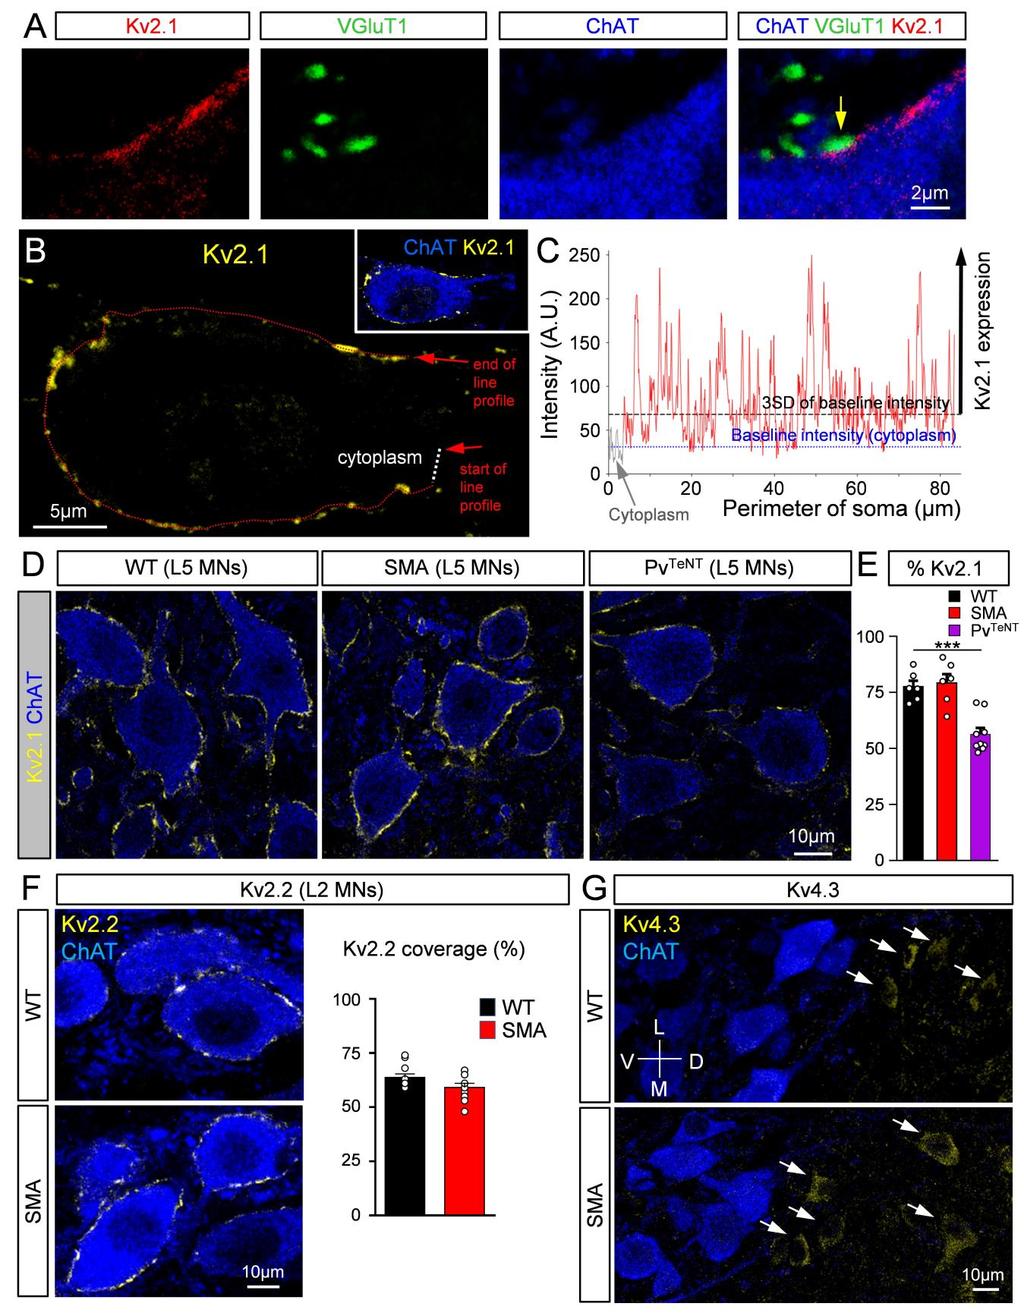
21 Methodology of measuring Kv2.1 surface expression; Kv2.1 in L5 motor neurons in WT, SMA and Pv TeNT motor neurons; Kv2.2 in WT and SMA motor neurons; Kv4.3 expression in WT and SMA mice (A) Kv2.1 (red), VGluT1 (green), ChAT (blue) immunoreactivity. Yellow arrow indicates the association of a VGluT1+ synapse with postsynaptic Kv2.1 expression. (B) Analysis of Kv2.1 expression (yellow) was performed from single optical plane images. Only motor neuron somata (inset; ChAT in blue) were analyzed. To calculate the coverage by Kv2.1, a line (red) was drawn along the soma perimeter to acquire the fluorescence intensity. Baseline fluorescence intensity measurement was achieved by drawing a straight line within the cytoplasm (white). (C) Fluorescence intensity measurement along the perimeter of the motor neuron soma shown in (A). The signal higher than 3 Standard Deviations (black dotted line) of the baseline intensity (blue dotted line) was considered as Kv2.1 expression, while the signal below was considered as background. (D) Single optical level confocal images of L5 motor neurons (ChAT in blue) expressing Kv2.1 immunoreactivity (yellow) in WT, SMA and Pv TeNT mice at P4. (E) Percentage somatic coverage of Kv2.1 in L5 WT, SMA and Pv TeNT motor neurons at P4. *** P=0.001, One-Way ANOVA (WT vs Pv TeNT motor neurons). (F) Single optical plane confocal images of L2 motor neurons (ChAT in blue) expressing Kv2.2 immunoreactivity (yellow) in WT and SMA mice at P4. Graph shows the average percentage somatic coverage of Kv2.2 in L2 WT and SMA motor neurons at P4. (G) Single optical plane confocal images from an area near the motor neuron nucleus (ChAT in blue) in the L2 spinal segment and Kv4.3 immunoreactivity (yellow) in WT and SMA mice at P4. Kv4.3 was prominently expressed in spinal interneurons (arrows) but not in motor neurons. D: dorsal, V: ventral, L: lateral, M: medial.
22
23 Supplementary Figure 15 Reduced sensory motor synaptic excitation impairs motor neuron output through the potassium channel Kv2.1 Dysfunction of excitatory proprioceptive synapses caused by disease (SMA) or blocked neurotransmission at sensory-motor synapses, results in reduced excitatory postsynaptic potentials (EPSPs) and subsequently reduced membrane surface expression of Kv2.1 channels on the somata and proximal dendrites of motor neurons. This reduction leads to a significant decrease in the firing frequency of motor neurons. The inability of motor neurons to fire at high frequencies (rate coding) may be a key determinant in muscle contraction. These events can be significantly ameliorated by increasing excitatory synaptic drive (SMA+Pv Cre experiments or treatment of SMA mice with kainate).

24 Supplementary Figure 166 Western blots for Figure7i.
25 Table 1: List of primers used in this study Allele mrna Oligo Primers from 5' to 3' seq Amplicon size (bp) Smn Res allele Sense ACGCGTACCGTTCGTATAGC Antisense TGAGCACCTTCCTTCTTTTTG 205 SMN Smn common primer Sense GATGATTCTGACATTTGGGATG Smn Antisense TGGCTTATCTGGAGTTTCACAA 325 Beta Gal (Smn KO) Antisense GAGTAACAACCCGTCGGATTC 411 ChAT Cre ChAT Cre allele Sense TCGCCTTCTTGACGAGTTCTTCTG 350 WT allele Sense GTTTGCAGAAGCGGTGGG 272 Common primer Antisense GGCCACTTAGATAGATAATGAGGGGCTC PV Cre PV Cre allele Antisense GCGGAATTCTTAATTAATCAGCG ~100 WT allele Antisense CGAGGGCCATAGAGGATGG ~200 Common primer Sense GGATGCTTGCCGAAGATAAGAGTG
26 Protocol Fixation Preparation Primary antibody Secondary antibody Nuclear stain Dextran dye Dual staining for motor neurons and VGluT1 Immersion fixation 4% PFA in PBS 4 hours 75 µm VGluT1 (guinea pig pab; 1:2000) 1 Donkey anti-guinea pig-cy5 IgG (1:250) 2 - Dextran Alexa Fluor 488 in ddh 2O (0.3 mg/10µl) 3 Triple staining for proprioceptive neurons, SMN, nucleus Triple staining for motor neurons, SMN, nucleus Transcardially perfused 2% PFA in sodium acetate buffer ph6 (see Ref 91) with 2 hour post-fixation Transcardially perfused 2% PFA in sodium acetate buffer ph6 with 2 hour post-fixation Parvalbumin (chicken pab; 1:2000) 1 ; SMN (mouse mab; 1:100) 4 ChAT (goat pab; 1:100) 6 ; SMN (mouse mab; 1:100) 4 Donkey anti-chicken-cy3 IgG (1:250) 2 ; Donkey anti-mouse-cy5 Donkey anti-goat-cy3 IgG (1:250) 2 ; Donkey anti-mouse-cy5 DAPI stain (1:10 000) 5 - DAPI stain (1:10 000) 5 - Dual staining for motor neurons and proprioceptive neurons Immersion fixation 4% PFA in PBS 12 hours 75 µm ChAT (goat pa; 1:100) 6 ; Parvalbumin (chicken pab; 1:2000) 1 Donkey anti-goat-488 IgG (1:250) 2 ; Donkey anti-chicken-cy3 NMJ triple staining for (presynaptic) motor neuron axon terminal, motor neuron axon, (postsynaptic) acetylcholine nicotinic receptors Dual staining for motor neurons and K v2.1 channels Dual staining for motor neurons and K v2.2 channels Dual staining for motor neurons and K v4.3 channels Dual staining for motor neurons and ChAT-Cre Immersion fixation 4% PFA in PBS 20 mins Transcardially perfused 2% PFA in sodium acetate buffer ph6 with 2 hour post-fixation Transcardially perfused 2% PFA in sodium acetate buffer ph6 with 2 hour post-fixation Transcardially perfused 2% PFA in sodium acetate buffer ph6 with 2 hour post-fixation Transcardially perfused 4% PFA in PBS with 4 hour post-fixation Muscle whole-mount Bungarotoxin Alexa Fluor 555 conjugate 3 ; Neurofilament (rabbit pab; 1:500) 6 ; Synaptophysin 1 (guinea pig pab; 1:1000) 7 ChAT (goat pab; 1:100) 6; K v2.1 (mouse mab; 1:2 supernatant clone K89/34) 8 ChAT (goat pab; 1:100) 6; K v2.2 (mouse mab; 1:2 supernatant clone N372B/1) 8 ChAT (goat pab; 1:100) 6; K v4.3 (rabbit pab; 1:100) 9 ChAT (goat pab; 1:100) 6; Cre (rabbit pab; 1:100) 10 Donkey anti-rabbit-488 IgG (1:250) 2 ; Donkey anti-guinea pig- Cy5 Donkey anti-goat-cy3 IgG (1:250) 2 ; Donkey anti-mouse-cy5 Donkey anti-goat-cy3 IgG (1:250) 2 ; Donkey anti-mouse-cy5 Donkey anti-goat-cy3 IgG (1:250) 2 ; Donkey anti-rabbit-cy5 Donkey anti-goat-cy3 IgG (1:250) 2 ; Donkey anti-rabbit-cy5 Dual staining for proprioceptive neurons and Parvalbumin-Cre Transcardially perfused 4% PFA in PBS with 4 hour post-fixation Parvalbumin (chicken pab; 1:2000) 1; Cre (rabbit pab; 1:100) 10 Donkey anti-chicken-cy3 IgG (1:250) 2 ; Donkey anti-rabbit-cy5 Dual staining for neuronal brain structures and parvalbumin Transcardially perfused 4% PFA in PBS with 4 hour post-fixation Parvalbumin (chicken pab; 1:2000) 1; NeuN (mouse mab; 1:100) 6 Donkey anti-chicken-cy3 IgG (1:250) 2 ; Donkey anti-mouse-488 Staining for parvalbumin in QL and EDL muscles Transcardially perfused 4% PFA in PBS and 14% (v/v) saturated picric acid with 4 hour post-fixation 1; Donkey anti-chicken-cy5 IgG DAPI stain Cryostat 20 µm Parvalbumin (chicken pab; 1:2000) (1:250) 2 (1:10 000) 5-1. Covance 2. Jackson immuno research 3. Invitrogen 4. BD Biosciences 5. Molecular Probes 6. Millipore 7. Synaptic systems 8. Neuromab 9. Alomone; 10. Gift from Dr Christoph Kellendonk see Ref 56. pab, polyclonal antibody; mab, monoclonal antibody; PFA, Paraformaldehyde; PBS, Phosphate-buffered saline; VGluT1, Vesicular glutamate transporter 1; ChAT, Choline acetyltransferase.
27 Protocol Fixation Preparation Primary antibody Secondary antibody Nuclear stain Dextran dye Dual staining for motor neurons and VGluT1 Immersion fixation 4% PFA in PBS 4 hours 75 µm VGluT1 (guinea pig pab; 1:2000) 1 Donkey anti-guinea pig-cy5 IgG (1:250) 2 - Dextran Alexa Fluor 488 in ddh 2O (0.3 mg/10µl) 3 Triple staining for proprioceptive neurons, SMN, nucleus Triple staining for motor neurons, SMN, nucleus Transcardially perfused 2% PFA in sodium acetate buffer ph6 (see Ref 91) with 2 hour post-fixation Transcardially perfused 2% PFA in sodium acetate buffer ph6 with 2 hour post-fixation Parvalbumin (chicken pab; 1:2000) 1 ; SMN (mouse mab; 1:100) 4 ChAT (goat pab; 1:100) 6 ; SMN (mouse mab; 1:100) 4 Donkey anti-chicken-cy3 IgG (1:250) 2 ; Donkey anti-mouse-cy5 Donkey anti-goat-cy3 IgG (1:250) 2 ; Donkey anti-mouse-cy5 DAPI stain (1:10 000) 5 - DAPI stain (1:10 000) 5 - Dual staining for motor neurons and proprioceptive neurons Immersion fixation 4% PFA in PBS 12 hours 75 µm ChAT (goat pa; 1:100) 6 ; Parvalbumin (chicken pab; 1:2000) 1 Donkey anti-goat-488 IgG (1:250) 2 ; Donkey anti-chicken-cy3 NMJ triple staining for (presynaptic) motor neuron axon terminal, motor neuron axon, (postsynaptic) acetylcholine nicotinic receptors Dual staining for motor neurons and K v2.1 channels Dual staining for motor neurons and K v2.2 channels Dual staining for motor neurons and K v4.3 channels Dual staining for motor neurons and ChAT-Cre Immersion fixation 4% PFA in PBS 20 mins Transcardially perfused 2% PFA in sodium acetate buffer ph6 with 2 hour post-fixation Transcardially perfused 2% PFA in sodium acetate buffer ph6 with 2 hour post-fixation Transcardially perfused 2% PFA in sodium acetate buffer ph6 with 2 hour post-fixation Transcardially perfused 4% PFA in PBS with 4 hour post-fixation Muscle whole-mount Bungarotoxin Alexa Fluor 555 conjugate 3 ; Neurofilament (rabbit pab; 1:500) 6 ; Synaptophysin 1 (guinea pig pab; 1:1000) 7 ChAT (goat pab; 1:100) 6; K v2.1 (mouse mab; 1:2 supernatant clone K89/34) 8 ChAT (goat pab; 1:100) 6; K v2.2 (mouse mab; 1:2 supernatant clone N372B/1) 8 ChAT (goat pab; 1:100) 6; K v4.3 (rabbit pab; 1:100) 9 ChAT (goat pab; 1:100) 6; Cre (rabbit pab; 1:100) 10 Donkey anti-rabbit-488 IgG (1:250) 2 ; Donkey anti-guinea pig- Cy5 Donkey anti-goat-cy3 IgG (1:250) 2 ; Donkey anti-mouse-cy5 Donkey anti-goat-cy3 IgG (1:250) 2 ; Donkey anti-mouse-cy5 Donkey anti-goat-cy3 IgG (1:250) 2 ; Donkey anti-rabbit-cy5 Donkey anti-goat-cy3 IgG (1:250) 2 ; Donkey anti-rabbit-cy5 Dual staining for proprioceptive neurons and Parvalbumin-Cre Transcardially perfused 4% PFA in PBS with 4 hour post-fixation Parvalbumin (chicken pab; 1:2000) 1; Cre (rabbit pab; 1:100) 10 Donkey anti-chicken-cy3 IgG (1:250) 2 ; Donkey anti-rabbit-cy5 Dual staining for neuronal brain structures and parvalbumin Transcardially perfused 4% PFA in PBS with 4 hour post-fixation Parvalbumin (chicken pab; 1:2000) 1; NeuN (mouse mab; 1:100) 6 Donkey anti-chicken-cy3 IgG (1:250) 2 ; Donkey anti-mouse-488 Staining for parvalbumin in QL and EDL muscles Transcardially perfused 4% PFA in PBS and 14% (v/v) saturated picric acid with 4 hour post-fixation 1; Donkey anti-chicken-cy5 IgG DAPI stain Cryostat 20 µm Parvalbumin (chicken pab; 1:2000) (1:250) 2 (1:10 000) 5-1. Covance 2. Jackson immuno research 3. Invitrogen 4. BD Biosciences 5. Molecular Probes 6. Millipore 7. Synaptic systems 8. Neuromab 9. Alomone; 10. Gift from Dr Christoph Kellendonk (Columbia University). pab, polyclonal antibody; mab, monoclonal antibody; PFA, Paraformaldehyde; PBS, Phosphate-buffered saline; VGluT1, Vesicular glutamate transporter 1; ChAT, Choline acetyltransferase.
28 Secondary antibodies Source Catalog number Donkey anti-guinea pig-cy5 IgG Jackson Immunoresearch Donkey anti-mouse-cy5 IgG Jackson Immunoresearch Donkey anti-chicken-cy5 IgG Jackson Immunoresearch Donkey anti-rabbit-cy5 IgG Jackson Immunoresearch Donkey anti-chicken-cy3 IgG Jackson Immunoresearch Donkey anti-goat-cy3 IgG Jackson Immunoresearch Donkey anti-goat-488 IgG Jackson Immunoresearch Donkey anti-rabbit-488 IgG Jackson Immunoresearch Donkey anti-mouse-488 IgG Jackson Immunoresearch Streptavidin, Alexa Fluor- 488 Molecular Probes S11223 Primary antibodies Parvalbumin (chicken) Covance AP37-47 SMN (mouse) BD Biosciences ChAT (goat) Millipore AB144P Bungarotoxin Alexa Fluor 555 conjugate Invitrogen B35451 Neurofilament (rabbit) Millipore AB1987 Synaptophysin (guinea pig) Synaptic systems Kv2.1 (mouse mab clone K89/34) NeuroMab Kv2.2 (mouse mab; 1:2 clone N372B/1) NeuroMab Kv4.3 (rabbit) Alomone APC-017 NeuN (mouse) Millipore MAB377 GFP (chicken) Abcam ab13970 DAPI stain Molecular Probes D3571
Supplementary Figure 1. SDS-FRL localization of CB 1 in the distal CA3 area of the rat hippocampus. (a-d) Axon terminals (t) in stratum pyramidale
 Axon terminals (t) in stratum pyramidale") Supplementary Figure 1. SDS-FRL localization of CB 1 in the distal CA3 area of the rat hippocampus. (a-d) Axon terminals (t) in stratum pyramidale (b) show stronger immunolabeling for CB 1 than those in
Supplementary Figure 1. SDS-FRL localization of CB 1 in the distal CA3 area of the rat hippocampus. (a-d) Axon terminals (t) in stratum pyramidale (b) show stronger immunolabeling for CB 1 than those in
Nature Neuroscience: doi: /nn Supplementary Figure 1. Trial structure for go/no-go behavior
 Supplementary Figure 1 Trial structure for go/no-go behavior a, Overall timeline of experiments. Day 1: A1 mapping, injection of AAV1-SYN-GCAMP6s, cranial window and headpost implantation. Water restriction
Nature Neuroscience: doi: /nn.4335
 Supplementary Figure 1 Cholinergic neurons projecting to the VTA are concentrated in the caudal mesopontine region. (a) Schematic showing the sites of retrograde tracer injections in the VTA: cholera toxin
File name: Supplementary Information Description: Supplementary Figures, Supplementary Table and Supplementary References
 File name: Supplementary Information Description: Supplementary Figures, Supplementary Table and Supplementary References File name: Supplementary Data 1 Description: Summary datasheets showing the spatial
Nature Methods: doi: /nmeth Supplementary Figure 1. Activity in turtle dorsal cortex is sparse.
 Supplementary Figure 1 Activity in turtle dorsal cortex is sparse. a. Probability distribution of firing rates across the population (notice log scale) in our data. The range of firing rates is wide but
Supplementary figure 1: LII/III GIN-cells show morphological characteristics of MC
 1 2 1 3 Supplementary figure 1: LII/III GIN-cells show morphological characteristics of MC 4 5 6 7 (a) Reconstructions of LII/III GIN-cells with somato-dendritic compartments in orange and axonal arborizations
Zhu et al, page 1. Supplementary Figures
 Zhu et al, page 1 Supplementary Figures Supplementary Figure 1: Visual behavior and avoidance behavioral response in EPM trials. (a) Measures of visual behavior that performed the light avoidance behavior
SUPPLEMENTARY INFORMATION
 Supplementary Figure 1. Normal AMPAR-mediated fepsp input-output curve in CA3-Psen cdko mice. Input-output curves, which are plotted initial slopes of the evoked fepsp as function of the amplitude of the
SUPPLEMENTARY INFORMATION. Supplementary Figure 1
 SUPPLEMENTARY INFORMATION Supplementary Figure 1 The supralinear events evoked in CA3 pyramidal cells fulfill the criteria for NMDA spikes, exhibiting a threshold, sensitivity to NMDAR blockade, and all-or-none
Nature Neuroscience: doi: /nn Supplementary Figure 1. Splenic atrophy and leucopenia caused by T3 SCI.
 Supplementary Figure 1 Splenic atrophy and leucopenia caused by T3 SCI. (a) Gross anatomy of representative spleens from control and T3 SCI mice at 28 days post-injury. (b and c) Hematoxylin and eosin
Nature Neuroscience: doi: /nn Supplementary Figure 1. ACx plasticity is required for fear conditioning.
 Supplementary Figure 1 ACx plasticity is required for fear conditioning. (a) Freezing time of conditioned and control mice before CS presentation and during CS presentation in a new context. Student s
Unique functional properties of somatostatin-expressing GABAergic neurons in mouse barrel cortex
 Supplementary Information Unique functional properties of somatostatin-expressing GABAergic neurons in mouse barrel cortex Luc Gentet, Yves Kremer, Hiroki Taniguchi, Josh Huang, Jochen Staiger and Carl
Nature Neuroscience: doi: /nn Supplementary Figure 1. MADM labeling of thalamic clones.
 Supplementary Figure 1 MADM labeling of thalamic clones. (a) Confocal images of an E12 Nestin-CreERT2;Ai9-tdTomato brain treated with TM at E10 and stained for BLBP (green), a radial glial progenitor-specific
Supplementary Figure 1
 Supplementary Figure 1 Localization of virus injections. (a) Schematic showing the approximate center of AAV-DIO-ChR2-YFP injection sites in the NAc of Dyn-cre mice (n=8 mice, 16 injections; caudate/putamen,
Nature Neuroscience: doi: /nn Supplementary Figure 1
 Supplementary Figure 1 Subcellular segregation of VGluT2-IR and TH-IR within the same VGluT2-TH axon (wild type rats). (a-e) Serial sections of a dual VGluT2-TH labeled axon. This axon (blue outline) has
Increased serotonin transporter expression reduces fear and recruitment of. parvalbumin interneurons of the amygdala
 Increased serotonin transporter expression reduces fear and recruitment of parvalbumin interneurons of the amygdala Marco Bocchio, Giulia Fucsina, Lydia Oikonomidis, Stephen B McHugh, David M Bannerman,
Wenqin Hu, Cuiping Tian, Tun Li, Mingpo Yang, Han Hou & Yousheng Shu
 Distinct contributions of Na v 1.6 and Na v 1.2 in action potential initiation and backpropagation Wenqin Hu, Cuiping Tian, Tun Li, Mingpo Yang, Han Hou & Yousheng Shu Supplementary figure and legend Supplementary
Supplementary Figure 1
 Supplementary Figure 1 Supplementary Figure 1 SNARE Probes for FRET/2pFLIM Analysis Used in the Present Study. mturquoise (mtq) and Venus (Ven) are in blue and yellow, respectively. The soluble N-ethylmaleimide-sensitive
Nature Neuroscience: doi: /nn Supplementary Figure 1. Diverse anorexigenic signals induce c-fos expression in CEl PKC-δ + neurons
 Supplementary Figure 1 Diverse anorexigenic signals induce c-fos expression in CEl PKC-δ + neurons a-c. Quantification of CEl c-fos expression in mice intraperitoneal injected with anorexigenic drugs (a),
Supplementary Figure 1
 Supplementary Figure 1 The average sigmoid parametric curves of capillary dilation time courses and average time to 50% peak capillary diameter dilation computed from individual capillary responses averaged
Lack of GPR88 enhances medium spiny neuron activity and alters. motor- and cue- dependent behaviors
 Lack of GPR88 enhances medium spiny neuron activity and alters motor- and cue- dependent behaviors Albert Quintana, Elisenda Sanz, Wengang Wang, Granville P. Storey, Ali D. Güler Matthew J. Wanat, Bryan
Dep. Control Time (min)
") aa Control Dep. RP 1s 1 mv 2s 1 mv b % potentiation of IPSP 2 15 1 5 Dep. * 1 2 3 4 Time (min) Supplementary Figure 1. Rebound potentiation of IPSPs in PCs. a, IPSPs recorded with a K + gluconate pipette
aa Control Dep. RP 1s 1 mv 2s 1 mv b % potentiation of IPSP 2 15 1 5 Dep. * 1 2 3 4 Time (min) Supplementary Figure 1. Rebound potentiation of IPSPs in PCs. a, IPSPs recorded with a K + gluconate pipette
Structural basis for the role of inhibition in facilitating adult brain plasticity
 Structural basis for the role of inhibition in facilitating adult brain plasticity Jerry L. Chen, Walter C. Lin, Jae Won Cha, Peter T. So, Yoshiyuki Kubota & Elly Nedivi SUPPLEMENTARY FIGURES 1-6 a b M
Astrocyte signaling controls spike timing-dependent depression at neocortical synapses
 Supplementary Information Astrocyte signaling controls spike timing-dependent depression at neocortical synapses Rogier Min and Thomas Nevian Department of Physiology, University of Berne, Bern, Switzerland
Supplemental Information. Otic Mesenchyme Cells Regulate. Spiral Ganglion Axon Fasciculation. through a Pou3f4/EphA4 Signaling Pathway
 Neuron, Volume 73 Supplemental Information Otic Mesenchyme Cells Regulate Spiral Ganglion Axon Fasciculation through a Pou3f4/EphA4 Signaling Pathway Thomas M. Coate, Steven Raft, Xiumei Zhao, Aimee K.
Supplementary Figure 1. Microglia do not show signs of classical immune activation following MD a-b. Images showing immunoreactivity for MHCII (a)
") 1 Supplementary Figure 1. Microglia do not show signs of classical immune activation following MD a-b. Images showing immunoreactivity for MHCII (a) and CD45 (b) in fixed sections of binocular visual cortex
1 Supplementary Figure 1. Microglia do not show signs of classical immune activation following MD a-b. Images showing immunoreactivity for MHCII (a) and CD45 (b) in fixed sections of binocular visual cortex
Clarke's Column Neurons as the Focus of a Corticospinal Corollary Circuit. Supplementary Information. Adam W. Hantman and Thomas M.
 Clarke's Column Neurons as the Focus of a Corticospinal Corollary Circuit Supplementary Information Adam W. Hantman and Thomas M. Jessell Supplementary Results Characterizing the origin of primary
Supplementary Figure 1. ACE robotic platform. A. Overview of the rig setup showing major hardware components of ACE (Automatic single Cell
 2 Supplementary Figure 1. ACE robotic platform. A. Overview of the rig setup showing major hardware components of ACE (Automatic single Cell Experimenter) including the MultiClamp 700B, Digidata 1440A,
Ivy/Neurogliaform Interneurons Coordinate Activity in the Neurogenic Niche
 Ivy/Neurogliaform Interneurons Coordinate Activity in the Neurogenic Niche Sean J. Markwardt, Cristina V. Dieni, Jacques I. Wadiche & Linda Overstreet-Wadiche Supplementary Methods. Animals We used hemizygous
Hormonal gain control of a medial preoptic area social reward circuit
 CORRECTION NOTICE Nat. Neurosci. 20, 449 458 (2017) Hormonal gain control of a medial preoptic area social reward circuit Jenna A McHenry, James M Otis, Mark A Rossi, J Elliott Robinson, Oksana Kosyk,
Supplementary Figure 1
 Supplementary Figure 1 Arcuate ChIEF-tdTomato neurons expressed TH These micrographs show that TH-Cre-ChIEF-tdTomato (magenta), expressed by AAV in a TH-Cre mouse, were immunostained with TH (green) in
Nature Neuroscience: doi: /nn Supplementary Figure 1. Distribution of starter cells for RV-mediated retrograde tracing.
 Supplementary Figure 1 Distribution of starter cells for RV-mediated retrograde tracing. Parcellation of cortical areas is based on Allen Mouse Brain Atlas and drawn to scale. Thick white curves, outlines
Nature Neuroscience: doi: /nn Supplementary Figure 1. Confirmation that optogenetic inhibition of dopaminergic neurons affects choice
 Supplementary Figure 1 Confirmation that optogenetic inhibition of dopaminergic neurons affects choice (a) Sample behavioral trace as in Figure 1d, but with NpHR stimulation trials depicted as green blocks
Supplementary Materials for VAMP4 directs synaptic vesicles to a pool that selectively maintains asynchronous neurotransmission
 Supplementary Materials for VAMP4 directs synaptic vesicles to a pool that selectively maintains asynchronous neurotransmission Jesica Raingo, Mikhail Khvotchev, Pei Liu, Frederic Darios, Ying C. Li, Denise
SUPPLEMENTARY INFORMATION
 SUPPLEMENTARY INFORMATION doi:10.1038/nature11306 Supplementary Figures Supplementary Figure 1. Basic characterization of GFP+ RGLs in the dentate gyrus of adult nestin-gfp mice. a, Sample confocal images
Supplementary Figure 1: Validation of labeling specificity of immature OSNs and presynaptic terminals. (A) (B) (C) (D) (E)
 (B) (C) (D) (E)") Supplementary Figure 1: Validation of labeling specificity of immature OSNs and presynaptic terminals. (A) Confocal images of septal olfactory epithelium of an adult Gγ8-sypGFP-tdTom mouse showing colocalization
Supplementary Figure 1: Validation of labeling specificity of immature OSNs and presynaptic terminals. (A) Confocal images of septal olfactory epithelium of an adult Gγ8-sypGFP-tdTom mouse showing colocalization
Introduction to Neurobiology
 Biology 240 General Zoology Introduction to Neurobiology Nervous System functions: communication of information via nerve signals integration and processing of information control of physiological and
Supplementary Figure 1
 Supplementary Figure 1 Global TeNT expression effectively impairs synaptic transmission. Injection of 100 pg tent mrna leads to a reduction of vesicle mediated synaptic transmission in the spinal cord
Amyotrophic lateral sclerosis (ALS) is a fatal disorder characterized
 is a fatal disorder characterized") Gamma motor neurons survive and exacerbate alpha motor neuron degeneration in ALS Melanie Lalancette-Hebert a,b, Aarti Sharma a,b, Alexander K. Lyashchenko a,b, and Neil A. Shneider a,b,1 a Center for
Gamma motor neurons survive and exacerbate alpha motor neuron degeneration in ALS Melanie Lalancette-Hebert a,b, Aarti Sharma a,b, Alexander K. Lyashchenko a,b, and Neil A. Shneider a,b,1 a Center for
Supplementary Materials for
 www.sciencetranslationalmedicine.org/cgi/content/full/4/117/117ra8/dc1 Supplementary Materials for Notch4 Normalization Reduces Blood Vessel Size in Arteriovenous Malformations Patrick A. Murphy, Tyson
Supplementary Figure 1. Nature Neuroscience: doi: /nn.4547
 Supplementary Figure 1 Characterization of the Microfetti mouse model. (a) Gating strategy for 8-color flow analysis of peripheral Ly-6C + monocytes from Microfetti mice 5-7 days after TAM treatment. Living
Supplementary Figure 1. SybII and Ceb are sorted to distinct vesicle populations in astrocytes. Nature Neuroscience: doi: /nn.
 Supplementary Figure 1 SybII and Ceb are sorted to distinct vesicle populations in astrocytes. (a) Exemplary images for cultured astrocytes co-immunolabeled with SybII and Ceb antibodies. SybII accumulates
Synaptic Integration
 Synaptic Integration 3 rd January, 2017 Touqeer Ahmed PhD Atta-ur-Rahman School of Applied Biosciences National University of Sciences and Technology Excitatory Synaptic Actions Excitatory Synaptic Action
SUPPLEMENTARY FIGURES
 SUPPLEMENTARY FIGURES 1 Supplementary Figure 1, Adult hippocampal QNPs and TAPs uniformly express REST a-b) Confocal images of adult hippocampal mouse sections showing GFAP (green), Sox2 (red), and REST
Nature Neuroscience: doi: /nn Supplementary Figure 1
 Supplementary Figure 1 Bidirectional optogenetic modulation of the tonic activity of CEA PKCδ + neurons in vitro. a, Top, Cell-attached voltage recording illustrating the blue light-induced increase in
Nature Neuroscience: doi: /nn Supplementary Figure 1
 Supplementary Figure 1 Drd1a-Cre driven ChR2 expression in the SCN. (a) Low-magnification image of a representative Drd1a-ChR2 coronal brain section (n = 2) showing endogenous tdtomato fluorescence (magenta).
Neuroscience 201A (2016) - Problems in Synaptic Physiology
 - Problems in Synaptic Physiology") Question 1: The record below in A shows an EPSC recorded from a cerebellar granule cell following stimulation (at the gap in the record) of a mossy fiber input. These responses are, then, evoked by stimulation.
Question 1: The record below in A shows an EPSC recorded from a cerebellar granule cell following stimulation (at the gap in the record) of a mossy fiber input. These responses are, then, evoked by stimulation.
Ube3a is required for experience-dependent maturation of the neocortex
 Ube3a is required for experience-dependent maturation of the neocortex Koji Yashiro, Thorfinn T. Riday, Kathryn H. Condon, Adam C. Roberts, Danilo R. Bernardo, Rohit Prakash, Richard J. Weinberg, Michael
Supplemental Information. A Visual-Cue-Dependent Memory Circuit. for Place Navigation
 Neuron, Volume 99 Supplemental Information A Visual-Cue-Dependent Memory Circuit for Place Navigation Han Qin, Ling Fu, Bo Hu, Xiang Liao, Jian Lu, Wenjing He, Shanshan Liang, Kuan Zhang, Ruijie Li, Jiwei
Tuning properties of individual circuit components and stimulus-specificity of experience-driven changes.
 Supplementary Figure 1 Tuning properties of individual circuit components and stimulus-specificity of experience-driven changes. (a) Left, circuit schematic with the imaged component (L2/3 excitatory neurons)
Nature Neuroscience: doi: /nn.4642
 Supplementary Figure 1 Recording sites and example waveform clustering, as well as electrophysiological recordings of auditory CS and shock processing following overtraining. (a) Recording sites in LC
STRUCTURAL ELEMENTS OF THE NERVOUS SYSTEM
 STRUCTURAL ELEMENTS OF THE NERVOUS SYSTEM STRUCTURE AND MAINTENANCE OF NEURONS (a) (b) Dendrites Cell body Initial segment collateral terminals (a) Diagrammatic representation of a neuron. The break in
Nature Neuroscience: doi: /nn Supplementary Figure 1
 Supplementary Figure 1 Atlas representations of the midcingulate (MCC) region targeted in this study compared against the anterior cingulate (ACC) region commonly reported. Coronal sections are shown on
Supplementary Figure 1. Identification of the type II spiral ganglion neurons (SGN) via immunofluorescence of peripherin protein (PRPH).
 via immunofluorescence of peripherin protein (PRPH).") Supplementary Figure 1. Identification of the type II spiral ganglion neurons (SGN) via immunofluorescence of peripherin protein (PRPH). (a), (b), PRPH immunolabelling of cryosections from post-natal day
Supplementary Figure 1. Identification of the type II spiral ganglion neurons (SGN) via immunofluorescence of peripherin protein (PRPH). (a), (b), PRPH immunolabelling of cryosections from post-natal day
Supporting Online Material for
 www.sciencemag.org/cgi/content/full/312/5779/1533/dc1 Supporting Online Material for Long-Term Potentiation of Neuron-Glia Synapses Mediated by Ca 2+ - Permeable AMPA Receptors Woo-Ping Ge, Xiu-Juan Yang,
What Cell Make Up the Brain and Spinal Cord
 What Cell Make Up the Brain and Spinal Cord Jennifer LaVail, Ph.D. (http://anatomy.ucsf.edu/pages/lavaillab/index.html) What kinds of cells are these?" Neuron?" Epithelial cell?" Glial cell?" What makes
Alterations in Synaptic Strength Preceding Axon Withdrawal
 Alterations in Synaptic Strength Preceding Axon Withdrawal H. Colman, J. Nabekura, J.W. Lichtman presented by Ana Fiallos Synaptic Transmission at the Neuromuscular Junction Motor neurons with cell bodies
Bio 3411 Midterm Review:
 Bio 3411 Midterm Review: Structure/Development/Systems/ Plastics/Talents/Diseases/Genes Structure General Overview Wednesday October 26, 2011 1 2 THE BRAIN ATLAS 3 rd ed, p. 8! THE BRAIN ATLAS 3 rd ed,
(a) Significant biological processes (upper panel) and disease biomarkers (lower panel)
 Significant biological processes (upper panel) and disease biomarkers (lower panel)") Supplementary Figure 1. Functional enrichment analyses of secretomic proteins. (a) Significant biological processes (upper panel) and disease biomarkers (lower panel) 2 involved by hrab37-mediated secretory
Supplementary Figure 1. Functional enrichment analyses of secretomic proteins. (a) Significant biological processes (upper panel) and disease biomarkers (lower panel) 2 involved by hrab37-mediated secretory
Activity Dependent Changes At the Developing Neuromuscular Junction
 Activity Dependent Changes At the Developing Neuromuscular Junction (slides 16, 17 and 18 have been slightly modified for clarity) MCP Lecture 2-3 9.013/7.68 04 Neuromuscular Junction Development 1. Muscle
Overview of the Nervous System (some basic concepts) Steven McLoon Department of Neuroscience University of Minnesota
 Steven McLoon Department of Neuroscience University of Minnesota") Overview of the Nervous System (some basic concepts) Steven McLoon Department of Neuroscience University of Minnesota 1 Coffee Hour Tuesday (Sept 11) 10:00-11:00am Friday (Sept 14) 8:30-9:30am Surdyk s
Overview of the Nervous System (some basic concepts) Steven McLoon Department of Neuroscience University of Minnesota 1 Coffee Hour Tuesday (Sept 11) 10:00-11:00am Friday (Sept 14) 8:30-9:30am Surdyk s
Supplementary Figure 1 Expression of Crb3 in mouse sciatic nerve: biochemical analysis (a) Schematic of Crb3 isoforms, ERLI and CLPI, indicating the
 Schematic of Crb3 isoforms, ERLI and CLPI, indicating the") Supplementary Figure 1 Expression of Crb3 in mouse sciatic nerve: biochemical analysis (a) Schematic of Crb3 isoforms, ERLI and CLPI, indicating the location of the transmembrane (TM), FRM binding (FB)
Supplementary Figure 1 Expression of Crb3 in mouse sciatic nerve: biochemical analysis (a) Schematic of Crb3 isoforms, ERLI and CLPI, indicating the location of the transmembrane (TM), FRM binding (FB)
Supplemental Information. Dorsal Raphe Dual Serotonin-Glutamate Neurons. Drive Reward by Establishing Excitatory Synapses
 Cell Reports, Volume 26 Supplemental Information Dorsal Raphe Dual Serotonin-Glutamate Neurons Drive Reward by Establishing Excitatory Synapses on VTA Mesoaccumbens Dopamine Neurons Hui-Ling Wang, Shiliang
TGF-β Signaling Regulates Neuronal C1q Expression and Developmental Synaptic Refinement
 Supplementary Information Title: TGF-β Signaling Regulates Neuronal C1q Expression and Developmental Synaptic Refinement Authors: Allison R. Bialas and Beth Stevens Supplemental Figure 1. In vitro characterization
Impact of Sox9 Dosage and Hes1-mediated Notch Signaling in Controlling the Plasticity of Adult Pancreatic Duct Cells in Mice
 Impact of Sox9 Dosage and Hes1-mediated Notch Signaling in Controlling the Plasticity of Adult Pancreatic Duct Cells in Mice Shinichi Hosokawa 1,3,Kenichiro Furuyama 1,3, Masashi Horiguchi 1,3,Yoshiki
Supplementary Figure 1 Information on transgenic mouse models and their recording and optogenetic equipment. (a) 108 (b-c) (d) (e) (f) (g)
 108 (b-c) (d) (e) (f) (g)") Supplementary Figure 1 Information on transgenic mouse models and their recording and optogenetic equipment. (a) In four mice, cre-dependent expression of the hyperpolarizing opsin Arch in pyramidal cells
Supplementary Figure 1 Information on transgenic mouse models and their recording and optogenetic equipment. (a) In four mice, cre-dependent expression of the hyperpolarizing opsin Arch in pyramidal cells
Supplementary Figure 1. Basic properties of compound EPSPs at
 Supplementary Figure 1. Basic properties of compound EPSPs at hippocampal CA3 CA3 cell synapses. (a) EPSPs were evoked by extracellular stimulation of the recurrent collaterals and pharmacologically isolated
Nature Neuroscience doi: /nn Supplementary Figure 1. Characterization of viral injections.
 Supplementary Figure 1 Characterization of viral injections. (a) Dorsal view of a mouse brain (dashed white outline) after receiving a large, unilateral thalamic injection (~100 nl); demonstrating that
Fig. S4. Current-voltage relations of iglurs. A-C: time courses of currents evoked by 100 ms pulses
 Fig. S1. Immunohistochemical detection of iglur2 protein in single islet cells. A: α cells identified using glucagon-specific antibody express the iglur2 subtype of AMPA receptor. 24 out of 26 identified
Supplementary Information
 Supplementary Information Title Degeneration and impaired regeneration of gray matter oligodendrocytes in amyotrophic lateral sclerosis Authors Shin H. Kang, Ying Li, Masahiro Fukaya, Ileana Lorenzini,
Supplementary Table 1. List of primers used in this study
 Supplementary Table 1. List of primers used in this study Gene Forward primer Reverse primer Rat Met 5 -aggtcgcttcatgcaggt-3 5 -tccggagacacaggatgg-3 Rat Runx1 5 -cctccttgaaccactccact-3 5 -ctggatctgcctggcatc-3
CCK mouse 1:5000 *Dr. G. Ohning, CURE, UCLA, USA, Code 9303 (Ohning et al., 1996)
") Supplemental Table 1 antibody to host dilution source CB rabbit 1:5000 Swant, Bellinzona, Switzerland, code no 38 reference of characterization and specificity labelling patterns as published with other
Supplemental Table 1 antibody to host dilution source CB rabbit 1:5000 Swant, Bellinzona, Switzerland, code no 38 reference of characterization and specificity labelling patterns as published with other
Genesis of cerebellar interneurons and the prevention of neural DNA damage require XRCC1.
 Genesis of cerebellar interneurons and the prevention of neural DNA damage require XRCC1. Youngsoo Lee, Sachin Katyal, Yang Li, Sherif F. El-Khamisy, Helen R. Russell, Keith W. Caldecott and Peter J. McKinnon.
Supplementary Information
 Supplementary Information D-Serine regulates cerebellar LTD and motor coordination through the 2 glutamate receptor Wataru Kakegawa, Yurika Miyoshi, Kenji Hamase, Shinji Matsuda, Keiko Matsuda, Kazuhisa
Axon initial segment position changes CA1 pyramidal neuron excitability
 Axon initial segment position changes CA1 pyramidal neuron excitability Cristina Nigro and Jason Pipkin UCSD Neurosciences Graduate Program Abstract The axon initial segment (AIS) is the portion of the
SYNAPTIC COMMUNICATION
 BASICS OF NEUROBIOLOGY SYNAPTIC COMMUNICATION ZSOLT LIPOSITS 1 NERVE ENDINGS II. Interneuronal communication 2 INTERNEURONAL COMMUNICATION I. ELECTRONIC SYNAPSE GAP JUNCTION II. CHEMICAL SYNAPSE SYNAPSES
Endocrine System Nervous System
 Cells Endocrine System Nervous System Tissues Controls Organs Nervous System vs Endocrine System Electrical signals (graded potentials and action potentials) and chemical signals (neurotransmitters) Fast
doi: /nature09554
 SUPPLEMENTARY INFORMATION doi:10.1038/nature09554 Supplementary Figure 1: Optical Tracing with New Photoactivatable GFP Variants Reveals Enhanced Labeling of Neuronal Processes We qualitatively compare
marker. DAPI labels nuclei. Flies were 20 days old. Scale bar is 5 µm. Ctrl is
 Supplementary Figure 1. (a) Nos is detected in glial cells in both control and GFAP R79H transgenic flies (arrows), but not in deletion mutant Nos Δ15 animals. Repo is a glial cell marker. DAPI labels
POSTSYNAPTIC INHIBITION OF CRAYFISH TONIC FLEXOR MOTOR NEURONES BY ESCAPE COMMANDS
 J. exp. Biol. (1980), 85, 343-347 343 With a figures Printed in Great Britain POSTSYNAPTIC INHIBITION OF CRAYFISH TONIC FLEXOR MOTOR NEURONES BY ESCAPE COMMANDS BY J. Y. KUWADA, G. HAGIWARA AND J. J. WINE
Neurobiology. Cells of the nervous system
 Neurobiology Cells of the nervous system Anthony Heape 2010 1 The nervous system Central nervous system (CNS) Peripheral nervous system (PNS) 2 Enteric nervous system (digestive tract, gall bladder and
EE 791 Lecture 2 Jan 19, 2015
 EE 791 Lecture 2 Jan 19, 2015 Action Potential Conduction And Neural Organization EE 791-Lecture 2 1 Core-conductor model: In the core-conductor model we approximate an axon or a segment of a dendrite
Bio 3411 Midterm Review:
 Midterm Review: Structure/Development/Systems/ Plastics/Talents/Diseases/Genes Structure General Overview Wednesday 1( 2( THE BRAIN ATLAS 3 rd ed, p. 8! THE BRAIN ATLAS 3 rd ed, p. 9! Mid-line (sagittal)
Supplemental information Acid-sensing ion channel 1a contributes to hippocampal LTP inducibility through multiple mechanisms
 Supplemental information Acid-sensing ion channel 1a contributes to hippocampal LTP inducibility through multiple mechanisms Ming-Gang Liu, Hu-Song Li, Wei-Guang Li, Yan-Jiao Wu, Shi-Ning Deng, Chen Huang,
The Nervous System. Dr. ZHANG Xiong Dept. of Physiology ZJU School of Medicine.
 The Nervous System Dr. ZHANG Xiong Dept. of Physiology ZJU School of Medicine Http://10.10.10.151 Part 1. Summary of the nervous system The Nervous System Central Nervous System Brain + Spinal Cord Peripheral
Supplementary Figure 1: Hsp60 / IEC mice are embryonically lethal (A) Light microscopic pictures show mouse embryos at developmental stage E12.
 Light microscopic pictures show mouse embryos at developmental stage E12.") Supplementary Figure 1: Hsp60 / IEC mice are embryonically lethal (A) Light microscopic pictures show mouse embryos at developmental stage E12.5 and E13.5 prepared from uteri of dams and subsequently genotyped.
Supplementary Figure 1: Hsp60 / IEC mice are embryonically lethal (A) Light microscopic pictures show mouse embryos at developmental stage E12.5 and E13.5 prepared from uteri of dams and subsequently genotyped.
Supplementary Figure 1. GABA depolarizes the majority of immature neurons in the
 Supplementary Figure 1. GABA depolarizes the majority of immature neurons in the upper cortical layers at P3 4 in vivo. (a b) Cell-attached current-clamp recordings illustrate responses to puff-applied
Nature Neuroscience: doi: /nn Supplementary Figure 1. Neuron class-specific arrangements of Khc::nod::lacZ label in dendrites.
 Supplementary Figure 1 Neuron class-specific arrangements of Khc::nod::lacZ label in dendrites. Staining with fluorescence antibodies to detect GFP (Green), β-galactosidase (magenta/white). (a, b) Class
Bone marrow-derived mesenchymal stem cells improve diabetes-induced cognitive impairment by
 Nakano et al. Supplementary information 1. Supplementary Figure 2. Methods 3. References Bone marrow-derived mesenchymal stem cells improve diabetes-induced cognitive impairment by exosome transfer into
Nature Neuroscience: doi: /nn Supplementary Figure 1. Large-scale calcium imaging in vivo.
 Supplementary Figure 1 Large-scale calcium imaging in vivo. (a) Schematic illustration of the in vivo camera imaging set-up for large-scale calcium imaging. (b) High-magnification two-photon image from
Supplementary Figure 1
 Supplementary Figure 1 Supplementary Figure 1. Short latency of the fepsp evoked in CA3 by electrical stimulation of perforant path inputs (a) Single and superimposed representative perforant pathway-ca3
Suppl. Information Supplementary Figure 1. Strategy/latency analysis of individual mice during maze learning. a,
 Goal-oriented searching mediated by ventral hippocampus early in trial-and-error learning Ruediger, S, Spirig, D., Donato, F., Caroni, P. Suppl. Information Supplementary Figure 1. Strategy/latency analysis
浙江大学医学院基础医学整合课程 各论 III. The Nervous System. Dr. ZHANG Xiong Dept. of Physiology ZJU School of Medicine
 The Nervous System Dr. ZHANG Xiong Dept. of Physiology ZJU School of Medicine xiongzhang@zju.edu.cn http://10.202.77.12/ 1 Part 1. Summary of the nervous system 2 The Nervous System Central Nervous System
SUPPLEMENTARY INFORMATION
 doi:10.1038/nature10776 Supplementary Information 1: Influence of inhibition among blns on STDP of KC-bLN synapses (simulations and schematics). Unconstrained STDP drives network activity to saturation
5-Nervous system II: Physiology of Neurons
 5-Nervous system II: Physiology of Neurons AXON ION GRADIENTS ACTION POTENTIAL (axon conduction) GRADED POTENTIAL (cell-cell communication at synapse) SYNAPSE STRUCTURE & FUNCTION NEURAL INTEGRATION CNS
Chapter 17 Nervous System
 Chapter 17 Nervous System 1 The Nervous System Two Anatomical Divisions Central Nervous System (CNS) Brain and Spinal Cord Peripheral Nervous System (PNS) Two Types of Cells Neurons Transmit nerve impulses
Ting Ting Liu 1, B. Anne Bannatyne 1, Elzbieta Jankowska 2 and David J. Maxwell 1
 J Physiol 588.21 (2010) pp 4217 4233 4217 Properties of axon terminals contacting intermediate zone excitatory and inhibitory premotor interneurons with monosynaptic input from group I and II muscle afferents
10.1: Introduction. Cell types in neural tissue: Neurons Neuroglial cells (also known as neuroglia, glia, and glial cells) Dendrites.
 Dendrites.") 10.1: Introduction Copyright The McGraw-Hill Companies, Inc. Permission required for reproduction or display. Cell types in neural tissue: Neurons Neuroglial cells (also known as neuroglia, glia, and glial
10.1: Introduction Copyright The McGraw-Hill Companies, Inc. Permission required for reproduction or display. Cell types in neural tissue: Neurons Neuroglial cells (also known as neuroglia, glia, and glial
Supplemental Information. Tissue Myeloid Progenitors Differentiate. into Pericytes through TGF-b Signaling. in Developing Skin Vasculature
 Cell Reports, Volume 18 Supplemental Information Tissue Myeloid Progenitors Differentiate into Pericytes through TGF-b Signaling in Developing Skin Vasculature Tomoko Yamazaki, Ani Nalbandian, Yutaka Uchida,
Cholinergic Activation of M2 Receptors Leads to Context- Dependent Modulation of Feedforward Inhibition in the Visual Thalamus
 Cholinergic Activation of M2 Receptors Leads to Context- Dependent Modulation of Feedforward Inhibition in the Visual Thalamus Miklos Antal., Claudio Acuna-Goycolea., R. Todd Pressler, Dawn M. Blitz, Wade