Differential neuronal vulnerability identifies IGF-2 as a protective factor in
|
|
|
- Quentin Alexander
- 5 years ago
- Views:
Transcription
1 Supplementary Information Differential neuronal vulnerability identifies IGF-2 as a protective factor in ALS Ilary Allodi 1,3, Laura Comley 1,3, Susanne Nichterwitz 1,3, Monica Nizzardo 2, Chiara Simone 2, Julio Aguila Benitez 1, Ming Cao 1, Stefania Corti 2,4,* and Eva Hedlund 1,4,*
2 Supplementary Table 1. Characteristics of non-demented and ALS clinical cases used for immunohistochemical analysis of IGF-2 protein level Case number Sex Age at death Cause of death Postmortem delay time (h:min) Cases used for histological analysis Source 1 F 58 ND (colon cancer) 14:10 NDRI 2 F 71 ND (kidney failure) 7:10 NBB 3 M 71 ND (sepsis) 7:40 NBB 4 F 87 ND (cachexia and dehydration) 5:00 NBB 5 M 70 ND (emphysema) 4.50 NDRI 6 F 49 ALS 3:45 NBB 7 M 65 ALS 10:30 NDRI 8 M 71 ALS 6:45 NBB 9 M 74 ALS 7:20 NDRI 10 M 62 ALS 6:55 NBB NBB - Netherland's Brain Bank ( NDRI - National Disease Research Interchange (
3 Supplementary Table 2. Characteristics of human fibroblast-derived induced pluripotent stem cell (ipsc) lines ipsc line Diagnosis Sex Age Reprogramming strategy Reference 27b ALS (SOD1/G85S) Female 29 Retrovirus, 3 factors: OSK 29d ALS (SOD1/L144F) Female 82 Retrovirus 4 factors: OSKM 1 1 AL/ALS 1.1 ALS (SOD1/L144F) Female 55 Non viral 6 factors: OSKM+LN This report SC603A/B-ALS ALS, sporadic Female 61 Retrovirus, 4 factors: OSKM AM/ALS 1.1 ALS, sporadic Female 77 Non viral 6 factors: OSKM+LN This report ips Foreskin Healthy Donor Male newborn Lentivirus, 4 factors: OSNL 19.9 Healthy Donor Male newborn Non viral 6 factors: OSKM+LN 2 3 CP13c Healthy Donor Female 45 Non viral 6 factors: OSKM+LN This report 11b Healthy Donor Male 36 Retrovirus 3 factors: OSK 15b Healthy Donor Female 48 Retrovirus 3 factors: OSK 1 1 ipsc line Diagnosis Sex Age Reprogramming strategy Reference SMA 1.1 SMA I Male 3 Non viral 6 factors: OSKM+LN SMA 2.1 SMA I Male 2 Non viral 6 factors: OSKM+LN 19.9 Healthy Donor Male newborn Non viral 6 factors: OSKM+LN CP13c Healthy Donor Female 45 Non viral 6 factors: OSKM+LN This report References 1. Boulting, G.L., et al. A functionally characterized test set of human induced pluripotent stem cells. Nat Biotechnol 29, (2011). 2. Yu, J., et al. Induced pluripotent stem cell lines derived from human somatic cells. Science 318, (2007). 3. Yu, J., et al. Human induced pluripotent stem cells free of vector and transgene sequences. Science 324, (2009). 4. Corti, S., et al. Genetic correction of human induced pluripotent stem cells from patients with spinal muscular atrophy. Sci Transl Med 4, 165ra162 (2012).
4 Supplementary Table 3. Number of motor neurons used to quantify IGF-2 and IGF- 1R signal intensity in immunostained tissues Tissue origin Motor neuron counts CNIII CNXII SC IGF-2 Wild-type mice, P SOD1 G93A mice, P ND Control patients ALS patients pigf-1r Wild-type mice, P SOD1 G93A mice, P IGF-1R Wild-type mice, P SOD1 G93A mice, P pigf-2r Wild-type mice, P SOD1 G93A mice, P
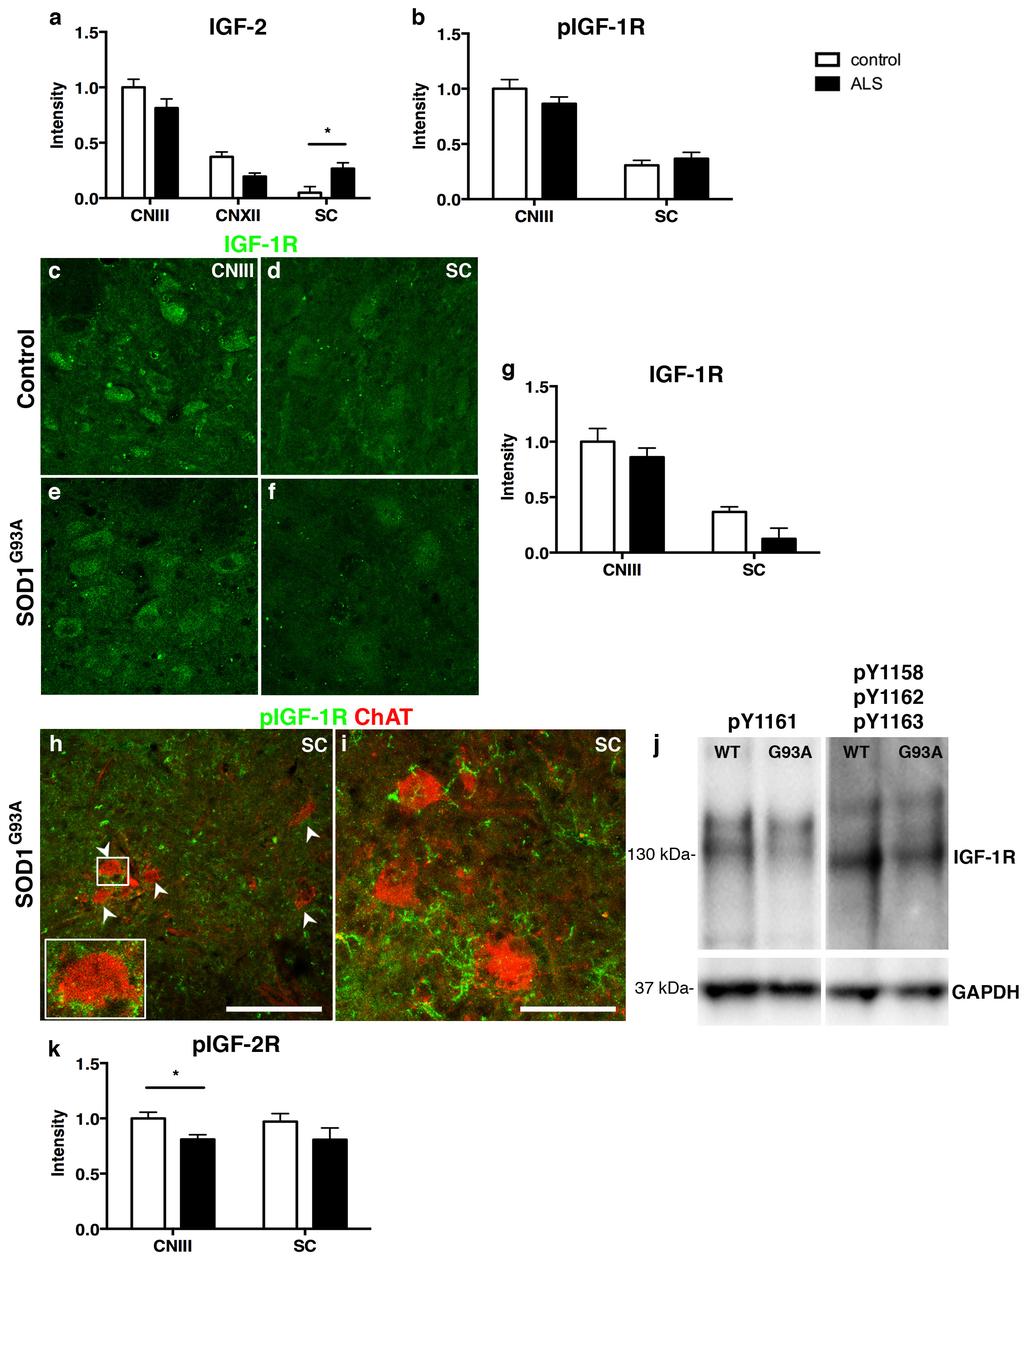
5 Supplementary Figure 1. Analysis of IGF-2 and IGF receptors in wild-type and SOD1 G93A mice. Protein quantification was assessed by immunohistochemistry. Statistical analysis utilizing 2-way ANOVA with genotype and motor neuron group as factors was performed for IGF-2 levels and showed a main effect of motor neuron group (F(2,426)=97.03, P<0.0001), and the interaction between genotype and MN group (F(2,426)=8.08, P=0.0004). Post hoc analysis showed that the interaction was driven by a significant difference in spinal motor neurons between wild-type and SOD G93A animals at the P126 time point (P=0.0202) (a, n=3 per genotype). Expression of phosphorylated IGF-1R did not differ in oculomotor and spinal motor neurons between wild-type and SOD G93A animals (b, n=3 per genotype, 2-way ANOVA), however a main effect of motor neuron group was detected (F(1,254)=91.18, P<0.0001) reinforcing the data shown in figure 2e. Overall levels of IGF-1R were assessed with a pan marker (c-f). 2-way ANOVA showed a main effect of motor neuron group (F(1,139)=46.17, P<0.0001), and post hoc analysis revealed significantly higher IGF-1R levels in oculomotor neurons compared to spinal motor neurons for both genotypes (P<0.0001) (g). Immunofluorescent staining and confocal imaging showed that (h) pigf-1r protein was present at very low levels in spinal motor neurons of SOD G93A mice and more prominently in (i) glial cells surrounding the motor neurons in the SOD G93A mice. (j) Extracts from extraocular muscles from wild-type and SOD G93A animals were run on the same gel and after transfer membranes were cut for staining with different antibodies. Both antibodies, directed either against the Y1161 or against the Y1158, Y1162, and Y1163 phosphorylation sites of the IGF-1R protein showed bands of around 130 kda in size. Phosphorylated IGF-2R levels analyzed by immunohistochemistry were compared with 2- way ANOVA. A main effect of genotype was detected (F(1,194)=7.10, P=0.0083) and post hoc analysis showed a significant difference between wild-type and SOD G93A animals in oculomotor neurons (P=0.041). Scale bar: f: 20 µm (applicable to c-e) h: 50 µm, i: 20 µm.
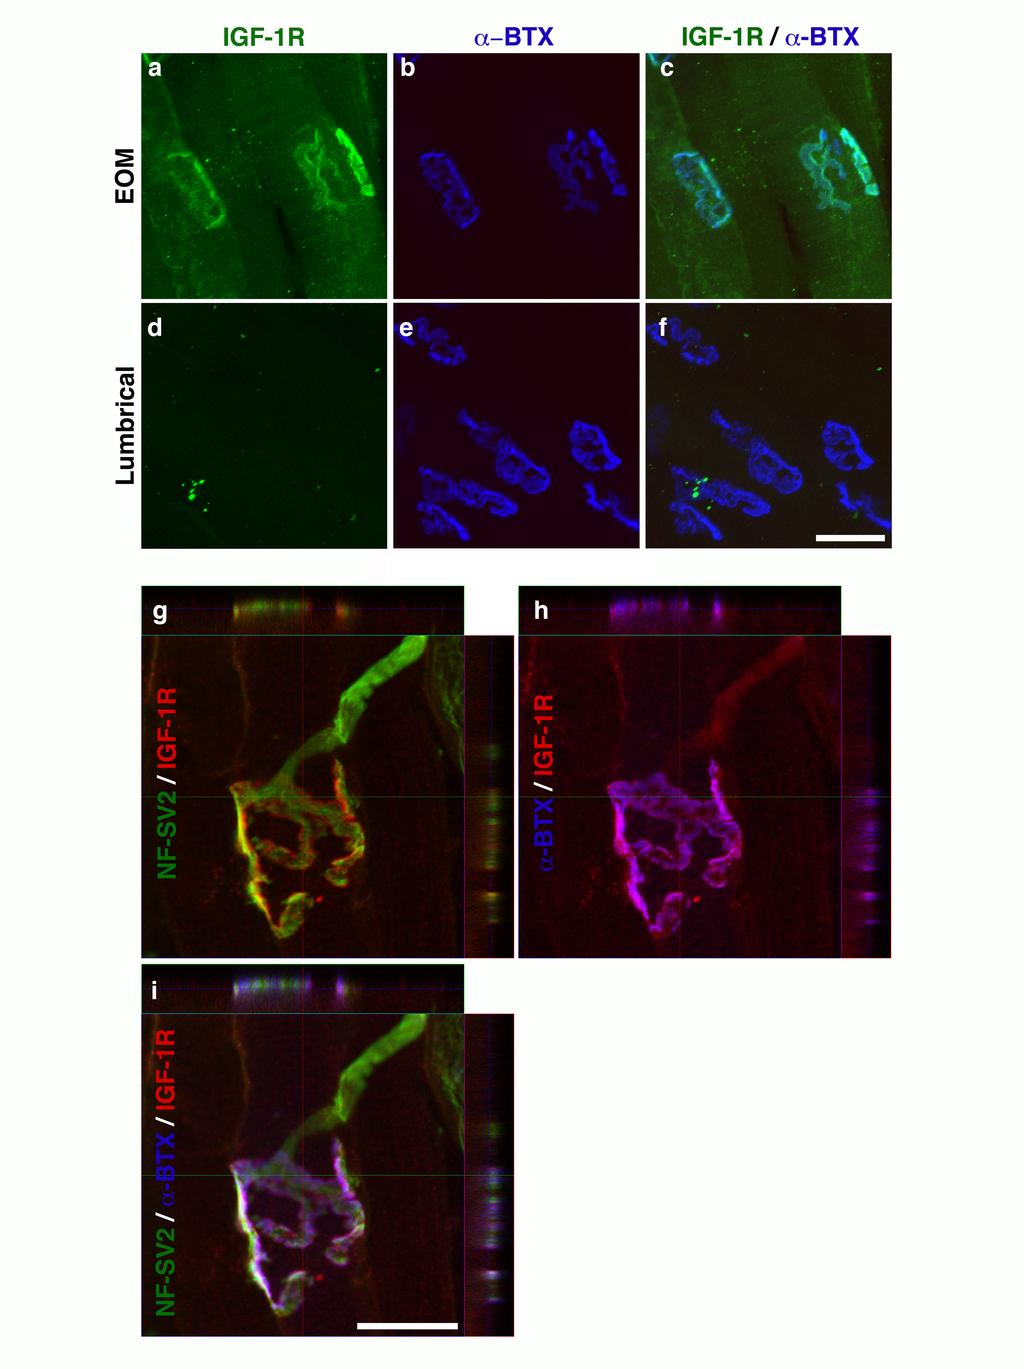
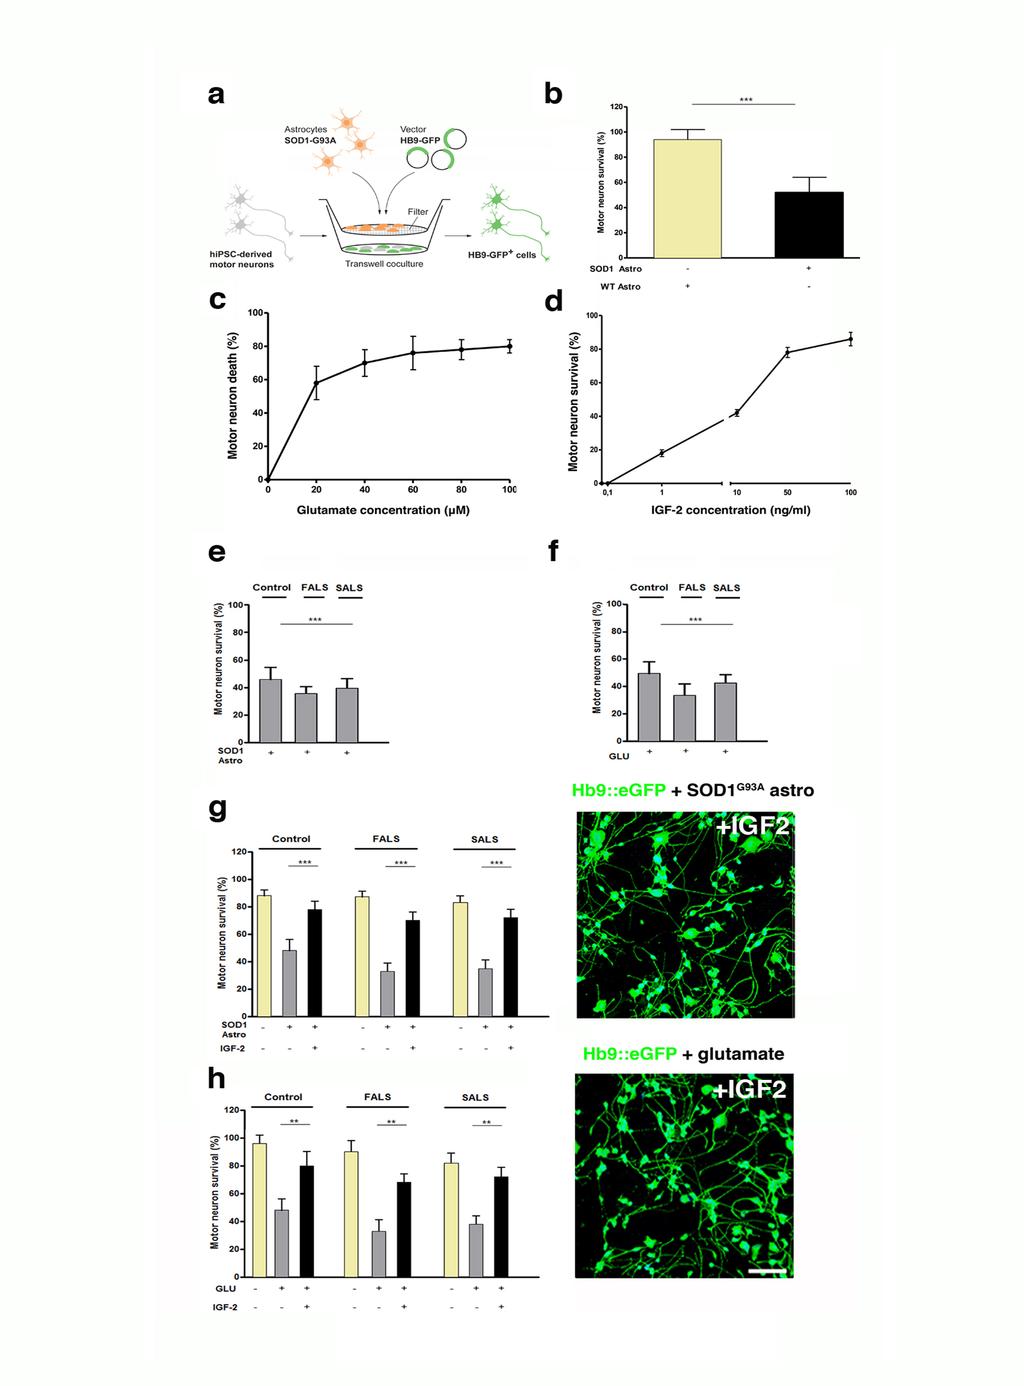
6 Supplementary Figure 2. IGF-1R staining on extraocular muscles co-localized with acetylcholine receptor staining of motor endplates. Immunofluorescent staining of (a-c) extraocular (EOM) muscles and (d-f) lumbrical muscles with bungarotoxin (BTX; 488 nm, green) and an anti-igf-1r antibody (647 nm, blue), showed that IGF-1R expression colocalized with AChR staining in EOMs (a, c), while the staining was below detection level in lumbricals (d, f). High magnification confocal images (and orthogonal views) showed that IGF-1R was mainly co-localized with the postsynaptic motor endplates (g-i), although some IGF-1R was expressed in the incoming motor axon (g). Scale bar: f: 20 µm (applicable to a-f), i: 20 µm (applicable to g-i). Supplementary Figure 3. IGF-2 added prior to SOD1 astrocyte or glutamate-induced toxicity protects human spinal motor neurons in culture. (a) Schematic drawing (by Mattias Karlen) of the transwell co-culture system of motor neurons and muscle. ipsc derived motor neurons were vulnerable to (b) co-culture with mutant SOD1 G93A astrocytes and to (c) increased levels of glutamate. In the presence of 20µM glutamate, a dose dependent effect of IGF-2 on motor neuron survival could be seen (d). sals and fals motor neurons were more sensitive to both (e) SOD1 G93A astrocytes (F(2,87)=18.28, P<0.001, ANOVA) and (f) glutamate (F(2,87)=36.69; P<0.001, ANOVA) toxicity respect to wild-type cells (n=10 independent experiments in triplicate; P<0.001, ANOVA). Treatment of cultures with IGF-2 (50 ng/ml) 2-4 hours prior to induction of toxicity by either co-culture with (g) mutant SOD1 G93A astrocytes or (h) glutamate insult protected motor neurons (SOD1 astrocytes, P<0.0001, ANOVA. Glutamate, P<0.0001, ANOVA; n= 5 independent experiments in triplicate per condition). Values represent means ± SD. Confocal micrographs of cultures (g) after 3 weeks of combined IGF-2 and mutant SOD1 astrocyte co-culture or (h) 7 days of combined IGF-2 and glutamate treatment show large numbers of motor neurons (visualized by their expression of Hb9-GFP). Scale bar =50µm in d.
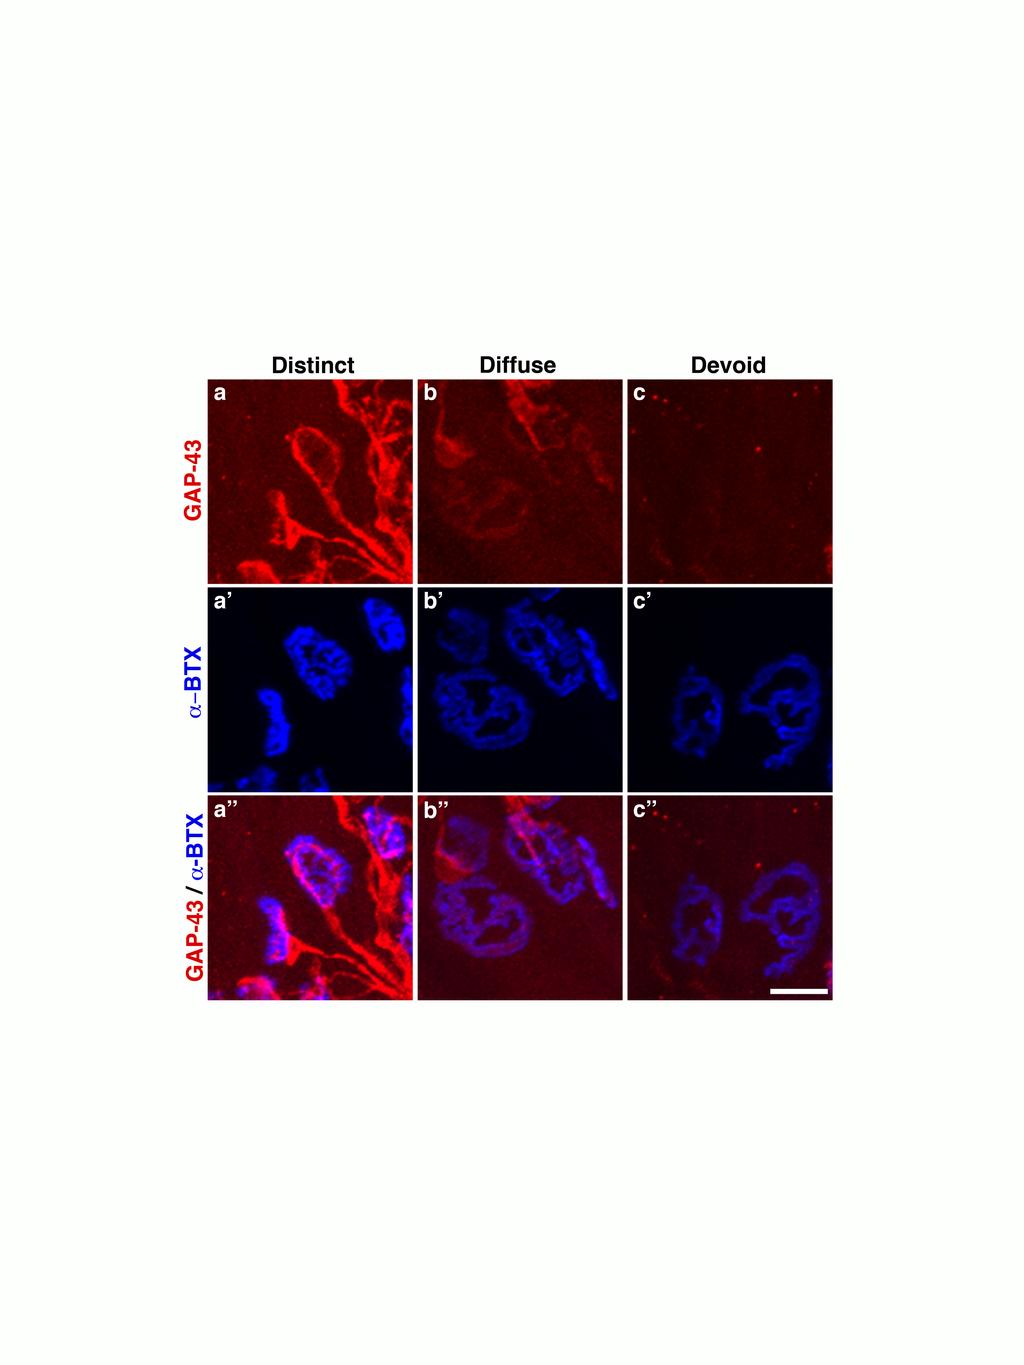
7 Supplementary Figure 4. Quantification of GAP-43 expression at the NMJ. Levels of GAP-43 staining varied between individual NMJs. NMJs were therefore subdivided into three different categories for the purposes of quantification, based on the level of GAP-43 expression. (a) Expression was considered to be distinct when there was bright GAP-43 immunoreactivity, with a defined structure juxtaposing the motor endplate. (b) NMJs with faint or undefined GAP-43 staining and those where the GAP-43 staining did not cover the majority of the endplate (>75%) were considered to have diffuse staining. (c) Motor endplates with no corresponding GAP-43 staining were considered to be devoid of GAP-43. Scale bar = 20µm.
8
9
10
11
Supplementary Information
 Supplementary Information Title Degeneration and impaired regeneration of gray matter oligodendrocytes in amyotrophic lateral sclerosis Authors Shin H. Kang, Ying Li, Masahiro Fukaya, Ileana Lorenzini,
SUPPLEMENTARY FIG. S2. Representative counting fields used in quantification of the in vitro neural differentiation of pattern of dnscs.
 Supplementary Data SUPPLEMENTARY FIG. S1. Representative counting fields used in quantification of the in vitro neural differentiation of pattern of anpcs. A panel of lineage-specific markers were used
SUPPLEMENTARY INFORMATION
 doi: 10.1038/nature06994 A phosphatase cascade by which rewarding stimuli control nucleosomal response A. Stipanovich*, E. Valjent*, M. Matamales*, A. Nishi, J.H. Ahn, M. Maroteaux, J. Bertran-Gonzalez,
Nature Neuroscience: doi: /nn Supplementary Figure 1
 Supplementary Figure 1 Subcellular segregation of VGluT2-IR and TH-IR within the same VGluT2-TH axon (wild type rats). (a-e) Serial sections of a dual VGluT2-TH labeled axon. This axon (blue outline) has
SUPPLEMENTARY INFORMATION
 doi:10.1038/nature10353 Supplementary Figure 1. Mutations of UBQLN2 in patients with ALS and ALS/dementia. (a) A mutation, c.1489c>t (p.p497s), was identified in F#9975. The pedigree is shown on the left
SUPPLEMENTARY INFORMATION
 DOI: 10.1038/ncb2566 Figure S1 CDKL5 protein expression pattern and localization in mouse brain. (a) Multiple-tissue western blot from a postnatal day (P) 21 mouse probed with an antibody against CDKL5.
In vivo reprogramming reactive glia into ipscs to produce new neurons in the
 In vivo reprogramming reactive glia into ipscs to produce new neurons in the cortex following traumatic brain injury Xiang Gao 1, Xiaoting Wang 1, Wenhui Xiong 1, Jinhui Chen 1, * 1 Spinal Cord and Brain
Supplementary Figure 1. Microglia do not show signs of classical immune activation following MD a-b. Images showing immunoreactivity for MHCII (a)
") 1 Supplementary Figure 1. Microglia do not show signs of classical immune activation following MD a-b. Images showing immunoreactivity for MHCII (a) and CD45 (b) in fixed sections of binocular visual cortex
1 Supplementary Figure 1. Microglia do not show signs of classical immune activation following MD a-b. Images showing immunoreactivity for MHCII (a) and CD45 (b) in fixed sections of binocular visual cortex
Supplemental Figure 1. Intracranial transduction of a modified ptomo lentiviral vector in the mouse
 Supplemental figure legends Supplemental Figure 1. Intracranial transduction of a modified ptomo lentiviral vector in the mouse hippocampus targets GFAP-positive but not NeuN-positive cells. (A) Stereotaxic
Supplementary Figure S1. Monolayer differentiation of mouse ESCs into telencephalic neural precursors. (a) Schematic representation of the protocols
 Schematic representation of the protocols") Supplementary Figure S1. Monolayer differentiation of mouse ESCs into telencephalic neural precursors. (a) Schematic representation of the protocols used to differentiate mouse ESCs. (b) Representative
Supplementary Figure S1. Monolayer differentiation of mouse ESCs into telencephalic neural precursors. (a) Schematic representation of the protocols used to differentiate mouse ESCs. (b) Representative
Supplementary Materials for VAMP4 directs synaptic vesicles to a pool that selectively maintains asynchronous neurotransmission
 Supplementary Materials for VAMP4 directs synaptic vesicles to a pool that selectively maintains asynchronous neurotransmission Jesica Raingo, Mikhail Khvotchev, Pei Liu, Frederic Darios, Ying C. Li, Denise
Supplementary Figure 1
 Supplementary Figure 1 Arcuate ChIEF-tdTomato neurons expressed TH These micrographs show that TH-Cre-ChIEF-tdTomato (magenta), expressed by AAV in a TH-Cre mouse, were immunostained with TH (green) in
Nature Medicine: doi: /nm.4322
 1 2 3 4 5 6 7 8 9 10 11 Supplementary Figure 1. Predicted RNA structure of 3 UTR and sequence alignment of deleted nucleotides. (a) Predicted RNA secondary structure of ZIKV 3 UTR. The stem-loop structure
Nature Neuroscience: doi: /nn.4335
 Supplementary Figure 1 Cholinergic neurons projecting to the VTA are concentrated in the caudal mesopontine region. (a) Schematic showing the sites of retrograde tracer injections in the VTA: cholera toxin
293T cells were transfected with indicated expression vectors and the whole-cell extracts were subjected
 SUPPLEMENTARY INFORMATION Supplementary Figure 1. Formation of a complex between Slo1 and CRL4A CRBN E3 ligase. (a) HEK 293T cells were transfected with indicated expression vectors and the whole-cell
Supplementary Table 1. List of primers used in this study
 Supplementary Table 1. List of primers used in this study Gene Forward primer Reverse primer Rat Met 5 -aggtcgcttcatgcaggt-3 5 -tccggagacacaggatgg-3 Rat Runx1 5 -cctccttgaaccactccact-3 5 -ctggatctgcctggcatc-3
Supplementary Figure 1
 Supplementary Figure 1 AAV-GFP injection in the MEC of the mouse brain C57Bl/6 mice at 4 months of age were injected with AAV-GFP into the MEC and sacrificed at 7 days post injection (dpi). (a) Brains
(a) Schematic diagram of the FS mutation of UVRAG in exon 8 containing the highly instable
 Schematic diagram of the FS mutation of UVRAG in exon 8 containing the highly instable") Supplementary Figure 1. Frameshift (FS) mutation in UVRAG. (a) Schematic diagram of the FS mutation of UVRAG in exon 8 containing the highly instable A 10 DNA repeat, generating a premature stop codon
Supplementary Figure 1. Frameshift (FS) mutation in UVRAG. (a) Schematic diagram of the FS mutation of UVRAG in exon 8 containing the highly instable A 10 DNA repeat, generating a premature stop codon
Supplemental Table I
 Supplemental Table I Cortex Hippocampus Age (weeks) Genotype STE 61 pste 61 STE 61 pste 61 8 100.0 ± 4.4 96.2 ± 6.0 99.8 ± 8.7 167.5 ± 7.8* 100.0 ± 7.0 90.5 ± 13.8 100.0 ± 12.8 260.4 ± 33.9** 12 100.0
Disrupting GluA2-GAPDH Interaction Affects Axon and Dendrite Development
 Disrupting GluA2-GAPDH Interaction Affects Axon and Dendrite Development 1 Frankie Hang Fung Lee, 1 Ping Su, 1 Yu Feng Xie, 1 Kyle Ethan Wang, 2 Qi Wan and 1,3 Fang Liu 1 Campbell Research Institute, Centre
marker. DAPI labels nuclei. Flies were 20 days old. Scale bar is 5 µm. Ctrl is
 Supplementary Figure 1. (a) Nos is detected in glial cells in both control and GFAP R79H transgenic flies (arrows), but not in deletion mutant Nos Δ15 animals. Repo is a glial cell marker. DAPI labels
Supplementary Figure 1: Validation of labeling specificity of immature OSNs and presynaptic terminals. (A) (B) (C) (D) (E)
 (B) (C) (D) (E)") Supplementary Figure 1: Validation of labeling specificity of immature OSNs and presynaptic terminals. (A) Confocal images of septal olfactory epithelium of an adult Gγ8-sypGFP-tdTom mouse showing colocalization
Supplementary Figure 1: Validation of labeling specificity of immature OSNs and presynaptic terminals. (A) Confocal images of septal olfactory epithelium of an adult Gγ8-sypGFP-tdTom mouse showing colocalization
SUPPLEMENTARY INFORMATION
 SUPPLEMENTARY INFORMATION doi:10.1038/nature11306 Supplementary Figures Supplementary Figure 1. Basic characterization of GFP+ RGLs in the dentate gyrus of adult nestin-gfp mice. a, Sample confocal images
Supplementary Figure 1 Expression of Crb3 in mouse sciatic nerve: biochemical analysis (a) Schematic of Crb3 isoforms, ERLI and CLPI, indicating the
 Schematic of Crb3 isoforms, ERLI and CLPI, indicating the") Supplementary Figure 1 Expression of Crb3 in mouse sciatic nerve: biochemical analysis (a) Schematic of Crb3 isoforms, ERLI and CLPI, indicating the location of the transmembrane (TM), FRM binding (FB)
Supplementary Figure 1 Expression of Crb3 in mouse sciatic nerve: biochemical analysis (a) Schematic of Crb3 isoforms, ERLI and CLPI, indicating the location of the transmembrane (TM), FRM binding (FB)
Supplementary Materials
 Supplementary Materials Fig. S1. Weights of full-dose treatment groups comparing 1 st, 2 nd, and 3 rd generation gene replacement therapy. Mice were treated at p1 with 4x10 11 GC of the three different
An unconventional role for mirna: let-7 activates Toll-like receptor 7 and causes neurodegeneration
 An unconventional role for mirna: let-7 activates Toll-like receptor 7 and causes neurodegeneration Sabrina M. Lehmann, Christina Krüger, Boyoun Park, Katja Derkow, Karen Rosenberger, Jan Baumgart, Thorsten
Supplementary Materials for. c-abl Activation Plays a Role in α-synucleinopathy Induced Neurodegeneration
 Supplementary Materials for c-abl Activation Plays a Role in α-synucleinopathy Induced Neurodegeneration Saurav Brahmachari, Preston Ge, Su Hyun Lee, Donghoon Kim, Senthilkumar S. Karuppagounder, Manoj
Nature Neuroscience: doi: /nn Supplementary Figure 1. Splenic atrophy and leucopenia caused by T3 SCI.
 Supplementary Figure 1 Splenic atrophy and leucopenia caused by T3 SCI. (a) Gross anatomy of representative spleens from control and T3 SCI mice at 28 days post-injury. (b and c) Hematoxylin and eosin
Supplementary Figure 1
 Supplementary Figure 1 Genetic labeling of microglia Male and female 2-3 month-old CreERT2;R26-tdTomato mice or CreERT2;R26-tdTomato;Iba1-eGFP transgenic mice were treated with 1x, 2x (48 h apart), or
Supplemental Figure 1. Western blot analysis indicated that MIF was detected in the fractions of
 Supplemental Figure Legends Supplemental Figure 1. Western blot analysis indicated that was detected in the fractions of plasma membrane and cytosol but not in nuclear fraction isolated from Pkd1 null
CHAPTER 5 RESULTS Previous study: cell culture and organotypical slices
 45 CHAPTER 5 RESULTS 5.1. Previous study: cell culture and organotypical slices Initial experiments have been conducted to ensure that the tet-on system works. A neuronal cell culture from mice expressing
SUPPLEMENTARY INFORMATION
 DOI:.38/ncb3399 a b c d FSP DAPI 5mm mm 5mm 5mm e Correspond to melanoma in-situ Figure a DCT FSP- f MITF mm mm MlanaA melanoma in-situ DCT 5mm FSP- mm mm mm mm mm g melanoma in-situ MITF MlanaA mm mm
Supplementary Figure 1. Western blot of hippocampal lysates from WT and Adcy1 KO mice demonstrates the specificity of the ADCY1 antibody.
 ADCY1 13 kda β-actin 45 kda Supplementary Figure 1. Western blot of hippocampal lysates from and mice demonstrates the specificity of the ADCY1 antibody. a DHPG perk1/2 ERK1/2 Relative level min 1.6 *
Supplementary Figure 1 hlrrk2 promotes CAP dependent protein translation.
 ` Supplementary Figure 1 hlrrk2 promotes CAP dependent protein translation. (a) Overexpression of hlrrk2 in HeLa cells enhances total protein synthesis in [35S] methionine/cysteine incorporation assays.
Supplementary fig. 1. Crystals induce necroptosis does not involve caspases, TNF receptor or NLRP3. A. Mouse tubular epithelial cells were pretreated
 Supplementary fig. 1. Crystals induce necroptosis does not involve caspases, TNF receptor or NLRP3. A. Mouse tubular epithelial cells were pretreated with zvad-fmk (10µM) and exposed to calcium oxalate
Stem Cell Transplantation for Motor Neuron Disease: Current Approaches and Future Perspectives
 Neurotherapeutics (2011) 8:591 606 DOI 10.1007/s13311-011-0068-7 Stem Cell Transplantation for Motor Neuron Disease: Current Approaches and Future Perspectives Genevieve Gowing & Clive N. Svendsen Published
Zhu et al, page 1. Supplementary Figures
 Zhu et al, page 1 Supplementary Figures Supplementary Figure 1: Visual behavior and avoidance behavioral response in EPM trials. (a) Measures of visual behavior that performed the light avoidance behavior
Nature Neuroscience: doi: /nn Supplementary Figure 1. Iliopsoas and quadratus lumborum motor neurons in the L2 spinal segment.
 Supplementary Figure 1 Iliopsoas and quadratus lumborum motor neurons in the L2 spinal segment. (A) IL and QL motor neurons were labeled after CTb-488 (green) muscle injections at birth. At P4, the L2
Supplementary Figure 1: Imaging T-ALL progression and growth in transplanted
 Supplementary Figure 1: Imaging T-ALL progression and growth in transplanted rag2e450fs fish. Monoclonal T-ALLs were serially passaged in strain fish and then used as donors (left panel). Cells were transplanted
T H E J O U R N A L O F C E L L B I O L O G Y
 T H E J O U R N A L O F C E L L B I O L O G Y Supplemental material Krenn et al., http://www.jcb.org/cgi/content/full/jcb.201110013/dc1 Figure S1. Levels of expressed proteins and demonstration that C-terminal
Rescue of mutant rhodopsin traffic by metformin-induced AMPK activation accelerates photoreceptor degeneration Athanasiou et al
 Supplementary Material Rescue of mutant rhodopsin traffic by metformin-induced AMPK activation accelerates photoreceptor degeneration Athanasiou et al Supplementary Figure 1. AICAR improves P23H rod opsin
Relative SOD1 activity. Relative SOD2 activity. Relative SOD activity (Infected:Mock) + CP + DDC
 + CP + DDC") Supplementary Figure 1. SOD1 activity is significantly increased relative to SOD1 levels. SOD1 and SOD2 activities in the infected mork13 cells are shown normalised to their corresponding levels and relative
Supplementary Figure 1. SOD1 activity is significantly increased relative to SOD1 levels. SOD1 and SOD2 activities in the infected mork13 cells are shown normalised to their corresponding levels and relative
Supplementary Figure 1. Validation of astrocytes. Primary astrocytes were
 Supplementary Figure 1. Validation of astrocytes. Primary astrocytes were separated from the glial cultures using a mild trypsinization protocol. Anti-glial fibrillary acidic protein (GFAP) immunofluorescent
Nature Neuroscience: doi: /nn Supplementary Figure 1
 Supplementary Figure 1 Drd1a-Cre driven ChR2 expression in the SCN. (a) Low-magnification image of a representative Drd1a-ChR2 coronal brain section (n = 2) showing endogenous tdtomato fluorescence (magenta).
Figure S1. Sorting nexin 9 (SNX9) specifically binds psmad3 and not psmad 1/5/8. Lysates from AKR-2B cells untreated (-) or stimulated (+) for 45 min
 specifically binds psmad3 and not psmad 1/5/8. Lysates from AKR-2B cells untreated (-) or stimulated (+) for 45 min") Figure S1. Sorting nexin 9 (SNX9) specifically binds psmad3 and not psmad 1/5/8. Lysates from AKR2B cells untreated () or stimulated () for 45 min with 5 ng/ml TGFβ or 10 ng/ml BMP4 were incubated with
Figure S1. Sorting nexin 9 (SNX9) specifically binds psmad3 and not psmad 1/5/8. Lysates from AKR2B cells untreated () or stimulated () for 45 min with 5 ng/ml TGFβ or 10 ng/ml BMP4 were incubated with
Expanded View Figures
 PEX13 functions in selective autophagy Ming Y Lee et al Expanded View Figures Figure EV1. PEX13 is required for Sindbis virophagy. A, B Quantification of mcherry-capsid puncta per cell (A) and GFP-LC3
Type of file: PDF Size of file: 0 KB Title of file for HTML: Supplementary Information Description: Supplementary Figures
 Type of file: PDF Size of file: 0 KB Title of file for HTML: Supplementary Information Description: Supplementary Figures Supplementary Figure 1 mir-128-3p is highly expressed in chemoresistant, metastatic
SUPPLEMENTARY INFORMATION
 DOI: 10.1038/ncb2535 Figure S1 SOX10 is expressed in human giant congenital nevi and its expression in human melanoma samples suggests that SOX10 functions in a MITF-independent manner. a, b, Representative
Quantitative PPARγ expression affects the balance between tolerance and immunity
 Quantitative PPARγ expression affects the balance between tolerance and immunity Ya-Hui Liu 1, Yau-Sheng Tsai 1,2,3, Shih-Chieh Lin 4, Nan-Shih Liao 5, Ming-Shiou Jan 6, Chung-Tiang Liang 7, Shih-Wen Hsu
SUPPLEMENTARY INFORMATION
 doi:10.1038/nature12652 Supplementary Figure 1. PRDM16 interacts with endogenous EHMT1 in brown adipocytes. Immunoprecipitation of PRDM16 complex by flag antibody (M2) followed by Western blot analysis
Supplementary Figure 1.TRIM33 binds β-catenin in the nucleus. a & b, Co-IP of endogenous TRIM33 with β-catenin in HT-29 cells (a) and HEK 293T cells
 and HEK 293T cells") Supplementary Figure 1.TRIM33 binds β-catenin in the nucleus. a & b, Co-IP of endogenous TRIM33 with β-catenin in HT-29 cells (a) and HEK 293T cells (b). TRIM33 was immunoprecipitated, and the amount of
Supplementary Figure 1.TRIM33 binds β-catenin in the nucleus. a & b, Co-IP of endogenous TRIM33 with β-catenin in HT-29 cells (a) and HEK 293T cells (b). TRIM33 was immunoprecipitated, and the amount of
1. Microfluidic device characteristics and cell compartmentalization
 Supplementary figures: 1. Microfluidic device characteristics and cell compartmentalization Microfluidic channels were molded in PDMS (Fig. S1 A and B) over silicon masters, which were structured with
Supplementary Figure 1. Confocal immunofluorescence showing mitochondrial translocation of Drp1. Cardiomyocytes treated with H 2 O 2 were prestained
 Supplementary Figure 1. Confocal immunofluorescence showing mitochondrial translocation of Drp1. Cardiomyocytes treated with H 2 O 2 were prestained with MitoTracker (red), then were immunostained with
Supplementary Figure 1: STAT3 suppresses Kras-induced lung tumorigenesis
 Supplementary Figure 1: STAT3 suppresses Kras-induced lung tumorigenesis (a) Immunohistochemical (IHC) analysis of tyrosine 705 phosphorylation status of STAT3 (P- STAT3) in tumors and stroma (all-time
Nature Neuroscience: doi: /nn Supplementary Figure 1
 Supplementary Figure 1 Atlas representations of the midcingulate (MCC) region targeted in this study compared against the anterior cingulate (ACC) region commonly reported. Coronal sections are shown on
(a) Significant biological processes (upper panel) and disease biomarkers (lower panel)
 Significant biological processes (upper panel) and disease biomarkers (lower panel)") Supplementary Figure 1. Functional enrichment analyses of secretomic proteins. (a) Significant biological processes (upper panel) and disease biomarkers (lower panel) 2 involved by hrab37-mediated secretory
Supplementary Figure 1. Functional enrichment analyses of secretomic proteins. (a) Significant biological processes (upper panel) and disease biomarkers (lower panel) 2 involved by hrab37-mediated secretory
Genesis of cerebellar interneurons and the prevention of neural DNA damage require XRCC1.
 Genesis of cerebellar interneurons and the prevention of neural DNA damage require XRCC1. Youngsoo Lee, Sachin Katyal, Yang Li, Sherif F. El-Khamisy, Helen R. Russell, Keith W. Caldecott and Peter J. McKinnon.
Postn MCM Smad2 fl/fl Postn MCM Smad3 fl/fl Postn MCM Smad2/3 fl/fl. Postn MCM. Tgfbr1/2 fl/fl TAC
 A Smad2 fl/fl Smad3 fl/fl Smad2/3 fl/fl Tgfbr1/2 fl/fl 1. mm B Tcf21 MCM Tcf21 MCM Smad3 fl/fl Tcf21 MCM Smad2/3 fl/fl Tcf21 MCM Tgfbr1/2 fl/fl αmhc MCM C 1. mm 1. mm D Smad2 fl/fl Smad3 fl/fl Smad2/3
SUPPLEMENTARY FIGURES
 SUPPLEMENTARY FIGURES 1 Supplementary Figure 1, Adult hippocampal QNPs and TAPs uniformly express REST a-b) Confocal images of adult hippocampal mouse sections showing GFAP (green), Sox2 (red), and REST
Nature Immunology: doi: /ni eee Supplementary Figure 1
 eee Supplementary Figure 1 Hyphae induce NET release, but yeast do not. (a) NET release by human peripheral neutrophils stimulated with a hgc1 yeast-locked C. albicans mutant (yeast) or pre-formed WT C.
Amyotrophic lateral sclerosis (ALS) is a fatal disorder characterized
 is a fatal disorder characterized") Gamma motor neurons survive and exacerbate alpha motor neuron degeneration in ALS Melanie Lalancette-Hebert a,b, Aarti Sharma a,b, Alexander K. Lyashchenko a,b, and Neil A. Shneider a,b,1 a Center for
Gamma motor neurons survive and exacerbate alpha motor neuron degeneration in ALS Melanie Lalancette-Hebert a,b, Aarti Sharma a,b, Alexander K. Lyashchenko a,b, and Neil A. Shneider a,b,1 a Center for
Schwarz et al. Activity-Dependent Ubiquitination of GluA1 Mediates a Distinct AMPAR Endocytosis
 Schwarz et al Activity-Dependent Ubiquitination of GluA1 Mediates a Distinct AMPAR Endocytosis and Sorting Pathway Supplemental Data Supplemental Fie 1: AMPARs undergo activity-mediated ubiquitination
Supplementary Figure 1
 Supplementary Figure 1 3 3 3 1 1 Bregma -1.6mm 3 : Bregma Ref) Http://www.mbl.org/atlas165/atlas165_start.html Bregma -.18mm Supplementary Figure 1 Schematic representation of the utilized brain slice
Nature Neuroscience: doi: /nn Supplementary Figure 1
 Supplementary Figure 1 Quantification of myelin fragments in the aging brain (a) Electron microscopy on corpus callosum is shown for a 18-month-old wild type mice. Myelin fragments (arrows) were detected
DC were seeded into tissue culture dishes in IMDM 2% FCS, and added with PMN. (1:1; PMN: DC) for 16h also in the presence of DNAse (100 U/ml); DC were
 for 16h also in the presence of DNAse (100 U/ml); DC were") Supplementary methods Flow cytometric analysis of DCs. DC were seeded into tissue culture dishes in IMDM 2% FCS, and added with PMN (1:1; PMN: DC) for 16h also in the presence of DNAse (100 U/ml); DC were
Supplementary methods Flow cytometric analysis of DCs. DC were seeded into tissue culture dishes in IMDM 2% FCS, and added with PMN (1:1; PMN: DC) for 16h also in the presence of DNAse (100 U/ml); DC were
SUPPLEMENTARY INFORMATION
 DOI: 10.1038/ncb2607 Figure S1 Elf5 loss promotes EMT in mammary epithelium while Elf5 overexpression inhibits TGFβ induced EMT. (a, c) Different confocal slices through the Z stack image. (b, d) 3D rendering
Supplementary Figure 1. Ent inhibits LPO activity in a dose- and time-dependent fashion.
 Supplementary Information Supplementary Figure 1. Ent inhibits LPO activity in a dose- and time-dependent fashion. Various concentrations of Ent, DHBA or ABAH were pre-incubated for 10 min with LPO (50
Tumor suppressor Spred2 interaction with LC3 promotes autophagosome maturation and induces autophagy-dependent cell death
 www.impactjournals.com/oncotarget/ Oncotarget, Supplementary Materials 2016 Tumor suppressor Spred2 interaction with LC3 promotes autophagosome maturation and induces autophagy-dependent cell death Supplementary
SUPPLEMENTARY INFORMATION
 DOI: 10.1038/ncb3021 Supplementary figure 1 Characterisation of TIMPless fibroblasts. a) Relative gene expression of TIMPs1-4 by real time quantitative PCR (RT-qPCR) in WT or ΔTimp fibroblasts (mean ±
Silencing neurotransmission with membrane-tethered toxins
 nature methods Silencing neurotransmission with membrane-tethered toxins Sebastian Auer, Annika S Stürzebecher, René Jüttner, Julio Santos-Torres, Christina Hanack, Silke Frahm, Beate Liehl & Inés Ibañez-Tallon
Nature Neuroscience: doi: /nn Supplementary Figure 1. Large-scale calcium imaging in vivo.
 Supplementary Figure 1 Large-scale calcium imaging in vivo. (a) Schematic illustration of the in vivo camera imaging set-up for large-scale calcium imaging. (b) High-magnification two-photon image from
Supplemental Information. Induction of Expansion and Folding. in Human Cerebral Organoids
 Cell Stem Cell, Volume 20 Supplemental Information Induction of Expansion and Folding in Human Cerebral Organoids Yun Li, Julien Muffat, Attya Omer, Irene Bosch, Madeline A. Lancaster, Mriganka Sur, Lee
Dep. Control Time (min)
") aa Control Dep. RP 1s 1 mv 2s 1 mv b % potentiation of IPSP 2 15 1 5 Dep. * 1 2 3 4 Time (min) Supplementary Figure 1. Rebound potentiation of IPSPs in PCs. a, IPSPs recorded with a K + gluconate pipette
aa Control Dep. RP 1s 1 mv 2s 1 mv b % potentiation of IPSP 2 15 1 5 Dep. * 1 2 3 4 Time (min) Supplementary Figure 1. Rebound potentiation of IPSPs in PCs. a, IPSPs recorded with a K + gluconate pipette
Supplementary Figure 1
 Supplementary Figure 1 The average sigmoid parametric curves of capillary dilation time courses and average time to 50% peak capillary diameter dilation computed from individual capillary responses averaged
SUPPLEMENTARY INFORMATION
 1. Supplementary Figures and Legends Supplementary Fig. 1. S1P-mediated transcriptional regulation of integrins expressed in OP/monocytoid cells. Real-time quantitative PCR analyses of mrna for two integrins,
Fibrinogen-induced perivascular microglial clustering is required for the. development of axonal damage in neuroinflammation
 SUPPLEMENTARY INFORMATION Fibrinogen-induced perivascular microglial clustering is required for the development of axonal damage in neuroinflammation Dimitrios Davalos, Jae Kyu Ryu, Mario Merlini, Kim
Supplementary Figure 1. SybII and Ceb are sorted to distinct vesicle populations in astrocytes. Nature Neuroscience: doi: /nn.
 Supplementary Figure 1 SybII and Ceb are sorted to distinct vesicle populations in astrocytes. (a) Exemplary images for cultured astrocytes co-immunolabeled with SybII and Ceb antibodies. SybII accumulates
Supplementary Figure 1 Information on transgenic mouse models and their recording and optogenetic equipment. (a) 108 (b-c) (d) (e) (f) (g)
 108 (b-c) (d) (e) (f) (g)") Supplementary Figure 1 Information on transgenic mouse models and their recording and optogenetic equipment. (a) In four mice, cre-dependent expression of the hyperpolarizing opsin Arch in pyramidal cells
Supplementary Figure 1 Information on transgenic mouse models and their recording and optogenetic equipment. (a) In four mice, cre-dependent expression of the hyperpolarizing opsin Arch in pyramidal cells
GFP/Iba1/GFAP. Brain. Liver. Kidney. Lung. Hoechst/Iba1/TLR9!
 Supplementary information a +KA Relative expression d! Tlr9 5!! 5! NSC Neuron Astrocyte Microglia! 5! Tlr7!!!! NSC Neuron Astrocyte! GFP/Sβ/! Iba/Hoechst Microglia e Hoechst/Iba/TLR9! GFP/Iba/GFAP f Brain
Supplementary Materials for
 www.sciencesignaling.org/cgi/content/full/6/283/ra57/dc1 Supplementary Materials for JNK3 Couples the Neuronal Stress Response to Inhibition of Secretory Trafficking Guang Yang,* Xun Zhou, Jingyan Zhu,
Supplementary Table 1. The primers used for quantitative RT-PCR. Gene name Forward (5 > 3 ) Reverse (5 > 3 )
 Reverse (5 > 3 )") 770 771 Supplementary Table 1. The primers used for quantitative RT-PCR. Gene name Forward (5 > 3 ) Reverse (5 > 3 ) Human CXCL1 GCGCCCAAACCGAAGTCATA ATGGGGGATGCAGGATTGAG PF4 CCCCACTGCCCAACTGATAG TTCTTGTACAGCGGGGCTTG
770 771 Supplementary Table 1. The primers used for quantitative RT-PCR. Gene name Forward (5 > 3 ) Reverse (5 > 3 ) Human CXCL1 GCGCCCAAACCGAAGTCATA ATGGGGGATGCAGGATTGAG PF4 CCCCACTGCCCAACTGATAG TTCTTGTACAGCGGGGCTTG
Amyotrophic Lateral Sclerosis Research Program
 Amyotrophic Lateral Sclerosis Research Program U.S. Army Medical Research and Materiel Command CDMRP VISION Find and fund the best research to eradicate diseases and support the warfighter for the benefit
SUPPLEMENTARY FIGURES AND TABLE
 SUPPLEMENTARY FIGURES AND TABLE Supplementary Figure S1: Characterization of IRE1α mutants. A. U87-LUC cells were transduced with the lentiviral vector containing the GFP sequence (U87-LUC Tet-ON GFP).
mir-7a regulation of Pax6 in neural stem cells controls the spatial origin of forebrain dopaminergic neurons
 Supplemental Material mir-7a regulation of Pax6 in neural stem cells controls the spatial origin of forebrain dopaminergic neurons Antoine de Chevigny, Nathalie Coré, Philipp Follert, Marion Gaudin, Pascal
McWilliams et al., http :// /cgi /content /full /jcb /DC1
 Supplemental material JCB McWilliams et al., http ://www.jcb.org /cgi /content /full /jcb.201603039 /DC1 THE JOURNAL OF CELL BIOLOGY Figure S1. In vitro characterization of mito-qc. (A and B) Analysis
Supplementary Figure S1 Supplementary Figure S2
 Supplementary Figure S A) The blots shown in Figure B were qualified by using Gel-Pro analyzer software (Rockville, MD, USA). The ratio of LC3II/LC3I to actin was then calculated. The data are represented
SUPPLEMENTARY INFORMATION
 Supplementary Figure 1. Behavioural effects of ketamine in non-stressed and stressed mice. Naive C57BL/6 adult male mice (n=10/group) were given a single dose of saline vehicle or ketamine (3.0 mg/kg,
Supplemental Information. Tissue Myeloid Progenitors Differentiate. into Pericytes through TGF-b Signaling. in Developing Skin Vasculature
 Cell Reports, Volume 18 Supplemental Information Tissue Myeloid Progenitors Differentiate into Pericytes through TGF-b Signaling in Developing Skin Vasculature Tomoko Yamazaki, Ani Nalbandian, Yutaka Uchida,
Nature Biotechnology: doi: /nbt Supplementary Figure 1. Analysis of hair bundle morphology in Ush1c c.216g>a mice at P18 by SEM.
 Supplementary Figure 1 Analysis of hair bundle morphology in Ush1c c.216g>a mice at P18 by SEM. (a-c) Heterozygous c.216ga mice displayed normal hair bundle morphology at P18. (d-i) Disorganized hair bundles
Supplementary Figure 1.
 Supplementary Figure 1. Transduction of adipocytes after intra-ewat administration of AAV vectors. A: Immunostaining against GFP (green) in sections of ewat two weeks after the intra-ewat administration
Unique functional properties of somatostatin-expressing GABAergic neurons in mouse barrel cortex
 Supplementary Information Unique functional properties of somatostatin-expressing GABAergic neurons in mouse barrel cortex Luc Gentet, Yves Kremer, Hiroki Taniguchi, Josh Huang, Jochen Staiger and Carl
Nature Medicine: doi: /nm.3922
 Title: Glucocorticoid-induced tumor necrosis factor receptor-related protein co-stimulation facilitates tumor regression by inducing IL-9-producing helper T cells Authors: Il-Kyu Kim, Byung-Seok Kim, Choong-Hyun
Supplementary Figure 1
 Supplementary Figure 1 Kif1a RNAi effect on basal progenitor differentiation Related to Figure 2. Representative confocal images of the VZ and SVZ of rat cortices transfected at E16 with scrambled or Kif1a
Supplemental Material
 Supplemental Material Supplementary Fig. 1. EETs stimulate primary tumor growth. a) Schematic presentation of genetic and pharmacological tools used to manipulate endogenous EET levels. b) Endothelial
Nature Neuroscience: doi: /nn Supplementary Figure 1. Distribution of starter cells for RV-mediated retrograde tracing.
 Supplementary Figure 1 Distribution of starter cells for RV-mediated retrograde tracing. Parcellation of cortical areas is based on Allen Mouse Brain Atlas and drawn to scale. Thick white curves, outlines
Supplementary Figure 1
 Supplementary Figure 1 5 microns C7 B6 unclassified H19 C7 signal H19 guide signal H19 B6 signal C7 SNP spots H19 RNA spots B6 SNP spots colocalization H19 RNA classification Supplementary Figure 1. Allele-specific
hexahistidine tagged GRP78 devoid of the KDEL motif (GRP78-His) on SDS-PAGE. This
 on SDS-PAGE. This") SUPPLEMENTAL FIGURE LEGEND Fig. S1. Generation and characterization of. (A) Coomassie staining of soluble hexahistidine tagged GRP78 devoid of the KDEL motif (GRP78-His) on SDS-PAGE. This protein was expressed
SUPPLEMENTAL FIGURE LEGEND Fig. S1. Generation and characterization of. (A) Coomassie staining of soluble hexahistidine tagged GRP78 devoid of the KDEL motif (GRP78-His) on SDS-PAGE. This protein was expressed
Disruption of the astrocytic TNFR1-GDNF axis accelerates motor neuron degeneration and disease progression in amyotrophic lateral sclerosis
 Disruption of the astrocytic TNFR1-GDNF axis accelerates motor neuron degeneration and disease progression in amyotrophic lateral sclerosis Daniela Rossi Laboratory of Research on Neurodegenerative Disorders
Supplementary Figure 1: Signaling centers contain few proliferating cells, express p21, and
 Supplementary Figure 1: Signaling centers contain few proliferating cells, express p21, and exclude YAP from the nucleus. (a) Schematic diagram of an E10.5 mouse embryo. (b,c) Sections at B and C in (a)
Figure S1. Reduction in glomerular mir-146a levels correlate with progression to higher albuminuria in diabetic patients.
 Supplementary Materials Supplementary Figures Figure S1. Reduction in glomerular mir-146a levels correlate with progression to higher albuminuria in diabetic patients. Figure S2. Expression level of podocyte