Cell-Cell Contact-Mediated Hepatitis C Virus (HCV) Transfer, Productive. Infection and Replication and Its Requirement for HCV Receptors
|
|
|
- William Holland
- 6 years ago
- Views:
Transcription
1 JVI Accepts, published online ahead of print on 29 May 2013 J. Virol. doi: /jvi Copyright 2013, American Society for Microbiology. All Rights Reserved. 1 2 Cell-Cell Contact-Mediated Hepatitis C Virus (HCV) Transfer, Productive Infection and Replication and Its Requirement for HCV Receptors 3 4 Ziqing Liu 1 and Johnny J. He 1,2, * Department of Microbiology and Immunology, Indiana University School of Medicine, Indianapolis, IN 46202; 2 University of North Texas Health Science Center, Fort Worth, TX To whom correspondence should be addressed: University of North Texas Health Science Center, 3500 Camp Bowie Blvd., Fort Worth, TX Tel (817) Fax (817) johnny.he@unthsc.edu Running title: A new route of HCV infection and transmission Keywords: HCV; Cell-cell contact-mediated infection; Receptors; TC labeling; Productive infection; Cytoskeleton 1
2 18 ABSTRACT Hepatitis C virus (HCV) infection is believed to begin with interactions between cell-free HCV and cell receptors that include CD81, scavenger receptor B1 (SR-B1), claudin-1 (CLDN1) and occludin (OCLN). In this study, we have demonstrated that HCV spreading from infected hepatocytes to uninfected hepatocytes leads to the transfer of HCV and the formation of infection foci and is cell density-dependent. This cell-cell contact-mediated (CCCM) HCV transfer occurs readily and requires all these known HCV receptors and intact actin cytoskeleton. With a fluorescently labeled replication- competent HCV system, the CCCM transfer process is further dissected by live cell imaging into four steps: donor cell-target cell contact, formation of viral puncta-target cell conjugation, transfer of viral puncta, and post transfer. Importantly, the CCCM HCV transfer leads to productive infection of target cells. Taken together, these results show that CCCM HCV transfer constitutes an important and effective route for HCV infection and dissemination. These findings will aid in the development of new and novel strategies for preventing and treating HCV infection. 2
3 35 INTRODUCTION Approximately 170 million people, 3% of the world population, are currently infected with hepatitis C virus (HCV) (1). The infection frequently leads to hepatitis and liver steatosis, and is considered a leading cause of life-threatening chronic liver diseases such as liver fibrosis, cirrhosis and hepatocellular carcinoma (2). In the U.S. and Europe, HCV infection has become the primary cause for liver transplantation (3). Despite intensive research efforts during the last two decades, no HCV vaccines have become available (4, 5). The first two HCV-specific antivirals, the HCV protease NS3/NS4 inhibitors telaprevir and boceprevir, were approved by the FDA in 2011, yet the combinatorial treatment of these inhibitors with pegylated interferon α and ribavirin has only improved the response rate by 50% to 70% in HCV genotype 1 patients (6, 7). It is evident that a better understanding of HCV infection and pathogenesis is required to enable the development of new anti-hcv therapeutic strategies. The current prevailing model for cell-free HCV infection stipulates that tetraspanin CD81, scavenger receptor-b1 (SR-B1), and tight junction proteins claudin-1 (CLDN1) and occludin (OCLN) are required for cell-free HCV entry into cells. CD81 and SR-B1 directly interact with HCV glycoprotein E2 and function in the early steps of HCV entry (8-10). In contrast, CLDN1 and OCLN have not been found to bind HCV envelope proteins but CLDN1 associates with CD81 and functions with OCLN to mediate cell-free HCV entry in a post-binding late step (11-13). HCV is highly capable of evading the immune system, which leads to establishment of chronic infection in about 80% of infected 3
4 people (14). Neutralizing antibodies (nabs) are the main effectors of the humoral response against viral infection and one of the most important defense mechanisms in controlling viral spreading within a host. However, nabs often fail to control the infection, albeit they are generated in chronic HCV patients (15). Frequent alterations of HCV epitopes have been proposed to contribute to viral escape from recognition and elimination by the immune system (16, 17), yet it is highly conceivable that other immune evading mechanisms are involved. Cell-cell contact-mediated (CCCM) viral infection and transmission have been demonstrated in several viruses and have been proposed to be responsible for immune escape of these viruses (18). Human immunodeficiency virus type 1 (HIV-1) and human T cell leukemia virus type 1 (HTLV-1) induce the formation of virological synapses between infected and uninfected cells that subsequently facilitate CCCM viral infection and transmission (19, 20). HIV-1 also travels along nanotubes and conduits for up to 300 μm to infect a distant cell (21). Similarly, herpes simplex virus (HSV) passes through tight junctions to infect a neighboring cell (22), and vaccinia virus (VV) induces the formation of actin tails to project progeny viruses or viruses adhered to the surface of infected cells to uninfected cells (23). Compared to cell-free infection, CCCM viral infection and transmission usually occur much faster and is less sensitive to nab. Viruses that utilize CCCM transfer often capitalize on one or more cellular processes to accomplish the transfer, and in most cases the infected cell determines the processes that become appropriated. HIV-1 and HTLV-1 subvert the immunological synapse machinery in the infected cells and induce cytoskeleton reorganization and polarized viral budding towards 4
5 uninfected receptor-expressing cell in a structure named virological synapses (24, 25). HIV-1 also hijacks the tunneling nanotubes in macrophages and T cells for intercellular virus transfer (21, 26), while HSV exploits the tight junctions among epithelial cells for viral spreading (22) In this study, we established a co-culture assay and demonstrated CCCM HCV infection in hepatocytes, including primary human hepatocytes, and characterized the roles of known HCV receptors and cytoskeletal structures in this process. In addition, we adapted the tetracysteine-biarsenical dye labeling strategy in combination with 3-dimensional live cell fluorescence microscopic imaging and dissected the spatial and temporal details of the transfer process. We confirmed the transfer of µm-sized HCV core puncta into target cells in real time and illustrated the four steps in CCCM HCV transfer: donor cell-target cell contact, formation of viral puncta-target cell conjugation, transfer of viral puncta, and post transfer. MATERIALS AND METHODS Cells and Reagents Huh cells were obtained from Dr. Charles Rice s laboratory of Rockefeller University, New York; HepG2 were from American Type Culture Collection (Manassas, VA); NKNT3 and CYNK10 human hepatoma cells were kindly provided by Dr. Ira Fox of the University of Pittsburgh School of Medicine, Pittsburgh, Pennsylvania. These cells were maintained in Dulbecco Modified Eagle Medium (DMEM) supplemented 5
6 with 10% heat inactivated fetal bovine serum (FBS) and 1% penicillin/streptomycin/l-glutamine. Huh7.5.1-GFP cells were expanded from a single stable clone selected from pegfp-n3 (Clontech, Maintain View, CA)-transfected Huh7.5.1 cells in the presence of 400 μg/ml G418 (Santa Cruz Biotechnologies, Santa Cruz, CA) and maintained in DMEM as above containing 200 μg/ml G418. Cryopreserved human primary hepatocytes (CC-2591, Lonza, Walkersville, MD) were plated on rat-tail type I collagen (BD Bioscience, Bedford, MA)-coated plates and maintained in hepatocyte culture media (PHH, CC-3198, Lonza) as instructed. The sources of antibodies used in the study were as follows: mouse anti-hcv core (MA1-080, Affinity Bioreagents, Golden, CO), mouse anti-cd (sc-7637, Santa Cruz), mouse anti-sr-b1 (610882, BD Bioscience), rabbit anti-cldn1 ( , Zymed/Invitrogen), mouse anti-ocln ( , Invitrogen, Carlsbad, CA), rabbit anti-ocln (# , Invitrogen), mouse anti-β actin (A1978, Sigma, St. Louis, MO), mouse anti-tubulin (Sigma), mouse normal IgG (Santa Cruz), monoclonal human anti-e2 clone CBH-5 and isotype-matched control human anti-cytomegalovirus monoclonal antibody R04 (both kindly provided by Dr. Steve Foung of Stanford University, California), goat anti-mouse IgG-phycoerythrin (Santa Cruz), goat anti-mouse IgG-Alexa488 (Invitrogen), goat anti-mouse IgG-Alexa555 (Invitrogen), sheep anti-mouse IgG-HRP (Sigma), and donkey anti-rabbit IgG-HRP (Sigma). DAPI (4',6-diamidino-2-phenylindole), cytochalasin D, nocodazole, phalloidin-tritc, polyethylene glycol 8000 (PEG8000), and the PKH26 cell labeling kit were purchased from Sigma. The CMFDA cell labeling dye, ReAsH TC tag labeling kit, 6
7 124 TRIZOL and TRIZOL LS Reagents were from Invitrogen Plasmids and sirnas pcdna3-cd81 and pcdna3-sr-b1 were constructed by PCR amplification of human CD81 and SR-B1 open reading frames from potb1-cd81 and potb7-sr-b1 (Open Biosystem, Lafayette, CO) followed by cloning into pcdna3 (Invitrogen). pcmv-sport-claudin1 was purchased from Open Biosystem. pjfh1-tccore was constructed by mutagenesis of pjfh1 (kindly provided by Dr. Takaji Wakita, Japan) as described below. The 3 kb sequence from the 5 untranslated region (5 UTR) to the nonstructural protein 2 (NS2) on pjfh1 was cloned into pbluescript KSII (Stratagene, California) using EcoR I and Not I to obtain the intermediate cloning vector pbs-core-ns2. A full length (FLNCCPGCCMEP) tetracysteine (TC) tag (27) was inserted into the pbs-core-ns2 plasmid right after the third amino acid of the core (28) using the QuickChange mutagenesis kit XLII (Stratagene) with the forward primer 5 -GAC CGT GCA CCA TGA GCA CAT TTC TCA ATT GTT GTC CTG GCT GTT GTA TGG AAC CTA ATC CTA AAC CTC AAA GAA AAA CC-3 and the reverse primer 5 - GGT TTT TCT TTG AGG TTT AGG ATT AGG TTC CAT ACA ACA GCC AGG ACA ACA ATT GAG AAA TGT GCT CAT GGT GCA CGG TC-3 (TC tag shown in bold). The region from the 5 UTR to NS2 containing the TCcore was then cloned back into the pjfh1 plasmid using EcoR I and Not I to obtain pjfh1-tccore. All recombinant plasmids were verified by sequencing. SiGENOME SMARTPool sirnas against human CD81 (sicd81), SR-B1 (sisr-b1), CLDN1 (sicldn1) and OCLN 7
8 (siocln), and scrambled control sirna (sictrl) were purchased from Dharmacon (Lafayette, CO) Viral RNA preparation and sirna/plasmid/viral RNA transfections pjfh1 and pjfh1-tccore were linearized by Xba I and used as templates to transcribe viral RNAs in vitro using the MEGAscript Kit (Ambion, CA). The synthesized viral RNA was purified by acidic phenol/chloroform extraction. Viral RNA transfection into Huh7.5.1, sirna transfection of Huh7.5.1, pcdna3-cd81 transfection of HepG2 and pcmv-cldn1 transfection of NKNT3/CYNK10 were performed with Lipofectamine 2000 Reagent (Invitrogen) according to the manufacturer s instructions. Media were replaced 6 hr post-transfection. 293T cells were transfected with pcdna3-cd81 and pcdna3-sr-b1 using the standard calcium phosphate transfection method and media were replaced after an overnight incubation. Transfection efficiencies of plasmid DNA were monitored by pegfp-n3 transfection, which were 80-90% for 293T, 40-50% for HepG2 and 50-60% for NKNT3 and CYNK10. Virus production and titration Huh7.5.1 cells were either transfected with viral RNAs (JFH1 or JFH1-TCcore) as described above, or inoculated with JFH1 viral stock (a generous gift from Dr. Wenzhe Ho of Temple University, Philadelphia, PA) at a multiplicity of infection (MOI) of Supernatants containing HCV virions were collected days post-transfection or 5 days post-infection, removed of cell debris by 8
9 low speed centrifugation (1000 g, 4 o C, 10 min), passed through a 0.22 μm filter, and stored at -70 o C. The filtered culture supernatant was concentrated by the addition of 1/5 volume of 40% PEG8000 to make a final concentration of 8% and precipitated at 4 o C overnight followed by centrifugation at 3500 g and 4 o C for 30 min. The precipitated virus was suspended, titrated as below, and stored frozen at -70 o C. To titrate the virus stock, 10-fold serially diluted stock was added to Huh7.5.1 cells and medium was changed after two hours. At 72 hr post-infection, immunostaining against HCV core was performed. The number of foci formed at the highest dilution was used to calculate the virus titer, which was expressed as focus-forming units per milliliter of supernatant (FFU/ml). The titers of our JFH1 viral stock were usually in a range of 10 4 to 10 6 FFU/ml. Co-culture assay and transwell assay In the co-culture assay, Huh7.5.1 were infected with HCV for 3 days and used as the donor cells. The donor cells or the target cells were first labeled with PKH26 or CMFDA according to the manufacturer s instructions. Briefly, cells were trypsinized and labeled with 2 μm PKH26 for 5 min at room temperature followed by incubation with 1% FBS/phosphate-buffered saline (PBS) to stop the labeling reaction and four extensive washes to remove any residual dye. Alternatively, media containing 1.25 μm (for flow cytometry) or 5 μm (for confocal imaging) CMFDA were directly added to cells growing in culture dishes. The cells were labeled at 37 o C and 5% CO 2 for 30 min followed by a medium change to normal growth media and an extra 30 min incubation. The labeled donor/target cells were counted (or trypsinized and counted 9
10 for CMFDA-labeled cells) and mixed with unlabeled target/donor cells and seeded to a 24- or 12-well plate at >90% confluence. Unless stated otherwise, the donor/target cells were allowed to co-incubate for approximately 20 hr, followed by collection for immunostaining and flow cytometry or confocal analysis. The transwell assay was carried out in a similar fashion except that neither donor nor target cells were labeled and the donor and target cells were seeded into the upper and lower chambers of the transwell (Corning, Lowell, MA), respectively. Flow cytometry Cells from the co-culture assay, or the target cells from the transwell assay were trypsinized and fixed with 4% paraformaldehyde at room temperature (RT) for 10 min, followed by permeabilization with 50 μg/ml saponin at RT for 15 min. Staining was performed with mouse anti-core primary antibody (2 μg/ml) at RT for 60 min followed by goat anti-mouse IgG-PE (4 μg/ml, for CMFDA-labeled or Huh7.5.1-GFP co-culture) or goat anti-mouse IgG-Alexa488 (2 μg/ml, for PKH26-labeled co-culture) secondary antibody at RT for 60 min. Cells were then suspended in PBS and subjected to flow cytometry analysis (BD FACS Calibur or BD Accuri C6). For the detection of CD81 surface expression, sirna-transfected Huh7.5.1 or pcdna3/cd81-transfected HepG2 were removed from culture dishes with 0.5 mm EDTA/PBS and stained with mouse normal IgG (2 μg/ml) or mouse anti-cd81 (2 μg/ml) followed by goat anti-mouse IgG-PE or goat anti-mouse IgG-Alexa488. Cells were suspended in PBS and analyzed by flow cytometry immediately. Between each step, the cells were extensively washed with PBS. 10
11 Confocal microscopy Cells from the co-culture assay were fixed with 4% paraformaldehyde on coverslips, permeabilized with saponin and blocked in 1% FBS/PBS at RT for 30 min. Cells were stained with mouse anti-core primary antibody at RT for 60 min followed by goat anti-mouse IgG-Alexa488 or Alexa555 (2 μg/ml) secondary antibody at RT for 60 min. The nuclei were stained with 0.25 μg/ml DAPI in PBS at RT for 15 min. The cover slips were mounted with Fluoromount G (Southern Biotech, Birmingham, Alabama) and microscopic images were taken using a Zeiss Axiovert 200 for epifluorescence or a Zeiss LSM510 for confocal images. For the detection of OCLN, sictrl- or siocln-transfected Huh7.5.1 cells were fixed, permeabilized, and stained with mouse normal IgG (2.5 μg/ml) or mouse anti-ocln (2.5 μg/ml) followed by goat anti-mouse IgG-Alexa555 secondary antibody. For F-actin staining, cells from the co-culture assay were fixed and permeabilized as above and then stained with 1 μg/ml phalloidin-tritc in PBS at RT for 30 min. For the visualization of microtubules, cells from the co-culture assay were fixed with -20 C methanol for 3 min and then permeabilized and stained with mouse anti-tubulin (2 μg/ml) followed by Alexa555-conjugated secondary antibody. Cells were washed three times with PBS between each step Western blotting Cell lysates were prepared at 48 hr post-transfection or 72 hr post-infection using a standard RIPA buffer (50 mm Tris-HCl ph 8.0, 0.5% NP40, 2 mm 11
12 EDTA, 137 mm NaCl, and 10% glycerol) and separated on a 12% (for HCV core or CLDN) or 8% (for SR-B1 or OCLN) polyacrylamide-sds gel. The proteins were transferred onto nitrocellulose membranes, probed with appropriate primary antibodies (1 μg/ml for mouse α-hcv core and rabbit α-cldn1, 2 μg/ml for mouse α-sr-b1 and rabbit α-ocln, 0.5 μg/ml for β-actin) and HRP-conjugated secondary antibodies (0.5 μg/ml), and were visualized by homemade enhanced chemiluminescence reagents. RNA extraction and quantitative real time RT-PCR (qrt-pcr) for HCV RNA RNA was isolated from cells or cell debris-free culture supernatants ( µl) using TRIZOL or TRIZOL LS, respectively, according to the manufacturer s instructions and used for qrt-pcr amplification with a TaqMan One-Step RT-PCR kit (Applied Biosystem, Foster city, CA) and HCV-specific primers and probe were described previously (29). qrt-pcr was performed on the C1000 Touch Thermal Cycler (signal detection by CFX96 real time system, both from Bio-Rad, CA) with a program as follows: 48 C for 30 min, 95 C for 10 min, and then 40 cycles at 95 C for 15 sec, and 60 C for 1min. Serially diluted in vitro transcribed JFH1 RNA was included as standards in parallel and used to calculate the absolute level of HCV RNA ReAsH labeling of JFH1-TCcore and live cell imaging Culture supernatants were collected from JFH1-TCcore transfected Huh7.5.1 at day 42 post-transfection and concentrated 30-fold by using PEG8000 precipitation and titrated as described above. 12
13 Huh7.5.1 cells were infected with the concentrated JFH1-TCcore virus (MOI=0.15) and labeled with ReAsH according to the instructions provided in the TC-tag detection kit (Invitrogen). These labeled cells were then used as donor cells. Specifically, at day 3 post-infection, cells were washed once with Opti-MEM (Invitrogen) and labeled with the ReAsH dye (1 µm final concentration) in Opti-MEM. Cells were incubated at 37 o C for 30 min, and then washed twice with 1X BAL (2,3-dimercapto-1-propanol) wash buffer (supplied in the kit, Invitrogen) in Opti-MEM for 5 min each. The wash buffer was removed, and the cells were washed once with PBS, trypsinized, and mixed at a 1:1 ratio with the Huh7.5.1-GFP target cells. The mixed cells were seeded onto poly-lysine-coated 35 mm glass bottom dishes to 90% confluence, and the media were replaced with DMEM media without phenol red at 2 hr post-seeding. Live cell imaging was set up after the media change. Images were taken starting at 9 hr post-seeding and continued for 18 hr. All images were acquired with a Zeiss LSM 510 confocal microscope fitted with a 20X air objective and a thermostatic stage incubator set at 37 o C, 5% CO 2. ReAsH-labeled TCcore was visualized with the filter sets of excitation at 561 nm and emission at 620/80, and the GFP in target cells was detected using the filter sets of excitation at 488nm and emission at 528/45. A 13 slice X 0.9 µm Z stack was taken at each selected field every 18 min using the LSM 510 LUO software. Images were later processed and analyzed with Image J 1.45s. Unless otherwise specified, all red/green fluorescence images were Z projections (maximum intensity projection) from the original stack and all differential interference contrast (DIC) images were the most focused slice from the Z stack (the 7 th slice). 13
14 Data analysis Where appropriate, values were expressed as mean ± SD of triplicate experiments. All statistical analyses including one-way and two-way ANOVA followed by post hoc tests (bonferroni correction or Dunnett s test). A p value of < 0.05 was considered statistically significant (*), p < 0.01 highly significant (**) and p < strongly significant (***). All data were representative of multiple repeated experiments. RESULTS Formation of HCV infection foci in a cell density-dependent manner We repeatedly noticed that during the production and titration of HCV JFH1 virus in Huh7.5.1 cells, more distinct infection foci (clustered HCV-infected cells, usually with cells) were present at a lower MOI (Fig. 1a, right column), and less foci were present at the higher MOI that gave rise to approximately 80-90% HCV core-positive cells (Fig. 1a, middle column). Formation of these infection foci at the lower MOI could result from division and proliferation of HCV-infected cells. Alternatively, it could be due to the close proximity of uninfected cells to HCV-infected cells and subsequent CCCM HCV transfer to the neighboring uninfected cells resulting in infection. To distinguish these two possibilities, we infected Huh7.5.1 cells with JFH1 virus of a lower MOI, removed the excessive virus, and then re-plated the cells at different cell densities. Following three 14
15 days of continued culturing, the cells were processed for analysis of HCV core expression, a widely used marker for HCV infection. We reasoned that if infection focus formation resulted from proliferation of HCV-infected cells, there would be no correlation between the number of infection foci and cell density; if infection foci formation resulted from CCCM HCV transfer, there would be a positive correlation between the number of foci formed and cell density. To ensure the validity of the data, we assessed HCV core-positive cells by Western blotting for HCV core, immunofluorescence staining for HCV core followed by immunofluorescence microscopic imaging, manual counting of HCV core-positive cells under an immunofluorescence microscope, or flow cytometry analysis. Western blotting showed that the expression level of HCV core protein exhibited a gradual increase with higher cell density (Fig. 1b). Immunostaining of these cells for HCV core protein followed by immunofluorescence microscopic imaging showed an apparent increase in the number and intensity of core-positive cells with increased cell density (Fig. 1c). The formation of core-positive cell foci appeared to only occur at higher cell densities. Manual quantitation of core-positive cells showed a positive correlation between the number of core-positive cells and cell density (Fig. 1d). The positive correlation was further quantified by flow cytometry analysis of core-positive cells (Fig. 1e), and a two variable linear regression analysis gave rise to the correlation coefficient of In addition, we further showed that this positive correlation between the percentage of infected cells and cell density was dependent on the MOI, i.e. as the MOI increased, the correlation between the two parameters decreased (data reviewed but not 15
16 shown). Taken together, these results suggest that HCV is capable of infecting target cells via a cell-to-cell mechanism, i.e., CCCM HCV infection and transmission CCCM HCV transfer to Huh7.5.1 and primary human hepatocytes To characterize CCCM HCV infection, we devised a co-culture assay that involved incubation of HCV-infected Huh7.5.1 donor cells with uninfected Huh7.5.1 cells for a certain period of time and determining the number of core-positive target cells from CCCM HCV transfer by immunostaining. CCCM viral transmission requires different lengths of co-incubation times for different viruses and is often dependent on the ratio of donor cells (D) to target cells (T) (18, 30). Therefore, we started the co-culture assay with a D:T ratio of 1:1 and a co-incubation time of 20 hr for HCV. To distinguish target cells from donor cells, several cell-labeling strategies were exploited. First, we established a GFP-expressing Huh7.5.1 stable cell line with more than 95% GFP-positive cells as determined by flow cytometry (data reviewed but not shown), and used this cell line as the target cells in the co-culture assay. Incubation of these cells with HCV-infected Huh7.5.1 cells gave rise to core-positive and GFP-positive target cells (arrowhead, Fig. 2a i, v, ix). We also labeled naïve Huh7.5.1 cells with a thiol-reactive cell tracking dye, CMFDA (31), and used these cells as the target cells in the co-culture assay. Incubation of CMFDA-labeled cells with HCV-infected Huh7.5.1 cells showed core-positive and CMFDA-positive target cells (arrowhead, Fig. 2a ii, vi, x). Similar results were obtained 16
17 using a membrane labeling dye, PKH26, to label the target cells (arrowhead, Fig. 2a iii, vii, xi). We also labeled HCV-infected cells with CMFDA and used them as the donor cells and naïve Huh7.5.1 cells as the target cells for the co-culture assay. The results showed core-positive and CMFDA-negative target cells (arrowhead, Fig. 2a iv, viii, xii). Quantitation analysis by flow cytometry showed a comparable level of CCCM HCV transfer. i.e., about 20% of the target cells, among the different labeling strategies (Fig. 2b). Noticeably, in both GFP and CMFDA labeling strategies, the target cells exhibited less intense core staining when compared to the donor cells (Fig. 2a), potentially explained by the directionality of HCV transfer. To ascertain that CCCM HCV transfer occurred in primary human hepatocytes (PHH), we performed the co-culture assay with CMFDA-labeled HCV-infected Huh7.5.1 as the donor cells and PHH as the target cells. The results showed core-positive and CMFDA-negative PHH target cells (arrowhead, Fig. 3a), which were equivalent to approximately 20% of the total target cell population as determined by flow cytometry (Fig. 3b). Taken together, these results confirmed CCCM HCV transfer in both human hepatoma cells and primary hepatocytes. CCCM HCV transfer vs. cell-free HCV infection The core-positive target cells that were detected following 20 hr of co-culturing (Fig. 2 & 3) could also result from infection of target cells with cell-free HCV from HCV-infected donor cells. To address this possibility, we determined the kinetics of CCCM HCV 17
18 transfer and compared it to that of cell-free HCV infection. We labeled uninfected Huh7.5.1 target cells with PKH26 and performed the co-culture assay at a D:T ratio of 1:1 for 0, 3, 6, 9, and 20 hr. Flow cytometry analysis showed that core-positive and PKH-positive target cells began to emerge within 3 hr of co-incubation and gradually increased in number up to 20 hr (Fig. 4a). In parallel, we set up a transwell assay (Fig. 4b), in which HCV-infected Huh7.5.1 donor cells were seeded on a 0.4 µm pore size permeable membrane on the transwell insert in the upper chamber and uninfected Huh7.5.1 cells were seeded in the lower chamber of the transwell. The 0.4 µm pore size permeable membrane functions as a physical barrier to separate the donor cells from the target cells, and therefore only allows cell-free HCV to diffuse from the upper chamber of the transwell insert into the lower chamber of the transwell to infect cells, and at the same time excludes CCCM HCV infection. As the surface area of the insert is only half of that of the bottom of the lower chamber, a D:T ratio of 1:2 was used to achieve a comparable cell confluence between the upper and lower chambers. The cells in the lower chamber were harvested at the same time points as those in the co-culture assay, i.e., 0, 3, 6, and 20 hr, and stained for HCV core expression. Compared to the results of the co-culture assay, the transwell assay gave rise to very few core-positive target cells in the lower chamber of the transwell during the same time points (Fig. 4c). Therefore, the core-positive target cells detected within 20 hr of co-culturing (Fig. 2 & 3) likely resulted from CCCM HCV infection and not from cell-free infection. To ascertain that cell-free HCV can freely diffuse through the membrane on the insert, the transwell assay was extended to 48 and 72 hr. HCV-infected cells in the lower 18
19 chamber were similarly determined using core immunostaining. Core-positive cells in the lower chamber only began to emerge at 24 hr and increased at 48 hr and 72 hr (line graph, Fig. 4d), the kinetics was very similar to that of the cell-free HCV infection of Huh7.5.1 cells by direct inoculation (Fig. 4e), which was routinely performed in the laboratory. These results not only support the notion that cell-free HCV infection takes a longer time than CCCM HCV infection but also confirm that cell-free HCV are capable of passing through the membrane and infecting target cells in the lower chamber. In addition, qrt-pcr was performed to compare the HCV RNA level between the upper and lower chambers at 24, 48, and 72 hr. No differences of HCV RNA levels were found (bar graph, Fig. 4d), further confirming that HCV can diffuse through the 0.4 µm pore size permeable membrane on the insert and that CCCM infection, not cell-free infection, is solely responsible for the newly infected target cells in 20 hr co-culture assay. Next, we determined whether CCCM HCV transfer was dependent on the D:T ratio. We performed the co-culture assay with the same co-incubation time (20 hr) and the same total number of donor and target cells but with different D:T ratios. The results showed that the percentage of core-positive target cells increased with increasing D:T ratios (Fig. 4f), suggesting that a higher D:T ratio likely provided more opportunities for the target cells to be in contact with the HCV-infected donor cells. The increase in HCV CCCM transfer over the donor/target ratio appeared to be modest, likely due to an already higher number (density) of the starting cells in the co-culturing assay. In addition, our subsequent imaging data showed that CCCM HCV transfer did not necessarily occur between one 19
20 donor cells and one target cell. Furthermore, in this co-culturing experiment, the same total number of cells was maintained when the donor to target (D:T) ratio was increased. Thus, increase in the D:T ratio does not necessarily translate to proportional increase in the contact between donor cells and target cells. In other words, there would be more cell-cell contact and CCCM transfer among the donor cells themselves at a higher D:T ratio. But, this type of CCCM transfer was not accounted for in our experimental setting. Taken together, these results showed that CCCM HCV infection occurred more readily than cell-free infection and was dependent on direct cell-cell contact. Indispensable roles of CD81, SR-B1, CLDN1, and OCLN in CCCM HCV transfer CD81, SR-B1, CLDN1, and OCLN have been shown to be involved in cell-free HCV infection (32-35). As an alternative route to cell-free infection, CCCM viral infection and transmission often require viral entry receptors that were originally defined for cell-free infection (30, 36, 37). Thus, we determined the roles of these four major HCV receptors in CCCM HCV transfer. First, we knocked down expression of each receptor individually with sirna in Huh7.5.1 cells and used these cells as target cells in the co-culture assay. A maximal knockdown of each receptor by sirna was pre-determined using different methods based on the availability of antibodies: 80% for CD81 by flow cytometry (Fig. 5a), 50% for SR-B1 and CLDN1 by Western blotting (Fig. 5b), and 70% for OCLN by both Western blotting and confocal imaging (Fig. 5b arrowhead, 5c). We labeled these 20
21 sirna-transfected Huh7.5.1 cells and used them to perform a 20 hr co-culture assay with HCV-infected Huh7.5.1 donor cells. Compared to sirna control, knockdown of CD81, SR-B1, CLDN1 and OCLN led to decreases in CCCM HCV transfer by 72%, 68%, 46% and 63%, respectively (Fig. 5d). In addition, we also used sirna to knockdown all four receptors simultaneously in the target cells and performed the co-culture assay. Comparable knockdown efficiencies were achieved for each of these receptors without apparent cytotoxicity or genotoxicity (data reviewed but not shown). Interestingly, CCCM HCV transfer was almost completely abolished in target cells with decreased levels of all four receptors (Fig. 5e). Taken together, these data suggest that CD81, SR-B1, CLDN1 and OCLN are all indispensable for CCCM HCV transfer and provide evidence that they may function in a coordinated manner. To further analyze the roles of these receptors in CCCM HCV transfer, we took advantage of a panel of human cell lines that constitutively express varied levels of HCV receptors and determined the relationships between HCV receptor expression and cell-free HCV infection or CCCM HCV transfer. The human hepatoma cell lines HepG2, NKNT3 and CYNK10 were used. HepG2 lacks CD81 expression but expresses medium to high levels of the other three major HCV receptors (38-41). NKNT3 and CYNK10 both express very low levels of CLDN1, but have medium to high levels of the other HCV receptors (42, 43). We also included the HCV-susceptible Huh7.5.1 cell line and the non-hepatoma fibroblast cell line 293T as controls. Huh7.5.1 expressed all four HCV receptors at a moderate to 21
22 high level, while 293T expressed very high levels of CD81 and OCLN, but low level of SR-B1 and no CLDN1. Expression of all four receptors in these cells was confirmed (Table 1 and data reviewed but not shown). Of all cell lines, only Huh7.5.1 was susceptible to cell-free HCV infection (Table 1 and data reviewed but not shown). When each cell line was co-cultured with HCV-infected Huh7.5.1 cells, no CCCM HCV transfer was detected in cells other than Huh7.5.1 at 24 hr post co-culturing (Table 1 and data reviewed but not shown). These results confirmed the important roles of all four HCV receptors in both cell-free and CCCM HCV infection. We then introduced into the cells the receptor(s) that were not expressed and/or expressed at a lower level by ectopic expression and assessed the possibility of the CCCM HCV susceptibility in those cells. Ectopic expression of CD81 in HepG2 (Fig. 6a) gave rise to little CCCM HCV transfer from HCV-infected Huh7.5.1 (Fig. 6b). Similarly, ectopic expression of CLDN1 in NKNT3 (Fig. 6c) gave rise to little CCCM HCV transfer from HCV-infected Huh7.5.1 (Fig. 6d); ectopic expression of CLDN1 in CYNK10 gave rise to little CCCM HCV transfer from HCV-infected Huh7.5.1 (data reviewed but not shown); ectopic expression of both SR-B1 and CLDN1 in 293T (Fig. 6e) gave rise to little CCCM HCV transfer from HCV-infected Huh7.5.1 (Fig. 6f). Taken together, these results suggest that expression of all four major HCV receptors, CD81, SR-B1, CLDN1 and OCLN is essential but not sufficient for CCCM HCV infection Roles of intact actin but not the microtubule cytoskeleton in CCCM HCV transfer 22
23 To determine the roles of cytoskeleton in CCCM HCV transfer, we performed the co-culturing experiments in the presence of the actin polymerization inhibitor, cytochalasin D (44, 45). The effects of cytochalasin D on actin polymerization were confirmed by immunofluorescence staining of F-actin. As expected, in the absence of cytochalasin D treatment, all of the F-actin filaments were along the boundaries of adjacent cells where they made contact with each other (Fig. 7a). When the cells were treated with μm cytochalasin D, F-actin filaments were polymerized on the tips of filapodia instead of being expressed at cell-cell contacts. When the cytochalasin D concentration was further increased to 2.5 μm or 10 μm, F-actin filaments formed aggregates in the cytoplasm and filapodia were not present. In parallel experiments, a significant decrease in CCCM HCV transfer occurred in the co-culture treated with μm cytochalasin D and a complete abrogation of CCCM HCV transfer was apparent in the co-cultures treated with 2.5 μm and 10 μm cytochalasin D (Fig. 7b). We also performed similar experiments in the presence of the microtubule depolymerizing agent, nocodazole (46, 47), and determined its effects on CCCM HCV transfer. As expected, nocodazole treatment disrupted the microtubule cytoskeleton in a dose-dependent manner as determined by α-tubulin immunofluorescence staining, beginning with a gradual loss of the microtubule network, followed by more diffuse tubulin staining patterns in the cytoplasm (Fig. 7c). However, nocodazole-induced disruption of microtubules did not lead to significant changes in the level of CCCM HCV transfer (Fig. 7d). The inhibition of CCCM HCV transfer by 23
24 cytochalasin D treatment (Fig. 7b) was not due to cytotoxicity of cytochalasin D ((48) and our own unpublished data), or any adverse effects of cytochalasin D on cell-free HCV infection (data reviewed but not shown). Therefore, these results suggest that an intact actin network, but not the microtubule cytoskeleton may be required for CCCM HCV transfer. Live cell imaging of the CCCM HCV transfer process in Huh7.5.1 cells: from conjugate formation to transfer To directly dissect the spatial and temporal details of CCCM HCV transfer, we attempted to construct a fluorescently labeled HCV clone to characterize viral transfer in live cells. We first attempted to generate GFP-labeled HCV by introducing GFP in-frame with the HCV core gene in JFH1, but were unsuccessful (data reviewed but not shown). This is likely due to the large size of the foreign GFP protein and subsequent alterations in HCV assembly. We therefore turned to the TC tag-biarsenical dye labeling system that has been successfully used to label and study several viruses in live cells (reviewed in (49)), including HCV (28, 50). Compared to the GFP-core fusion protein strategy, this system only requires insertion of a short nucleotide sequence encoding a peptide of 12 amino acids, including the tetracysteine (TC) tag (-CCxxCC-), into the viral genome without affecting virus translation, replication, assembly, production and infectivity (28, 49, 50). The presence of the TC tag allows the tagged HCV core protein in the cells or in HCV to be 24
25 detected live by microscopic imaging through its covalent binding to the cell membrane-permeable non-fluorescent biarsenical compound and its ensuing fluorophore. We constructed the HCV-TC clone in the context of JFH1, subsequently referred to as JFH1-TCcore (Fig. 8a). We transfected Huh7.5.1 cells with an equal amount of in vitro transcribed full-length JFH1 RNA or JFH1-TCcore RNA and monitored HCV replication and production using qrt-pcr. Compared to JFH1, JFH1-TCcore showed a slightly delayed viral replication (Fig. 8b) and virus production (Fig. 8c) and a 2-4 fold lower maximal level of virus production (Fig. 8c). Nevertheless, labeling of JFH1-TCcore-transfected and infected cells with the biarsenical compound did not alter the HCV-TCcore infectivity (data reviewed but not shown and (50)). We then determined the labeling specificity of the biarsenical compound (ReAsH) and the subcellular localization of the TC-tagged core protein. Huh7.5.1 cells were transfected with in vitro transcribed full-length JFH1 or JFH1-TCcore RNA and stained with ReAsH and then HCV core using an anti-hcv core antibody. ReAsH only labeled JFH1-TCcore-transfected cells and not JFH1-transfected cells (Fig. 8d). There appeared to be a complete overlap of ReAsH labeling with HCV core staining, confirming that ReAsH specifically bound to the TC tag and that the tag did not alter the subcellular localization of HCV core. Taken together, these results demonstrated the feasibility of using the JFH1-TCcore and ReAsH labeling system to track HCV core in live cells We performed live cell imaging to track CCCM HCV transfer with the JFH1-TCcore 25
26 system. We infected Huh7.5.1 cells with JFH1-TCcore for 3 days and then labeled the cells with ReAsH. We used ReAsH-labeled cells as donor cells and Huh7.5.1 cells stably expressing GFP (Huh7.5.1-GFP) as target cells and performed the co-culturing assay under live confocal imaging. Red (ReAsH)/green (GFP) fluorescence and DIC images in the selected fields were taken every 18 min throughout the 18 hr co-culturing period. One single HCV-infected ReAsH-labeled Huh7.5.1 donor cell (labeled as D, Fig. 9a) had three recorded sequential transfer events (yellow arrowheads) to three contacted target Huh7.5.1-GFP cells (labeled as T1, T2 and T3, Fig. 9a) during this time period (Suppl. Movie 1). For each transfer event, the donor cell either accumulated large numbers of viral puncta on the contact surface between the donor cell and the target cell (D and T1, Fig. 9a i & ii) or produced filapodia containing viral puncta at the contact site (D and T2, D and T3, Fig. 9a iii & iv) prior to the transfer. Simultaneous transfer of HCV from one single donor cell to multiple target cells was also recorded (Fig. 9b, Suppl. Movie 2 & 3). The orthogonal view (Fig. 9b) and 3D reconstruction of the transfer process (Fig. 9c, Suppl. Movie 3 & 4) confirmed that the transferred viral puncta were located inside the target cell, as the viral puncta were visualized as yellow rather than red. The sizes of the pre-transfer viral puncta were estimated to be approximately 0.5 µm to 2 µm, suggesting that the puncta contained more than one single virus. The number of core puncta that were transferred from one donor cell to one target cell could reach up to 100 puncta during the 18 hr co-culturing period. Tracking the transfer of one single viral puncta revealed four distinct steps in the CCCM HCV transfer process: donor-target cell contact, viral puncta-target cell 26
27 conjugate formation, transfer of viral puncta, and post transfer (Fig. 9d). The transfer began with contact initiated between the donor and target cells (Fig. 9d i). Viral puncta were formed within the donor cell and transitioned to the contact site between the donor and the target cells ( Fig. 9d i). This was followed by formation of viral puncta-target cell conjugates ( Fig. 9d ii). The transfer took place when the viral puncta were localized in the target cell (Fig. 9d iii). The viral puncta likely dissipated into a few smaller puncta in the target cell (Fig. 9d iv), and presumably disappeared as viral uncoating took place. A single transfer event was estimated to take approximately 18 min to complete. To further understand the transfer process, we analyzed the transfer events in the entire tracked field (450 µm x 450 µm). There were a total of 33 ReAsH positive donor cells and 160 Huh7.5.1-GFP target cells in the field at the beginning of tracking (t = 0). During the 18 hr of tracking, 13 cells (13/33 = 39%) formed conjugates with target cells, 7 donor cells showed transfer (7/33 = 21%) and a total of 8 transfer events occurred (Fig. 9e). Each of these processes was confirmed with 3-dimensional reconstruction, as shown in Fig. 9c & d. The average time duration of viral puncta-target cell conjugation between a donor cell and a target cell was calculated to be 408 min; and the average time for the actual transfer was calculated to be 171 min. The latter was much longer than the 18 min time for a single transfer event as estimated above; this is because there were more than one viral puncta transferred between one donor cell and one target cell. Taken together, these results provide the temporal and spatial details of CCCM HCV transfer and demonstrate the high efficiency of this transmission route. 27
28 CCCM HCV transfer and productive HCV infection To determine whether CCCM HCV transfer leads to productive HCV infection, we took advantage of a neutralizing HCV antibody CBH-5 that has been shown to be very effective in blocking free HCV infection (51, 52). We first confirmed that CBH-5 blocked free HCV infection by over 99% at a concentration of 5 µg/ml (data reviewed but not shown). We then performed the above-mentioned co-culture HCV transfer assay in the presence of 5 µg/ml CBH-5 or a control isotope-matched R04 antibody (51, 52) and determined the percentage of HCV core-positive target cells at 24, 48 and 72 hours of co-culturing. The percentage of HCV core-positive target cells increased over time (Fig. 10a & b). Compared to the control R04, CBH-5 showed a slightly lower but still significant percentage of HCV core-positive cells and significant increases in the percentage of HCV core-positive cells over time. In addition, the mean fluorescence intensity of the core-positive cells exhibited increases over time in both R4 and CBH-5 treated co-cultures (Fig. 10c). Increases in the percentage and the mean fluorescence intensity of HCV core-positive target cells over an extended period of time in the presence of the neutralizing HCV antibody CBH-5 suggest that CCCM HCV transfer leads to productive HCV infection and replication. Culture supernatants were collected from co-cultures that were treated with each of the antibodies and tested for their infectivity. Very few HCV core-positive cells were detected with CBH-5-treated culture supernatants at each time 28
29 586 point (Fig. 10d), confirming the HCV neutralizing activity of the CBH-5 antibody To further ascertain the productive nature of CCCM HCV transfer, we set up CCCM HCV transfer using stable GFP-expressing Huh7.5.1 as the target cells in the co-culture experiments. Following the initial 20 hr co-culturing in the presence of 5 µg/ml CBH-5 antibody, we used the FACS to sort out the GFP-positive target cells and then monitored HCV replication in these sorted cells. The FACS yielded more than 97% GFP-positive cells, of which about 2% were HCV core-positive cells (Fig. 10e and f). Similarly, the percentage of HCV core-positive and GFP-positive cells showed increases over an extended period of time up to 7 days. In parallel, there was a significant increase of HCV RNA in these cells between day 4 and day 7 (Fig. 10g) and the infectivity of the culture supernatants between day 4 and day 7 (Fig. 10h). Similar results were also obtained by selective elimination of the HCV-infected Huh7.5.1 donor cells from the co-culturing and monitoring of HCV infection and replication in the remaining target cells (data reviewed but not shown). Taken together, these results support the notion that CCCM HCV transfer leads to productive infection and replication. DISCUSSION Despite significant advances since the establishment of the JFH1-Huh7 HCV cell culture system in 2005 (53-55), the process of HCV transmission and spreading in the liver 29
30 following infection remains poorly understood. Liver is one of the organs with extremely high cell density (2-3.0 x 10 5 hepatocytes/cm 2 (56)), which provides HCV with numerous cell-cell contact sites. In chronically HCV-infected liver, viral replication and intrahepatic HCV RNA level are very low (7-64 genomic equivalent per cell) (57, 58) and nabs and other immunological responses are often present (59). However, even with the presence of those nabs that are capable of neutralizing cell-free infectivity in vitro (15), prevalence of infected hepatocytes in the liver of chronic patient is normally high (57, 60). Our data show that cell-cell contact facilitates HCV spreading among hepatocytes (Fig. 1 & 2) including primary human hepatocytes (Fig. 3). We further show that CCCM HCV infection is a rapid process compared to cell-free HCV infection (Fig. 4). Previous studies have showed that discrete, localized infectious foci and a gradient dispersion of viral genome around the center of foci are observed in patient liver biopsies (58, 60, 61), and that CCCM HCV infection is relatively less sensitive to nabs and neutralizing patient sera than cell-free HCV infection (62). Taken together, it is highly conceivable that CCCM HCV occurs in vivo, and it could even be more favorable than cell-free infection given the compact nature of the liver. Thus, CCCM HCV transmission should be considered in designing any future anti-hcv vaccines and therapeutics. CD81, the first discovered HCV receptor, was identified by screening for HCV E2 binding (33), and is believed to mediate HCV cell-free entry in both an early E2-binding step and a late post-binding step in association with CLDN1 (8, 12, 13). SR-B1, another E2-binding HCV receptor, also mediates cell-free HCV attachment and entry in an early step in this multi-step entry process (63-66). The other two, CLDN1 and OCLN, are both tight 30
31 junction proteins recently identified as HCV co-receptors by screening for cellular determinants able to confer HCV pseudotyped particles (HCVpp) entry into non-susceptible cells (32, 67). To determine the roles of each of these four HCV receptors in CCCM HCV infection, we first used a sirna strategy to knockdown the expression of each of them individually in Huh7.5.1 target cells and found between 46% to 72% decreases in CCCM HCV infection, suggesting a fundamental role of each of them in this process (Fig. 5). Furthermore, simultaneous knockdown of all of them almost completely abolished CCCM HCV infection, suggesting that they mediate CCCM HCV infection in a combinatorial mechanism. To further understand the roles of the four receptors in CCCM infection, we performed the co-culture assay using CD81-negative HepG2, low CLDN1-expressing NKNT3 and CYNK10, and low SR-B1, no CLDN1-expressing 293T (Table 1 and data reviewed but not shown). All these cell lines are refractory to both cell-free and CCCM HCV infection (Table 1 and data reviewed but not shown). However, ectopic expression of the missing/ low-expressing receptor(s) did not render these cells susceptible to CCCM HCV infection (Fig. 6). These results together suggest that all four HCV receptors are important for CCCMV HCV infection. Consistent with our findings, previous studies have shown that SR-B1 antagonists and an anti-cldn1 serum inhibit CCCM HCV infection (68). However, the roles of CD81 in CCCMV HCV infection appear to be controversial in the literature. Using soluble CD81 and anti-cd81 antibody, one group has shown that CCCMV HCV infection can be either CD81-dependent or CD81-independent (62). The very same group has later used a different HCV virus and concluded that CD81 is important for CCMV HCV infection (68). On the other hand, the other group has used CD81 binding-deficient E2 mutant-containing JFH-1 virus and has 31
32 shown that CD81 was not necessary for CCCM HCV infection (69). It is clear that the roles of CD81 in CCCM HCV infection merits further investigation CCCM infection has been shown in many different animal viruses, and its role in immune evasion and rapid viral dissemination has recently gained more attention (18). CCCM viral transmission in animal cells could occur in a variety of ways. Among the known are through virological synapses (HIV-1 and HTLV-1), nanotubules (HIV-1), viral transfer across tight junctions (HSV), and viral induction of actin tails (VV) (18). Interestingly, all the above CCCM routes involve actin and/or microtubule cytoskeletons. In addition, CCCM spreading has also been found to be very common in plant virus infection and usually involves targeting of virus-encoded movement protein(s) (MP) to a plant-specific organelle plasmodesmata (PD), which are narrow tunnels in the cell wall for intercellular communication (70). Movement strategies for CCCM viral spreading differ upon viruses and MPs. In tobacco mosaic virus infection, MP binds and chaperons genomic RNA in the virus replication complexes (VRC) and targets the whole VRC to PD for CCCM viral spreading (71). In the grapevine fanleaf virus infection, MP recruits the PD receptor plasmodesmata located protein to PD to mediate the formation of tubules through which the assembled virions traverse PD (so-called tubule-forming virus ) (72). Interestingly, in virtually all CCCM plant virus infection, movement of MP, VRC, virions, or other essential cellular co-factors to and/ or through PD all requires intact cytoskeleton, particularly actomyosin motor system (71-74). Thus, we determined the roles of actin and/or microtubule cytoskeletons in CCCM HCV infection. Actin cytoskeleton has been shown to be involved in interaction with multiple steps of cell-free HCV infection 32
33 including viral entry (44, 75) and replication (76, 77). In agreement with these findings, our studies have shown that an intact actin network was required for CCCM HCV transfer, as treatment with actin polymerization inhibitor cytochalasin D in the co-culturing assay prevented CCCM HCV transfer (Fig. 7a & b). Based on the known function of cytochalasin D and our finding that HCV secretion from infected cells was not affected by the treatment (data reviewed but not shown), we speculate that cytochalasin D likely inhibits the transfer process at the donor-target cell contact sites or the uptake of viral puncta by the target cells. On the other hand, we showed that treatment of the cells with a microtubule depolymerizing agent nocodazole at a concentration, which we showed to be sufficient to disassemble microtubules [Fig. 7c and (46)] had little effects on CCCM HCV transfer (Fig. 7d). In contrary to our studies, other studies have found that nocodazole treatment inhibits microtubule-dependent transport of HCV replication complex and initiation of productive HCV infection and as a result, HCV RNA replication (76, 78, 79). Moreover, two recent reports have shown that post-assembly vesicular HCV core puncta traffics via microtubules, which is inhibited by nocodazole treatment (28, 50). It is important to point out that the above-mentioned studies all use much higher concentrations of nocodazole, mostly times higher than that we used in our studies. These extremely high concentrations of nocodazole used in those studies could be the main reason for the discrepancies It is believed that cell-free HCV virus is released from infected cells through the secretion pathway (80). After translation and processing on the endoplasmic reticulum (ER) membrane, mature HCV core is relocated to the surface of lipid droplets (81). When the 33
34 RNA genome from the replication complex on the membranous web and envelop proteins (E1/E2) on the ER are complete, viral assembly/envelopment takes place on the ER outer membrane in close proximity to the lipid droplets, towards the ER lumen (50). These intracellular viruses became infectious upon envelopment and are thought to be loaded into secretory vesicles that egress via the ER- trans Golgi network secretory pathway and are released from the plasma membrane (28). However, the fusion of HCV-loaded vesicles with plasma membrane (the actual release process) has never been captured with fluorescence or electron microscopy. Our live cell imaging studies showed that during CCCM HCV transmission large amounts of mobile viral puncta moved to the contacted surfaces between the donor and target cells and formed conjugates with the target cell, followed by transfer of the entire viral puncta (Fig. 9). These core puncta are µm-sized and are unlikely to be single viral particles, but more likely vesicles loaded with virus particles ( virions/ puncta based on size) (28, 50). The transfer of a single core puncta took 18 min (Fig. 9d), the transfer process lasted for 171 min on average (Fig. 9e). Moreover, the transfer events could occur at multiple donor-target cell contact sites (Fig. 9a ii) or concurrently between one donor and multiple targets (Fig. 9b). Therefore, during the entire CCCM transfer process, a great number of viral puncta, which correspond to an even greater number of viral particles, can be delivered into the target cell, contrasting the cell-free infection, in which one virion enters one target cell at a time. It is not guaranteed that each of the viral particles in each of the transferred puncta proceeds through the downstream viral life cycle in the target cell, yet the high input of CCCM viral transfer 34
35 720 certainly leads to productive infection of the target cell (Fig. 10) In summary, we showed that HCV infection occurs through CCCM, resulting in efficient and productive infection and replication. In addition, we demonstrated the requirement of HCV receptors in CCCM infection and the involvement of the actin cytoskeleton in this process. Furthermore, the 3-dimensional live cell microscopic imaging showed the kinetics and transfer process of intact core puncta from donor cells to target cells. These findings will add to our understanding of HCV infection and transmission and provide new avenues for the development of novel anti-hcv therapeutics. Downloaded from on April 27, 2018 by guest 35
36 729 ACKNOWLEDGEMENTS We would like to thank Dr. Charles Rice of Rockefeller University, New York, NY for Huh7.5.1 cells, Dr. Ira Fox of University of Pittsburgh, Pittsburgh, PA for NKNT3 and CYNK10 cells, Dr. Wenzhe Ho of Temple University, Philadelphia, PA for JFH1 virus stock, Dr. Takaji Wakita of National Institute of Infectious Diseases, Japan for JFH1 recombinant plasmid DNA, and Dr. Steve Foung of Stanford University, Stanford, CA for antibodies CBH-5 and R04. We would also like to thank Dr. Ignacy Gryzcynski, Dr. Rafal Fudala and Ms. I-Fen Chang for their assistance on confocal imaging, Dr. Larry Oakford for his assistance on confocal data processing, Drs. Andy (Qigui) Yu, Randy Brutkiewicz, Cheng Kao and William Sullivan for their advices and inputs throughout the study. Downloaded from on April 27, 2018 by guest 36
37 740 REFERENCES Tang, H., and H. Grisé Cellular and molecular biology of HCV infection and hepatitis. Clinical Science 117: Poynard, T., P. Bedossa, and P. Opolon Natural history of liver fibrosis progression in patients with chronic hepatitis C. The OBSVIRC, METAVIR, CLINIVIR, and DOSVIRC groups. Lancet 349: Brown, R. S Hepatitis C and liver transplantation. Nature 436: Ip, P. P., H. W. Nijman, J. Wilschut, and T. Daemen Therapeutic vaccination against chronic hepatitis C virus infection. Antiviral Res 96: Feinstone, S. M., D. J. Hu, and M. E. Major Prospects for prophylactic and therapeutic vaccines against hepatitis C virus. Clin Infect Dis 55 Suppl 1:S Sarrazin, C., and S. Zeuzem Resistance to Direct Antiviral Agents in Patients With Hepatitis C Virus Infection. Gastroenterology 138: Schinazi, R. F., L. Bassit, and C. Gavegnano HCV drug discovery aimed at viral eradication. Journal of Viral Hepatitis 17: Brazzoli, M., A. Bianchi, S. Filippini, A. Weiner, Q. Zhu, M. Pizza, and S. Crotta CD81 is a central regulator of cellular events required for hepatitis C virus infection of human hepatocytes. J Virol 82: Catanese, M. T., H. Ansuini, R. Graziani, T. Huby, M. Moreau, J. K. Ball, G. Paonessa, C. M. Rice, R. Cortese, A. Vitelli, and A. Nicosia Role of Scavenger Receptor Class B Type I in Hepatitis C Virus Entry: Kinetics and Molecular Determinants. Journal of Virology 84: Zeisel, M. B., G. Koutsoudakis, E. K. Schnober, A. Haberstroh, H. E. Blum, F. o.-l. c. Cosset, T. Wakita, D. Jaeck, M. Doffoel, C. Royer, E. Soulier, E. Schvoerer, C. Schuster, F. o. Stoll-Keller, R. Bartenschlager, T. Pietschmann, H. Barth, and T. F. Baumert Scavenger receptor class B type I is a key host factor for hepatitis C virus infection required for an entry step closely linked to CD81. Hepatology 46: Benedicto, I., F. Molina-Jimenez, B. Bartosch, F. L. Cosset, D. Lavillette, J. Prieto, R. Moreno-Otero, A. Valenzuela-Fernandez, R. Aldabe, M. Lopez-Cabrera, and P. L. Majano The tight junction-associated protein occludin is required for a postbinding step in hepatitis C virus entry and infection. J Virol 83: Harris, H. J., C. Davis, J. G. Mullins, K. Hu, M. Goodall, M. J. Farquhar, C. J. Mee, K. McCaffrey, S. Young, H. Drummer, P. Balfe, and J. A. McKeating Claudin association with CD81 defines hepatitis C virus entry. J Biol Chem 285: Harris, H. J., M. J. Farquhar, C. J. Mee, C. Davis, G. M. Reynolds, A. Jennings, K. Hu, F. Yuan, H. Deng, S. G. Hubscher, J. H. Han, P. Balfe, and J. A. McKeating CD81 and claudin 1 coreceptor association: role in hepatitis C virus entry. J Virol 82: Sharma, S. D Hepatitis C virus: molecular biology & current therapeutic options. Indian J Med Res 131:
38 Zeisel, M. B., S. Fafi-Kremer, I. Fofana, H. Barth, F. Stoll-Keller, M. Doffoel, and T. F. Baumert Neutralizing antibodies in hepatitis C virus infection. World J Gastroenterol 13: Petrovic, D., E. Dempsey, D. G. Doherty, D. Kelleher, and A. Long Hepatitis C virus--t-cell responses and viral escape mutations. Eur J Immunol 42: Helle, F., G. Duverlie, and J. Dubuisson The hepatitis C virus glycan shield and evasion of the humoral immune response. Viruses 3: Sattentau, Q Avoiding the void: cell-to-cell spread of human viruses. Nat Rev Microbiol 6: Hubner, W., G. P. McNerney, P. Chen, B. M. Dale, R. E. Gordon, F. Y. Chuang, X. D. Li, D. M. Asmuth, T. Huser, and B. K. Chen Quantitative 3D video microscopy of HIV transfer across T cell virological synapses. Science 323: Igakura, T., J. C. Stinchcombe, P. K. Goon, G. P. Taylor, J. N. Weber, G. M. Griffiths, Y. Tanaka, M. Osame, and C. R. Bangham Spread of HTLV-I between lymphocytes by virus-induced polarization of the cytoskeleton. Science 299: Kadiu, I., and H. E. Gendelman Human immunodeficiency virus type 1 endocytic trafficking through macrophage bridging conduits facilitates spread of infection. J Neuroimmune Pharmacol 6: Dingwell, K. S., C. R. Brunetti, R. L. Hendricks, Q. Tang, M. Tang, A. J. Rainbow, and D. C. Johnson Herpes simplex virus glycoproteins E and I facilitate cell-to-cell spread in vivo and across junctions of cultured cells. J Virol 68: Doceul, V., M. Hollinshead, L. van der Linden, and G. L. Smith Repulsion of superinfecting virions: a mechanism for rapid virus spread. Science 327: Jolly, C., K. Kashefi, M. Hollinshead, and Q. J. Sattentau HIV-1 cell to cell transfer across an Env-induced, actin-dependent synapse. J Exp Med 199: Jolly, C., and Q. J. Sattentau Retroviral spread by induction of virological synapses. Traffic 5: Sowinski, S., C. Jolly, O. Berninghausen, M. A. Purbhoo, A. Chauveau, K. Kohler, S. Oddos, P. Eissmann, F. M. Brodsky, C. Hopkins, B. Onfelt, Q. Sattentau, and D. M. Davis Membrane nanotubes physically connect T cells over long distances presenting a novel route for HIV-1 transmission. Nat Cell Biol 10: Martin, B. R., B. N. Giepmans, S. R. Adams, and R. Y. Tsien Mammalian cell-based optimization of the biarsenical-binding tetracysteine motif for improved fluorescence and affinity. Nat Biotechnol 23: Coller, K. E., N. S. Heaton, K. L. Berger, J. D. Cooper, J. L. Saunders, and G. Randall Molecular determinants and dynamics of hepatitis C virus secretion. PLoS Pathog 8:e Takeuchi, T., A. Katsume, T. Tanaka, A. Abe, K. Inoue, K. Tsukiyama-Kohara, R. Kawaguchi, S. Tanaka, and M. Kohara Real-time detection system for quantification of hepatitis C virus genome. Gastroenterology 116: Chen, P., W. Hubner, M. A. Spinelli, and B. K. Chen Predominant mode of human immunodeficiency virus transfer between T cells is mediated by sustained Env-dependent neutralization-resistant virological synapses. J Virol 81:
39 Lopez-Balderas, N., L. Huerta, C. Villarreal, E. Rivera-Toledo, G. Sandoval, C. Larralde, and E. Lamoyi In vitro cell fusion between CD4(+) and HIV-1 Env(+) T cells generates a diversity of syncytia varying in total number, size and cellular content. Virus Res 123: Evans, M. J., T. von Hahn, D. M. Tscherne, A. J. Syder, M. Panis, B. Wolk, T. Hatziioannou, J. A. McKeating, P. D. Bieniasz, and C. M. Rice Claudin-1 is a hepatitis C virus co-receptor required for a late step in entry. Nature 446: Pileri, P., Y. Uematsu, S. Campagnoli, G. Galli, F. Falugi, R. Petracca, A. J. Weiner, M. Houghton, D. Rosa, G. Grandi, and S. Abrignani Binding of hepatitis C virus to CD81. Science 282: Ploss, A., M. J. Evans, V. A. Gaysinskaya, M. Panis, H. You, Y. P. de Jong, and C. M. Rice Human occludin is a hepatitis C virus entry factor required for infection of mouse cells. Nature 457: Scarselli, E., H. Ansuini, R. Cerino, R. M. Roccasecca, S. Acali, G. Filocamo, C. Traboni, A. Nicosia, R. Cortese, and A. Vitelli The human scavenger receptor class B type I is a novel candidate receptor for the hepatitis C virus. EMBO J 21: Polcicova, K., K. Goldsmith, B. L. Rainish, T. W. Wisner, and D. C. Johnson The extracellular domain of herpes simplex virus ge is indispensable for efficient cell-to-cell spread: evidence for ge/gi receptors. J Virol 79: Roper, R. L., E. J. Wolffe, A. Weisberg, and B. Moss The envelope protein encoded by the A33R gene is required for formation of actin-containing microvilli and efficient cell-to-cell spread of vaccinia virus. J Virol 72: Bartosch, B., A. Vitelli, C. Granier, C. Goujon, J. Dubuisson, S. Pascale, E. Scarselli, R. Cortese, A. Nicosia, and F. L. Cosset Cell entry of hepatitis C virus requires a set of co-receptors that include the CD81 tetraspanin and the SR-B1 scavenger receptor. J Biol Chem 278: Flint, M., T. von Hahn, J. Zhang, M. Farquhar, C. T. Jones, P. Balfe, C. M. Rice, and J. A. McKeating Diverse CD81 proteins support hepatitis C virus infection. J Virol 80: Zhang, J., G. Randall, A. Higginbottom, P. Monk, C. M. Rice, and J. A. McKeating CD81 is required for hepatitis C virus glycoprotein-mediated viral infection. J Virol 78: Hsu, M., J. Zhang, M. Flint, C. Logvinoff, C. Cheng-Mayer, C. M. Rice, and J. A. McKeating Hepatitis C virus glycoproteins mediate ph-dependent cell entry of pseudotyped retroviral particles. Proc Natl Acad Sci U S A 100: Meertens, L., C. Bertaux, L. Cukierman, E. Cormier, D. Lavillette, F. L. Cosset, and T. Dragic The tight junction proteins claudin-1, -6, and -9 are entry cofactors for hepatitis C virus. J Virol 82: Bertaux, C., and T. Dragic Different domains of CD81 mediate distinct stages of hepatitis C virus pseudoparticle entry. J Virol 80: Codran, A., C. Royer, D. Jaeck, M. Bastien-Valle, T. F. Baumert, M. P. Kieny, C. A. Pereira, and J. P. Martin Entry of hepatitis C virus pseudotypes into primary human hepatocytes by clathrin-dependent endocytosis. J Gen Virol 87: Ito, K., Y. Yamaoka, H. Ota, H. El-Zimaity, and D. Y. Graham Adherence, internalization, and persistence of Helicobacter pylori in hepatocytes. Dig Dis Sci 53:
40 Ang, F., A. P. Wong, M. M. Ng, and J. J. Chu Small interference RNA profiling reveals the essential role of human membrane trafficking genes in mediating the infectious entry of dengue virus. Virology journal 7: Kolesnikova, L., A. B. Bohil, R. E. Cheney, and S. Becker Budding of Marburgvirus is associated with filopodia. Cellular microbiology 9: Zieve, G. W., D. Turnbull, J. M. Mullins, and J. R. McIntosh Production of large numbers of mitotic mammalian cells by use of the reversible microtubule inhibitor nocodazole. Nocodazole accumulated mitotic cells. Experimental cell research 126: Whitt, M. A., and C. E. Mire Utilization of fluorescently-labeled tetracysteine-tagged proteins to study virus entry by live cell microscopy. Methods 55: Counihan, N. A., S. M. Rawlinson, and B. D. Lindenbach Trafficking of hepatitis C virus core protein during virus particle assembly. PLoS Pathog 7:e Owsianka, A. M., A. W. Tarr, Z. Y. Keck, T. K. Li, J. Witteveldt, R. Adair, S. K. Foung, J. K. Ball, and A. H. Patel Broadly neutralizing human monoclonal antibodies to the hepatitis C virus E2 glycoprotein. J Gen Virol 89: Keck, Z. Y., J. Xia, Z. Cai, T. K. Li, A. M. Owsianka, A. H. Patel, G. Luo, and S. K. Foung Immunogenic and functional organization of hepatitis C virus (HCV) glycoprotein E2 on infectious HCV virions. J Virol 81: Wakita, T., T. Pietschmann, T. Kato, T. Date, M. Miyamoto, Z. Zhao, K. Murthy, A. Habermann, H. G. Krausslich, M. Mizokami, R. Bartenschlager, and T. J. Liang Production of infectious hepatitis C virus in tissue culture from a cloned viral genome. Nat Med 11: Zhong, J., P. Gastaminza, G. Cheng, S. Kapadia, T. Kato, D. R. Burton, S. F. Wieland, S. L. Uprichard, T. Wakita, and F. V. Chisari Robust hepatitis C virus infection in vitro. Proc Natl Acad Sci U S A 102: Lindenbach, B. D., M. J. Evans, A. J. Syder, B. Wolk, T. L. Tellinghuisen, C. C. Liu, T. Maruyama, R. O. Hynes, D. R. Burton, J. A. McKeating, and C. M. Rice Complete replication of hepatitis C virus in cell culture. Science 309: Nakamura, T., Y. Nakayama, H. Teramoto, K. Nawa, and A. Ichihara Loss of reciprocal modulations of growth and liver function of hepatoma cells in culture by contact with cells or cell membranes. Proc Natl Acad Sci U S A 81: Agnello, V., G. Abel, G. B. Knight, and E. Muchmore Detection of widespread hepatocyte infection in chronic hepatitis C. Hepatology 28: Chang, M., O. Williams, J. Mittler, A. Quintanilla, R. L. Carithers, Jr., J. Perkins, L. Corey, and D. R. Gretch Dynamics of hepatitis C virus replication in human liver. Am J Pathol 163: Logvinoff, C., M. E. Major, D. Oldach, S. Heyward, A. Talal, P. Balfe, S. M. Feinstone, H. Alter, C. M. Rice, and J. A. McKeating Neutralizing antibody response during acute and chronic hepatitis C virus infection. Proc Natl Acad Sci U S A 101: Pal, S., M. C. Shuhart, L. Thomassen, S. S. Emerson, T. Su, N. Feuerborn, J. Kae, and D. R. Gretch Intrahepatic hepatitis C virus replication correlates with chronic hepatitis C disease severity in vivo. J Virol 80: Loo, Y. M., D. M. Owen, K. Li, A. K. Erickson, C. L. Johnson, P. M. Fish, D. S. Carney, T. Wang, H. 40
41 Ishida, M. Yoneyama, T. Fujita, T. Saito, W. M. Lee, C. H. Hagedorn, D. T. Lau, S. A. Weinman, S. M. Lemon, and M. Gale, Jr Viral and therapeutic control of IFN-beta promoter stimulator 1 during hepatitis C virus infection. Proc Natl Acad Sci U S A 103: Timpe, J. M., Z. Stamataki, A. Jennings, K. Hu, M. J. Farquhar, H. J. Harris, A. Schwarz, I. Desombere, G. L. Roels, P. Balfe, and J. A. McKeating Hepatitis C virus cell-cell transmission in hepatoma cells in the presence of neutralizing antibodies. Hepatology 47: Catanese, M. T., R. Graziani, T. von Hahn, M. Moreau, T. Huby, G. Paonessa, C. Santini, A. Luzzago, C. M. Rice, R. Cortese, A. Vitelli, and A. Nicosia High-Avidity Monoclonal Antibodies against the Human Scavenger Class B Type I Receptor Efficiently Block Hepatitis C Virus Infection in the Presence of High-Density Lipoprotein. Journal of Virology 81: Dreux, M., V. L. Dao Thi, J. Fresquet, M. Guérin, Z. Julia, G. Verney, D. Durantel, F. Zoulim, D. Lavillette, F.-L. Cosset, B. Bartosch, and M. J. Evans Receptor Complementation and Mutagenesis Reveal SR-BI as an Essential HCV Entry Factor and Functionally Imply Its Intra- and Extra-Cellular Domains. PLoS Pathogens 5:e Koutsoudakis, G., A. Kaul, E. Steinmann, S. Kallis, V. Lohmann, T. Pietschmann, and R. Bartenschlager Characterization of the early steps of hepatitis C virus infection by using luciferase reporter viruses. J Virol 80: Voisset, C., N. Callens, E. Blanchard, A. Op De Beeck, J. Dubuisson, and N. Vu-Dac High density lipoproteins facilitate hepatitis C virus entry through the scavenger receptor class B type I. J Biol Chem 280: Ploss, A., M. J. Evans, V. A. Gaysinskaya, M. Panis, H. You, Y. P. de Jong, and C. M. Rice Human occludin is a hepatitis C virus entry factor required for infection of mouse cells. Nature 457: Brimacombe, C. L., J. Grove, L. W. Meredith, K. Hu, A. J. Syder, M. V. Flores, J. M. Timpe, S. E. Krieger, T. F. Baumert, T. L. Tellinghuisen, F. Wong-Staal, P. Balfe, and J. A. McKeating Neutralizing antibody-resistant hepatitis C virus cell-to-cell transmission. J Virol 85: Witteveldt, J., M. J. Evans, J. Bitzegeio, G. Koutsoudakis, A. M. Owsianka, A. G. Angus, Z. Y. Keck, S. K. Foung, T. Pietschmann, C. M. Rice, and A. H. Patel CD81 is dispensable for hepatitis C virus cell-to-cell transmission in hepatoma cells. J Gen Virol 90: Ritzenthaler, C Parallels and distinctions in the direct cell-to-cell spread of the plant and animal viruses. Current opinion in virology 1: Kawakami, S., Y. Watanabe, and R. N. Beachy Tobacco mosaic virus infection spreads cell to cell as intact replication complexes. Proc Natl Acad Sci U S A 101: Amari, K., A. Lerich, C. Schmitt-Keichinger, V. V. Dolja, and C. Ritzenthaler Tubule-guided cell-to-cell movement of a plant virus requires class XI myosin motors. PLoS Pathog 7:e Avisar, D., A. I. Prokhnevsky, and V. V. Dolja Class VIII myosins are required for plasmodesmatal localization of a closterovirus Hsp70 homolog. J Virol 82: Harries, P. A., J. E. Schoelz, and R. S. Nelson Intracellular transport of viruses and their components: utilizing the cytoskeleton and membrane highways. Molecular plant-microbe interactions : MPMI 23: Coller, K. E., K. L. Berger, N. S. Heaton, J. D. Cooper, R. Yoon, and G. Randall RNA 41
42 interference and single particle tracking analysis of hepatitis C virus endocytosis. PLoS Pathog 5:e Bost, A. G., D. Venable, L. Liu, and B. A. Heinz Cytoskeletal requirements for hepatitis C virus (HCV) RNA synthesis in the HCV replicon cell culture system. Journal of virology 77: Berger, K. L., J. D. Cooper, N. S. Heaton, R. Yoon, T. E. Oakland, T. X. Jordan, G. Mateu, A. Grakoui, and G. Randall Roles for endocytic trafficking and phosphatidylinositol 4-kinase III alpha in hepatitis C virus replication. Proceedings of the National Academy of Sciences of the United States of America 106: Roohvand, F., P. Maillard, J. P. Lavergne, S. Boulant, M. Walic, U. Andreo, L. Goueslain, F. Helle, A. Mallet, J. McLauchlan, and A. Budkowska Initiation of hepatitis C virus infection requires the dynamic microtubule network: role of the viral nucleocapsid protein. The Journal of biological chemistry 284: Wolk, B., B. Buchele, D. Moradpour, and C. M. Rice A dynamic view of hepatitis C virus replication complexes. Journal of virology 82: Shulla, A., and G. Randall Hepatitis C virus-host interactions, replication, and viral assembly. Current opinion in virology. 81. Popescu, C. I., Y. Rouille, and J. Dubuisson Hepatitis C virus assembly imaging. Viruses 3: Downloaded from on April 27, 2018 by guest 42
43 964 FIGURE LEGENDS Figure 1. Formation of HCV infection foci and density-dependent HCV transfer. (a) Huh7.5.1 cells were inoculated with culture media (- HCV), JFH1 virus at a high MOI of 0.4 (+ HCV), or JFH1 virus at a low MOI of 4 X 10⁻⁴ (+ HCV), cultured for 3 days and immunostained for HCV core (green) followed by DAPI counterstain (blue, for nuclei). (b-e) Huh7.5.1 cells were inoculated with culture media (- HCV) or HCV JFH1 stock (+ HCV) at MOI = At day 1 post-infection, the infected cells were replated at different densities which gave rise to 30%, 50%, 70%, 85%, and 100% confluence 3 days post-replating at which time the cells were harvested and analyzed by (b) Western blotting against HCV core, (c) immunostained for HCV core (green) and DAPI (blue) (representative images), (d) counted for core-positive cells under a fluorescence microscope, or (e) analyzed by flow cytometry for core-positive cells (correlation coefficient R = , which was derived from a standard two-variable mathematical regression analysis: cell confluence vs. percentage of core-positive cells). Figure 2. CCCM HCV transfer among Huh7.5.1 cells. Huh7.5.1 cells were infected with JFH-1 virus at MOI = 0.01, cultured for 3 days, and co-cultured with GFP-expressing Huh7.5.1 (a i, v, ix), CMFDA-labeled Huh7.5.1 (a ii, vi, x) or PKH labeled Huh7.5.1 (a iii, vii, xi) target cells. Alternatively, the JFH-1-infected cells were labeled with CMFDA (a iv, viii, xii) and co-cultured with unlabeled Huh7.5.1 target cells. 43
44 The donor:target cell ratio was 1. After 20 hr of co-culturing, the cell mixture was subjected to immunostaining against HCV core, followed by (a) confocal imaging (newly transferred target cells marked by arrowhead) or (b) flow cytometry analysis. Nuclei were counterstained with DAPI Figure 3. CCCM HCV transfer between Huh7.5.1 and primary human hepatocytes. Human primary hepatocytes (PHH) were co-cultured with JFH-1-infected CMFDA-labeled Huh7.5.1 cells at a 1:1 ratio for 20 hr. The mixed culture was immunostained for HCV core and subjected to (a) confocal imaging or (b) flow cytometry. The human primary hepatocytes with CCCM HCV transfer were marked with an arrowhead in (a). Figure 4. CCCM HCV transfer versus cell-free virus infection. (a) JFH1-infected Huh7.5.1 donor cells were co-cultured with PKH-labeled Huh7.5.1 target cells at 1:1 ratio for 0, 3, 6, 9 or 20 hr, followed by immunostaining for HCV core and flow cytometry analysis. The HCV core-positive and PKH-positive cells in the upper right quadrant represented cells with CCCM HCV transfer; they were expressed as the percentage of the total number of the cells and shown in the upper right quadrant in each dot plot. (b) JHF1-infected Huh7.5.1 donor cells were seeded on top of a 0.4 µm virus-permeable membrane in a transwell insert and Huh7.5.1 target cells were seeded in the lower chamber of the transwell. The cells were cultured for 20 hr with the same total number 44
45 of cells as the co-culturing assay. The cells in the lower chambers were collected, immunostained for core protein and analyzed by flow cytometry. (c) CCCM HCV transfer kinetics in co-culturing and transwell assays at the same 1:2 ratio of D:T. (d) Similar transwell experiments were performed as described above in (b) except for extended culturing times. HCV RNA in the upper and lower chambers were determined by qrt-pcr (left Y axis, bar graph), whereas the percentage of core-positive cells in the lower chamber was determined by immunostaining for core protein followed by flow cytometry (right Y axis, dotted line). (e) Cell-free HCV infection kinetics. Huh7.5.1 cells were infected with HCV JFH1 (MOI = 1); cells were harvested at indicated times and determined of core-positive cells by immunostaining for core followed by flow cytometry. (f) Similar co-culturing experiments were performed as described above with different ratios of donor:target cells. Figure 5. Expression of CD81, SR-B1, CLDN1 and OCLN and CCCM HCV transfer. Huh7.5.1 cells were transfected with 100 nm sirnas specific for CD81, SR-B1, CLDN1, and OCLN. Pre-experiments were performed to determine which sirna concentration allowed maximal knockdown. At 48 hr post-transfection, cells were collected for analysis of (a) CD81 expression by flow cytometry, (b) SR-B1, CLDN1, and OCLN expression by Western blotting, and (c) OCLN expression by immunofluorescence staining and imaging. The sirna transfected cells at 48 hr post-transfection were labeled with PKH and then co-cultured with JFH1-infected Huh7.5.1 cells at a 1:1 ratio for 20 hr. The 45
46 mixed cells were then immunostained for HCV core and analyzed by (d) flow cytometry for target cells with CCCM HCV transfer. (e) Huh7.5.1 cells that were transfected with all four sirnas for CD81, SR-B1, CLDN1 and OCLN (50 nm each) were evaluated for CCCM HCV transfer. sirna control and isotype staining controls were included in each set of experiments as shown. Figure 6. No CCCM HCV transfer from Huh7.5.1 to other hepatoma and non-hepatoma cell lines. HepG2 cells were transfected with pcdna3-cd81; NKNT3 cells were transfected with pcmv-cldn1; and 293T cells were transfected simultaneously with both pcdna3-sr-b1 and pcmv-cldn. At 48 hr post-transfection, the transfected cells were collected for analysis of (a) CD81 expression (in HepG2) by flow cytometry, (c) CLDN1 expression in NKNT3 cells by Western blotting, or (e) or SR-B1 and CLDN1 expression in 293T cells by Western blotting. Simultaneously, these receptor-expressing HepG2, NKNT3 or 293T cells were labeled with PKH or CMFDA and co-cultured with JFH1-infected Huh7.5.1 cells at a 1:1 ratio for 20 hr. The mixed cultures were immunostained against HCV core and analyzed by flow cytometry for target cells with CCCM HCV transfer (b, d, and f). Naïve Huh7.5.1 cells and pcdna3-transfected 293T, HepG2 and NKNT3 cells were included as controls in these experiments. NS: not significant Figure 7. Actin and microtubule cytoskeletons and CCCM HCV transfer. 46
47 JFH1-infected Huh7.5.1 donor cells were mixed with CMFDA-labeled target Huh7.5.1 at a 1:1 ratio and seeded. Two hours post-seeding, cytochalasin D (a & b) or nocodazole (c & d) were added to the cultures at the indicated concentrations and the cells were cultured for an additional 18 hr. Cytochalasin D-treated co-cultures were stained with phalloidin-tritc followed by DAPI (a), while nocodazole-treated co-cultures were immunostained with a mouse anti-tubulin antibody followed by goat anti-mouse IgG-Alexa555, and DAPI (c). Both cytochalasin D- (b) and nocodazole-treated (d) co-cultures were immunostained against HCV core and analyzed by flow cytometry to determine the percentage of core-positive target cells. The percentage of core-positive target cells within the initial 2 hr post-seeding period was determined and subtracted from that after the 20 hr co-culturing. Figure 8. Characterization of recombinant JFH1-TCcore HCV. (a) JFH1-TCcore recombinant HCV clone. A TC tag-containing 12 aa peptide was inserted after the third amino acid of HCV JFH1 core. (b) & (c) Huh7.5.1 cells were transfected with an equal amount of in vitro transcribed full-length HCV JFH1 RNA or HCV JFH-TCcore RNA. Transfection medium was replaced with fresh culture medium and the cells were extensively washed 6 hr after transfection. RNA was isolated from the cells and the culture supernatants at indicated time points and was subjected to q-rt-pcr to monitor HCV replication in the cells (b) and HCV production in the culture supernatants (c), respectively. (d) ReAsH labeling specificity of TCcore in JFH1-TCcore 47
48 RNA-transfected Huh7.5.1 cells. Huh7.5.1 cells were transfected with JFH1 or JFH1-TCcore RNA. Three days post transfection, the cells were first labeled with ReAsH, then immunostained for HCV core and DAPI nuclei staining Figure 9. Live cell imaging of CCCM HCV transfer. JFH1-TCcore-infected ReAsH-labeled Huh7.5.1 donor cells (red) and Huh7.5.1-GFP target cells (green) were co-cultured and imaged live for 18 hr. (a) CCCM HCV transfer from one ReAsH-positive TCcore-positive donor cell (labeled with D ) to three GFP-positive target cells (labeled with T1, T2, T3 and outlined) sequentially over 18 hr of co-culturing. The ReAsH/GFP/DIC overlay is shown in the upper panel, from which the boxed area was magnified and examined in the middle (ReAsH only) and the lower (ReAsH/GFP overlay) panels. HCV transfer from the donor cell, D, to target cells T1 (i & ii), T2 (iii), and T3 (vi) is indicated by yellow arrowheads. The yellow arrow (v) indicated T3 s filapodia towards D after viral transfer. Time is shown in hr:min. (b) Concurrent HCV transfer from one donor cell (red) to two target cells (green). Orthogonal views are shown and the positions of the perpendicular planes are indicated as notches. (c) 3D reconstruction of a transfer event between a donor cell and one target cell, as observed in (b). This transfer event occurred at a later time than that shown in (b). (d) Transfer of a viral puncta (circled in the lower panel) into a target cell: (i) donor cell-target cell in contact before conjugate formation, (ii) formation of viral puncta-target 1089 cell conjugation, (iii) transfer of viral puncta, and (iv) post-transfer. 48 The lower panel is a
49 D reconstruction of the boxed area in the corresponding upper panel. (e) Tracking of transfer events in 13 donor cells in one imaging field; each line represents one donor-target pair Figure 10. CCCM HCV transfer leads to productive HCV infection. (a-d) Infected Huh7.5.1 cells were co-cultured with GFP-expressing Huh7.5.1 cells at the 1: 4 ratio in the presence of 5 µg/ml neutralizing antibody CBH-5 or a control antibody R04. The co-culture was replated every 24 hr and fresh antibodies were added. Meanwhile, aliquot of cells were collected for core staining followed by flow cytometry analysis for GFP+/core+ cells (a-c); the supernatants were also collected and used to infect uninfected Huh7.5.1, their infectivity was determined by immunostaining and flow cytometry analysis for HCV core-positive cells three days post infection (d). (a) Representative kinetics of GFP+/core+ cells; (b) data from multiple repeats; (c) the difference in mean fluorescence intensity (dmfi) of core staining of GFP+ cells from multiple repeats. (e-h) Infected Huh7.5.1 cells were co-cultured with GFP-expressing Huh7.5.1 cells at the 1: 4 ratio in the presence of 5 µg/ml neutralizing antibody CBH-5. GFP-expressing target cells were sorted out from the co-cultures at day one (D1) and further cultivated for an extended period of time. Core+ cells in the purified GFP+ cell population were determined at day 4 (D4) and 7 (D7) by core immunostaining. (e) Representative kinetics of GFP+/core+ cells; (f) data from multiple repeats. D1#: co-cultured cells prior to sorting. In addition, cells and their culture supernatants were collected at D4 49
50 and D7 and assayed for HCV RNA in the cell by qrt-pcr (g) or for the infectivity of the supernatant (h) as described in (d), respectively
51 Table 1. Expression of HCV receptors in different cell lines and their permissiveness to cell-free HCV infection Cells CD81 a SR-B1 b CLDN b OCLN b Cell-free HCV infection c 1117 Huh T HepG CYNK NKNT a. Determined by immunostaining and flow cytometry. b. Determined by Western blotting. c. Determined by cell-free JFH1 infection and immunostaining for core expression 3 days post infection. -: No expression or infection +: Low expression or infection ++: Medium expression or infection +++: high expression or infection 51
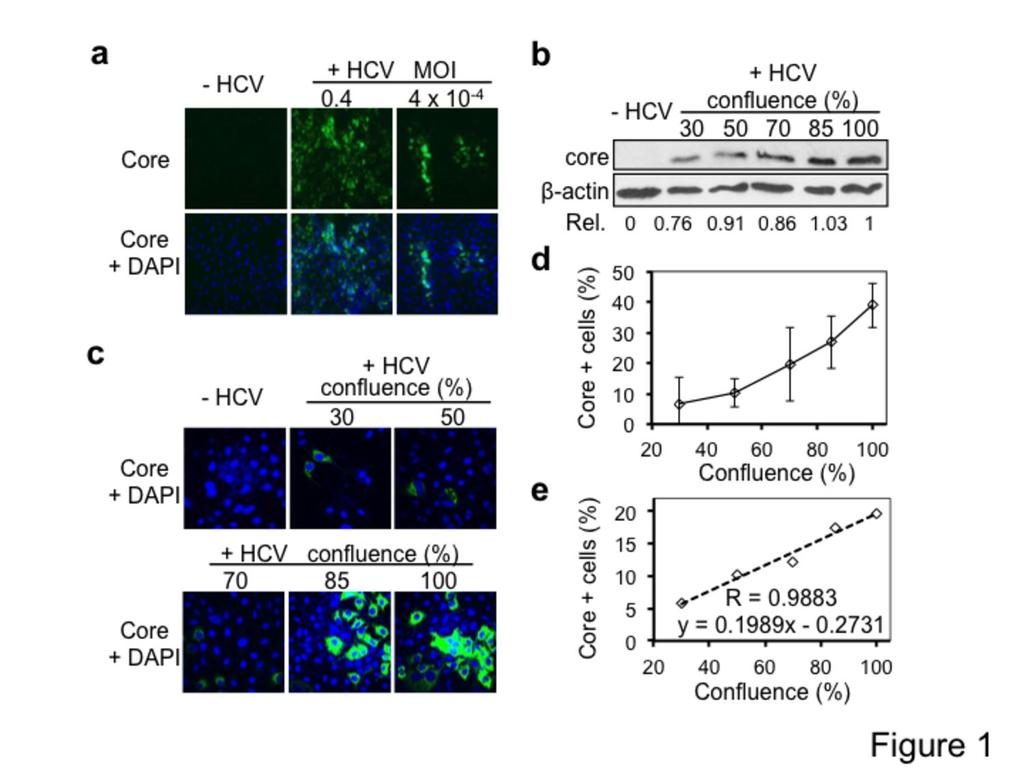
52
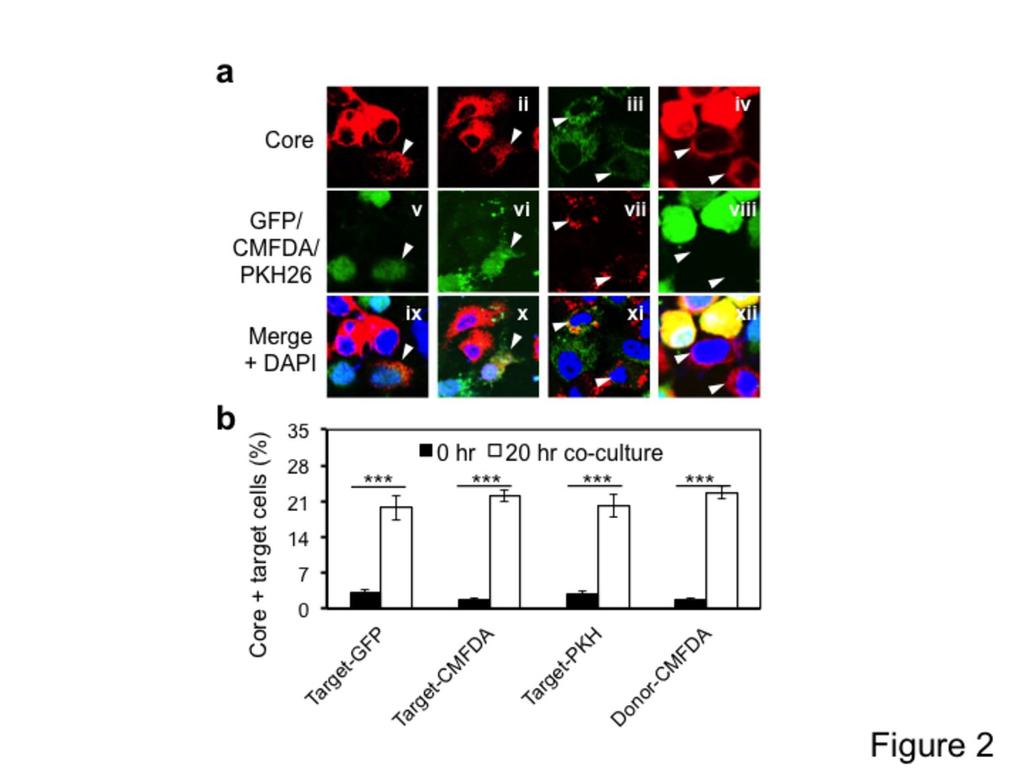
53
54
55
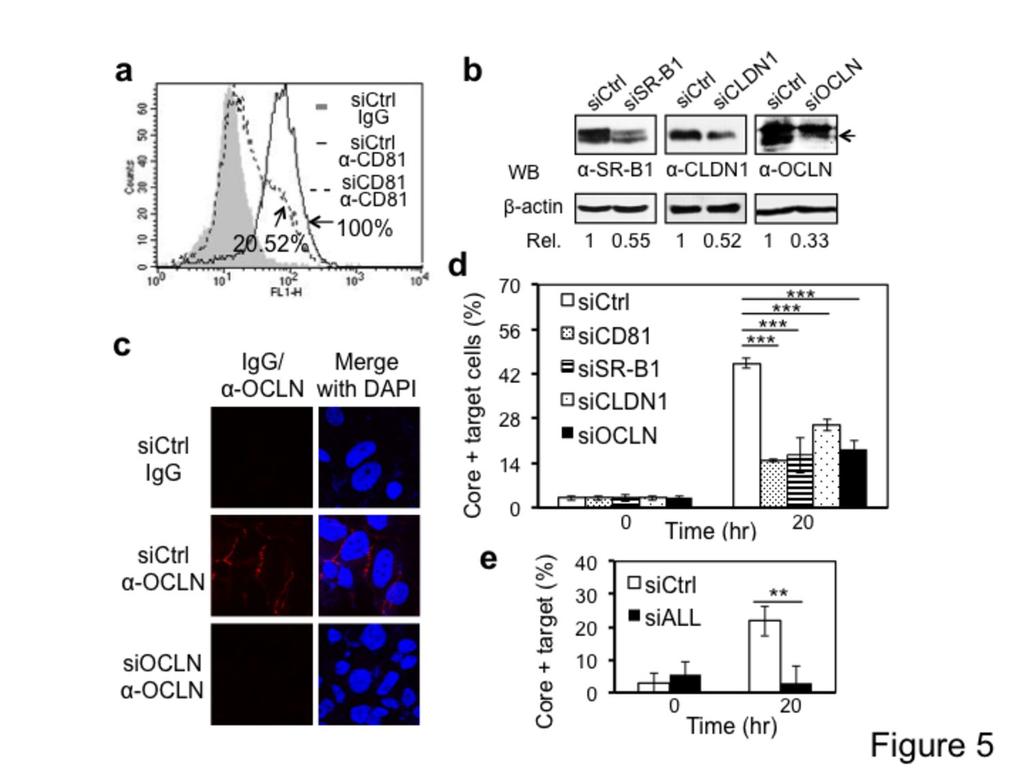
56
57
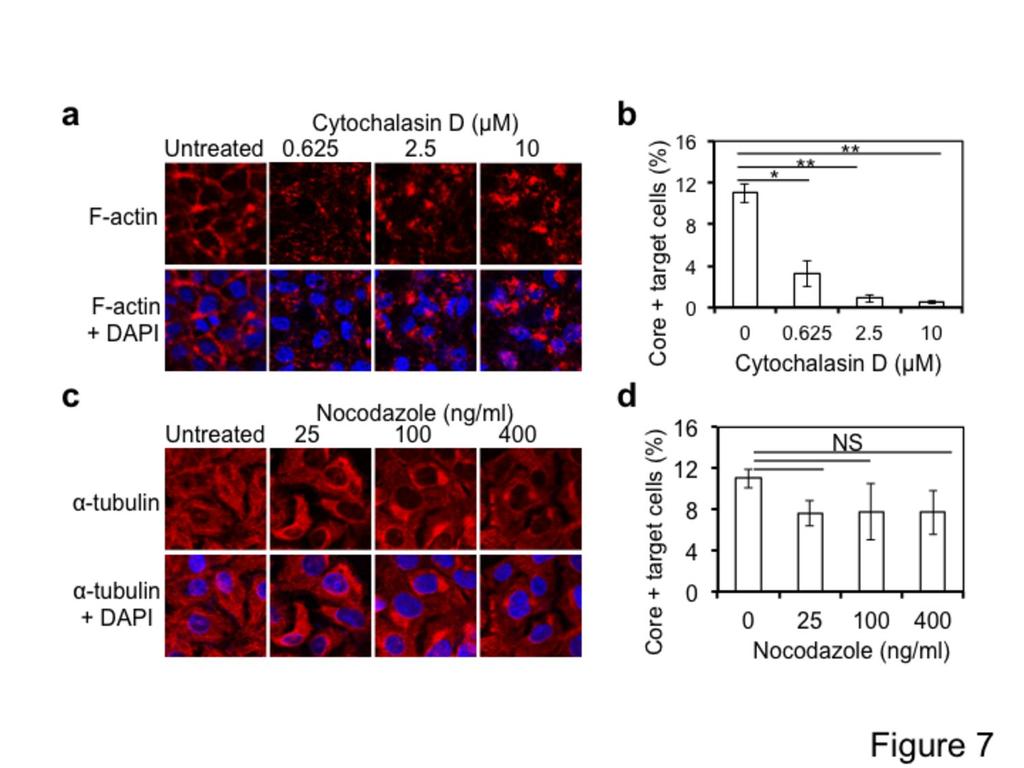
58
59
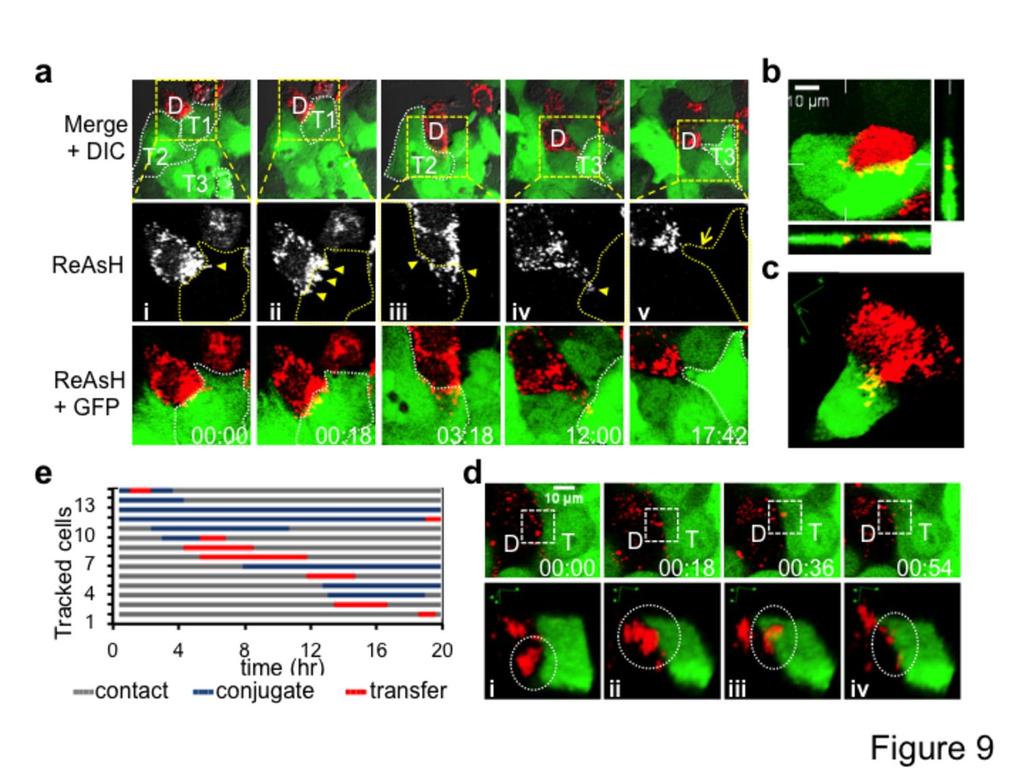
60
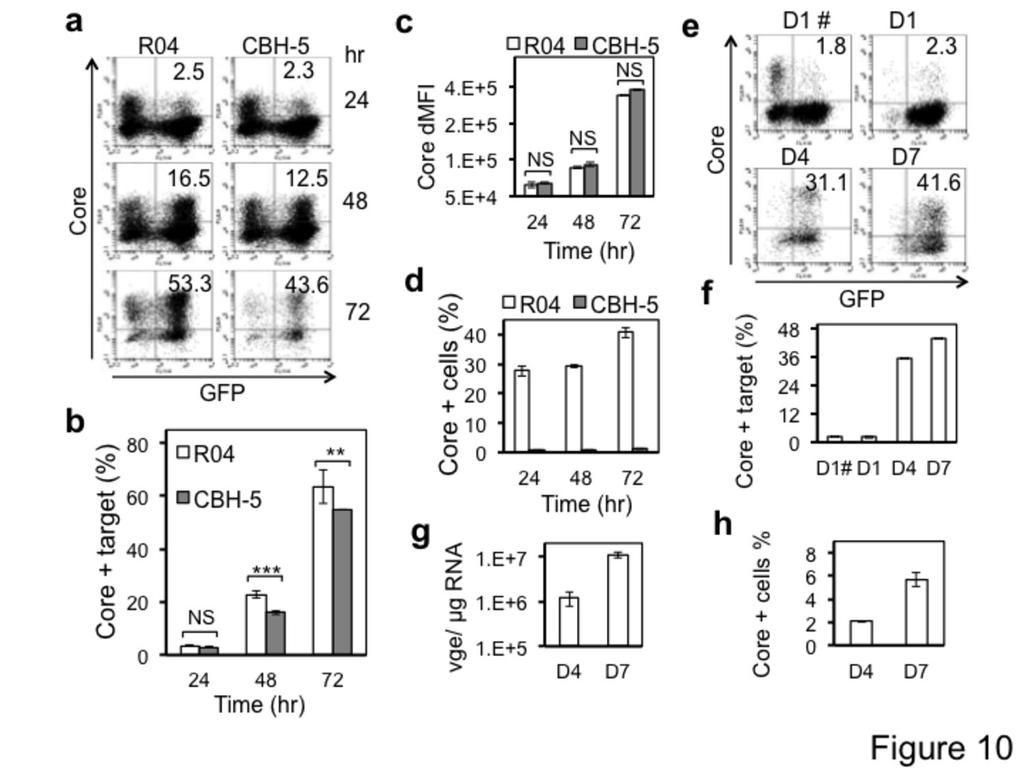
61
Influenza virus exploits tunneling nanotubes for cell-to-cell spread
 Supplementary Information Influenza virus exploits tunneling nanotubes for cell-to-cell spread Amrita Kumar 1, Jin Hyang Kim 1, Priya Ranjan 1, Maureen G. Metcalfe 2, Weiping Cao 1, Margarita Mishina 1,
Plasmids Western blot analysis and immunostaining Flow Cytometry Cell surface biotinylation RNA isolation and cdna synthesis
 Plasmids psuper-retro-s100a10 shrna1 was constructed by cloning the dsdna oligo 5 -GAT CCC CGT GGG CTT CCA GAG CTT CTT TCA AGA GAA GAA GCT CTG GAA GCC CAC TTT TTA-3 and 5 -AGC TTA AAA AGT GGG CTT CCA GAG
CD31 5'-AGA GAC GGT CTT GTC GCA GT-3' 5 ' -TAC TGG GCT TCG AGA GCA GT-3'
 Table S1. The primer sets used for real-time RT-PCR analysis. Gene Forward Reverse VEGF PDGFB TGF-β MCP-1 5'-GTT GCA GCA TGA ATC TGA GG-3' 5'-GGA GAC TCT TCG AGG AGC ACT T-3' 5'-GAA TCA GGC ATC GAG AGA
MicroRNA sponges: competitive inhibitors of small RNAs in mammalian cells
 MicroRNA sponges: competitive inhibitors of small RNAs in mammalian cells Margaret S Ebert, Joel R Neilson & Phillip A Sharp Supplementary figures and text: Supplementary Figure 1. Effect of sponges on
Supplementary Information
 Supplementary Information Supplementary Figure 1. CD4 + T cell activation and lack of apoptosis after crosslinking with anti-cd3 + anti-cd28 + anti-cd160. (a) Flow cytometry of anti-cd160 (5D.10A11) binding
Islet viability assay and Glucose Stimulated Insulin Secretion assay RT-PCR and Western Blot
 Islet viability assay and Glucose Stimulated Insulin Secretion assay Islet cell viability was determined by colorimetric (3-(4,5-dimethylthiazol-2-yl)-2,5- diphenyltetrazolium bromide assay using CellTiter
HIV-1 Virus-like Particle Budding Assay Nathan H Vande Burgt, Luis J Cocka * and Paul Bates
 HIV-1 Virus-like Particle Budding Assay Nathan H Vande Burgt, Luis J Cocka * and Paul Bates Department of Microbiology, Perelman School of Medicine at the University of Pennsylvania, Philadelphia, USA
Figure S1. Analysis of genomic and cdna sequences of the targeted regions in WT-KI and
 Figure S1. Analysis of genomic and sequences of the targeted regions in and indicated mutant KI cells, with WT and corresponding mutant sequences underlined. (A) cells; (B) K21E-KI cells; (C) D33A-KI cells;
Supplementary Figure 1
 Supplementary Figure 1 3 3 3 1 1 Bregma -1.6mm 3 : Bregma Ref) Http://www.mbl.org/atlas165/atlas165_start.html Bregma -.18mm Supplementary Figure 1 Schematic representation of the utilized brain slice
Supplementary Table 3. 3 UTR primer sequences. Primer sequences used to amplify and clone the 3 UTR of each indicated gene are listed.
 Supplemental Figure 1. DLKI-DIO3 mirna/mrna complementarity. Complementarity between the indicated DLK1-DIO3 cluster mirnas and the UTR of SOX2, SOX9, HIF1A, ZEB1, ZEB2, STAT3 and CDH1with mirsvr and PhastCons
Supplementary Figure 1
 Supplementary Figure 1 Supplementary Figure 1: Cryopreservation alters CD62L expression by CD4 T cells. Freshly isolated (left) or cryopreserved PBMCs (right) were stained with the mix of antibodies described
c Tuj1(-) apoptotic live 1 DIV 2 DIV 1 DIV 2 DIV Tuj1(+) Tuj1/GFP/DAPI Tuj1 DAPI GFP
 apoptotic live 1 DIV 2 DIV 1 DIV 2 DIV Tuj1(+) Tuj1/GFP/DAPI Tuj1 DAPI GFP") Supplementary Figure 1 Establishment of the gain- and loss-of-function experiments and cell survival assays. a Relative expression of mature mir-484 30 20 10 0 **** **** NCP mir- 484P NCP mir- 484P b Relative
Supplementary Figure 1 Establishment of the gain- and loss-of-function experiments and cell survival assays. a Relative expression of mature mir-484 30 20 10 0 **** **** NCP mir- 484P NCP mir- 484P b Relative
Supplementary data Supplementary Figure 1 Supplementary Figure 2
 Supplementary data Supplementary Figure 1 SPHK1 sirna increases RANKL-induced osteoclastogenesis in RAW264.7 cell culture. (A) RAW264.7 cells were transfected with oligocassettes containing SPHK1 sirna
a) Primary cultures derived from the pancreas of an 11-week-old Pdx1-Cre; K-MADM-p53
 Primary cultures derived from the pancreas of an 11-week-old Pdx1-Cre; K-MADM-p53") 1 2 3 4 5 6 7 8 9 10 Supplementary Figure 1. Induction of p53 LOH by MADM. a) Primary cultures derived from the pancreas of an 11-week-old Pdx1-Cre; K-MADM-p53 mouse revealed increased p53 KO/KO (green,
1 2 3 4 5 6 7 8 9 10 Supplementary Figure 1. Induction of p53 LOH by MADM. a) Primary cultures derived from the pancreas of an 11-week-old Pdx1-Cre; K-MADM-p53 mouse revealed increased p53 KO/KO (green,
Supplementary Appendix
 Supplementary Appendix This appendix has been provided by the authors to give readers additional information about their work. Supplement to: Sherman SI, Wirth LJ, Droz J-P, et al. Motesanib diphosphate
SUPPORTING MATREALS. Methods and Materials
 SUPPORTING MATREALS Methods and Materials Cell Culture MC3T3-E1 (subclone 4) cells were maintained in -MEM with 10% FBS, 1% Pen/Strep at 37ºC in a humidified incubator with 5% CO2. MC3T3 cell differentiation
Abbreviations: P- paraffin-embedded section; C, cryosection; Bio-SA, biotin-streptavidin-conjugated fluorescein amplification.
 Supplementary Table 1. Sequence of primers for real time PCR. Gene Forward primer Reverse primer S25 5 -GTG GTC CAC ACT ACT CTC TGA GTT TC-3 5 - GAC TTT CCG GCA TCC TTC TTC-3 Mafa cds 5 -CTT CAG CAA GGA
Supplementary Document
 Supplementary Document 1. Supplementary Table legends 2. Supplementary Figure legends 3. Supplementary Tables 4. Supplementary Figures 5. Supplementary References 1. Supplementary Table legends Suppl.
Protocol for Gene Transfection & Western Blotting
 The schedule and the manual of basic techniques for cell culture Advanced Protocol for Gene Transfection & Western Blotting Schedule Day 1 26/07/2008 Transfection Day 3 28/07/2008 Cell lysis Immunoprecipitation
Toluidin-Staining of mast cells Ear tissue was fixed with Carnoy (60% ethanol, 30% chloroform, 10% acetic acid) overnight at 4 C, afterwards
 overnight at 4 C, afterwards") Toluidin-Staining of mast cells Ear tissue was fixed with Carnoy (60% ethanol, 30% chloroform, 10% acetic acid) overnight at 4 C, afterwards incubated in 100 % ethanol overnight at 4 C and embedded in
Toluidin-Staining of mast cells Ear tissue was fixed with Carnoy (60% ethanol, 30% chloroform, 10% acetic acid) overnight at 4 C, afterwards incubated in 100 % ethanol overnight at 4 C and embedded in
SUPPLEMENTARY INFORMATION. Supplementary Figures S1-S9. Supplementary Methods
 SUPPLEMENTARY INFORMATION SUMO1 modification of PTEN regulates tumorigenesis by controlling its association with the plasma membrane Jian Huang 1,2#, Jie Yan 1,2#, Jian Zhang 3#, Shiguo Zhu 1, Yanli Wang
(a) Significant biological processes (upper panel) and disease biomarkers (lower panel)
 Significant biological processes (upper panel) and disease biomarkers (lower panel)") Supplementary Figure 1. Functional enrichment analyses of secretomic proteins. (a) Significant biological processes (upper panel) and disease biomarkers (lower panel) 2 involved by hrab37-mediated secretory
Supplementary Figure 1. Functional enrichment analyses of secretomic proteins. (a) Significant biological processes (upper panel) and disease biomarkers (lower panel) 2 involved by hrab37-mediated secretory
CHAPTER 4 RESULTS. showed that all three replicates had similar growth trends (Figure 4.1) (p<0.05; p=0.0000)
 (p<0.05; p=0.0000)") CHAPTER 4 RESULTS 4.1 Growth Characterization of C. vulgaris 4.1.1 Optical Density Growth study of Chlorella vulgaris based on optical density at 620 nm (OD 620 ) showed that all three replicates had similar
CHAPTER 4 RESULTS 4.1 Growth Characterization of C. vulgaris 4.1.1 Optical Density Growth study of Chlorella vulgaris based on optical density at 620 nm (OD 620 ) showed that all three replicates had similar
Supplemental Data. Shin et al. Plant Cell. (2012) /tpc YFP N
 /tpc YFP N") MYC YFP N PIF5 YFP C N-TIC TIC Supplemental Data. Shin et al. Plant Cell. ()..5/tpc..95 Supplemental Figure. TIC interacts with MYC in the nucleus. Bimolecular fluorescence complementation assay using
MYC YFP N PIF5 YFP C N-TIC TIC Supplemental Data. Shin et al. Plant Cell. ()..5/tpc..95 Supplemental Figure. TIC interacts with MYC in the nucleus. Bimolecular fluorescence complementation assay using
Supplementary Material
 Supplementary Material Nuclear import of purified HIV-1 Integrase. Integrase remains associated to the RTC throughout the infection process until provirus integration occurs and is therefore one likely
Supplementary Figure 1. ROS induces rapid Sod1 nuclear localization in a dosagedependent manner. WT yeast cells (SZy1051) were treated with 4NQO at
 were treated with 4NQO at") Supplementary Figure 1. ROS induces rapid Sod1 nuclear localization in a dosagedependent manner. WT yeast cells (SZy1051) were treated with 4NQO at different concentrations for 30 min and analyzed for
Supplementary Figure 1. ROS induces rapid Sod1 nuclear localization in a dosagedependent manner. WT yeast cells (SZy1051) were treated with 4NQO at different concentrations for 30 min and analyzed for
SUPPLEMENT. Materials and methods
 SUPPLEMENT Materials and methods Cell culture and reagents Cell media and reagents were from Invitrogen unless otherwise indicated. Antibiotics and Tet-certified serum were from Clontech. In experiments
04_polarity. The formation of synaptic vesicles
 Brefeldin prevents assembly of the coats required for budding Nocodazole disrupts microtubules Constitutive: coatomer-coated Selected: clathrin-coated The formation of synaptic vesicles Nerve cells (and
TFEB-mediated increase in peripheral lysosomes regulates. Store Operated Calcium Entry
 TFEB-mediated increase in peripheral lysosomes regulates Store Operated Calcium Entry Luigi Sbano, Massimo Bonora, Saverio Marchi, Federica Baldassari, Diego L. Medina, Andrea Ballabio, Carlotta Giorgi
HCC1937 is the HCC1937-pcDNA3 cell line, which was derived from a breast cancer with a mutation
 SUPPLEMENTARY INFORMATION Materials and Methods Human cell lines and culture conditions HCC1937 is the HCC1937-pcDNA3 cell line, which was derived from a breast cancer with a mutation in exon 20 of BRCA1
~Lentivirus production~
 ~Lentivirus production~ May 30, 2008 RNAi core R&D group member Lentivirus Production Session Lentivirus!!! Is it health threatening to lab technician? What s so good about this RNAi library? How to produce
Supplemental Materials and Methods Plasmids and viruses Quantitative Reverse Transcription PCR Generation of molecular standard for quantitative PCR
 Supplemental Materials and Methods Plasmids and viruses To generate pseudotyped viruses, the previously described recombinant plasmids pnl4-3-δnef-gfp or pnl4-3-δ6-drgfp and a vector expressing HIV-1 X4
Figure S1. Schematic presentation of genomic replication of idsiv after transfection and infection. After transfection of idsiv plasmid DNA into 293T
 Figure S1. Schematic presentation of genomic replication of idsiv after transfection and infection. After transfection of idsiv plasmid DNA into 293T cells, the RNA genomes with all modifications are generated
Proteomic profiling of small-molecule inhibitors reveals dispensability of MTH1 for cancer cell survival
 Supplementary Information for Proteomic profiling of small-molecule inhibitors reveals dispensability of MTH1 for cancer cell survival Tatsuro Kawamura 1, Makoto Kawatani 1, Makoto Muroi, Yasumitsu Kondoh,
The Schedule and the Manual of Basic Techniques for Cell Culture
 The Schedule and the Manual of Basic Techniques for Cell Culture 1 Materials Calcium Phosphate Transfection Kit: Invitrogen Cat.No.K2780-01 Falcon tube (Cat No.35-2054:12 x 75 mm, 5 ml tube) Cell: 293
SUPPLEMENTARY INFORMATION
 Supplementary Figures Supplementary Figure S1. Binding of full-length OGT and deletion mutants to PIP strips (Echelon Biosciences). Supplementary Figure S2. Binding of the OGT (919-1036) fragments with
Supplementary Figure 1 Role of Raf-1 in TLR2-Dectin-1-mediated cytokine expression
 Supplementary Figure 1 Supplementary Figure 1 Role of Raf-1 in TLR2-Dectin-1-mediated cytokine expression. Quantitative real-time PCR of indicated mrnas in DCs stimulated with TLR2-Dectin-1 agonist zymosan
HEK293FT cells were transiently transfected with reporters, N3-ICD construct and
 Supplementary Information Luciferase reporter assay HEK293FT cells were transiently transfected with reporters, N3-ICD construct and increased amounts of wild type or kinase inactive EGFR. Transfections
Nature Medicine: doi: /nm.4322
 1 2 3 4 5 6 7 8 9 10 11 Supplementary Figure 1. Predicted RNA structure of 3 UTR and sequence alignment of deleted nucleotides. (a) Predicted RNA secondary structure of ZIKV 3 UTR. The stem-loop structure
Hepatitis B Antiviral Drug Development Multi-Marker Screening Assay
 Hepatitis B Antiviral Drug Development Multi-Marker Screening Assay Background ImQuest BioSciences has developed and qualified a single-plate method to expedite the screening of antiviral agents against
Supplementary Figure 1: si-craf but not si-braf sensitizes tumor cells to radiation.
 Supplementary Figure 1: si-craf but not si-braf sensitizes tumor cells to radiation. (a) Embryonic fibroblasts isolated from wildtype (WT), BRAF -/-, or CRAF -/- mice were irradiated (6 Gy) and DNA damage
Supplementary Figure 1 a
 Supplementary Figure a Normalized expression/tbp (A.U.).6... Trip-br transcripts Trans Trans Trans b..5. Trip-br Ctrl LPS Normalized expression/tbp (A.U.) c Trip-br transcripts. adipocytes.... Trans Trans
7.012 Quiz 3 Answers
 MIT Biology Department 7.012: Introductory Biology - Fall 2004 Instructors: Professor Eric Lander, Professor Robert A. Weinberg, Dr. Claudette Gardel Friday 11/12/04 7.012 Quiz 3 Answers A > 85 B 72-84
Recombinant Protein Expression Retroviral system
 Recombinant Protein Expression Retroviral system Viruses Contains genome DNA or RNA Genome encased in a protein coat or capsid. Some viruses have membrane covering protein coat enveloped virus Ø Essential
Supplementary Materials and Methods
 DD2 suppresses tumorigenicity of ovarian cancer cells by limiting cancer stem cell population Chunhua Han et al. Supplementary Materials and Methods Analysis of publicly available datasets: To analyze
Essential Medium, containing 10% fetal bovine serum, 100 U/ml penicillin and 100 µg/ml streptomycin. Huvec were cultured in
 Supplemental data Methods Cell culture media formulations A-431 and U-87 MG cells were maintained in Dulbecco s Modified Eagle s Medium. FaDu cells were cultured in Eagle's Minimum Essential Medium, containing
Phosphate buffered saline (PBS) for washing the cells TE buffer (nuclease-free) ph 7.5 for use with the PrimePCR Reverse Transcription Control Assay
 for washing the cells TE buffer (nuclease-free) ph 7.5 for use with the PrimePCR Reverse Transcription Control Assay") Catalog # Description 172-5080 SingleShot Cell Lysis Kit, 100 x 50 µl reactions 172-5081 SingleShot Cell Lysis Kit, 500 x 50 µl reactions For research purposes only. Introduction The SingleShot Cell Lysis
Catalog # Description 172-5080 SingleShot Cell Lysis Kit, 100 x 50 µl reactions 172-5081 SingleShot Cell Lysis Kit, 500 x 50 µl reactions For research purposes only. Introduction The SingleShot Cell Lysis
Supplementary Data Table of Contents:
 Supplementary Data Table of Contents: - Supplementary Methods - Supplementary Figures S1(A-B) - Supplementary Figures S2 (A-B) - Supplementary Figures S3 - Supplementary Figures S4(A-B) - Supplementary
Sestrin2 and BNIP3 (Bcl-2/adenovirus E1B 19kDa-interacting. protein3) regulate autophagy and mitophagy in renal tubular cells in. acute kidney injury
 regulate autophagy and mitophagy in renal tubular cells in. acute kidney injury") Sestrin2 and BNIP3 (Bcl-2/adenovirus E1B 19kDa-interacting protein3) regulate autophagy and mitophagy in renal tubular cells in acute kidney injury by Masayuki Ishihara 1, Madoka Urushido 2, Kazu Hamada
Sestrin2 and BNIP3 (Bcl-2/adenovirus E1B 19kDa-interacting protein3) regulate autophagy and mitophagy in renal tubular cells in acute kidney injury by Masayuki Ishihara 1, Madoka Urushido 2, Kazu Hamada
SUPPLEMENTARY INFORMATION
 SUPPLEMENTARY INFORMATION FOR Liver X Receptor α mediates hepatic triglyceride accumulation through upregulation of G0/G1 Switch Gene 2 (G0S2) expression I: SUPPLEMENTARY METHODS II: SUPPLEMENTARY FIGURES
Supplementary Materials
 Supplementary Materials 1 Supplementary Table 1. List of primers used for quantitative PCR analysis. Gene name Gene symbol Accession IDs Sequence range Product Primer sequences size (bp) β-actin Actb gi
Supplementary Figures
 Inhibition of Pulmonary Anti Bacterial Defense by IFN γ During Recovery from Influenza Infection By Keer Sun and Dennis W. Metzger Supplementary Figures d a Ly6G Percentage survival f 1 75 5 1 25 1 5 1
Soft Agar Assay. For each cell pool, 100,000 cells were resuspended in 0.35% (w/v)
") SUPPLEMENTARY MATERIAL AND METHODS Soft Agar Assay. For each cell pool, 100,000 cells were resuspended in 0.35% (w/v) top agar (LONZA, SeaKem LE Agarose cat.5004) and plated onto 0.5% (w/v) basal agar.
SUPPLEMENTARY MATERIAL AND METHODS Soft Agar Assay. For each cell pool, 100,000 cells were resuspended in 0.35% (w/v) top agar (LONZA, SeaKem LE Agarose cat.5004) and plated onto 0.5% (w/v) basal agar.
Instructions for Use. APO-AB Annexin V-Biotin Apoptosis Detection Kit 100 tests
 3URGXFW,QIRUPDWLRQ Sigma TACS Annexin V Apoptosis Detection Kits Instructions for Use APO-AB Annexin V-Biotin Apoptosis Detection Kit 100 tests For Research Use Only. Not for use in diagnostic procedures.
Online Data Supplement. Anti-aging Gene Klotho Enhances Glucose-induced Insulin Secretion by Upregulating Plasma Membrane Retention of TRPV2
 Online Data Supplement Anti-aging Gene Klotho Enhances Glucose-induced Insulin Secretion by Upregulating Plasma Membrane Retention of TRPV2 Yi Lin and Zhongjie Sun Department of physiology, college of
Recommended laboratory tests to identify influenza A/H5 virus in specimens from patients with an influenza-like illness
 World Health Organization Recommended laboratory tests to identify influenza A/H5 virus in specimens from patients with an influenza-like illness General information Highly pathogenic avian influenza (HPAI)
Supplementary Information POLO-LIKE KINASE 1 FACILITATES LOSS OF PTEN-INDUCED PROSTATE CANCER FORMATION
 Supplementary Information POLO-LIKE KINASE 1 FACILITATES LOSS OF PTEN-INDUCED PROSTATE CANCER FORMATION X. Shawn Liu 1, 3, Bing Song 2, 3, Bennett D. Elzey 3, 4, Timothy L. Ratliff 3, 4, Stephen F. Konieczny
B16-F10 (Mus musculus skin melanoma), NCI-H460 (human non-small cell lung cancer
, NCI-H460 (human non-small cell lung cancer") Electronic Supplementary Material (ESI) for ChemComm. This journal is The Royal Society of Chemistry 2017 Experimental Methods Cell culture B16-F10 (Mus musculus skin melanoma), NCI-H460 (human non-small
Electronic Supplementary Material (ESI) for ChemComm. This journal is The Royal Society of Chemistry 2017 Experimental Methods Cell culture B16-F10 (Mus musculus skin melanoma), NCI-H460 (human non-small
Supplementary Fig. 1. Identification of acetylation of K68 of SOD2
 Supplementary Fig. 1. Identification of acetylation of K68 of SOD2 A B H. sapiens 54 KHHAAYVNNLNVTEEKYQEALAK 75 M. musculus 54 KHHAAYVNNLNATEEKYHEALAK 75 X. laevis 55 KHHATYVNNLNITEEKYAEALAK 77 D. rerio
HIV-1 p24 ELISA Pair Set Cat#: orb54951 (ELISA Manual)
") HIV-1 p24 ELISA Pair Set Cat#: orb54951 (ELISA Manual) BACKGROUND Human Immunodeficiency Virus ( HIV ) can be divided into two major types, HIV type 1 (HIV-1) and HIV type 2 (HIV-2). HIV-1 is related to
HIV-1 p24 ELISA Pair Set Cat#: orb54951 (ELISA Manual) BACKGROUND Human Immunodeficiency Virus ( HIV ) can be divided into two major types, HIV type 1 (HIV-1) and HIV type 2 (HIV-2). HIV-1 is related to
Phylogenetic analysis of human and chicken importins. Only five of six importins were studied because
 Supplementary Figure S1 Phylogenetic analysis of human and chicken importins. Only five of six importins were studied because importin-α6 was shown to be testis-specific. Human and chicken importin protein
BHP 2-7 and Nthy-ori 3-1 cells were grown in RPMI1640 medium (Hyclone) supplemented with 10% fetal bovine serum (Gibco), 2mM L-glutamine, and 100 U/mL
 supplemented with 10% fetal bovine serum (Gibco), 2mM L-glutamine, and 100 U/mL") 1 2 3 4 Materials and Methods Cell culture BHP 2-7 and Nthy-ori 3-1 cells were grown in RPMI1640 medium (Hyclone) 5 supplemented with 10% fetal bovine serum (Gibco), 2mM L-glutamine, and 100 U/mL 6 penicillin-streptomycin.
1 2 3 4 Materials and Methods Cell culture BHP 2-7 and Nthy-ori 3-1 cells were grown in RPMI1640 medium (Hyclone) 5 supplemented with 10% fetal bovine serum (Gibco), 2mM L-glutamine, and 100 U/mL 6 penicillin-streptomycin.
Supplementary Figures
 Supplementary Figures Supplementary Figure 1. H3F3B expression in lung cancer. a. Comparison of H3F3B expression in relapsed and non-relapsed lung cancer patients. b. Prognosis of two groups of lung cancer
PBMC from each patient were suspended in AIM V medium (Invitrogen) with 5% human
 with 5% human") Anti-CD19-CAR transduced T-cell preparation PBMC from each patient were suspended in AIM V medium (Invitrogen) with 5% human AB serum (Gemini) and 300 international units/ml IL-2 (Novartis). T cell proliferation
Anti-CD19-CAR transduced T-cell preparation PBMC from each patient were suspended in AIM V medium (Invitrogen) with 5% human AB serum (Gemini) and 300 international units/ml IL-2 (Novartis). T cell proliferation
Supplemental Data Figure S1 Effect of TS2/4 and R6.5 antibodies on the kinetics of CD16.NK-92-mediated specific lysis of SKBR-3 target cells.
 Supplemental Data Figure S1. Effect of TS2/4 and R6.5 antibodies on the kinetics of CD16.NK-92-mediated specific lysis of SKBR-3 target cells. (A) Specific lysis of IFN-γ-treated SKBR-3 cells in the absence
T H E J O U R N A L O F C E L L B I O L O G Y
 Supplemental material Edens and Levy, http://www.jcb.org/cgi/content/full/jcb.201406004/dc1 T H E J O U R N A L O F C E L L B I O L O G Y Figure S1. Nuclear shrinking does not depend on the cytoskeleton
Supplemental information contains 7 movies and 4 supplemental Figures
 1 2 3 4 5 6 7 8 9 10 11 12 13 14 15 16 17 18 19 20 21 22 23 24 25 26 27 Supplemental information contains 7 movies and 4 supplemental Figures Movies: Movie 1. Single virus tracking of A4-mCherry-WR MV
Porcine reproductive and respiratory syndrome virus utilizes nanotubes for intercellular spread
 JVI Accepted Manuscript Posted Online 16 March 2016 J. Virol. doi:10.1128/jvi.00036-16 Copyright 2016, American Society for Microbiology. All Rights Reserved. 1 Porcine reproductive and respiratory syndrome
Supplemental Information. Otic Mesenchyme Cells Regulate. Spiral Ganglion Axon Fasciculation. through a Pou3f4/EphA4 Signaling Pathway
 Neuron, Volume 73 Supplemental Information Otic Mesenchyme Cells Regulate Spiral Ganglion Axon Fasciculation through a Pou3f4/EphA4 Signaling Pathway Thomas M. Coate, Steven Raft, Xiumei Zhao, Aimee K.
Data Sheet TIGIT / NFAT Reporter - Jurkat Cell Line Catalog #60538
 Data Sheet TIGIT / NFAT Reporter - Jurkat Cell Line Catalog #60538 Background: TIGIT is a co-inhibitory receptor that is highly expressed in Natural Killer (NK) cells, activated CD4+, CD8+ and regulatory
Supplementary Table; Supplementary Figures and legends S1-S21; Supplementary Materials and Methods
 Silva et al. PTEN posttranslational inactivation and hyperactivation of the PI3K/Akt pathway sustain primary T cell leukemia viability Supplementary Table; Supplementary Figures and legends S1-S21; Supplementary
Nature Structural & Molecular Biology: doi: /nsmb Supplementary Figure 1
 Supplementary Figure 1 U1 inhibition causes a shift of RNA-seq reads from exons to introns. (a) Evidence for the high purity of 4-shU-labeled RNAs used for RNA-seq. HeLa cells transfected with control
Serafino et al. Thymosin α1 activates complement receptor-mediated phagocytosis in human monocyte-derived macrophages. SUPPLEMENTARY FIGURES
 Supplementary Fig. S1. Evaluation of the purity and maturation of macrophage cultures tested by flow cytometry. The lymphocytic/monocytic cellular fraction was isolated from buffy coats of healthy donors
TSH Receptor Monoclonal Antibody (49) Catalog Number MA3-218 Product data sheet
 Catalog Number MA3-218 Product data sheet") Website: thermofisher.com Customer Service (US): 1 800 955 6288 ext. 1 Technical Support (US): 1 800 955 6288 ext. 441 TSH Receptor Monoclonal Antibody (49) Catalog Number MA3-218 Product data sheet Details
Website: thermofisher.com Customer Service (US): 1 800 955 6288 ext. 1 Technical Support (US): 1 800 955 6288 ext. 441 TSH Receptor Monoclonal Antibody (49) Catalog Number MA3-218 Product data sheet Details
Supplemental Materials. STK16 regulates actin dynamics to control Golgi organization and cell cycle
 Supplemental Materials STK16 regulates actin dynamics to control Golgi organization and cell cycle Juanjuan Liu 1,2,3, Xingxing Yang 1,3, Binhua Li 1, Junjun Wang 1,2, Wenchao Wang 1, Jing Liu 1, Qingsong
PRODUCT INFORMATION & MANUAL
 PRODUCT INFORMATION & MANUAL 0.4 micron for Overall Exosome Isolation (Cell Media) NBP2-49826 For research use only. Not for diagnostic or therapeutic procedures. www.novusbio.com - P: 303.730.1950 - P:
Impact of hyper-o-glcnacylation on apoptosis and NF-κB activity SUPPLEMENTARY METHODS
 SUPPLEMENTARY METHODS 3D culture and cell proliferation- MiaPaCa-2 cell culture in 3D was performed as described previously (1). Briefly, 8-well glass chamber slides were evenly coated with 50 µl/well
NF-κB p65 (Phospho-Thr254)
") Assay Biotechnology Company www.assaybiotech.com Tel: 1-877-883-7988 Fax: 1-877-610-9758 NF-κB p65 (Phospho-Thr254) Colorimetric Cell-Based ELISA Kit Catalog #: OKAG02015 Please read the provided manual
Assay Biotechnology Company www.assaybiotech.com Tel: 1-877-883-7988 Fax: 1-877-610-9758 NF-κB p65 (Phospho-Thr254) Colorimetric Cell-Based ELISA Kit Catalog #: OKAG02015 Please read the provided manual
Supplementary Figure 1. mrna targets were found in exosomes and absent in free-floating supernatant. Serum exosomes and exosome-free supernatant were
 Supplementary Figure 1. mrna targets were found in exosomes and absent in free-floating supernatant. Serum exosomes and exosome-free supernatant were separated via ultracentrifugation and lysed to analyze
Gladstone Institutes, University of California (UCSF), San Francisco, USA
, San Francisco, USA") Fluorescence-linked Antigen Quantification (FLAQ) Assay for Fast Quantification of HIV-1 p24 Gag Marianne Gesner, Mekhala Maiti, Robert Grant and Marielle Cavrois * Gladstone Institutes, University of
Fluorescence-linked Antigen Quantification (FLAQ) Assay for Fast Quantification of HIV-1 p24 Gag Marianne Gesner, Mekhala Maiti, Robert Grant and Marielle Cavrois * Gladstone Institutes, University of
Supplementary Figure S1. Venn diagram analysis of mrna microarray data and mirna target analysis. (a) Western blot analysis of T lymphoblasts (CLS)
 Western blot analysis of T lymphoblasts (CLS)") Supplementary Figure S1. Venn diagram analysis of mrna microarray data and mirna target analysis. (a) Western blot analysis of T lymphoblasts (CLS) and their exosomes (EXO) in resting (REST) and activated
Supplementary Figure S1. Venn diagram analysis of mrna microarray data and mirna target analysis. (a) Western blot analysis of T lymphoblasts (CLS) and their exosomes (EXO) in resting (REST) and activated
Supplemental Materials Molecular Biology of the Cell
 Supplemental Materials Molecular Biology of the Cell Gilberti et al. SUPPLEMENTAL FIGURE LEGENDS: Figure S1: The effect of pharmacological inhibitors on particle uptake. The data presented in Figure 1
Hepatitis C in Australia:
 Hepatitis C in Australia: Epidemiology and Clinical Presentation (and a bit of virology ) A/Prof Mark Douglas Hepatitis C - Distribution Te and Jensen 2010 Clin Liver Dis Hepatitis C Epidemiology Estimated
Supplementary Information
 Supplementary Information Supplementary Figure 1. EBV-gB 23-431 mainly exists as trimer in HEK 293FT cells. (a) Western blotting analysis for DSS crosslinked FLAG-gB 23-431. HEK 293FT cells transfected
Supplementary information. MARCH8 inhibits HIV-1 infection by reducing virion incorporation of envelope glycoproteins
 Supplementary information inhibits HIV-1 infection by reducing virion incorporation of envelope glycoproteins Takuya Tada, Yanzhao Zhang, Takayoshi Koyama, Minoru Tobiume, Yasuko Tsunetsugu-Yokota, Shoji
Ali Alabbadi. Bann. Bann. Dr. Belal
 31 Ali Alabbadi Bann Bann Dr. Belal Topics to be discussed in this sheet: Particles-to-PFU Single-step and multi-step growth cycles Multiplicity of infection (MOI) Physical measurements of virus particles
BacPAK Baculovirus Rapid Titer Kit
 BacPAK Baculovirus Rapid Titer Kit United States/Canada 800.662.2566 Asia Pacific +1.650.919.7300 Europe +33.(0)1.3904.6880 Japan +81.(0)77.543.6116 Cat. No. 631406 PT3153-1 (072213) Clontech Laboratories,
Figure S1. PMVs from THP-1 cells expose phosphatidylserine and carry actin. A) Flow
 Flow") SUPPLEMENTARY DATA Supplementary Figure Legends Figure S1. PMVs from THP-1 cells expose phosphatidylserine and carry actin. A) Flow cytometry analysis of PMVs labelled with annexin-v-pe (Guava technologies)
SUPPLEMENTARY DATA Supplementary Figure Legends Figure S1. PMVs from THP-1 cells expose phosphatidylserine and carry actin. A) Flow cytometry analysis of PMVs labelled with annexin-v-pe (Guava technologies)
SUPPLEMENTAL INFORMATION
 SUPPLEMENTAL INFORMATION EXPERIMENTAL PROCEDURES Tryptic digestion protection experiments - PCSK9 with Ab-3D5 (1:1 molar ratio) in 50 mm Tris, ph 8.0, 150 mm NaCl was incubated overnight at 4 o C. The
Figure S1. Generation of inducible PTEN deficient mice and the BMMCs (A) B6.129 Pten loxp/loxp mice were mated with B6.
 B6.129 Pten loxp/loxp mice were mated with B6.") Figure S1. Generation of inducible PTEN deficient mice and the BMMCs (A) B6.129 Pten loxp/loxp mice were mated with B6.129-Gt(ROSA)26Sor tm1(cre/ert2)tyj /J mice. To induce deletion of the Pten locus,
Figure S1. Generation of inducible PTEN deficient mice and the BMMCs (A) B6.129 Pten loxp/loxp mice were mated with B6.129-Gt(ROSA)26Sor tm1(cre/ert2)tyj /J mice. To induce deletion of the Pten locus,
Supplementary Table 2. Conserved regulatory elements in the promoters of CD36.
 Supplementary Table 1. RT-qPCR primers for CD3, PPARg and CEBP. Assay Forward Primer Reverse Primer 1A CAT TTG TGG CCT TGT GCT CTT TGA TGA GTC ACA GAA AGA ATC AAT TC 1B AGG AAA TGA ACT GAT GAG TCA CAG
A Hepatocyte Growth Factor Receptor (Met) Insulin Receptor hybrid governs hepatic glucose metabolism SUPPLEMENTARY FIGURES, LEGENDS AND METHODS
 Insulin Receptor hybrid governs hepatic glucose metabolism SUPPLEMENTARY FIGURES, LEGENDS AND METHODS") A Hepatocyte Growth Factor Receptor (Met) Insulin Receptor hybrid governs hepatic glucose metabolism Arlee Fafalios, Jihong Ma, Xinping Tan, John Stoops, Jianhua Luo, Marie C. DeFrances and Reza Zarnegar
A Hepatocyte Growth Factor Receptor (Met) Insulin Receptor hybrid governs hepatic glucose metabolism Arlee Fafalios, Jihong Ma, Xinping Tan, John Stoops, Jianhua Luo, Marie C. DeFrances and Reza Zarnegar
ab CytoPainter Golgi/ER Staining Kit
 ab139485 CytoPainter Golgi/ER Staining Kit Instructions for Use Designed to detect Golgi bodies and endoplasmic reticulum by microscopy This product is for research use only and is not intended for diagnostic
Serum Amyloid A3 Gene Expression in Adipocytes is an Indicator. of the Interaction with Macrophages
 Serum Amyloid A3 Gene Expression in Adipocytes is an Indicator of the Interaction with Macrophages Yohei Sanada, Takafumi Yamamoto, Rika Satake, Akiko Yamashita, Sumire Kanai, Norihisa Kato, Fons AJ van
p47 negatively regulates IKK activation by inducing the lysosomal degradation of polyubiquitinated NEMO
 Supplementary Information p47 negatively regulates IKK activation by inducing the lysosomal degradation of polyubiquitinated NEMO Yuri Shibata, Masaaki Oyama, Hiroko Kozuka-Hata, Xiao Han, Yuetsu Tanaka,
Constitutive Reporter Lentiviral Vectors Expressing Fluorescent Proteins
 Constitutive Reporter Lentiviral Vectors Expressing Fluorescent Proteins www.vectalys.com/products/ Constitutive Reporter Lentiviral Vectors Catalog Number referring to this User Manual: 0008VCT; 0009VCT;
Supplementary Materials and Methods
 Supplementary Materials and Methods Reagents and antibodies was purchased from iaffin GmbH & Co KG. Cisplatin (ristol-myers Squibb Co.) and etoposide (Sandoz Pharma Ltd.) were used. Antibodies recognizing
Supplemental Figures: Supplemental Figure 1
 Supplemental Figures: Supplemental Figure 1 Suppl. Figure 1. BM-DC infection with H. pylori does not induce cytotoxicity and treatment of BM-DCs with H. pylori sonicate, but not heat-inactivated bacteria,