Supplementary Materials and Methods
|
|
|
- Emery Wilkerson
- 6 years ago
- Views:
Transcription
1 Supplementary Materials and Methods Reagents and antibodies was purchased from iaffin GmbH & Co KG. Cisplatin (ristol-myers Squibb Co.) and etoposide (Sandoz Pharma Ltd.) were used. Antibodies recognizing EGFR, GFP, cleaved caspase-9, myc-tag and p14 ARF were purchased from Sigma-Aldrich Corp. Antibodies against p21 Cip1, -tubulin, histone H3, phosho-foxo3a (Ser253) and cleaved caspase-3 were purchased from Cell Signaling Technology, Inc. Anti-HSP60 antibody (Santa Cruz iotechnology, Inc.), anti- -actin antibody (Chemicon, Inc.), anti-p16 INK4a antibody (Epitomics, Inc.) and anti-p53 antibody (DO-1, Santa Cruz iotechnology, Inc.) were used. For secondary antibodies, HRP-conjugated anti-mouse IgG, anti-rabbit IgG, anti-goat IgG and Cy3-conjugated anti-goat IgG were purchased from Zymed Laboratories, Inc. FITC-conjugated anti-mouse IgG (Jackson ImmunoResearch Laboratories, Inc.) and Alexa 488-conjugated anti-mouse IgG (Invitrogen Life Technologies Corp.) were used. The p14 ARF and other HPLC grade peptides were synthesized by Sigma-Aldrich Corp. Plasmid construction and transfection cdna was prepared from normal human dermal fibroblasts (NHDF) cells using an RNeasy kit (Qiagen) and a Super Script III kit (Invitrogen Life Technologies Corp.). Human p14 ARF CDS (NM_ ) was amplified from NHDF cdna and cloned into pluescript SK + vector. To generate the MTS-p14 ARF wild type and mutant plasmid, p14 ARF genes were subcloned into a pcmv/myc/mito vector (Invitrogen Life Technologies Corp.) at the NotI single sites or XhoI - NotI sites. For p14 ARF -NLS plasmid, p14 ARF genes were subcloned into a pef/myc/nuc vector (Invitrogen Life Technologies Corp.) at the NotI sites. MTS-GFP-p14 ARF and GFP-p14 ARF -NLS plasmid were generated by cloning the p14 ARF coding region into the pcmv/myc/mito/gfp and pef/myc/nuc/gfp vector (Invitrogen Life Technologies Corp.) in the NotI sites. For GFP-p14 ARF plasmid, GFP and p14 ARF genes were subcloned into pcdna4 His-MaxA plasmid at PstI - NotI sites. Cells were transiently transfected with p14 ARF plasmids using Lipofectamine LTX and Lipofectamine Plus reagents (Invitrogen Life 1
2 Technologies Corp.) according to the manufacturer s instructions. Small interference RNA The p14 ARF sirna oligonucleotides were synthesized by Sigma-Aldrich Corp. The sequence of sirnas were as follows: p14 ARF sense GAACAUGGUGCGCAGGUUC(d TdT), p14 ARF antisense GAACCUGCGCACCAUGUUC(dTdT). The sigenome SMARTpool for EGFR sirna and the ON-TARGETpuls Non-Targeting Pool for control sirna were purchased from Thermo Scientific Dharmacon, Inc. Cells were cultured in 12-well plates and were transfected with sirnas using LipofectAMINE RNAi Max (Invitrogen Life Technologies Corp.) according to manufacturer s instructions. Immunoblotting Cells were lysed with 20 l of 2 SDS sample buffer (250 mm Tris / HCl ph 6.8, 4% SDS, 20% glycerol, 10% -ME, 1% bromophenol blue), and harvested and sonicated. After boiling for 2 min, proteins were resolved on 15% SDS-polyacrylamide gels and blotted onto PVDF membranes. Nonspecific binding sites were blocked with 5% skim milk powder in TST (50 mm Tris/HCl ph 7.2, 140 mm NaCl, 5% Tween-20) for 1 h. The primary antibodies in 5% skim milk/tst were added and incubated overnight at 4 C. Next, PVDF membranes were washed three times for 10 min each with TST. lots were incubated for 1 h with secondary antibodies conjugated with HRP in 5% skim milk/tst, and then washed three times for 10 min with TST. Chemiluminescence signals were detected by Super Signal West pico reagent (Thermo Scientific, Inc.) and x-ray film using X-OMAT 2000 processor (Kodak, Ltd.). Cell cycle analysis pfucci-g1-orange and pfucci-s/g2/m-green plasmids (ML International Corp.) were co-transfected into and cells. Cells were synchronized by nocodazole (0.4 g/ml, Sigma-Aldrich Corp.) for 12 h. After washing with medium, gefitinib (1 mol/l) was added to cells and cells were cultured for 22 h. The cell cycle phase-specific fluorescence protein was examined by fluorescence microscopy (Olympus, Inc.). 2
3 For flow cytometric analysis, cells were treated with gefitinib (1 mol/l) for 24 h and were washed with PS. The cells were resuspended in 10 g/ml propidium iodide solution. DNA content was analyzed using FACScan and Cell Quest software (ecton Dickinson, Inc.). 3
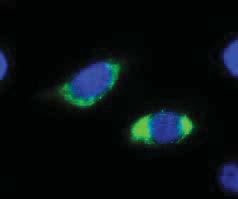
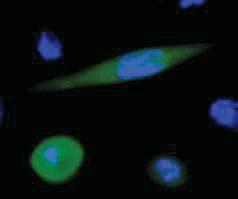
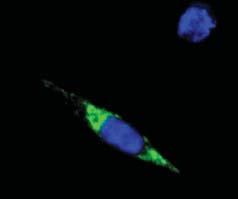
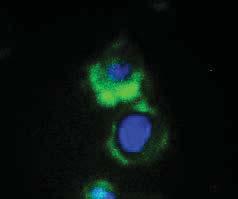
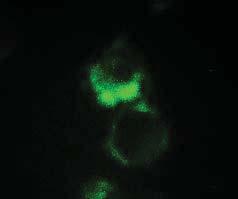
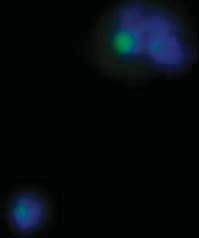
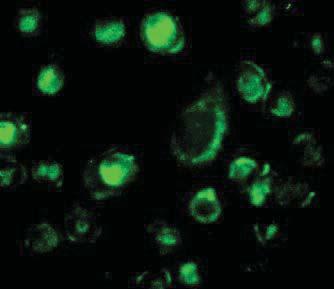
4 Supplementary Figure Legends Figure S1. Cell cycle regulation and gene expression by gefitinib in the NSCLC cells. A, the cell growth of gefitinib-sensitive cell lines (:, HCC827: ) and gefitinib-resistant cell lines (:, H1975: ) was measured after 72 h of treatment at the indicated gefitinib concentration. Cell growth of each line was assessed by evaluating absorbance at 450 nm using WST-8 reagent. The ratio of the viable cells in each line is shown relative to untreated controls., cells were treated with gefitinib for 24 h. The expression of cell cycle specific fluorescent protein is indicated. Scale bar = 100 m. C, cells were treated with gefitinib (1 mol/l) for 24 h. PI fluorescence of nuclei was analyzed by FACScan flow cytometer. D, CDKN1A (white bar) and CDKN2A (black bar) mrna levels were analyzed by qpcr. and cells were treated with gefitinib (1 mol/l) for the indicated times. The mrna levels were corrected for differences in 18S rrna. The values are represented as the ratio of untreated controls. Results are presented as means ± SD (n=3, *p<5). Figure S2. p16 INK4a and p14 ARF expressions in response to gefitinib. A, and cells were treated with or without gefitinib for 48 hours. The mrna levels of CDKN2A isoforms were detected by qpcr. and C, p14 ARF () and p16 INK4a (C) mrna levels were measured by qpcr. The mrna levels were corrected for differences in 18S rrna. The values are represented as the ratio of untreated controls. Results are presented as means ± SD (n=3, *p<5). D, after treatment with gefitinib for the indicated times, endogenous p14 ARF, p16 INK4a and p21 Cip1 (CDKN1A) expression were detected by western blot using anti-p14 ARF antibody. E, HCC827 and H1975 cells were stained with anti-p14 ARF and anti-hsp60 antibodies. The localization of endogenous proteins was examined by fluorescence microscopy. Nuclei were stained with Hoechst Scale bar = 10 m. Figure S3. Regulation of p14 ARF by chemotherapetic drugs 4
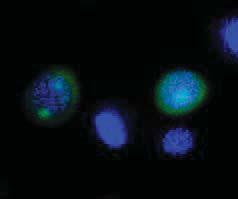
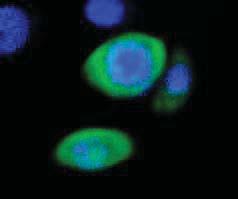
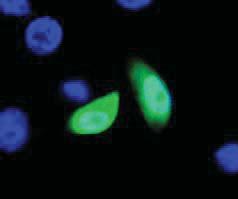
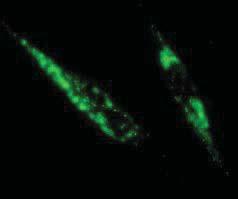
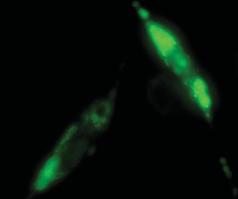
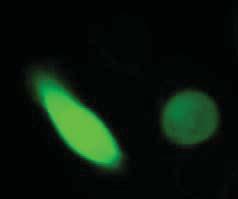
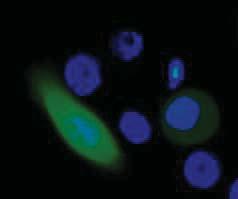
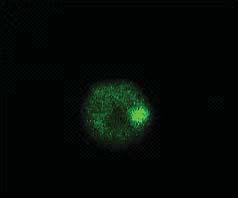
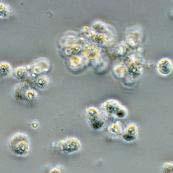
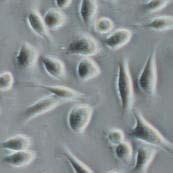
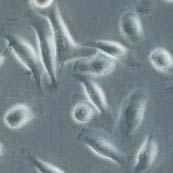
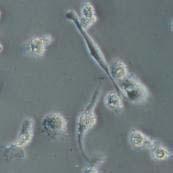
5 , (black bar) and (white bar) cells were treated with gefitinib (1 mol/l), cisplatin (8 mol/l) and etoposide (; 20 mol/l, ; 5 mol/l) for 48 hours. Cell growth was measured by WST-8 reagent and the ratio of viable cells is shown relative to untreated controls (no drug). Results are presented as means ± SD (n=3, *p<5)., s were analyzed by qpcr. (black bar) and (white bar) cells were treated with gefitinib, cisplatin and etoposide for 48 hours. The mrna levels were corrected for differences in 18S rrna. The values are represented as the ratio of untreated controls (no drug). Results are presented as means ± SD (n=3, *p<5). C, EGFR sirna (30 nmol/l) was transfected into and cells. EGFR expression was detected by western blot using anti-egfr antibody. D, cells were knocked down by sirna against EGFR. The s were measured by qpcr. Results are presented as means ± S.D. (n=3, *p<5). lack and white bars represent or cells, respectively. Figure S4. Mutations of p16 INK4a, p14 ARF and p53 in the NSCLC cells. A, p16 INK4a and p14 ARF exon sequences were analyzed using,, HCC827 and H1975 genomes. Alterations in the nucleotides (top panel) are indicated by the arrow. Mutation sites are summarized in the lower panel. No mutations were observed in HCC827 cells., p53 mutations were analyzed by genomic sequence. Changes in nucleotides and protein are indicated by the arrow. C, cells with gefitinib treatment were stained with anti-p53 and anti-hsp60 antibodies. Localization of proteins was examined by fluorescent microscopy. Nuclei were stained with Hoechst Scale bar = 10 m. Figure S5. Subcellular localization of the truncated GFP-p14 ARF fusion proteins. and cells expressing GFP-p14 ARF (A) or MTS-GFP-p14 ARF () mutants were cultured for 24 h. Subcellular localization of each construct was visualized by fluorescent microscopy. Nuclei were stained with Hoechst Empty indicates empty vector containing GFP or MTS-GFP, respectively. Scale bar = 10 m. Figure S6. Growth suppression of the tumor cells by various anti-tumor peptides. A, sequences of peptides were used in this study. Nine residues of D-arginine (r) were 5
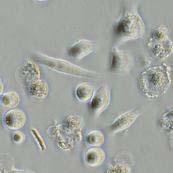
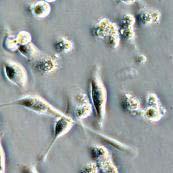
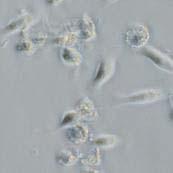
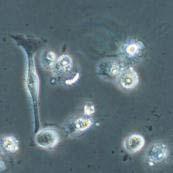
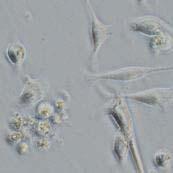
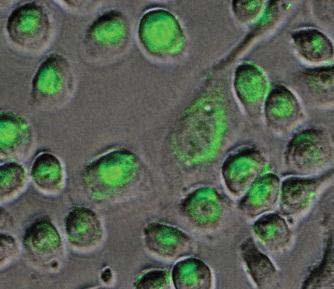
6 fused to all peptides to produce cell penetrating peptides. GPG sequence was used as a spacer., fluorescent microscopy analysis of living cells incubated with the FITC-labeled peptides at 37 C for 14 h. Scale bar = 10 m. C, growth inhibition is indicated by morphology of cells after 24 h of peptide treatment. Scale bar = 20 m. D, and cells were treated with peptide (20 mol/l) for 48 h at 37 C. Cell growth was measured by WST-8 reagent. The ratio of viable cells is shown relative to non-treated cells (pep ). Results are presented as means ± SD (n=3, *p<5). Figure S7. Immunohistochemistry of p14 ARF and p53 in the NSCLC tissues. p14 ARF and p53 expression were detected in NSCLC tissues using anti-p14 ARF and anti-p53 (DO-1) antibodies. NSCLC have gefitinib-sensitive EGFR mutations (A) and gefitinib-resistant EGFR mutations (). Three cases of the NSCLC were used. Scale bar = 50 m. 6


 Gefitnib (+), (-),")


 CDKN2A mrna level")
7 Relative cell growth (μmol/l) Relative cell growth HCC827 H (μmol/l) (-) Gefitnib (+) G1 orange SG2M green Phase C, (-), (+) Sub-G1 : 4 % G1/G0 : 44 S : G2/M : Sub-G1 : 7.28 % G1/G0 : S : 16 G2/M : (-) Gefitnib (+), (-), (+) Sub-G1 : 9 % G1/G0 : S : 21 G2/M : 35 Sub-G1 : 4.72 % G1/G0 : 51 S : G2/M : G1 G1/S S, G2, M D CDKN1A mrna level (h) CDKN1A mrna level (h) CDKN2A mrna level 2.5 * (h) CDKN2A mrna level (h) Supplementary Figure S1


 0 24 48 0 24 48 (h) 20 15 20 p14 ARF 15")
 20 15 p14 ARF 20 15 p16 INK4a HSP60")
")
8 M (bp) p16 p12 p14 variant2 ARF : p16 INK4a M (bp) p16 p12 p14 variant2 ARF : p16 INK4a HCC827 * * H1975 C p16 INK4a mrna level p16 INK4a mrna level p16 INK4a mrna level HCC827 p16 INK4a mrna level H1975 D E HCC827 H1975 M (kda) (h) p14 ARF 15 p16 INK4a HCC827 H1975 M (kda) (h) p14 ARF p16 INK4a HSP60 p14 ARF p21 Cip1 -Actin p21 Cip1 -Actin Merge (+ Hoechst) Supplementary Figure S2

9 Relative cell growth * Relative cell growth 1.2 * * No drug Cisplatin Etoposide No drug Cisplatin Etoposide No drug Cisplatin Etoposide No drug Cisplatin Etoposide C D M (kda) 210 si Control si EGFR si Control si EGFR EGFR 3.5 * * Actin si Control si EGFR si Control si EGFR Supplementary Figure S3
 G")


 Arg 81 Arg")
 HCC827 p16 INK4a No")

 p14 ARF")
")
 G HSP60")
 CAG")

10 (Exon2) G CDKN2A (Exon2) G H1975 CDKN2A (Exon2) G TGCTCCACGTCGCGGAGCC TGCTCCACGTCGCGGAGCC TGCTCCACGGCGCGTAGCC Cell line Gene Mutation Amino acid p16 INK4a GGC GTC (Exon2) Gly 67 Val p14 ARF CGG CGT (Exon2) Arg 81 Arg (silent) p16 INK4a GGC GTC (Exon2) Gly 67 Val p14 ARF CGG CGT (Exon2) Arg 81 Arg (silent) HCC827 p16 INK4a No mutation wild type p14 ARF No mutation wild type H1975 p16 INK4a GAG TAG (Exon2) Glu 69 Amber (stop) p14 ARF GGA GTA (Exon2) Gly 83 Val G GGCATGAACCAGAGGCCCA C (+) (+) p53 p53 : CGG (Arg 248 ) CAG (Gln) G HSP60 GGCATGAACCAGAGGCCCA Hoechst p53 : CGG (Arg 248 ) CAG (Gln) Supplementary Figure S4


11 GFP GFP + Hoechst GFP GFP + Hoechst empty empty WT WT GFP-p14 ARF ( cells) MTS-GFP-p14 ARF ( cells) empty empty WT WT GFP-p14 ARF ( cells) MTS-GFP-p14 ARF ( cells) Supplementary Figure S5


12 Peptide r9 rrrrrrrrr Sequence FITC-r9-p FITC-r9-p phase p14-1c p p p16-mis r9-gpg-rrflvtlrirracgpprvrvfvvhipr r9-gpg-apaavalvlmll r9-gpg-apaavalvlmllrsqrlgqqplprrpg r9-gpg-fldtlvvlhr p21-s153a r9-gpg-hakrrlif Smac r9-gpg-avpiaqk ( r ; D-Arg ) C D pep (-) r9 p21-s153a 1.2 p14-1c p p16-mis Relative cell growth pep (-) r9 p14-1c p p p16-mis p21-s153a Smac pep (-) r9 p21-s153a 1.2 Relative cell growth pep (-) r9 p14-1c p p p16-mis p21-s153a Smac p14-1c p p16-mis Supplementary Figure S6


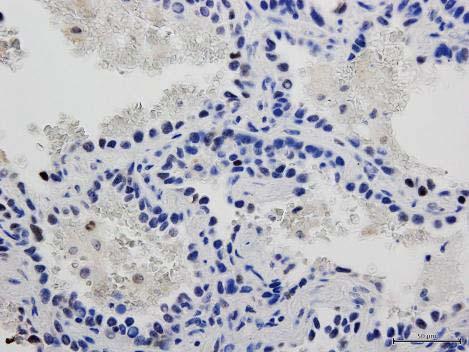
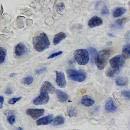
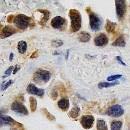
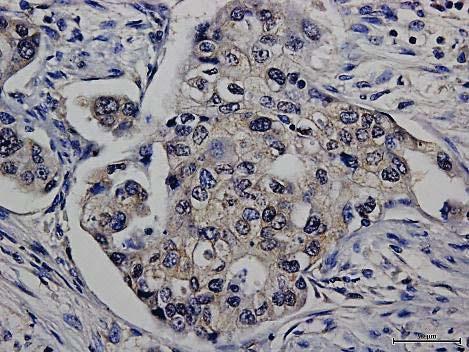
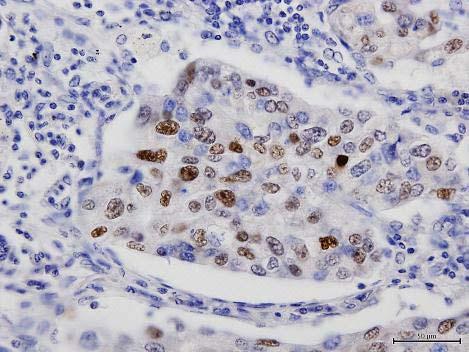
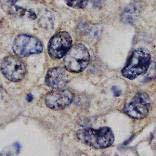
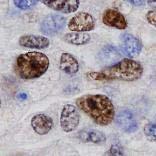
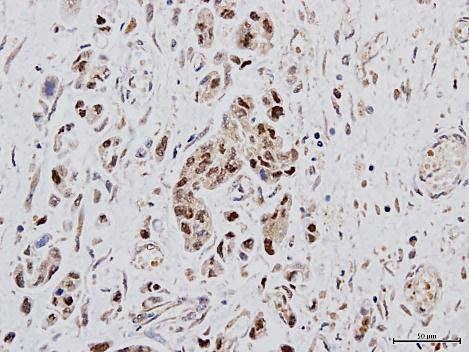
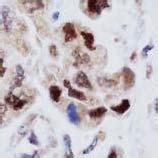
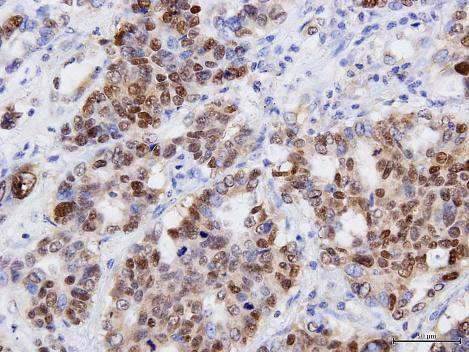
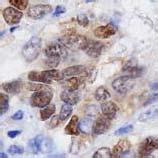
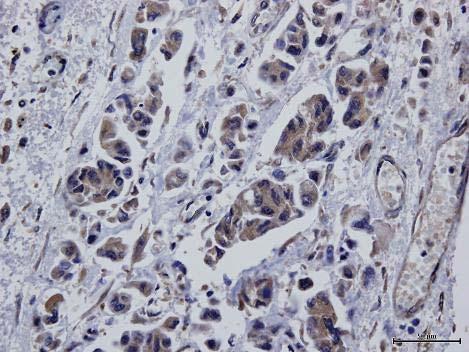
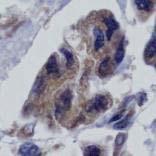
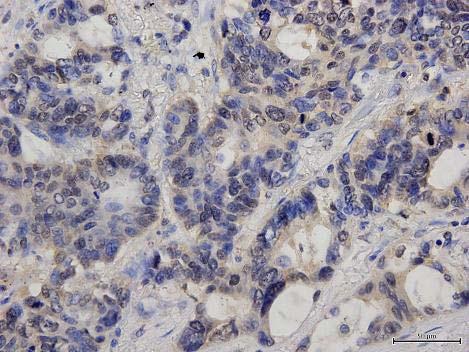
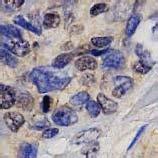
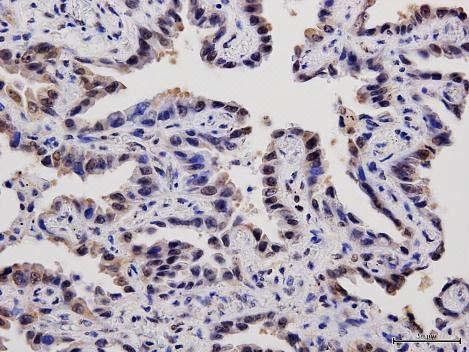
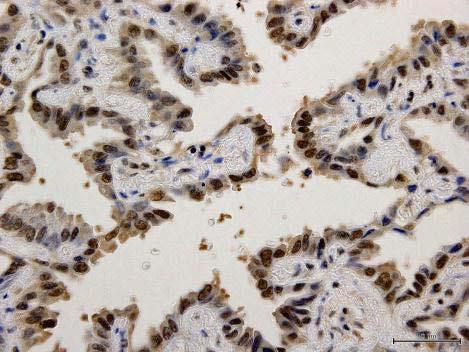
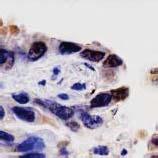
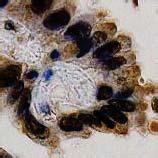
13 Ex19 EGFR L858R EGFR L858R EGFR p53 p14 ARF T790M EGFR T790M EGFR D761Y EGFR p53 p14 ARF Supplementary Figure S7
HCC1937 is the HCC1937-pcDNA3 cell line, which was derived from a breast cancer with a mutation
 SUPPLEMENTARY INFORMATION Materials and Methods Human cell lines and culture conditions HCC1937 is the HCC1937-pcDNA3 cell line, which was derived from a breast cancer with a mutation in exon 20 of BRCA1
Supplementary Information POLO-LIKE KINASE 1 FACILITATES LOSS OF PTEN-INDUCED PROSTATE CANCER FORMATION
 Supplementary Information POLO-LIKE KINASE 1 FACILITATES LOSS OF PTEN-INDUCED PROSTATE CANCER FORMATION X. Shawn Liu 1, 3, Bing Song 2, 3, Bennett D. Elzey 3, 4, Timothy L. Ratliff 3, 4, Stephen F. Konieczny
MicroRNA sponges: competitive inhibitors of small RNAs in mammalian cells
 MicroRNA sponges: competitive inhibitors of small RNAs in mammalian cells Margaret S Ebert, Joel R Neilson & Phillip A Sharp Supplementary figures and text: Supplementary Figure 1. Effect of sponges on
Supplementary Figure 1: si-craf but not si-braf sensitizes tumor cells to radiation.
 Supplementary Figure 1: si-craf but not si-braf sensitizes tumor cells to radiation. (a) Embryonic fibroblasts isolated from wildtype (WT), BRAF -/-, or CRAF -/- mice were irradiated (6 Gy) and DNA damage
Supplementary Figure S1. Venn diagram analysis of mrna microarray data and mirna target analysis. (a) Western blot analysis of T lymphoblasts (CLS)
 Western blot analysis of T lymphoblasts (CLS)") Supplementary Figure S1. Venn diagram analysis of mrna microarray data and mirna target analysis. (a) Western blot analysis of T lymphoblasts (CLS) and their exosomes (EXO) in resting (REST) and activated
Supplementary Figure S1. Venn diagram analysis of mrna microarray data and mirna target analysis. (a) Western blot analysis of T lymphoblasts (CLS) and their exosomes (EXO) in resting (REST) and activated
Effects of UBL5 knockdown on cell cycle distribution and sister chromatid cohesion
 Supplementary Figure S1. Effects of UBL5 knockdown on cell cycle distribution and sister chromatid cohesion A. Representative examples of flow cytometry profiles of HeLa cells transfected with indicated
HEK293FT cells were transiently transfected with reporters, N3-ICD construct and
 Supplementary Information Luciferase reporter assay HEK293FT cells were transiently transfected with reporters, N3-ICD construct and increased amounts of wild type or kinase inactive EGFR. Transfections
Soft Agar Assay. For each cell pool, 100,000 cells were resuspended in 0.35% (w/v)
") SUPPLEMENTARY MATERIAL AND METHODS Soft Agar Assay. For each cell pool, 100,000 cells were resuspended in 0.35% (w/v) top agar (LONZA, SeaKem LE Agarose cat.5004) and plated onto 0.5% (w/v) basal agar.
SUPPLEMENTARY MATERIAL AND METHODS Soft Agar Assay. For each cell pool, 100,000 cells were resuspended in 0.35% (w/v) top agar (LONZA, SeaKem LE Agarose cat.5004) and plated onto 0.5% (w/v) basal agar.
EGFR shrna A: CCGGCGCAAGTGTAAGAAGTGCGAACTCGAGTTCGCACTTCTTACACTTGCG TTTTTG. EGFR shrna B: CCGGAGAATGTGGAATACCTAAGGCTCGAGCCTTAGGTATTCCACATTCTCTT TTTG
 Supplementary Methods Sequence of oligonucleotides used for shrna targeting EGFR EGFR shrna were obtained from the Harvard RNAi consortium. The following oligonucleotides (forward primer) were used to
T H E J O U R N A L O F C E L L B I O L O G Y
 T H E J O U R N A L O F C E L L B I O L O G Y Supplemental material Krenn et al., http://www.jcb.org/cgi/content/full/jcb.201110013/dc1 Figure S1. Levels of expressed proteins and demonstration that C-terminal
Supplementary Information
 Supplementary Information Supplementary Figure 1. CD4 + T cell activation and lack of apoptosis after crosslinking with anti-cd3 + anti-cd28 + anti-cd160. (a) Flow cytometry of anti-cd160 (5D.10A11) binding
Protocol for Gene Transfection & Western Blotting
 The schedule and the manual of basic techniques for cell culture Advanced Protocol for Gene Transfection & Western Blotting Schedule Day 1 26/07/2008 Transfection Day 3 28/07/2008 Cell lysis Immunoprecipitation
A Hepatocyte Growth Factor Receptor (Met) Insulin Receptor hybrid governs hepatic glucose metabolism SUPPLEMENTARY FIGURES, LEGENDS AND METHODS
 Insulin Receptor hybrid governs hepatic glucose metabolism SUPPLEMENTARY FIGURES, LEGENDS AND METHODS") A Hepatocyte Growth Factor Receptor (Met) Insulin Receptor hybrid governs hepatic glucose metabolism Arlee Fafalios, Jihong Ma, Xinping Tan, John Stoops, Jianhua Luo, Marie C. DeFrances and Reza Zarnegar
A Hepatocyte Growth Factor Receptor (Met) Insulin Receptor hybrid governs hepatic glucose metabolism Arlee Fafalios, Jihong Ma, Xinping Tan, John Stoops, Jianhua Luo, Marie C. DeFrances and Reza Zarnegar
Supplementary Figure 1.TRIM33 binds β-catenin in the nucleus. a & b, Co-IP of endogenous TRIM33 with β-catenin in HT-29 cells (a) and HEK 293T cells
 and HEK 293T cells") Supplementary Figure 1.TRIM33 binds β-catenin in the nucleus. a & b, Co-IP of endogenous TRIM33 with β-catenin in HT-29 cells (a) and HEK 293T cells (b). TRIM33 was immunoprecipitated, and the amount of
Supplementary Figure 1.TRIM33 binds β-catenin in the nucleus. a & b, Co-IP of endogenous TRIM33 with β-catenin in HT-29 cells (a) and HEK 293T cells (b). TRIM33 was immunoprecipitated, and the amount of
Supplementary figure legends
 Supplementary figure legends Supplementary Figure 1. Exposure of CRT occurs independently from the apoptosisassociated loss of the mitochondrial membrane potential (MMP). (A) HeLa cells treated with MTX
Islet viability assay and Glucose Stimulated Insulin Secretion assay RT-PCR and Western Blot
 Islet viability assay and Glucose Stimulated Insulin Secretion assay Islet cell viability was determined by colorimetric (3-(4,5-dimethylthiazol-2-yl)-2,5- diphenyltetrazolium bromide assay using CellTiter
Supplemental Information
 Supplemental Information Tobacco-specific Carcinogen Induces DNA Methyltransferases 1 Accumulation through AKT/GSK3β/βTrCP/hnRNP-U in Mice and Lung Cancer patients Ruo-Kai Lin, 1 Yi-Shuan Hsieh, 2 Pinpin
SUPPLEMENTARY INFORMATION. Supplementary Figures S1-S9. Supplementary Methods
 SUPPLEMENTARY INFORMATION SUMO1 modification of PTEN regulates tumorigenesis by controlling its association with the plasma membrane Jian Huang 1,2#, Jie Yan 1,2#, Jian Zhang 3#, Shiguo Zhu 1, Yanli Wang
SUPPLEMENTARY INFORMATION
 SUPPLEMENTARY INFORMATION FOR Liver X Receptor α mediates hepatic triglyceride accumulation through upregulation of G0/G1 Switch Gene 2 (G0S2) expression I: SUPPLEMENTARY METHODS II: SUPPLEMENTARY FIGURES
Supplementary Data. Supplementary Methods:
 Supplementary Data Supplementary Methods: Cell viability assay. Cells were seeded overnight at a density of 2,000 cells per well in 96-well plates in RPMI with 10% FBS and then treated with the relevant
(A) RT-PCR for components of the Shh/Gli pathway in normal fetus cell (MRC-5) and a
 RT-PCR for components of the Shh/Gli pathway in normal fetus cell (MRC-5) and a") Supplementary figure legends Supplementary Figure 1. Expression of Shh signaling components in a panel of gastric cancer. (A) RT-PCR for components of the Shh/Gli pathway in normal fetus cell (MRC-5) and
Supplementary figure legends Supplementary Figure 1. Expression of Shh signaling components in a panel of gastric cancer. (A) RT-PCR for components of the Shh/Gli pathway in normal fetus cell (MRC-5) and
TRAF6 ubiquitinates TGFβ type I receptor to promote its cleavage and nuclear translocation in cancer
 Supplementary Information TRAF6 ubiquitinates TGFβ type I receptor to promote its cleavage and nuclear translocation in cancer Yabing Mu, Reshma Sundar, Noopur Thakur, Maria Ekman, Shyam Kumar Gudey, Mariya
SUPPLEMENT. Materials and methods
 SUPPLEMENT Materials and methods Cell culture and reagents Cell media and reagents were from Invitrogen unless otherwise indicated. Antibiotics and Tet-certified serum were from Clontech. In experiments
The Schedule and the Manual of Basic Techniques for Cell Culture
 The Schedule and the Manual of Basic Techniques for Cell Culture 1 Materials Calcium Phosphate Transfection Kit: Invitrogen Cat.No.K2780-01 Falcon tube (Cat No.35-2054:12 x 75 mm, 5 ml tube) Cell: 293
Supplementary Materials and Methods
 Supplementary Materials and Methods Immunoblotting Immunoblot analysis was performed as described previously (1). Due to high-molecular weight of MUC4 (~ 950 kda) and MUC1 (~ 250 kda) proteins, electrophoresis
Supplementary Fig. 1. Identification of acetylation of K68 of SOD2
 Supplementary Fig. 1. Identification of acetylation of K68 of SOD2 A B H. sapiens 54 KHHAAYVNNLNVTEEKYQEALAK 75 M. musculus 54 KHHAAYVNNLNATEEKYHEALAK 75 X. laevis 55 KHHATYVNNLNITEEKYAEALAK 77 D. rerio
Plasmids Western blot analysis and immunostaining Flow Cytometry Cell surface biotinylation RNA isolation and cdna synthesis
 Plasmids psuper-retro-s100a10 shrna1 was constructed by cloning the dsdna oligo 5 -GAT CCC CGT GGG CTT CCA GAG CTT CTT TCA AGA GAA GAA GCT CTG GAA GCC CAC TTT TTA-3 and 5 -AGC TTA AAA AGT GGG CTT CCA GAG
Supplementary Appendix
 Supplementary Appendix This appendix has been provided by the authors to give readers additional information about their work. Supplement to: Choi YL, Soda M, Yamashita Y, et al. EML4-ALK mutations in
TFEB-mediated increase in peripheral lysosomes regulates. Store Operated Calcium Entry
 TFEB-mediated increase in peripheral lysosomes regulates Store Operated Calcium Entry Luigi Sbano, Massimo Bonora, Saverio Marchi, Federica Baldassari, Diego L. Medina, Andrea Ballabio, Carlotta Giorgi
p47 negatively regulates IKK activation by inducing the lysosomal degradation of polyubiquitinated NEMO
 Supplementary Information p47 negatively regulates IKK activation by inducing the lysosomal degradation of polyubiquitinated NEMO Yuri Shibata, Masaaki Oyama, Hiroko Kozuka-Hata, Xiao Han, Yuetsu Tanaka,
Supplementary Information
 Supplementary Information Supplementary Figure 1. EBV-gB 23-431 mainly exists as trimer in HEK 293FT cells. (a) Western blotting analysis for DSS crosslinked FLAG-gB 23-431. HEK 293FT cells transfected
SUPPLEMENTARY INFORMATION
 Supplementary Figures Supplementary Figure S1. Binding of full-length OGT and deletion mutants to PIP strips (Echelon Biosciences). Supplementary Figure S2. Binding of the OGT (919-1036) fragments with
Online Data Supplement. Anti-aging Gene Klotho Enhances Glucose-induced Insulin Secretion by Upregulating Plasma Membrane Retention of TRPV2
 Online Data Supplement Anti-aging Gene Klotho Enhances Glucose-induced Insulin Secretion by Upregulating Plasma Membrane Retention of TRPV2 Yi Lin and Zhongjie Sun Department of physiology, college of
Recruitment of HBO1 Histone Acetylase and Blocks
 Molecular Cell, Volume 44 Supplemental Information JNK1 Phosphorylation of Cdt1 Inhibits Recruitment of HO1 Histone cetylase and locks Replication Licensing in Response to Stress enoit Miotto and Kevin
Supplementary Fig. S1. Schematic diagram of minigenome segments.
 open reading frame 1565 (segment 5) 47 (-) 3 5 (+) 76 101 125 149 173 197 221 246 287 open reading frame 890 (segment 8) 60 (-) 3 5 (+) 172 Supplementary Fig. S1. Schematic diagram of minigenome segments.
SUPPLEMENTAL INFORMATION
 SUPPLEMENTAL INFORMATION EXPERIMENTAL PROCEDURES Tryptic digestion protection experiments - PCSK9 with Ab-3D5 (1:1 molar ratio) in 50 mm Tris, ph 8.0, 150 mm NaCl was incubated overnight at 4 o C. The
Supplementary Fig. 1. GPRC5A post-transcriptionally down-regulates EGFR expression. (a) Plot of the changes in steady state mrna levels versus
 Plot of the changes in steady state mrna levels versus") Supplementary Fig. 1. GPRC5A post-transcriptionally down-regulates EGFR expression. (a) Plot of the changes in steady state mrna levels versus changes in corresponding proteins between wild type and Gprc5a-/-
Supplementary Fig. 1. GPRC5A post-transcriptionally down-regulates EGFR expression. (a) Plot of the changes in steady state mrna levels versus changes in corresponding proteins between wild type and Gprc5a-/-
Tumor suppressor Spred2 interaction with LC3 promotes autophagosome maturation and induces autophagy-dependent cell death
 www.impactjournals.com/oncotarget/ Oncotarget, Supplementary Materials 2016 Tumor suppressor Spred2 interaction with LC3 promotes autophagosome maturation and induces autophagy-dependent cell death Supplementary
Prolonged mitotic arrest induces a caspase-dependent DNA damage
 SUPPLEMENTARY INFORMATION Prolonged mitotic arrest induces a caspase-dependent DNA damage response at telomeres that determines cell survival Karolina O. Hain, Didier J. Colin, Shubhra Rastogi, Lindsey
Name Animal source Vendor Cat # Dilutions
 Supplementary data Table S1. Primary and Secondary antibody sources Devi et al, TXNIP in mitophagy A. Primary Antibodies Name Animal source Vendor Cat # Dilutions 1. TXNIP mouse MBL KO205-2 1:2000 (WB)
(a) Significant biological processes (upper panel) and disease biomarkers (lower panel)
 Significant biological processes (upper panel) and disease biomarkers (lower panel)") Supplementary Figure 1. Functional enrichment analyses of secretomic proteins. (a) Significant biological processes (upper panel) and disease biomarkers (lower panel) 2 involved by hrab37-mediated secretory
Supplementary Figure 1. Functional enrichment analyses of secretomic proteins. (a) Significant biological processes (upper panel) and disease biomarkers (lower panel) 2 involved by hrab37-mediated secretory
Supplementary Figure S1
 Supplementary Figure S1 Supplementary Figure S1. PARP localization patterns using GFP-PARP and PARP-specific antibody libraries GFP-PARP localization in non-fixed (A) and formaldehyde fixed (B) GFP-PARPx
Luminescent platforms for monitoring changes in the solubility of amylin and huntingtin in living cells
 Electronic Supplementary Material (ESI) for Molecular BioSystems. This journal is The Royal Society of Chemistry 2016 Contents Supporting Information Luminescent platforms for monitoring changes in the
Proteomic profiling of small-molecule inhibitors reveals dispensability of MTH1 for cancer cell survival
 Supplementary Information for Proteomic profiling of small-molecule inhibitors reveals dispensability of MTH1 for cancer cell survival Tatsuro Kawamura 1, Makoto Kawatani 1, Makoto Muroi, Yasumitsu Kondoh,
SUPPLEMENTAL FIGURE LEGENDS
 SUPPLEMENTAL FIGURE LEGENDS Supplemental Figure S1: Endogenous interaction between RNF2 and H2AX: Whole cell extracts from 293T were subjected to immunoprecipitation with anti-rnf2 or anti-γ-h2ax antibodies
Supplementary Figure 1 Role of Raf-1 in TLR2-Dectin-1-mediated cytokine expression
 Supplementary Figure 1 Supplementary Figure 1 Role of Raf-1 in TLR2-Dectin-1-mediated cytokine expression. Quantitative real-time PCR of indicated mrnas in DCs stimulated with TLR2-Dectin-1 agonist zymosan
SUPPLEMENTARY INFORMATION
 Figure S1 Induction of non-apoptotic death of SV40-transformed and primary DKO MEFs, and DKO thymocytes. (A-F) STS-induced non-apoptotic death of DKO MEF. (A, B) Reduced viability of DKO MEFs after exposure
Supplemental Materials. STK16 regulates actin dynamics to control Golgi organization and cell cycle
 Supplemental Materials STK16 regulates actin dynamics to control Golgi organization and cell cycle Juanjuan Liu 1,2,3, Xingxing Yang 1,3, Binhua Li 1, Junjun Wang 1,2, Wenchao Wang 1, Jing Liu 1, Qingsong
Supplementary Figure 1
 A B D Relative TAp73 mrna p73 Supplementary Figure 1 25 2 15 1 5 p63 _-tub. MDA-468 HCC1143 HCC38 SUM149 MDA-468 HCC1143 HCC38 SUM149 HCC-1937 MDA-MB-468 ΔNp63_ TAp73_ TAp73β E C Relative ΔNp63 mrna TAp73
Supplementary Information
 Supplementary Information Supplementary s Supplementary 1 All three types of foods suppress subsequent feeding in both sexes when the same food is used in the pre-feeding test feeding. (a) Adjusted pre-feeding
Supplementary Figure 1. MAT IIα is Acetylated at Lysine 81.
 IP: Flag a Mascot PTM Modified Mass Error Position Gene Names Score Score Sequence m/z [ppm] 81 MAT2A;AMS2;MATA2 35.6 137.28 _AAVDYQK(ac)VVR_ 595.83-2.28 b Pre-immu After-immu Flag- WT K81R WT K81R / Flag
Nature Structural and Molecular Biology: doi: /nsmb Supplementary Figure 1
 Supplementary Figure 1 Mutational analysis of the SA2-Scc1 interaction in vitro and in human cells. (a) Autoradiograph (top) and Coomassie stained gel (bottom) of 35 S-labeled Myc-SA2 proteins (input)
Supplementary Figure 1 Transcription assay of nine ABA-responsive PP2C. Transcription assay of nine ABA-responsive PP2C genes. Total RNA was isolated
 Supplementary Figure 1 Transcription assay of nine ABA-responsive PP2C genes. Transcription assay of nine ABA-responsive PP2C genes. Total RNA was isolated from 7 day-old seedlings treated with or without
Erzsebet Kokovay, Susan Goderie, Yue Wang, Steve Lotz, Gang Lin, Yu Sun, Badrinath Roysam, Qin Shen,
 Cell Stem Cell, Volume 7 Supplemental Information Adult SVZ Lineage Cells Home to and Leave the Vascular Niche via Differential Responses to SDF1/CXCR4 Signaling Erzsebet Kokovay, Susan Goderie, Yue Wang,
Supplementary data Supplementary Figure 1 Supplementary Figure 2
 Supplementary data Supplementary Figure 1 SPHK1 sirna increases RANKL-induced osteoclastogenesis in RAW264.7 cell culture. (A) RAW264.7 cells were transfected with oligocassettes containing SPHK1 sirna
Figure S1 Time-dependent down-modulation of HER3 by EZN No Treatment. EZN-3920, 2 μm. Time, h
 Figure S1 Time-dependent down-modulation of HER3 by EZN-392 HE ER3 mrna A, %Contr rol 12 No Treatment EZN-392, 2 μm 1 8 6 4 2 2 8 24 Time, h Figure S2. Specific target down-modulation by HER3 (EZN-392)
Supplementary Figure 1.
 Supplementary Figure 1. Increased β cell mass and islet diameter in βtsc2 -/- mice up to 35 weeks A: Reconstruction of multiple anti-insulin immunofluorescence images showing differences in β cell mass
Nature Medicine: doi: /nm.4322
 1 2 3 4 5 6 7 8 9 10 11 Supplementary Figure 1. Predicted RNA structure of 3 UTR and sequence alignment of deleted nucleotides. (a) Predicted RNA secondary structure of ZIKV 3 UTR. The stem-loop structure
SUPPLEMENTARY LEGENDS...
 TABLE OF CONTENTS SUPPLEMENTARY LEGENDS... 2 11 MOVIE S1... 2 FIGURE S1 LEGEND... 3 FIGURE S2 LEGEND... 4 FIGURE S3 LEGEND... 5 FIGURE S4 LEGEND... 6 FIGURE S5 LEGEND... 7 FIGURE S6 LEGEND... 8 FIGURE
Argininosuccinate synthetase 1 suppression and arginine restriction inhibit cell
 Argininosuccinate synthetase 1 suppression and arginine restriction inhibit cell migration in gastric cancer cell lines Yan-Shen Shan 1, Hui-Ping Hsu 1, Ming-Derg Lai 2,3, Meng-Chi Yen 2,4, Wei-Ching Chen
Supplementary Figure 1. Validation of astrocytes. Primary astrocytes were
 Supplementary Figure 1. Validation of astrocytes. Primary astrocytes were separated from the glial cultures using a mild trypsinization protocol. Anti-glial fibrillary acidic protein (GFAP) immunofluorescent
Supplemental Information. Tissue Myeloid Progenitors Differentiate. into Pericytes through TGF-b Signaling. in Developing Skin Vasculature
 Cell Reports, Volume 18 Supplemental Information Tissue Myeloid Progenitors Differentiate into Pericytes through TGF-b Signaling in Developing Skin Vasculature Tomoko Yamazaki, Ani Nalbandian, Yutaka Uchida,
(a) Schematic diagram of the FS mutation of UVRAG in exon 8 containing the highly instable
 Schematic diagram of the FS mutation of UVRAG in exon 8 containing the highly instable") Supplementary Figure 1. Frameshift (FS) mutation in UVRAG. (a) Schematic diagram of the FS mutation of UVRAG in exon 8 containing the highly instable A 10 DNA repeat, generating a premature stop codon
Supplementary Figure 1. Frameshift (FS) mutation in UVRAG. (a) Schematic diagram of the FS mutation of UVRAG in exon 8 containing the highly instable A 10 DNA repeat, generating a premature stop codon
Supplementary information
 Supplementary information Human Cytomegalovirus MicroRNA mir-us4-1 Inhibits CD8 + T Cell Response by Targeting ERAP1 Sungchul Kim, Sanghyun Lee, Jinwook Shin, Youngkyun Kim, Irini Evnouchidou, Donghyun
Supplementary Materials for
 www.sciencesignaling.org/cgi/content/full/6/283/ra57/dc1 Supplementary Materials for JNK3 Couples the Neuronal Stress Response to Inhibition of Secretory Trafficking Guang Yang,* Xun Zhou, Jingyan Zhu,
Supplemental Material:
 Supplemental Material: MATERIALS AND METHODS RNA interference Mouse CHOP sirna (ON-TARGETplus SMARTpool Cat# L-062068-00) and control sirna (ON-TARGETplus Control) were purchased from Dharmacon. Transfection
Supplementary Information Supplementary Fig. 1. Elevated Usp9x in melanoma and NRAS mutant melanoma cells are dependent on NRAS for 3D growth.
 Supplementary Information Supplementary Fig. 1. Elevated Usp9x in melanoma and NRAS mutant melanoma cells are dependent on NRAS for 3D growth. a. Immunoblot for Usp9x protein in NRAS mutant melanoma cells
SUPPLEMENTARY INFORMATION
 SUPPLEMENTARY INFORMATION doi:1.138/nature9814 a A SHARPIN FL B SHARPIN ΔNZF C SHARPIN T38L, F39V b His-SHARPIN FL -1xUb -2xUb -4xUb α-his c Linear 4xUb -SHARPIN FL -SHARPIN TF_LV -SHARPINΔNZF -SHARPIN
Supplementary Information
 Supplementary Information Figure S1. Int6 gene silencing efficiency. (A) Western Blot analysis of Int6 expression at different times after sirna transfection. Int6 expression is strongly silenced in Int6
SUPPLEMENTARY FIGURES AND TABLES
 SUPPLEMENTARY FIGURES AND TABLES Supplementary Figure S1: CaSR expression in neuroblastoma models. A. Proteins were isolated from three neuroblastoma cell lines and from the liver metastasis of a MYCN-non
SUPPLEMENTARY FIGURES
 SUPPLEMENTARY FIGURES Supplementary Figure 1. (A) Left, western blot analysis of ISGylated proteins in Jurkat T cells treated with 1000U ml -1 IFN for 16h (IFN) or left untreated (CONT); right, western
A dual PI3 kinase/mtor inhibitor reveals emergent efficacy in glioma
 Supplemental data A dual PI3 kinase/mtor inhibitor reveals emergent efficacy in glioma Qi-Wen Fan, Zachary A. Knight, David D. Goldenberg, Wei Yu, Keith E. Mostov, David Stokoe, Kevan M. Shokat, and William
Supporting Information. FADD regulates NF-кB activation and promotes ubiquitination of cflip L to induce. apoptosis
 1 2 Supporting Information 3 4 5 FADD regulates NF-кB activation and promotes ubiquitination of cflip L to induce apoptosis 6 7 Kishu Ranjan and Chandramani Pathak* 8 9 Department of Cell Biology, School
Supplementary Figure 1. SC35M polymerase activity in the presence of Bat or SC35M NP encoded from the phw2000 rescue plasmid.
 1 2 3 4 5 6 7 8 9 10 11 12 13 14 15 16 17 18 19 20 21 22 23 24 25 26 27 Supplementary Figure 1. SC35M polymerase activity in the presence of Bat or SC35M NP encoded from the phw2000 rescue plasmid. HEK293T
(A) PCR primers (arrows) designed to distinguish wild type (P1+P2), targeted (P1+P2) and excised (P1+P3)14-
 PCR primers (arrows) designed to distinguish wild type (P1+P2), targeted (P1+P2) and excised (P1+P3)14-") 1 Supplemental Figure Legends Figure S1. Mammary tumors of ErbB2 KI mice with 14-3-3σ ablation have elevated ErbB2 transcript levels and cell proliferation (A) PCR primers (arrows) designed to distinguish
1 Supplemental Figure Legends Figure S1. Mammary tumors of ErbB2 KI mice with 14-3-3σ ablation have elevated ErbB2 transcript levels and cell proliferation (A) PCR primers (arrows) designed to distinguish
BHP 2-7 and Nthy-ori 3-1 cells were grown in RPMI1640 medium (Hyclone) supplemented with 10% fetal bovine serum (Gibco), 2mM L-glutamine, and 100 U/mL
 supplemented with 10% fetal bovine serum (Gibco), 2mM L-glutamine, and 100 U/mL") 1 2 3 4 Materials and Methods Cell culture BHP 2-7 and Nthy-ori 3-1 cells were grown in RPMI1640 medium (Hyclone) 5 supplemented with 10% fetal bovine serum (Gibco), 2mM L-glutamine, and 100 U/mL 6 penicillin-streptomycin.
1 2 3 4 Materials and Methods Cell culture BHP 2-7 and Nthy-ori 3-1 cells were grown in RPMI1640 medium (Hyclone) 5 supplemented with 10% fetal bovine serum (Gibco), 2mM L-glutamine, and 100 U/mL 6 penicillin-streptomycin.
Supplementary Materials and Methods
 DD2 suppresses tumorigenicity of ovarian cancer cells by limiting cancer stem cell population Chunhua Han et al. Supplementary Materials and Methods Analysis of publicly available datasets: To analyze
A. List of selected proteins with high SILAC (H/L) ratios identified in mass
 ratios identified in mass") Supplementary material Figure S1. Interaction between UBL5 and FANCI A. List of selected proteins with high SILAC (H/L) ratios identified in mass spectrometry (MS)-based analysis of UBL5-interacting proteins,
Supplementary material Figure S1. Interaction between UBL5 and FANCI A. List of selected proteins with high SILAC (H/L) ratios identified in mass spectrometry (MS)-based analysis of UBL5-interacting proteins,
Figure S1. Analysis of genomic and cdna sequences of the targeted regions in WT-KI and
 Figure S1. Analysis of genomic and sequences of the targeted regions in and indicated mutant KI cells, with WT and corresponding mutant sequences underlined. (A) cells; (B) K21E-KI cells; (C) D33A-KI cells;
Figure S1. Western blot analysis of clathrin RNA interference in human DCs Human immature DCs were transfected with 100 nm Clathrin SMARTpool or
 Figure S1. Western blot analysis of clathrin RNA interference in human DCs Human immature DCs were transfected with 100 nm Clathrin SMARTpool or control nontargeting sirnas. At 90 hr after transfection,
WDR62 is associated with the spindle pole and mutated in human microcephaly
 WDR62 is associated with the spindle pole and mutated in human microcephaly Adeline K. Nicholas, Maryam Khurshid, Julie Désir, Ofélia P. Carvalho, James J. Cox, Gemma Thornton, Rizwana Kausar, Muhammad
Spherical Nucleic Acids For Advanced Wound Healing Applications Chad A. Mirkin
 Spherical Nucleic Acids For Advanced Wound Healing Applications Chad A. Mirkin Departments of Chemistry, Infectious Disease, Materials Science & Engineering, Chemical & Biological Engineering, and Biomedical
SUPPLEMENTARY INFORMATION
 DOI: 10.1038/ncb2566 Figure S1 CDKL5 protein expression pattern and localization in mouse brain. (a) Multiple-tissue western blot from a postnatal day (P) 21 mouse probed with an antibody against CDKL5.
(Stratagene, La Jolla, CA) (Supplemental Fig. 1A). A 5.4-kb EcoRI fragment
 (Supplemental Fig. 1A). A 5.4-kb EcoRI fragment") SUPPLEMENTAL INFORMATION Supplemental Methods Generation of RyR2-S2808D Mice Murine genomic RyR2 clones were isolated from a 129/SvEvTacfBR λ-phage library (Stratagene, La Jolla, CA) (Supplemental Fig.
SUPPLEMENTAL INFORMATION Supplemental Methods Generation of RyR2-S2808D Mice Murine genomic RyR2 clones were isolated from a 129/SvEvTacfBR λ-phage library (Stratagene, La Jolla, CA) (Supplemental Fig.
reads observed in trnas from the analysis of RNAs carrying a 5 -OH ends isolated from cells induced to express
 Supplementary Figure 1. VapC-mt4 cleaves trna Ala2 in E. coli. Histograms representing the fold change in reads observed in trnas from the analysis of RNAs carrying a 5 -OH ends isolated from cells induced
Supplementary Figure 1. PD-L1 is glycosylated in cancer cells. (a) Western blot analysis of PD-L1 in breast cancer cells. (b) Western blot analysis
 Western blot analysis of PD-L1 in breast cancer cells. (b) Western blot analysis") Supplementary Figure 1. PD-L1 is glycosylated in cancer cells. (a) Western blot analysis of PD-L1 in breast cancer cells. (b) Western blot analysis of PD-L1 in ovarian cancer cells. (c) Western blot analysis
Supplementary Figure 1. PD-L1 is glycosylated in cancer cells. (a) Western blot analysis of PD-L1 in breast cancer cells. (b) Western blot analysis of PD-L1 in ovarian cancer cells. (c) Western blot analysis
TSH Receptor Monoclonal Antibody (49) Catalog Number MA3-218 Product data sheet
 Catalog Number MA3-218 Product data sheet") Website: thermofisher.com Customer Service (US): 1 800 955 6288 ext. 1 Technical Support (US): 1 800 955 6288 ext. 441 TSH Receptor Monoclonal Antibody (49) Catalog Number MA3-218 Product data sheet Details
Website: thermofisher.com Customer Service (US): 1 800 955 6288 ext. 1 Technical Support (US): 1 800 955 6288 ext. 441 TSH Receptor Monoclonal Antibody (49) Catalog Number MA3-218 Product data sheet Details
SUPPORTING MATREALS. Methods and Materials
 SUPPORTING MATREALS Methods and Materials Cell Culture MC3T3-E1 (subclone 4) cells were maintained in -MEM with 10% FBS, 1% Pen/Strep at 37ºC in a humidified incubator with 5% CO2. MC3T3 cell differentiation
Supplemental Information. Inhibition of the Proteasome b2 Site Sensitizes. Triple-Negative Breast Cancer Cells
 Cell Chemical Biology, Volume 24 Supplemental Information Inhibition of the Proteasome b2 Site Sensitizes Triple-Negative Breast Cancer Cells to b5 Inhibitors and Suppresses Nrf1 Activation Emily S. Weyburne,
SUPPLEMENTARY FIGURES
 SUPPLEMENTARY FIGURES Figure S1. Clinical significance of ZNF322A overexpression in Caucasian lung cancer patients. (A) Representative immunohistochemistry images of ZNF322A protein expression in tissue
Supplementary Figure 1
 Supplementary Figure 1 Supplementary Figure 1. Neither the activation nor suppression of the MAPK pathway affects the ASK1/Vif interaction. (a, b) HEK293 cells were cotransfected with plasmids encoding
Supplementary Figure 1
 Supplementary Figure 1 YAP negatively regulates IFN- signaling. (a) Immunoblot analysis of Yap knockdown efficiency with sh-yap (#1 to #4 independent constructs) in Raw264.7 cells. (b) IFN- -Luc and PRDs
Supplementary Figure 1: Co-localization of reconstituted L-PTC and dendritic cells
 a CD11c Na + K + ATPase Na + K + ATPase CD11c x-y CD11c Na + K + ATPase Na + K + ATPase CD11c x-z c b x-y view BoNT NAPs CD11c BoNT CD11c NAPs BoNT NAPs CD11c 90 x-z view Apical Basolateral Supplementary
Electron micrograph of phosphotungstanic acid-stained exosomes derived from murine
 1 SUPPLEMENTARY INFORMATION SUPPLEMENTARY FIGURES Supplementary Figure 1. Physical properties of murine DC-derived exosomes. a, Electron micrograph of phosphotungstanic acid-stained exosomes derived from
Supplementary Figure 1. Prevalence of U539C and G540A nucleotide and E172K amino acid substitutions among H9N2 viruses. Full-length H9N2 NS
 Supplementary Figure 1. Prevalence of U539C and G540A nucleotide and E172K amino acid substitutions among H9N2 viruses. Full-length H9N2 NS nucleotide sequences (a, b) or amino acid sequences (c) from
Supplementary Information and Figure legends
 Supplementary Information and Figure legends Table S1. Primers for quantitative RT-PCR Target Sequence (5 -> 3 ) Target Sequence (5 -> 3 ) DAB2IP F:TGGACGATGTGCTCTATGCC R:GGATGGTGATGGTTTGGTAG Snail F:CCTCCCTGTCAGATGAGGAC
Supporting Information
 Supporting Information Gack et al. 1.173/pnas.8494715 SI Text Cell Culture, Transfection, and Reagents. HEK293T, MEF, Vero, EcoPack2-293 (D iosciences), HeLa, HCT116, Huh7, NHLF, 2fTGH wild-type, U3A,
File Name: Supplementary Information Description: Supplementary Figures and Supplementary Tables. File Name: Peer Review File Description:
 File Name: Supplementary Information Description: Supplementary Figures and Supplementary Tables File Name: Peer Review File Description: Primer Name Sequence (5'-3') AT ( C) RT-PCR USP21 F 5'-TTCCCATGGCTCCTTCCACATGAT-3'
Tel: ; Fax: ;
 Tel.: +98 216 696 9291; Fax: +98 216 696 9291; E-mail: mrasadeghi@pasteur.ac.ir Tel: +98 916 113 7679; Fax: +98 613 333 6380; E-mail: abakhshi_e@ajums.ac.ir A Soluble Chromatin-bound MOI 0 1 5 0 1 5 HDAC2
condition. Left panel, the HCT-116 cells were lysed with RIPA buffer containing 0.1%
 FIGURE LEGENDS Supplementary Fig 1 (A) sumoylation pattern detected under denaturing condition. Left panel, the HCT-116 cells were lysed with RIPA buffer containing 0.1% SDS in the presence and absence