a) List of KMTs targeted in the shrna screen. The official symbol, KMT designation,
|
|
|
- Oliver Hodges
- 5 years ago
- Views:
Transcription
 denotes the ability to modify indicated residue whereas the methylation state is unknown.")
1 Supplementary Information Supplementary Figures Supplementary Figure 1. a) List of KMTs targeted in the shrna screen. The official symbol, KMT designation, gene ID and specifities are provided. Those highlighted in red have the potential to methylate the indicated methylation state. (?) denotes the ability to modify indicated residue whereas the methylation state is unknown. b) A shrna screen against KMTs to identify the chromatin modifiers that regulate BTG2 expression. Lenti-virally expressed shrna screen against the KMTs shown was performed using MDA-MB-231 cells. plko infected cells were used as control and the expression of BTG2 and SETD1A in these cells was set at 1. The fold change in BTG2
2 and each KMT expression after 72 hr of viral infection is shown. The dotted line marks 2 fold induction of BTG2 compared to control. KMTs and BTG2 are shown as red and blue bars, respectively. Data are represented as mean ± s.d. of the average of 3 experimental replicates.
3 Supplementary Figure 2. a) SETD1A mrna expression is elevated in breast, lung and prostate cancers compared to normal tissues. Box plots from the studies indicated are shown 1, 2. TCGA : The Cancer Genome Atlas 3. P-value is determined by Student s t-test and representative box plot is shown to illustrate the difference in SETD1A mrna levels. All data are log transformed, median centered and the 25 th - 75 th percentiles are indicated by the closed box. b) A list of cell lines in which SETD1A was knocked down with shsetd1a#1 and shsetd1a#2 lentiviruses. The expression of SETD1A and BTG2 was analyzed by qpcr. The fold suppression of SETD1A and induction of BTG2 in each cell line is shown. SETD1A and BTG2 expression in SETD1A depleted cells represent the average derived from cells individually infected with two shsetd1a constructs (shsetd1a#1 and shsetd1a#2). shgfp infected cells were used as control and the average
4 expression of BTG2 and SETD1A in these cells was set at 1. Cells lines harboring wild type p53 are marked with an asterisk. Data are represented as mean ± s.d. of the average of 3 experimental replicates. c) Western blot analysis of MDA-MB-231 cells infected with shgfp and two shsetd1a constructs demonstrates the depletion of SETD1A and the concomitant increase in BTG2. ß-actin was used as loading control.
5 Supplementary Figure 3. a) Pearson correlation of SETD1A and BTG2 expression in a large prostate cancer and normal tissue data set 4, 5 demonstrates significant inverse correlation between SETD1A and BTG2 expression in tumors, which is pronounced in tumors of Gleason Score 6. No correlation was detected in the normal tissue samples. b) Pearson correlation of SETD1A and BTG2 expression in breast and lung cancer data sets 6, 7, 8 demonstrate significant inverse correlation between SETD1A and BTG2 expression.
6 Supplementary Figure 4. a, b, c & d) Thirty one, 200 bp oligonucleotides spanning 3 kb upstream and 2 kb down stream of the BTG2 open reading frame (a) were analyzed by ChIP for H3K4Me1 (b), H3K4Me2 (c), and H3K4Me3 (d) marks. The amplitude of the various marks across the region was standardized against input and total H3 levels in control and SETD1A knockdown MDA-MB-231 cells. The regions demonstrating significant differences in H3K4 methylation are marked with asterisks.
7 e) SETD1A binding to the BTG2 promoter region demonstrating significant changes in H3K4Me3 peak analyzed with primers 19 and 20 is shown. f) MLL depletion does not change the H4K3Me3 peaks in the BTG2 promoter region analyzed with primers 18 through 21. g) MLL binding to the BTG2 promoter region analyzed with primers 19 and 20 shows no significant changes in MLL binding to these sites. For all experiments, the shsetd1a and shmll data represent the average derived from ChIP assays performed with MDA-MB-231 cells individually infected with two shsetd1a constructs (shsetd1a#1 and shsetd1a#2) or two shmll constructs. Data are represented as mean ± s.d. of the average of 3 experimental replicates. Asterisks indicate P values of (P<0.05) for relevant figures by Student s t-test.
 Expression of mirna-32 and -590-5p was analyzed in the prostate cancer cell line LNCaP by")
8 Supplementary Figure 5. a) Expression of mirna-32 and p was analyzed in the prostate cancer cell line LNCaP by qpcr. The expression of mirnas in shgfp infected control cells was set at 1.
9 The mirna expression in SETD1A depleted cells represents an average derived from LNCaP cells individually infected with two different shsetd1a constructs (shsetd1a#1 and shsetd1a#2). b) Suppression of mirna-32 and p, induces BTG2 expression. Level of BTG2 in MDA-MB-231 cells transfected with non-targeting sequences (NT) was set at 1. c) Expression of mirna-32 and p abrogates BTG2 induction in SETD1A depleted A549 cells. SETD1A expression in shgfp infected control cells was set at 1. For figures (a), (b) and (c): NT represents Non-targeting and 590 indicates mir-590-5p. Data are represented as mean ± s.d. of the average of 3 experimental replicates. Asterisks indicate P values of (P<0.05) for relevant figures by Student s t-test. d) The sequence of the 3 UTR of BTG2 mrna. The positions of the two mirna-32 binding sites and the one mirna-590 binding site are shown. The deletion construct which lacks mirna-32 and -590 binding sites was generated by removing the sequences highlighted in yellow. e) Analysis of a large breast cancer data set (The Cancer Genome Atlas (TCGA) 3 ; n=770) shows increased expression of mirna-32 and p in tumors compared with normal tissue. P-value is determined by Student s t-test and representative box plot is shown to illustrate the difference in the level of each mirna. All data are log transformed, median centered and the 25 th - 75 th percentiles are indicated by the closed box. f) Pearson correlation of mir-32 and p and BTG2 expression in TCGA 3 (n=748) demonstrates significant inverse correlation between the mirnas and BTG2. Analysis was performed by Starbase v2.0 9, 10.

10 Supplementary Figure 6. a) A screen shot of the UCSC genome browser shows the genomic region harboring mir- 32, which is embedded within the host gene TMEM245 ( The promoter of TMEM245 and the putative promoter of mir-32 are marked with green and red ovals, respectively. Note the H3K4 methylation patterns in these two regions. ChIP assays were performed using 10 and 2 primers spanning the TMEM245 (yellow oval) and mir-32 (purple oval) promoter regions (indicated with arrows), respectively (Fig. 3a, 3b). b) A screen shot of the UCSC genome browser shows the genomic region harboring mir- 590, which is embedded within the host gene EIF4H. The EIF4H promoter is marked
11 with a green oval. The red oval represents a region within the previously defined mir- 590 promoter 11, which was further analyzed by ChIP assays. ChIP assays were performed using 4 and 1 primer(s) spanning the EIF4H (yellow oval) and mir-590 promoter regions (indicated with arrows), respectively (Fig. 3c, 3d).
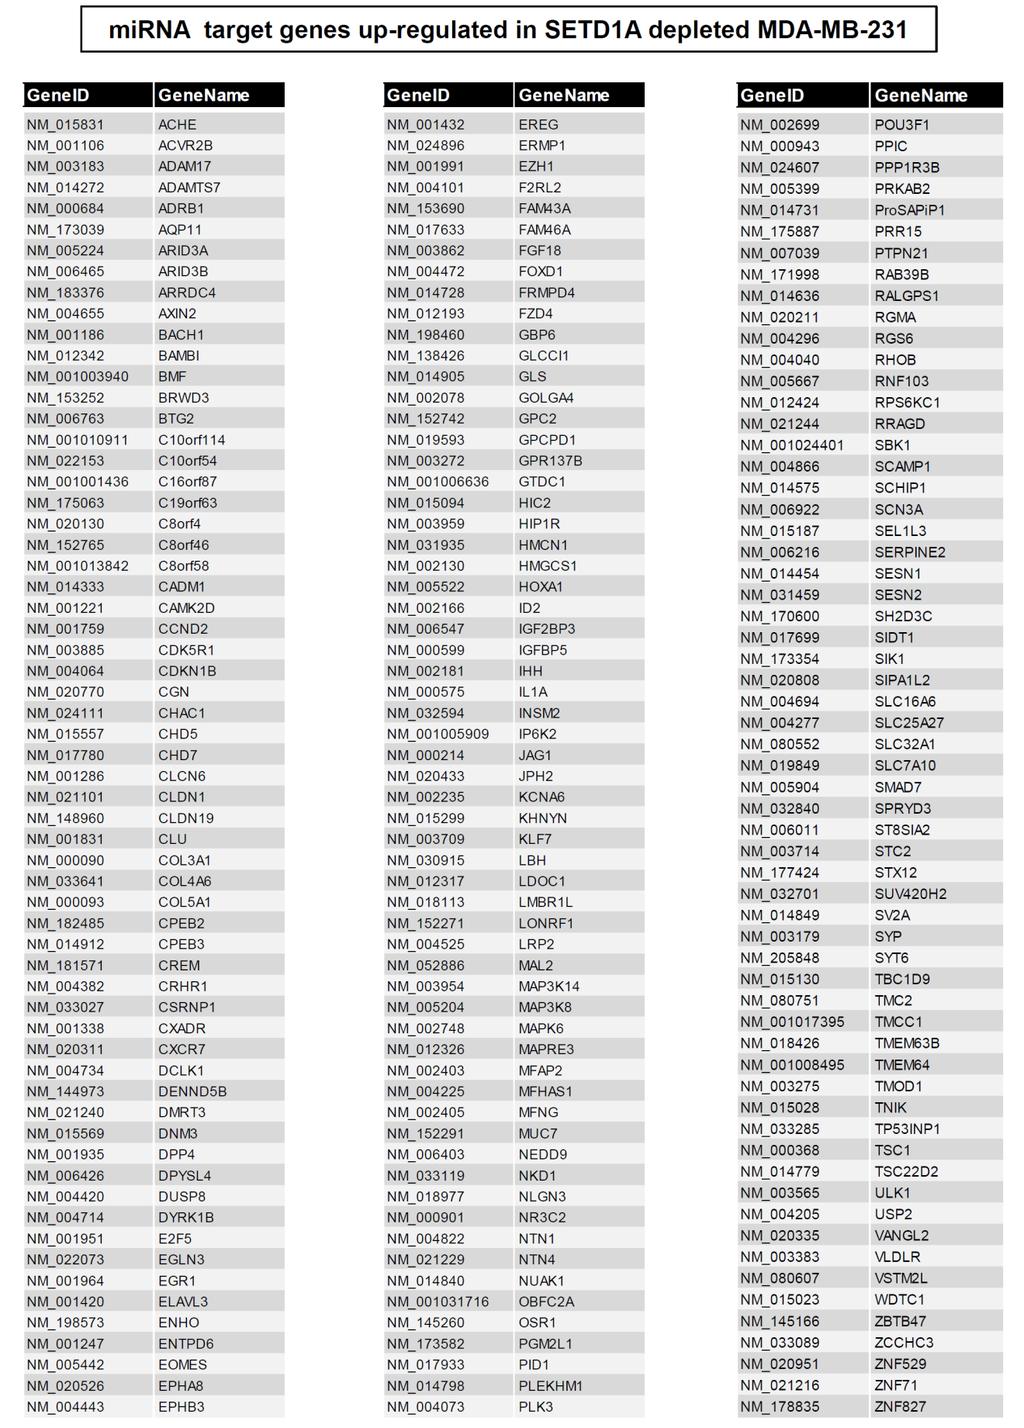
 demonstrates the profile of the 31 targets genes common to both MDA-MB-231 and A549 cells modulated by SETD1A-regulated mirnas.")
12 Supplementary Figure 7. a) The heat map derived using the Gene, Disease Features Ontology-based Overview 12, 13 System ( demonstrates the profile of the 31 targets genes common to both MDA-MB-231 and A549 cells modulated by SETD1A-regulated mirnas. Twenty one of the 31 genes are significantly related to cell cycle, p53 pathway, and neoplasms while the others are also related to the nervous and musculoskeletal system. The colors highlight the degree of significance associated with each gene in relation to the pathways shown and denote P-values described in the figure by Mesh terms enrichment analysis using Biocompass software, under the Creative Commons Attribution 2.1 Japan License. b) StarBase enrichment analysis of the functional terms for mirna targets shows that the 24 SETD1A induced mirnas which target the 21 genes (see main text) are significantly

13 enriched for the pathways shown. P-values are obtained from a hypergeometric test and Bonferroni/FDR correction. Supplementary Figure 8. a)uncropped blots from Figure 1b. b)uncropped blots from Supplementary Figure 2c

14 Supplementary Tables Supplementary Table 1. List of mirnas induced by >2 fold or suppressed by 60% in SETD1A-depleted MDA-MB-231 cells compared to shgfp expressing MDA-MB-231 cells.
15
16 Supplementary Table 2. mirna/mrna interactions of genes and mirnas differentially expressed between shgfp-mda-mb-231 control and sh-setd1a-mda- MB-231 cells identified using TargetScan, miranda and PicTar. The high confidence set of consensus mirna targets identified by all three algorithms were selected. The 185 genes induced by SETD1A-regulated mirnas are shown.
17
18
19
20
21
22 Supplementary Table 3. The list of GSEA gene signatures enriched in the 185 genes from supplementary table 2. The list was manually annotated for different categories as group, subgroup, and specifics. P-value was obtained from Hypergeometric test.

23 Supplementary Table 4. List of SETD1A-regulated mirnas that target the subset of 31 genes upregulated in SETD1A depleted MDA-MB-231 and A549 cells.

24 Supplementary Table 5. Sequences of primers used for qchip analysis of the genomic regions of interest.

25 Supplementary Table 6. Sequences of forward and reverse primers used for qpcr analysis of all the genes shown.
26 Supplementary References 1. Selamat SA, et al. Genome-scale analysis of DNA methylation in lung adenocarcinoma and integration with mrna expression. Genome Res 22, (2012) 2. Tomlins SA, et al. Integrative molecular concept modeling of prostate cancer progression. Nat Genet 39, (2007) 3. Comprehensive molecular portraits of human breast tumours. Nature 490, (2012). 4. Chandran UR, et al. Gene expression profiles of prostate cancer reveal involvement of multiple molecular pathways in the metastatic process. BMC Cancer 7, 64 (2007). 5. Taylor BS, et al. Integrative genomic profiling of human prostate cancer. Cancer Cell 18, (2010). 6. Perou, CM et al. Molecular portraits of human breast tumours. Nature 406, (2000) 7. Raponi N et al. Gene expression signatures for predicting prognosis of squamous cell and adenocarcinomas of the lung. Cancer Res 66, (2006) 8. Zhu CQ et al. Prognostic and predictive gene signature for adjuvant chemotherapy in resected non-small-cell lung cancer. J Clin Oncol 28, (2010) 9. Li JH, Liu S, Zhou H, Qu LH, Yang JH. starbase v2.0: decoding mirna-cerna, mirna-ncrna and protein-rna interaction networks from large-scale CLIP- Seq data. Nucleic Acids Res 42, D92-97 (2014). 10. Yang JH, Li JH, Shao P, Zhou H, Chen YQ, Qu LH. starbase: a database for exploring microrna-mrna interaction maps from Argonaute CLIP-Seq and Degradome-Seq data. Nucleic Acids Res 39, D (2011). 11. Monteys AM, et al. Structure and activity of putative intronic mirna promoters. RNA 16, (2010). 12. Nakazato, T. et al. BioCompass: A novel functional inference tool that utilizes MeSH hierarchy to analyze groups of genes. In Silico Biology, 8(1): (2008) 13. Nakazato, T. et al. Gendoo: Functional profiling of gene and disease features
27 using MeSH vocabulary. Nucleic Acids Research, 37(Suppl. 2) (Web Server Issue):W166-W169 (2009)
7SK ChIRP-seq is specifically RNA dependent and conserved between mice and humans.
 Supplementary Figure 1 7SK ChIRP-seq is specifically RNA dependent and conserved between mice and humans. Regions targeted by the Even and Odd ChIRP probes mapped to a secondary structure model 56 of the
SUPPLEMENTARY FIGURE LEGENDS
 SUPPLEMENTARY FIGURE LEGENDS Supplementary Figure 1 Negative correlation between mir-375 and its predicted target genes, as demonstrated by gene set enrichment analysis (GSEA). 1 The correlation between
Supplementary Figure S1. Gene expression analysis of epidermal marker genes and TP63.
 Supplementary Figure Legends Supplementary Figure S1. Gene expression analysis of epidermal marker genes and TP63. A. Screenshot of the UCSC genome browser from normalized RNAPII and RNA-seq ChIP-seq data
Supplementary Figure 1. Efficiency of Mll4 deletion and its effect on T cell populations in the periphery. Nature Immunology: doi: /ni.
 Supplementary Figure 1 Efficiency of Mll4 deletion and its effect on T cell populations in the periphery. Expression of Mll4 floxed alleles (16-19) in naive CD4 + T cells isolated from lymph nodes and
Supplementary Figure 1 IL-27 IL
 Tim-3 Supplementary Figure 1 Tc0 49.5 0.6 Tc1 63.5 0.84 Un 49.8 0.16 35.5 0.16 10 4 61.2 5.53 10 3 64.5 5.66 10 2 10 1 10 0 31 2.22 10 0 10 1 10 2 10 3 10 4 IL-10 28.2 1.69 IL-27 Supplementary Figure 1.
Supplementary Figures
 Supplementary Figures Supplementary Figure 1. Confirmation of Dnmt1 conditional knockout out mice. a, Representative images of sorted stem (Lin - CD49f high CD24 + ), luminal (Lin - CD49f low CD24 + )
Comparison of open chromatin regions between dentate granule cells and other tissues and neural cell types.
 Supplementary Figure 1 Comparison of open chromatin regions between dentate granule cells and other tissues and neural cell types. (a) Pearson correlation heatmap among open chromatin profiles of different
Nature Structural & Molecular Biology: doi: /nsmb Supplementary Figure 1
 Supplementary Figure 1 Effect of HSP90 inhibition on expression of endogenous retroviruses. (a) Inducible shrna-mediated Hsp90 silencing in mouse ESCs. Immunoblots of total cell extract expressing the
fl/+ KRas;Atg5 fl/+ KRas;Atg5 fl/fl KRas;Atg5 fl/fl KRas;Atg5 Supplementary Figure 1. Gene set enrichment analyses. (a) (b)
 (b)") KRas;At KRas;At KRas;At KRas;At a b Supplementary Figure 1. Gene set enrichment analyses. (a) GO gene sets (MSigDB v3. c5) enriched in KRas;Atg5 fl/+ as compared to KRas;Atg5 fl/fl tumors using gene set
KRas;At KRas;At KRas;At KRas;At a b Supplementary Figure 1. Gene set enrichment analyses. (a) GO gene sets (MSigDB v3. c5) enriched in KRas;Atg5 fl/+ as compared to KRas;Atg5 fl/fl tumors using gene set
Soft Agar Assay. For each cell pool, 100,000 cells were resuspended in 0.35% (w/v)
") SUPPLEMENTARY MATERIAL AND METHODS Soft Agar Assay. For each cell pool, 100,000 cells were resuspended in 0.35% (w/v) top agar (LONZA, SeaKem LE Agarose cat.5004) and plated onto 0.5% (w/v) basal agar.
SUPPLEMENTARY MATERIAL AND METHODS Soft Agar Assay. For each cell pool, 100,000 cells were resuspended in 0.35% (w/v) top agar (LONZA, SeaKem LE Agarose cat.5004) and plated onto 0.5% (w/v) basal agar.
Supplemental Figure S1. Tertiles of FKBP5 promoter methylation and internal regulatory region
 Supplemental Figure S1. Tertiles of FKBP5 promoter methylation and internal regulatory region methylation in relation to PSS and fetal coupling. A, PSS values for participants whose placentas showed low,
Introduction. Introduction
 Introduction We are leveraging genome sequencing data from The Cancer Genome Atlas (TCGA) to more accurately define mutated and stable genes and dysregulated metabolic pathways in solid tumors. These efforts
High Throughput Sequence (HTS) data analysis. Lei Zhou
 data analysis. Lei Zhou") High Throughput Sequence (HTS) data analysis Lei Zhou (leizhou@ufl.edu) High Throughput Sequence (HTS) data analysis 1. Representation of HTS data. 2. Visualization of HTS data. 3. Discovering genomic
High Throughput Sequence (HTS) data analysis Lei Zhou (leizhou@ufl.edu) High Throughput Sequence (HTS) data analysis 1. Representation of HTS data. 2. Visualization of HTS data. 3. Discovering genomic
SSM signature genes are highly expressed in residual scar tissues after preoperative radiotherapy of rectal cancer.
 Supplementary Figure 1 SSM signature genes are highly expressed in residual scar tissues after preoperative radiotherapy of rectal cancer. Scatter plots comparing expression profiles of matched pretreatment
Supplementary Figure 1. Metabolic landscape of cancer discovery pipeline. RNAseq raw counts data of cancer and healthy tissue samples were downloaded
 Supplementary Figure 1. Metabolic landscape of cancer discovery pipeline. RNAseq raw counts data of cancer and healthy tissue samples were downloaded from TCGA and differentially expressed metabolic genes
SUPPLEMENTARY INFORMATION
 DOI: 10.1038/ncb2607 Figure S1 Elf5 loss promotes EMT in mammary epithelium while Elf5 overexpression inhibits TGFβ induced EMT. (a, c) Different confocal slices through the Z stack image. (b, d) 3D rendering
Nature Immunology: doi: /ni Supplementary Figure 1. DNA-methylation machinery is essential for silencing of Cd4 in cytotoxic T cells.
 Supplementary Figure 1 DNA-methylation machinery is essential for silencing of Cd4 in cytotoxic T cells. (a) Scheme for the retroviral shrna screen. (b) Histogram showing CD4 expression (MFI) in WT cytotoxic
Supplemental Figure 1. Genes showing ectopic H3K9 dimethylation in this study are DNA hypermethylated in Lister et al. study.
 mc mc mc mc SUP mc mc Supplemental Figure. Genes showing ectopic HK9 dimethylation in this study are DNA hypermethylated in Lister et al. study. Representative views of genes that gain HK9m marks in their
omiras: MicroRNA regulation of gene expression
 omiras: MicroRNA regulation of gene expression Sören Müller, Goethe University of Frankfurt am Main Molecular Bioinformatics Group, Institute of Computer Science Plant Molecular Biology Group, Institute
Supplementary Materials for
 www.sciencesignaling.org/cgi/content/full/8/375/ra41/dc1 Supplementary Materials for Actin cytoskeletal remodeling with protrusion formation is essential for heart regeneration in Hippo-deficient mice
Supplementary Figures
 Supplementary Figures Supplementary Figure 1. Pan-cancer analysis of global and local DNA methylation variation a) Variations in global DNA methylation are shown as measured by averaging the genome-wide
SUPPLEMENTARY INFORMATION
 DOI: 1.138/ncb3355 a S1A8 + cells/ total.1.8.6.4.2 b S1A8/?-Actin c % T-cell proliferation 3 25 2 15 1 5 T cells Supplementary Figure 1 Inter-tumoral heterogeneity of MDSC accumulation in mammary tumor
Nature Immunology: doi: /ni Supplementary Figure 1 33,312. Aire rep 1. Aire rep 2 # 44,325 # 44,055. Aire rep 1. Aire rep 2.
 a 33,312 b rep 1 rep 1 # 44,325 rep 2 # 44,055 [0-84] rep 2 [0-84] 1810043G02Rik Pfkl Dnmt3l Icosl rep 1 [0-165] rep 2 [0-165] Rps14 Cd74 Mir5107 Tcof1 rep 1 [0-69] rep 2 [0-68] Id3 E2f2 Asap3 rep 1 [0-141]
Supplementary Figures
 Supplementary Figures Supplementary Figure 1 Characterization of stable expression of GlucB and sshbira in the CT26 cell line (a) Live cell imaging of stable CT26 cells expressing green fluorescent protein
Nature Structural & Molecular Biology: doi: /nsmb.2419
 Supplementary Figure 1 Mapped sequence reads and nucleosome occupancies. (a) Distribution of sequencing reads on the mouse reference genome for chromosome 14 as an example. The number of reads in a 1 Mb
Fig. S1. Validation of ChIP-seq binding sites by single gene ChIP-PCR Fig. S2. Transactivation potential of PPAR
 Fig. S1. Validation of ChIP-seq binding sites by single gene ChIP-PCR ChIP-PCR was performed on PPARγ and RXR-enriched chromatin harvested during adipocyte differentiation at day and day 6 as described
Supplemental Figure S1. Expression of Cirbp mrna in mouse tissues and NIH3T3 cells.
 SUPPLEMENTAL FIGURE AND TABLE LEGENDS Supplemental Figure S1. Expression of Cirbp mrna in mouse tissues and NIH3T3 cells. A) Cirbp mrna expression levels in various mouse tissues collected around the clock
The 16th KJC Bioinformatics Symposium Integrative analysis identifies potential DNA methylation biomarkers for pan-cancer diagnosis and prognosis
 The 16th KJC Bioinformatics Symposium Integrative analysis identifies potential DNA methylation biomarkers for pan-cancer diagnosis and prognosis Tieliu Shi tlshi@bio.ecnu.edu.cn The Center for bioinformatics
Nature Genetics: doi: /ng Supplementary Figure 1. SEER data for male and female cancer incidence from
 Supplementary Figure 1 SEER data for male and female cancer incidence from 1975 2013. (a,b) Incidence rates of oral cavity and pharynx cancer (a) and leukemia (b) are plotted, grouped by males (blue),
Inferring condition-specific mirna activity from matched mirna and mrna expression data
 Inferring condition-specific mirna activity from matched mirna and mrna expression data Junpeng Zhang 1, Thuc Duy Le 2, Lin Liu 2, Bing Liu 3, Jianfeng He 4, Gregory J Goodall 5 and Jiuyong Li 2,* 1 Faculty
File Name: Supplementary Information Description: Supplementary Figures and Supplementary Tables. File Name: Peer Review File Description:
 File Name: Supplementary Information Description: Supplementary Figures and Supplementary Tables File Name: Peer Review File Description: Primer Name Sequence (5'-3') AT ( C) RT-PCR USP21 F 5'-TTCCCATGGCTCCTTCCACATGAT-3'
SUPPLEMENTARY INFORMATION
 doi:.38/nature8975 SUPPLEMENTAL TEXT Unique association of HOTAIR with patient outcome To determine whether the expression of other HOX lincrnas in addition to HOTAIR can predict patient outcome, we measured
starbase Pan-Cancer Tutorial
 starbase Pan-Cancer Tutorial 2010-2013, Jianhua Yang at Sun Yat-sen University For comments, suggestions on the starbase platform, please contact us: lsp03yjh@gmail.com On commercial use, contact: yangjh7@mail.sysu.edu.cn
SUPPLEMENTAL FILE. mir-22 and mir-29a are members of the androgen receptor cistrome modulating. LAMC1 and Mcl-1 in prostate cancer
 1 SUPPLEMENTAL FILE 2 3 mir-22 and mir-29a are members of the androgen receptor cistrome modulating LAMC1 and Mcl-1 in prostate cancer 4 5 6 Lorenza Pasqualini 1, Huajie Bu 1,2, Martin Puhr 1, Narisu Narisu
Nature Structural & Molecular Biology: doi: /nsmb Supplementary Figure 1. Differential expression of mirnas from the pri-mir-17-92a locus.
 Supplementary Figure 1 Differential expression of mirnas from the pri-mir-17-92a locus. (a) The mir-17-92a expression unit in the third intron of the host mir-17hg transcript. (b,c) Impact of knockdown
ONLINE SUPPLEMENTAL INFORMATION
 1 ONLINE SUPPLEMENTAL INFORMATION Small trna-derived RNAs are increased and more abundant than micrornas in chronic hepatitis B and C Sara R. Selitsky 1-3, Jeanette Baran-Gale 1,2, Masao Honda 4, Daisuke
HALLA KABAT * Outreach Program, mircore, 2929 Plymouth Rd. Ann Arbor, MI 48105, USA LEO TUNKLE *
 CERNA SEARCH METHOD IDENTIFIED A MET-ACTIVATED SUBGROUP AMONG EGFR DNA AMPLIFIED LUNG ADENOCARCINOMA PATIENTS HALLA KABAT * Outreach Program, mircore, 2929 Plymouth Rd. Ann Arbor, MI 48105, USA Email:
Nature Genetics: doi: /ng Supplementary Figure 1. Assessment of sample purity and quality.
 Supplementary Figure 1 Assessment of sample purity and quality. (a) Hematoxylin and eosin staining of formaldehyde-fixed, paraffin-embedded sections from a human testis biopsy collected concurrently with
A prostate cancer susceptibility allele at 6q22 increases RFX6 expression by modulating HOXB13 chromatin binding
 Supplementary Information A prostate cancer susceptibility allele at 6q22 increases RFX6 expression by modulating HOXB13 chromatin binding Qilai Huang 1,2*, Thomas Whitington 3,4*, Ping Gao 1,2, Johan
Nature Immunology: doi: /ni Supplementary Figure 1. Transcriptional program of the TE and MP CD8 + T cell subsets.
 Supplementary Figure 1 Transcriptional program of the TE and MP CD8 + T cell subsets. (a) Comparison of gene expression of TE and MP CD8 + T cell subsets by microarray. Genes that are 1.5-fold upregulated
Supplementary Figure 1: High-throughput profiling of survival after exposure to - radiation. (a) Cells were plated in at least 7 wells in a 384-well
 Cells were plated in at least 7 wells in a 384-well") Supplementary Figure 1: High-throughput profiling of survival after exposure to - radiation. (a) Cells were plated in at least 7 wells in a 384-well plate at cell densities ranging from 25-225 cells in
Supplementary Figure 1: High-throughput profiling of survival after exposure to - radiation. (a) Cells were plated in at least 7 wells in a 384-well plate at cell densities ranging from 25-225 cells in
Nature Genetics: doi: /ng.3731
 Supplementary Figure 1 Circadian profiles of Adarb1 transcript and ADARB1 protein in mouse tissues. (a) Overlap of rhythmic transcripts identified in the previous transcriptome analyses. The mouse liver
Nature Genetics: doi: /ng Supplementary Figure 1. Phenotypic characterization of MES- and ADRN-type cells.
 Supplementary Figure 1 Phenotypic characterization of MES- and ADRN-type cells. (a) Bright-field images showing cellular morphology of MES-type (691-MES, 700-MES, 717-MES) and ADRN-type (691-ADRN, 700-
SUPPLEMENTARY FIGURES
 SUPPLEMENTARY FIGURES Figure S1. Clinical significance of ZNF322A overexpression in Caucasian lung cancer patients. (A) Representative immunohistochemistry images of ZNF322A protein expression in tissue
Supplemental Figure S1. A. Venn diagram depicting overlap between anti-correlated genes of
 Supplemental Figure S1. A. Venn diagram depicting overlap between anti-correlated genes of 1,000 most differentially expressed genes with NKX2-1 amplification in lung adenocarcinoma cell lines and anti-correlated
SUPPLEMENTARY INFORMATION
 doi:10.1038/nature10866 a b 1 2 3 4 5 6 7 Match No Match 1 2 3 4 5 6 7 Turcan et al. Supplementary Fig.1 Concepts mapping H3K27 targets in EF CBX8 targets in EF H3K27 targets in ES SUZ12 targets in ES
EPIGENOMICS PROFILING SERVICES
 EPIGENOMICS PROFILING SERVICES Chromatin analysis DNA methylation analysis RNA-seq analysis Diagenode helps you uncover the mysteries of epigenetics PAGE 3 Integrative epigenomics analysis DNA methylation
microrna PCR System (Exiqon), following the manufacturer s instructions. In brief, 10ng of
, following the manufacturer s instructions. In brief, 10ng of") SUPPLEMENTAL MATERIALS AND METHODS Quantitative RT-PCR Quantitative RT-PCR analysis was performed using the Universal mircury LNA TM microrna PCR System (Exiqon), following the manufacturer s instructions.
SUPPLEMENTAL MATERIALS AND METHODS Quantitative RT-PCR Quantitative RT-PCR analysis was performed using the Universal mircury LNA TM microrna PCR System (Exiqon), following the manufacturer s instructions.
Supplementary Figure 1
 Supplementary Figure 1 Asymmetrical function of 5p and 3p arms of mir-181 and mir-30 families and mir-142 and mir-154. (a) Control experiments using mirna sensor vector and empty pri-mirna overexpression
Lentiviral Delivery of Combinatorial mirna Expression Constructs Provides Efficient Target Gene Repression.
 Supplementary Figure 1 Lentiviral Delivery of Combinatorial mirna Expression Constructs Provides Efficient Target Gene Repression. a, Design for lentiviral combinatorial mirna expression and sensor constructs.
sirna count per 50 kb small RNAs matching the direct strand Repeat length (bp) per 50 kb repeats in the chromosome
 per 50 kb repeats in the chromosome") Qi et al. 26-3-2564C Qi et al., Figure S1 sirna count per 5 kb small RNAs matching the direct strand sirna count per 5 kb small RNAs matching the complementary strand Repeat length (bp) per 5 kb repeats
Qi et al. 26-3-2564C Qi et al., Figure S1 sirna count per 5 kb small RNAs matching the direct strand sirna count per 5 kb small RNAs matching the complementary strand Repeat length (bp) per 5 kb repeats
Supplementary information for: Human micrornas co-silence in well-separated groups and have different essentialities
 Supplementary information for: Human micrornas co-silence in well-separated groups and have different essentialities Gábor Boross,2, Katalin Orosz,2 and Illés J. Farkas 2, Department of Biological Physics,
Computational Analysis of UHT Sequences Histone modifications, CAGE, RNA-Seq
 Computational Analysis of UHT Sequences Histone modifications, CAGE, RNA-Seq Philipp Bucher Wednesday January 21, 2009 SIB graduate school course EPFL, Lausanne ChIP-seq against histone variants: Biological
Circular RNAs (circrnas) act a stable mirna sponges
 act a stable mirna sponges") Circular RNAs (circrnas) act a stable mirna sponges cernas compete for mirnas Ancestal mrna (+3 UTR) Pseudogene RNA (+3 UTR homolgy region) The model holds true for all RNAs that share a mirna binding
Circular RNAs (circrnas) act a stable mirna sponges cernas compete for mirnas Ancestal mrna (+3 UTR) Pseudogene RNA (+3 UTR homolgy region) The model holds true for all RNAs that share a mirna binding
The mir-199a/brm/egr1 axis is a determinant of anchorage-independent growth in epithelial tumor cell lines
 Supplementary information Supplementary Figure -9 Supplementary Table -4 The mir-99a/brm/egr axis is a determinant of anchorage-independent growth in epithelial tumor cell lines Kazuyoshi Kobayashi, Kouhei
User Guide. Association analysis. Input
 User Guide TFEA.ChIP is a tool to estimate transcription factor enrichment in a set of differentially expressed genes using data from ChIP-Seq experiments performed in different tissues and conditions.
Nature Immunology: doi: /ni Supplementary Figure 1. Characteristics of SEs in T reg and T conv cells.
 Supplementary Figure 1 Characteristics of SEs in T reg and T conv cells. (a) Patterns of indicated transcription factor-binding at SEs and surrounding regions in T reg and T conv cells. Average normalized
Supplementary Figure 1 (Related with Figure 4). Molecular consequences of Eed deletion. (a) ChIP analysis identifies 3925 genes that are associated
. Molecular consequences of Eed deletion. (a) ChIP analysis identifies 3925 genes that are associated") Supplementary Figure 1 (Related with Figure 4). Molecular consequences of Eed deletion. (a) ChIP analysis identifies 3925 genes that are associated with the H3K27me3 mark in chondrocytes (see Table S1,
Supplementary Figure 1 (Related with Figure 4). Molecular consequences of Eed deletion. (a) ChIP analysis identifies 3925 genes that are associated with the H3K27me3 mark in chondrocytes (see Table S1,
SUPPLEMENTARY FIGURES
 SUPPLEMENTARY FIGURES 1 Supplementary Figure 1, Adult hippocampal QNPs and TAPs uniformly express REST a-b) Confocal images of adult hippocampal mouse sections showing GFAP (green), Sox2 (red), and REST
Lung Met 1 Lung Met 2 Lung Met Lung Met H3K4me1. Lung Met H3K27ac Primary H3K4me1
 a Gained Met-VELs 1.5 1.5 -.5 Lung Met 1 Lung Met Lung Met 3 1. Lung Met H3K4me1 Lung Met H3K4me1 1 Lung Met H3K4me1 Lung Met H3K7ac 1.5 Lung Met H3K7ac Lung Met H3K7ac.8 Primary H3K4me1 Primary H3K7ac
Sudin Bhattacharya Institute for Integrative Toxicology
 Beyond the AHRE: the Role of Epigenomics in Gene Regulation by the AHR (or, Varied Applications of Computational Modeling in Toxicology and Ingredient Safety) Sudin Bhattacharya Institute for Integrative
Supplementary Materials for
 www.sciencesignaling.org/cgi/content/full/7/310/ra11/dc1 Supplementary Materials for STAT3 Induction of mir-146b Forms a Feedback Loop to Inhibit the NF-κB to IL-6 Signaling Axis and STAT3-Driven Cancer
BWA alignment to reference transcriptome and genome. Convert transcriptome mappings back to genome space
 Whole genome sequencing Whole exome sequencing BWA alignment to reference transcriptome and genome Convert transcriptome mappings back to genome space genomes Filter on MQ, distance, Cigar string Annotate
Supplemental Data. Integrating omics and alternative splicing i reveals insights i into grape response to high temperature
 Supplemental Data Integrating omics and alternative splicing i reveals insights i into grape response to high temperature Jianfu Jiang 1, Xinna Liu 1, Guotian Liu, Chonghuih Liu*, Shaohuah Li*, and Lijun
SUPPLEMENTARY INFORMATION
 -. -. SUPPLEMENTARY INFORMATION DOI: 1.1/ncb86 a WAT-1 WAT- BAT-1 BAT- sk-muscle-1 sk-muscle- mir-133b mir-133a mir-6 mir-378 mir-1 mir-85 mir-378 mir-6a mir-18 mir-133a mir- mir- mir-341 mir-196a mir-17
Effects of UBL5 knockdown on cell cycle distribution and sister chromatid cohesion
 Supplementary Figure S1. Effects of UBL5 knockdown on cell cycle distribution and sister chromatid cohesion A. Representative examples of flow cytometry profiles of HeLa cells transfected with indicated
SUPPLEMENTAY FIGURES AND TABLES
 SUPPLEMENTAY FIGURES AND TABLES Supplementary Figure S1: Validation of mir expression by quantitative real-time PCR and time course studies on mir- 29a-3p and mir-210-3p. A. The graphs illustrate the expression
mirna Dr. S Hosseini-Asl
 mirna Dr. S Hosseini-Asl 1 2 MicroRNAs (mirnas) are small noncoding RNAs which enhance the cleavage or translational repression of specific mrna with recognition site(s) in the 3 - untranslated region
Transcription factor p63 bookmarks and regulates dynamic enhancers during epidermal differentiation
 Published online: June 1, 15 Article Transcription factor p63 bookmarks and regulates dynamic enhancers during epidermal differentiation Evelyn N Kouwenhoven 1,, Martin Oti, Hanna Niehues 3, Simon J van
m 6 A mrna methylation regulates AKT activity to promote the proliferation and tumorigenicity of endometrial cancer
 SUPPLEMENTARY INFORMATION Articles https://doi.org/10.1038/s41556-018-0174-4 In the format provided by the authors and unedited. m 6 A mrna methylation regulates AKT activity to promote the proliferation
Supplementary Figures
 Supplementary Figures Supplementary Figure 1. Heatmap of GO terms for differentially expressed genes. The terms were hierarchically clustered using the GO term enrichment beta. Darker red, higher positive
TEB. Id4 p63 DAPI Merge. Id4 CK8 DAPI Merge
 a Duct TEB b Id4 p63 DAPI Merge Id4 CK8 DAPI Merge c d e Supplementary Figure 1. Identification of Id4-positive MECs and characterization of the Comma-D model. (a) IHC analysis of ID4 expression in the
EPIGENETIC RE-EXPRESSION OF HIF-2α SUPPRESSES SOFT TISSUE SARCOMA GROWTH
 EPIGENETIC RE-EXPRESSION OF HIF-2α SUPPRESSES SOFT TISSUE SARCOMA GROWTH Supplementary Figure 1. Supplementary Figure 1. Characterization of KP and KPH2 autochthonous UPS tumors. a) Genotyping of KPH2
Supplementary Figure 1. Spitzoid Melanoma with PPFIBP1-MET fusion. (a) Histopathology (4x) shows a domed papule with melanocytes extending into the
 Histopathology (4x) shows a domed papule with melanocytes extending into the") Supplementary Figure 1. Spitzoid Melanoma with PPFIBP1-MET fusion. (a) Histopathology (4x) shows a domed papule with melanocytes extending into the deep dermis. (b) The melanocytes demonstrate abundant
Supplementary Figure 1. Spitzoid Melanoma with PPFIBP1-MET fusion. (a) Histopathology (4x) shows a domed papule with melanocytes extending into the deep dermis. (b) The melanocytes demonstrate abundant
MRC-Holland MLPA. Description version 06; 23 December 2016
 SALSA MLPA probemix P417-B2 BAP1 Lot B2-1216. As compared to version B1 (lot B1-0215), two reference probes have been added and two target probes have a minor change in length. The BAP1 (BRCA1 associated
Broad H3K4me3 is associated with increased transcription elongation and enhancer activity at tumor suppressor genes
 Broad H3K4me3 is associated with increased transcription elongation and enhancer activity at tumor suppressor genes Kaifu Chen 1,2,3,4,5,10, Zhong Chen 6,10, Dayong Wu 6, Lili Zhang 7, Xueqiu Lin 1,2,8,
underlying metastasis and recurrence in HNSCC, we analyzed two groups of patients. The
 Supplementary Figures Figure S1. Patient cohorts and study design. To define and interrogate the genetic alterations underlying metastasis and recurrence in HNSCC, we analyzed two groups of patients. The
Nature Structural & Molecular Biology: doi: /nsmb Supplementary Figure 1
 Supplementary Figure 1 U1 inhibition causes a shift of RNA-seq reads from exons to introns. (a) Evidence for the high purity of 4-shU-labeled RNAs used for RNA-seq. HeLa cells transfected with control
HIF-inducible mir-191 promotes migration in breast cancer through complex regulation of TGFβ-signaling in hypoxic microenvironment.
 HIF-inducible mir-9 promotes migration in breast cancer through complex regulation of TGFβ-signaling in hypoxic microenvironment. Neha Nagpal, Hafiz M Ahmad, Shibu Chameettachal3, Durai Sundar, Sourabh
Functional characterisation of hepatitis B viral X protein/microrna-21 interaction in HBVassociated hepatocellular carcinoma
 RESEARCH FUND FOR THE CONTROL OF INFECTIOUS DISEASES Functional characterisation of hepatitis B viral X protein/microrna-21 interaction in HBVassociated hepatocellular carcinoma CH Li, SC Chow, DL Yin,
mir-509-5p and mir-1243 increase the sensitivity to gemcitabine by inhibiting
 mir-509-5p and mir-1243 increase the sensitivity to gemcitabine by inhibiting epithelial-mesenchymal transition in pancreatic cancer Hidekazu Hiramoto, M.D. 1,3, Tomoki Muramatsu, Ph.D. 1, Daisuke Ichikawa,
Discovery of Novel Human Gene Regulatory Modules from Gene Co-expression and
 Discovery of Novel Human Gene Regulatory Modules from Gene Co-expression and Promoter Motif Analysis Shisong Ma 1,2*, Michael Snyder 3, and Savithramma P Dinesh-Kumar 2* 1 School of Life Sciences, University
H3K4 demethylase KDM5B regulates global dynamics of transcription elongation and alternative splicing in embryonic stem cells
 Nucleic Acids Research, 2017 1 doi: 10.1093/nar/gkx251 H3K4 demethylase KDM5B regulates global dynamics of transcription elongation and alternative splicing in embryonic stem cells Runsheng He 1,2 and
injected subcutaneously into flanks of 6-8 week old athymic male nude mice (LNCaP SQ) and body
 and body") SUPPLEMENTAL FIGURE LEGENDS Figure S1: Generation of ENZR Xenografts and Cell Lines: (A) 1x10 6 LNCaP cells in matrigel were injected subcutaneously into flanks of 6-8 week old athymic male nude mice (LNCaP
SUPPLEMENTAL FIGURE LEGENDS Figure S1: Generation of ENZR Xenografts and Cell Lines: (A) 1x10 6 LNCaP cells in matrigel were injected subcutaneously into flanks of 6-8 week old athymic male nude mice (LNCaP
Functional genomics reveal that the serine synthesis pathway is essential in breast cancer
 Functional genomics reveal that the serine synthesis pathway is essential in breast cancer Results Presented by Stacey Lin Lloyd Lab http://www.amsbio.com/expression-ready-lentiviral-particles.aspx Overview
of TERT, MLL4, CCNE1, SENP5, and ROCK1 on tumor development were discussed.
 Supplementary Note The potential association and implications of HBV integration at known and putative cancer genes of TERT, MLL4, CCNE1, SENP5, and ROCK1 on tumor development were discussed. Human telomerase
EXPression ANalyzer and DisplayER
 EXPression ANalyzer and DisplayER Tom Hait Aviv Steiner Igor Ulitsky Chaim Linhart Amos Tanay Seagull Shavit Rani Elkon Adi Maron-Katz Dorit Sagir Eyal David Roded Sharan Israel Steinfeld Yossi Shiloh
On the Reproducibility of TCGA Ovarian Cancer MicroRNA Profiles
 On the Reproducibility of TCGA Ovarian Cancer MicroRNA Profiles Ying-Wooi Wan 1,2,4, Claire M. Mach 2,3, Genevera I. Allen 1,7,8, Matthew L. Anderson 2,4,5 *, Zhandong Liu 1,5,6,7 * 1 Departments of Pediatrics
Supplementary Figure 1 ITGB1 and ITGA11 increase with evidence for heterodimers following HSC activation. (a) Time course of rat HSC activation
 Time course of rat HSC activation") Supplementary Figure 1 ITGB1 and ITGA11 increase with evidence for heterodimers following HSC activation. (a) Time course of rat HSC activation indicated by the detection of -SMA and COL1 (log scale).
Supplementary Figure 1 ITGB1 and ITGA11 increase with evidence for heterodimers following HSC activation. (a) Time course of rat HSC activation indicated by the detection of -SMA and COL1 (log scale).
Supplemental Figure S1. PLAG1 kidneys contain fewer glomeruli (A) Quantitative PCR for Igf2 and PLAG1 in whole kidneys taken from mice at E15.
 Quantitative PCR for Igf2 and PLAG1 in whole kidneys taken from mice at E15.") Supplemental Figure S1. PLAG1 kidneys contain fewer glomeruli (A) Quantitative PCR for Igf2 and PLAG1 in whole kidneys taken from mice at E15.5, E18.5, P4, and P8. Values shown are means from four technical
Supplemental Figure S1. PLAG1 kidneys contain fewer glomeruli (A) Quantitative PCR for Igf2 and PLAG1 in whole kidneys taken from mice at E15.5, E18.5, P4, and P8. Values shown are means from four technical
SUPPLEMENTARY INFORMATION
 doi:10.1038/nature12652 Supplementary Figure 1. PRDM16 interacts with endogenous EHMT1 in brown adipocytes. Immunoprecipitation of PRDM16 complex by flag antibody (M2) followed by Western blot analysis
Supplementary Figure 1. mir124 does not change neuron morphology and synaptic
 Supplementary Figure 1. mir124 does not change neuron morphology and synaptic density. Hippocampal neurons were transfected with mir124 (containing DsRed) or DsRed as a control. 2 d after transfection,
Supplemental Information. Genomic Characterization of Murine. Monocytes Reveals C/EBPb Transcription. Factor Dependence of Ly6C Cells
 Immunity, Volume 46 Supplemental Information Genomic Characterization of Murine Monocytes Reveals C/EBPb Transcription Factor Dependence of Ly6C Cells Alexander Mildner, Jörg Schönheit, Amir Giladi, Eyal
microrna Presented for: Presented by: Date:
 microrna Presented for: Presented by: Date: 2 micrornas Non protein coding, endogenous RNAs of 21-22nt length Evolutionarily conserved Regulate gene expression by binding complementary regions at 3 regions
Supplementary Figure 1. HeliScope CAGE revealed androgen-regulated signaling and differentially regulated promoters in hormone-refractory prostate
 Supplementary Figure 1. HeliScope CAGE revealed androgen-regulated signaling and differentially regulated promoters in hormone-refractory prostate cancer cells. (a) Cell proliferation of BicR cells in
Supplementary Fig. S1. Schematic diagram of minigenome segments.
 open reading frame 1565 (segment 5) 47 (-) 3 5 (+) 76 101 125 149 173 197 221 246 287 open reading frame 890 (segment 8) 60 (-) 3 5 (+) 172 Supplementary Fig. S1. Schematic diagram of minigenome segments.
Delacroix et al Renal effects of renal denervation Supplementary Figure 1: Changes in Ambulatory Blood Pressures and Heart Rate
 Supplementary Figure 1: Changes in Ambulatory Blood Pressures and Heart Rate Supplementary Table 1: Ranking each patient based on the number of measurements showing a numerical improvement. Rank at each
ACK1 Tyrosine Kinases: A Critical Regulator of Prostate Cancer
 ACK1 Tyrosine Kinases: A Critical Regulator of Prostate Cancer Nupam Mahajan Moffitt Cancer Center Learners Objectives How Androgen Receptor (AR) signaling is accomplished in absence of androgen What are
STAT1 regulates microrna transcription in interferon γ stimulated HeLa cells
 CAMDA 2009 October 5, 2009 STAT1 regulates microrna transcription in interferon γ stimulated HeLa cells Guohua Wang 1, Yadong Wang 1, Denan Zhang 1, Mingxiang Teng 1,2, Lang Li 2, and Yunlong Liu 2 Harbin
Supplementary Figure 1. A. Bar graph representing the expression levels of the 19 indicated genes in the microarrays analyses comparing human lung
 Supplementary Figure 1. A. Bar graph representing the expression levels of the 19 indicated genes in the microarrays analyses comparing human lung immortalized broncho-epithelial cells (AALE cells) expressing