Keating, Garret L.; Reid, Helen M.; Eivers, Sarah B.; Mulvaney, Eamon P.; Kinsella, B. Therese.
|
|
|
- Nora Hudson
- 6 years ago
- Views:
Transcription
1 Provided by the author(s) and University College Dublin Library in accordance with publisher policies. Please cite the published version when available. Title Author(s) Transcriptional regulation of the human thromboxane A2 receptor gene by Wilms' tumor (WT)1 and hypermethylated in cancer (HIC) 1 in prostate and breast cancers Keating, Garret L.; Reid, Helen M.; Eivers, Sarah B.; Mulvaney, Eamon P.; Kinsella, B. Therese Publication date Publication information Biochimica Biophysica Acta (Gene Regulator Mechanisms), 1839 (6): Publisher Elsevier Item record/more information Publisher's statement Publisher's version (DOI) This is the author s version of a work that was accepted for publication in Biochimica Biophysica Acta (Gene Regulator Mechanisms). Changes resulting from the publishing process, such as peer review, editing, corrections, structural formatting, and other quality control mechanisms may not be reflected in this document. Changes may have been made to this work since it was submitted for publication. A definitive version was subsequently published in Biochimica Biophysica Acta (Gene Regulator Mechanisms) (VOL1839, ISSUE 6, (2014)) DOI: /j.bbagrm Downloaded T16:02:11Z The UCD community has made this article openly available. Please share how this access benefits you. Your story matters! (@ucd_oa) Some rights reserved. For more information, please see the item record link above.
2
3 Transcriptional Regulation of the Human Thomboxane A 2 Receptor Gene by Wilms tumor (WT)1 and hypermethylated in cancer (HIC) 1 in Prostate and Breast Cancers Garret L. Keating*, Helen M. Reid*, Sarah B. Eivers, Eamon P. Mulvaney and B. Therese Kinsella UCD School of Biomolecular and Biomedical Sciences, UCD Conway Institute of Biomolecular and Biomedical Research, University College Dublin, Belfield, Dublin 4, Ireland. *These authors contributed equally to this work Corresponding author: Tel: ; Fax ; Therese.Kinsella@UCD.IE Running Title: Regulation of the Thomboxane Receptor Gene Key Words: Thomboxane receptor, Gene, Wilms tumor 1, Hypermethylated in cancer 1, Prostate, Breast, Cancer. Abbreviations: ChIP, chomatin immunoprecipitation; FBS, fetal bovine serum; HEL, human erytholeukemia; HP, horse radish peroxidase; IHC, immunohistochemistry; PBS, phosphate-buffered saline; pgl3b, pgl3basic; PRK, protein kinase C-related kinase; prl-tk, prl-thymidine kinase; qrt-pcr, quantitative reverse-transcriptase-polymerase chain reaction; RLU, relative luciferase unit; RR, repressor region; SDM, site-directed mutagenesis; TP, Thomboxane A 2 Receptor; TX, thomboxane; TXS, TXA synthase; UAR, upstream activator region; URR, upstream repressor region. Abstract: The prostanoid thomboxane (TX) A 2 plays a central role in hemostasis and is increasingly implicated in neoplastic disease, including prostate and breast cancers. In humans, TXA 2 signals though the TP and TP isoforms of the T prostanoid receptor, two structurally related receptors transcriptionally regulated by distinct promoters, Prm1 and Prm3, respectively, within the TP gene. Focusing on TP, the current study investigated its expression and transcriptional regulation though Prm1 in prostate and breast cancers. Expression of TPα correlated with increasing prostate and breast tissue tumor grade while the TXA 2 mimetic U46619 promoted both proliferation and migration of the respective prostate (PC3) and breast (MCF-7 and MDA-MD-231) derived-carcinoma cell lines. Though 5 deletional and genetic reporter analyses, several functional upstream repressor regions (URRs) were identified within Prm1 in PC3, MCF-7 and MDA-MB-231 cells while site-directed mutagenesis identified the tumor suppressors Wilms tumor (WT)1 and hypermethylated in cancer (HIC) 1 as the trans-acting factors regulating those repressor regions. Chomatin immunoprecipitation (ChIP) studies confirmed that WT1 binds in vivo to multiple GC-enriched WT1 cis-elements within the URRs of Prm1 in PC3, MCF-7 and MDA-MB-231 cells. Furthermore, ChIP analyses established that HIC1 binds in vivo to the HIC1 (b) cis-element within Prm1 in PC3 and MCF-7 cells but not in the MDA-MB-231 carcinoma line. Collectively, these data establish that WT1 and HIC1, both tumor suppressors implicated in prostate and breast cancers, transcriptionally repress TPα expression and thereby provide a strong genetic basis for understanding the role of TXA 2 in the progression of certain human cancers. Highlights: Upregulation of the thomboxane receptor (the TP) in prostate and breast cancers Mechanism of transcriptional regulation of TP isoform expression identified Several shared upstream regulatory regions identified in promoter 1 of the TP gene WT1 and HIC1 bind cis-elements in the shared URRs to repress TP gene expression Several tissue-specific upstream regulatory regions identified in promoter 1 Page 1 of 34
4 1. INTRODUCTION The prostanoid thomboxane (TX)A 2, synthesized from arachidonic acid though the sequential actions of cyclooxygenase (COX)-1/2 and TXA synthase (TXS), plays an essential role in hemostasis regulating platelet activation status and blood vessel tone [1]. It also induces constriction of various other types of smooth muscle (e.g lung, kidney, prostate) and promotes vascular smooth muscle cell proliferation and migration, contributing to restenosis following endothelial injury [2-4]. Hence, perturbations in the levels of TXA 2 or of its synthase (TXS) or of its receptor, the T Prostanoid receptor, contribute to several cardiovascular, pulmonary and renal pathologies [1-3]. In humans and other primates, the T Prostanoid receptor or, in short, the TP exists as two structurally related isoforms referred to as TPα and TPβ, which differ exclusively in their C-terminal domains [5]. While TP and TP are encoded by the same TP gene (the TBXA2R), they are differentially expressed in a range of cell/tissue types and are thought to be transcriptionally regulated by two distinct promoters designated Prm1 and Prm3, respectively [6-9]. Functionally, TPα and TPβ both couple to Gαq-mediated phospholipase Cβ, to Gα12-mediated RhoA and to ERK activation [5, 10-13] but are subject to distinct mechanisms of both agonist-induced homologous [14, 15] and heterologous [16-18] desensitization to differentially regulate their signaling. Hence, TP and TP have not only common, over-lapping but also unique patterns of expression and functional roles to mediate the (patho)physiologic actions of the potent autocoid TXA 2 in human health and disease. In addition to its actions within the vasculature, there has been increasing evidence supporting the role of TXA 2, its synthase (TXS) and/or the TP /TP isoforms in several neoplasms including in bladder, brain, breast, colon, lung, prostate and renal cancers [19, 20]. This is strengthened by findings from several longitudinal studies showing that long-term use of the COX-1/2 inhibitor Aspirin reduces the risk of many common cancers, including colon lung, esophagus and prostate cancers [21-27]. While those longitudinal studies did not specify which COX-derived metabolite(s) is implicated in such prophylactic benefits of Aspirin in cancer prevention, there is significant evidence to support the role of TXA 2 in tumor progression and metastasis [19, 20]. Genome-association studies indicate that certain single-nucleotide polymorphisms (SNPs) identified within the TXS gene may predispose individuals to the development of breast cancer [28]. Increased levels of TXA 2 and expression of TXS and of the TP /TP isoforms have been strongly correlated with bladder cancer [29] and non-small cell lung cancer [30]. In addition, over-expression of TP in lung A549 cells greatly promotes adenocarcinoma tumor growth and neovascularization/angiogenesis in athymic nude mice [31], while inhibition of TXS activity enhances apoptosis of A549 cells in vitro, implicating a role for TXA 2 also in tumor cell survival [30]. In the prostate, increased expression of TXS and of the TP /TP isoforms directly correlates with tumor Gleason score and pathologic stage [32-34], where expression of both the synthase and receptor localize predominantly to areas of perineural invasion, a mechanism by which prostate cancer (PCa) cells penetrate the prostatic capsule and spread to other tissues [19, 32]. Moreover, studies carried out in vitro showed that TXA 2 -induced prostate PC3 tumor cell motility occurs though a RhoA dependent mechanism and is effectively attenuated by either TXS inhibition or TP antagonism [32-34]. TP-mediated activation of G 12 /RhoA signaling has also been shown to promote both breast and prostate cancer cell migration and invasion [35, 36]. Significantly, in recent studies, it was discovered that both TPα and TPβ directly interact with and regulate the activity of protein kinase C-related kinase (PRK) 1, a Rho effector that also plays a key role in androgen receptor (AR)-mediated gene regulation in the prostate and other organs [37]. In fact, PRK1 has been dubbed a gate-keeper of androgen-driven PCa and, as such, is a key therapeutic target in androgen-responsive PCa, in serous ovarian carcinomas and in breast cancer [38, 39]. Identification of a direct, functional interaction of both TP and TP with PRK1 provides yet another molecular link accounting for the role of TXA 2 in tumor progression. Collectively, these and numerous other studies provide significant insights into the role of TXA 2 and of the TPs (TP /TP ) in cancer progression, including in prostate and breast cancer. However, few studies to date have investigated the roles of the individual TP isoforms while, to the best of our knowledge, no study has examined the transcriptional regulation of TP or TP in cancer. Herein, focusing on TP, the predominant isoform expressed in most cell/tissue types [9], the current study sought to investigate the expression and transcriptional regulation of TPα though Prm1 in prostate and breast cancer-derived cell lines. Though previous studies, Prm1 has been extensively characterized in the platelet progenitor megakaryoblastic human erytholeukemia (HEL) and K562 cell lines [8, 40, 41], where Sp1, EGR-1 and NF-E2 were identified as the key trans-acting factors that bind to the core promoter region to drive basal TP gene expression [8]. In addition, several upstream activator regions (UARs) and upstream repressor Page 2 of 34
5 regions (URRs) were identified within Prm1 [8]. While GATA-1, Ets-1, Ets-2 and Oct-1 were found to regulate the UARs, of significance in the context of cancer, the tumor suppressor gene product Wilms tumor (WT)1 was found to bind to several cis-elements within the repressor regions to repress Prm1/TP expression [40]. WT1 plays an important role in normal and aberrant hematopoiesis [42] and was initially described as a tumor suppressor protein in Wilms tumor, a rare inherited form of renal cancer [43-45]. However, WT1 can also play an oncogenic role in certain cancers [46-49]. In addition, though bioinformatic analysis to identify further novel binding elements within Prm1, two putative cis-elements for hypermethylated in cancer (HIC) 1, designated HIC1 (a) (at -6736) and HIC1 (b) (at -6214), were identified herein within the URR2 and RR3 or Prm1, respectively. HIC1 exerts tumor suppressor functions in several human cancers, including in prostate and breast cancer and leukemia [50-53]. Considering the roles of WT1 and HIC1 in prostate and breast cancer progression and as transcriptional repressors of Prm1-directed TPα expression in megakaryoblastic HEL cells, a principal aim of the current study was to investigate the possible regulation of Prm1 by WT1 and HIC1 in the model prostate PC3 and breast MCF-7 and MDA-MB-231 carcinoma cell lines, respectively. Several previously recognized and also novel, cell-specific regulatory regions were identified within Prm1 while it was also established that WT1 and HIC1 repress Prm1-directed TPα mrna expression in both the prostate and breast cancer-derived cells. Overall, this study provides a detailed molecular analysis of the factors regulating TPα expression though Prm1 in the prostate and breast, and suggests that aberrant regulation by/or dysfunction of WT1 and/or HIC1 tumor suppressors may account, at least in part, for the increased association of TXA 2 /TP signaling with certain prostate and breast cancers and, potentially, in other cancers in which TXA 2, WT1 and/or HIC1 are implicated. Page 3 of 34
6 2. MATERIALS AND METHODS 2.1. Materials The Dual Luciferase Reporter Assay System, pgl3basic (pgl3b), prl-thymidine Kinase (prl-tk) and M-MLV reverse transcriptase were from Promega. The Brilliant II SYBR Green QPCR reagent was from Agilent. DMRIE-C, Dulbecco s Modified Eagle Medium (DMEM; 4 g/l glucose), RPMI 1640 culture media, fetal bovine serum (FBS), L-glutamine and TRIzol were from Invitrogen. Effectene was from Qiagen. Anti-WT1 (sc-192 X), anti-hic1 (sc X), normal rabbit IgG (sc-2027), biotinylated goat antirabbit (sc-2040), goat anti-rabbit horseradish peroxidase (HP; sc-2004) and goat anti-mouse HP (sc-2005) antibodies were from Santa Cruz Biotechnology. Anti-HDJ-2 antibody (MS225 P1ABX) was from Neomarkers. The Avidin/Biotin Blocking kit was from Vector Labs. Streptavidin horseradish peroxidase (HP) and 3,3 -diaminobenzidine (DAB) was from Sigma. All oligonucleotides were synthesized by Sigma- Genosys. All sirna reagents were obtained from Qiagen or Thermo Scientific. pcdna3:wt1 (+/-) and pcdna3:wt1 (-/-) [54] and pcdna3.1:hic1 [55] were kindly provided by Dr. CT. Roberts JR, Oregon National Primate Research Center, USA and Prof. D LePrince, Université Lille, France, respectively Mammalian Cell Culture The human erytholeukemia HEL and K562, the prostate carcinoma PC3 and the breast carcinoma MCF-7 and MDA-MB-231 cell lines were obtained from the American Type Culture Collection (ATCC). HEL , K562 and PC3 cells were cultured in RPMI 1640, 0.2% (v/v) L-glutamine, 10 % FBS. MCF-7 and MDA-MB-231 cells were cultured in DMEM (4.5 g/ml glucose), 0.2% (v/v) L-glutamine, 10% FBS. All cells were grown at 37 C in a humid environment with 5 % CO 2 and were confirmed mycoplasma free Real time quantitative -reverse transcriptase (qrt)- PCR analysis Total RNA, isolated using TRIzol reagent from ~5 x 10 6 cells and DNase I-treated, was converted to firststrand (1 ) cdna with M-MLV reverse transcriptase. Real time quantitative reverse transcriptase (qrt) - PCR analysis, including for confirmation of sirna knock-down, was performed using the SyBr Green reaction kit, essentially as previously described [56], using primers designed to amplify a 400 bp region of TPα (forward, 5 -GAGATGATGGCTCAGCTCCT-3, corresponding to nucleotides of Exon 2 within the TP gene & reverse, 5 -CCAGCCCCTGAATCCTCA-3, corresponding to nucleotides of TPα mrna) or, as a positive control, a 588 bp region of the human 18s rrna gene (forward, 5 - CGGCTACCACATCCAAGGAA-3 ; reverse, 5 - TCGTCTTCGAACCTCCGACT-3 ). Furthermore, for qrt-pcr analysis of WT-1 and HIC1 expression and confirmation of sirna knock-down, primers designed to amplify a 96 bp region of the human WT1 (forward 5 - TACCCAGGCTGCAATAAGAGATATTTTAAG-3, & reverse, 5 -CCTTTGGTGTCTTTTGAGCTGGTC- 3, designed to cross exon/exon boundaries of the different splice variants of WT1; [57]) and a 130 bp region of the human HIC1 (forward, 5 - CGACGACTACAAGAGCAGCAGC -3, corresponding to nucleotides & reverse, 5 - CAGGTTGTCACCGAAGCTCT-3, corresponding to nucleotides of Exon 2 within the HIC1 gene; [58]) were used. The levels of TPα, WT1 and HIC1 mrna were normalized using corresponding 18s rrna expression levels, to obtain Ct values. Ct values were calculated using control Ct values. Relative TPα, WT1 and HIC1 mrna expression levels were calculated using the formula 2 - Ct [59], and data is presented as mean changes in TPα mrna expression relative to the controls, assigned a value of 1 (Relative expression ± SEM, n = 3) Luciferase-based genetic reporter plasmids The plasmids pgl3b:prm1, pgl3b:prm1b, pgl3b:prm1b, pgl3b:prm1c, pgl3b:prm1d, pgl3b:prm1e, pgl3b:prm1g, pgl3b:prm1h Ap1, pgl3b:prm1i, pgl3b:prm1j and pgl3b:prm1l encoding Prm1 (-8500 to from the htp gene/tbxa2r), relative to the translational start codon at +1 and various subfragments of Prm1, subcloned into the pgl3basic (pgl3b) reporter vector, have been described previously [8]. The plasmids pgl3b:prm1 GC(-8146)*, pgl3b:prm1d GC(-6717)*, pgl3b:prm1g GC(-6340)*, pgl3b:prm1g GC(-6276)*, pgl3b:prm1d GC(-6206)*, pgl3b:prm1i GC(-6206)*, pgl3b:prm1d HIC1(a)*, and pgl3b:prm1i HIC1(b)* were generated by QuickChange TM site-directed mutagenesis (SDM) using the templates and primers described below. The identities of the putative cis-acting elements subjected to SDM, with the 5 nucleotide of each element indicated in brackets and the nucleotides that were changed underlined in bold, are also indicated. Page 4 of 34
7 1. GC (-8146), from cggggggtggggggcggggggcgggccaa to cgggggtcgtggggtggatggcgggccaa using template pgl3b:prm1 to generate pgl3b:prm1 GC(-8146)*. Primers Kin510 (5 -GTGCTGGCGGGGGTCGTGGGGCGGGGGGCG - 3 ) and complementary Kin511, as well as Kin512 (5 GGGGTCGTGGGGTGGATGGCGGGCCAAG AC- 3 ) and complementary Kin GC (-6717), from tctgtcctcccacccca to tctgtcctatcacccca using template pgl3b:prm1d to generate pgl3b:prm1d GC(-6717)*. Primers Kin502 (5 CATCCCTCTGTCCTATCACCCCAC CCCTGG - 3 ) and complementary Kin GC (-6340), from gcgtgcggggggcaccc to gcgtgctgggggcactc using template pgl3b:prm1g to generate pgl3b:prm1g GC(-6340)*. Primers Kin 841 (5 - CCGGCGTGCTGGGG GCACTCACTGACTC - 3 ) and complementary Kin GC (-6276), from cagggtgggcggggctg to cagggagggcggcgctg using template pgl3b:prm1g to generate pgl3b:prm1g GC(-6276)*, and using template pgl3b:prm1g GC(-6340)* to generate pgl3b:prm1g GC(- 6340,-6276)*. Primers Kin866 (5'-CAGCGCAGGGAGGGCGGCGCTGA TGAGA -3') and complementary Kin GC (-6206), from cagcggcccccacccgt to cagcggcctacacccgt using template pgl3b:prm1d to generate pgl3b:prm1d GC(-6206)*, using template pgl3b:prm1d GC(-6717)* to generate pgl3b:prm1d GC(-6717,- 6206)* and using template pgl3b:prm1i to generate pgl3b:prm1i GC(-6206)* Primers Kin506 (5 - GCTGCCAGCGGCCTACACCCGTCCCAGC - 3 ) and complementary Kin HIC1 (a) (-6736), from ctggtgcaccccc to ctggtccaccccc using template pgl3b:prm1d to generate pgl3b:prm1d HIC1(a)*. Primers Kin500 (5' - CTGTGTCGTCTGGTCCACCCCCCATCCC - 3') and complementary Kin HIC1 (b) (-6214), from cgggctgccagcg to cgggcttgcagcg using template pgl3b:prm1i to generate pgl3b:prm1i HIC1(b)*. Primers Kin504 (5' - CGAGCCGCGGGCTTGCAGCGGCCCCCAC - 3') and complementary Kin505. All plasmids generated were validated by DNA sequence analysis Luciferase-based Genetic Reporter Assays Cells were co-transfected with the various pgl3b-recombinant plasmids, encoding firefly luciferase, and prl-tk, encoding renilla luciferase, using either DMRIE-C for HEL and K562 cells [6] or Effectene for PC3, MCF-7 and MDA-MB-231 cells. Cells were harvested 48 h post-transfection and assayed for firefly and renilla luciferase activities using the Dual-Luciferase Reporter Assay System TM. Luciferase activities were calculated as a ratio (firefly:renilla luciferase) and expressed in relative luciferase units (RLUs) [6]. To investigate the effect of ectopic-expression of WT1 (+/-), WT1 (-/-) and HIC1 on Prm1-directed gene expression, PC3, MCF-7 and MDA-MB-231 cells were co-transfected with pgl3b:prm1, pgl3b:prm1d, pgl3b:prm1g, pgl3b:prm1i or pgl3b:prm1j (either wild type or variants containing the mutated ciselements for WT1/GC or HIC1; 1.5 µg) plus prl-tk (30 ng) along with either pcdna3:wt1 (+/-), pcdna3:wt1 (-/-), pcdna3.1:hic1 or, as a control, with pcdna3.1 alone (1 µg). Cells were harvested 48 h post-transfection and assayed for luciferase activity, as previous [6] Immunohistochemistry Formalin-fixed and paraffin-embedded prostate and breast tumor tissues were obtained though ethical consent from St. Vincent s University Hospital, Dublin, Ireland. Tissues were sectioned at 4 μm thickness and baked onto slides at C for up to 60 min. Prior to immunolabeling, sections were dewaxed in two changes of xylene (2 10 min) and rehydrated though a series of decreasing alcohol solutions (100%, 3 min x 2; 95 %, 1 min; 80 %, 1 min) before being washed in distilled water. Endogenous peroxidase activity was blocked by incubation in 3 % hydrogen peroxide, prepared in methanol, for 10 min at R.T, followed by washing of tissue sections in PBS. Non-specific binding was then blocked by incubating the tissue sections for 30 min at R.T with 1 % horse serum in PBS (Blocking Buffer) to which Avidin D (4 drops per ml of Blocking Buffer; Vector Labs Avidin/Biotin Blocking kit) was added to block endogenous biotin. Thereafter, sections were incubated overnight at 4 C in a humidified chamber with primary (1 ) antibody, prepared in Blocking Buffer and containing Biotin (4 drops per ml of Blocking Buffer; Vector Labs Avidin/Biotin Blocking kit), where an affinity purified rabbit anti-tpα (15 µg/ml) antibody was used to detect TPα. The TP isoform-specific antibody was directed to amino acids of the unique C-tail of TPα and has been extensively characterized [10, 13]. As controls, either the 1 antibody was omitted or the Page 5 of 34
8 1 anti-tpα (15 µg/ml) antibody was pre-incubated at room temperature for 1 h with a 5-fold (w/w) excess of either the immunogenic peptide (aa of TP ) or the non-competitor peptide (aa of TP ). Sections were washed in PBS, prior to incubation for 30 min with biotinylated anti-rabbit secondary antibody (1 : 500 dilution), prepared in Blocking Buffer. After washing, tissue sections were incubated with streptavidin horseradish peroxidase (HP; 1 in 1500, prepared in Blocking buffer) for 30 min at room temperature, followed by incubation with the chomogen 3,3 -diaminobenzidine (DAB) substrate (0.05 % DAB, 0.015% hydrogen peroxide in PBS) for 1-5 min. Tissue sections were counterstained with hematoxylin, dehydrated though increasing alcohol series and xylene (2 10 min) prior to mounting in DPX. Slides were imaged using a Zeiss microscope and Axiovision software Cell Proliferation Assays PC3, MCF-7 and MDA-MB-231 cells were seeded at 2 x 10 4 and 5 x 10 4 cells/ml, respectively, in a 96-well plate (150 µl per well) and incubated for 24 h at 37 C. Thereafter, the cells were washed and media were replaced with serum free media (150 µl) containing µm U46619, 0.1 µm SQ29,548 or, as controls, 10% serum, 50 ng/ml VEGF or vehicle (0.1 % ethanol in serum-free medium) and cells were cultured for up to an additional 72 h at 37 C. At 0 and 72 h, MTT reagent (5 mg/ml; 50 µl) was added to each well and cells were further incubated at 37 C for 3 h. The MTT/media mix was removed and replaced with DMSO (200 µl /well) to elute/solubilize the purple formazan crystals. Levels of formazan were measured by reading the absorbance at 540 nm Cell Migration Assays PC3, MCF-7 and MDA-MB-231 cells were seeded at and cells/ml, respectively, in a 12-well plate (1 ml per well) in normal growth media and cultured for h to achieve ~ 90 % confluency. Thereafter, the cells were washed and pre-incubated with serum-free media (0 % FBS) for at least 16 h. Scratch wounds were made in the cell monolayers using a 200 μl pipette tip perpendicular to pre-drawn lines (2 parallel lines approx 3-4 mm apart) on the underside of the well. Loose cells and debris were washed away and replaced with serum-free media. Scratch wounds were imaged immediately or following incubation of cells with vehicle, U46619 ( µm), SQ29,548 (0.1 µm) or, as controls, VEGF (50 ng/ml). Images were captured post-injury periodically up to 24 h or 56 h for the PC3 and MDA-MB-231 cell lines, respectively. All images were captured using a Nikon TMS inverted microscope with Matrox Intellicam software (version 2.07) and analyzed with TScratch software (Version 1.0) Immunoblot Analysis To detect WT1 and HIC1 proteins, either endogenously or ectopically expressed, whole cell protein (50µg per lane) from non-transfected cells or cells transiently transfected with pcdna3.1:wt1 (+/-), pcdna3.1:wt1 (-/-), pcdna3.1:hic1 or, as a control, with pcdna3.1 vector alone was resolved by SDS- PAGE (10 % acrylamide gels) and transferred to polyvinylidene difluoride (PVDF) membrane, according to standard methodology. Membranes were screened using anti-wt1 and anti-hic1 antibodies in 5 % non-fat dried milk in 1 X TBS (0.01 M Tris-HCl, 0.1 M NaCl) overnight at 4 C followed by washing and screening using goat anti-rabbit horseradish peroxidase (HP) followed by chemiluminescence detection. As a reference for uniform protein loading, all blots were rescreened with an anti-hdj-2 antibody (Neomarkers) followed by secondary AB/ chemiluminescence detection to monitor endogenous HDJ-2 protein levels Chomatin Immunoprecipitation (ChIP) Assays Chomatin immunoprecipitation (ChIP) assays were performed in PC3, MCF-7 and MDA-MB-231 cells essentially as previously described for HEL cells [8, 60]. Briefly, cells (1 x 10 8 ) were grown in RPMI/DMEM, 10 % FBS until ~70-80 % confluent and collected by centrifugation at 2000 x g for 5 min at 4 C, washed twice in ice-cold PBS and re-suspended in 50 ml serum-free media. Formaldehyde (1%)-cross linked chomatin was sonicated to generate fragments ranging from 350 bp to 1000 bp in size. Sheared chomatin was resuspended in a final volume of 6 ml lysis buffer. Prior to immunoprecipitation, chomatin was incubated with 40 μg normal rabbit IgG overnight at 4 C on a rotisserie, after which 250 μl of salmon sperm DNA/protein A agarose beads (Millipore) was added and chomatin was pre-cleared overnight at 4 C with rotation. Thereafter, for ChIP assays, aliquots (672 µl) of pre-cleared chomatin were incubated with anti-wt1 and anti-hic1 (10 μg aliquots in both cases) or, as controls, with normal rabbit IgG (10 μg) antibodies or in the absence of primary (1 ) antibody (-AB). In parallel, aliquots (270 µl) of the pre-cleared chomatin were stored for use as input chomatin DNA. Following elution of the immune complexes from the beads, formaldehyde cross-links were reversed by Page 6 of 34
9 incubation at 65 C overnight followed by protease digestion with proteinase K (Gibco-BRL # ; 9 μl of 10 mg/ml) at 45 C for 7 h. After precipitation, samples were re-suspended in 50 μl dh 2 O. PCR analysis was carried out using 2-3 μl of the resulting ChIP samples as templates or, as a positive control, with an equivalent volume of a 1:4 dilution of the input chomatin DNA. Aliquots (10 µl) of the PCR products were analyzed by agarose gel electrophoresis. The identities of the primers used for the ChIP PCR reactions, as well as their sequences and corresponding nucleotides within Prm1, are listed below. 1. Kin462: 5 - CGAGACCCTGCAGGCAGACTGGAG 3, Nu to Kin463: 5 - GAGATGGGGAAACTGAGGCACAAAG -3, Nu to Kin233: 5 - GAGAGGTACCGCTCCAAAGCCACCTCCG-3, Nu to Kin144: 5 - AGAGACGCGTCGCTTCCTCGGGAGCCTCA-3, Nu to Kin1159: 5 - CCAGTGAATTTGGAGCCCTGGAGTCTGG -3, Nu to Kin1160: 5 - CCACCCTGCGCTGGCCACGCCCCTCG -3, Nu to Kin456: 5 - CTTCCCCAGAAGGCTGTAGGGTGTC -3, Nu to Kin109: 5 - AGAGACGCGTCTTCAGAGACCTCATCTGCGGGG -3, Nu to Kin364: 5 - TTGGGTCCAGAAGGTCGAGGC3-3, Nu to Kin365: 5 - GCGAACCAGGGCGAGGC -3, Nu -711 to -695 For quantitation of the relative abundance of the PCR products derived from the individual test or control immunoprecipitates relative to that of the products derived from the respective input chomatins, real-time quantitative (QT)-PCR reactions were carried out for the same number of cycles (typically cycles) using the Agilent MX3005P QPCR system to obtain cycle theshold (Ct) values. Changes in relative PCR product intensities were then calculated using the Relative Quantification method using the formula 2 - Ct [60]. Data is presented as mean product intensities of the individual test or control immunoprecipitates expressed as a percentage relative to those derived from the corresponding input chomatins. For all ChIPbased experiments, PCR (semi-quantitative) and real time QT-PCR data presented is obtained from at least 3 independent ChIP immunoprecipitations using chomatin extracted on at least 3 occasions, rather than from triplicate PCRs using chomatin precipitated from single ChIP experiments Disruption of WT1 and HIC1 expression by small interfering (si)rna For small interfering (si) RNA experiments, PC3, MCF-7 and/or MDA-MB-231 cells were plated at ~ 1.5 X 10 5 cells/35-mm plate approximately 24 h prior to transfection such that cells reached ~50% confluence. Thereafter, cells were transfected with either 20 nm WT1 sirna (5 -CTGGGTGTTGATCTTACAAGAtt, corresponding to nucleotides of NM_ ; sirna WT1 ), 20 nm HIC1 sirna (5 - CAAGTTCGCACAGCAACGCAAtt, corresponding to nucleotides of NM_ ; sirna HIC1 ) or, as controls, with the scrambled sequences (sirna Control; 20 nm) or 20 nm Lamin A/C sirna (5 -CUGGACUUCCAGAAGAACAtt) using DharmaFECT 4 (Thermo Scientific; MDA-MB-231 cells) or HiPerFect (Qiagen; PC3 & MCF-7 cells), as per manufacturer's instructions. To confirm the efficacy of the sirnas to disrupt WT1 or HIC1 expression, cells were harvested following incubation at 0, 24, 48, 72 and 96 h cells and subjected to SDS-PAGE (10 15 μg/lane on 10% gels) followed by electroblotting onto PVDF membranes (Roche). Membranes were initially screened versus the anti-wt1 or anti-hic1 antibody and, following stripping, were rescreened versus anti-hdj-2 antibody to confirm uniform protein loading. The effect of sirna knockdown of WT1 or HIC1 expression on TP, WT1 and/or HIC1 mrna expression was assessed by qrt-pcr, as previously described herein (Section 2.3). Data presented in the figures is representative data from two independent sirna-transfection studies, each analyzed by two independent conversions to 1 o cdna and each individual qrt-pcr assay carried out in triplicate Statistical analysis Statistical analysis of differences was performed using the two-tailed Student s unpaired t-test. All values are expressed as mean ± standard error of the mean (SEM). P-values < 0.05 were considered to indicate statistically significant differences, where *, **, ***, and **** indicate p < 0.05, p < 0.01, p < and p < , respectively. Page 7 of 34
10 3. RESULTS 3.1. Analysis of TPα and Prm1-directed gene expression Coinciding with several recent longitudinal studies highlighting the prophylactic benefits of Aspirin in reducing the risk of many prevalent cancers, particular attention has been directed to the role of TXA 2 and of its synthase (TXS) and its T prostanoid receptor, the TP, in tumor progression and metastasis [19, 20, 25, 27]. In humans, TXA 2 signals though two structurally related TP isoforms, TP and TP, that are encoded by the same TP gene (TBXA2R) but thought to be transcriptionally regulated by distinct promoters referred to as Prm1 and Prm3, respectively [6-8, 40, 41, 61, 62]. While a number of studies have shown positive correlation between TP /TP expression with tumor progression, including prostate and breast cancers [19, 20], few studies have examined the role of the individual TP isoforms and no study reported to date has investigated the mechanism(s) regulating the transcriptional expression of TP and/or TP in cancer. The aim of the current study was to investigate the expression of TPα and its transcriptional regulation, though Prm1, in prostate and breast cancer model systems. Initially, real-time quantitative reverse transcriptase (QT) - PCR analysis and luciferase-based genetic reporter assays were used to examine TP mrna expression and Prm1 promoter activity in the prostate PC3 and in breast MCF-7 and MDA-MB-231 carcinoma cell lines, where the platelet progenitor megakaryoblastic HEL and K562 served as reference cell lines [8, 9]. TPα mrna expression was confirmed in the PC3, MCF-7 and MDA-MB-231 cell lines, albeit at lower levels compared to HEL and K562 cells (Fig 1A). Consistent with this, Prm1 directed substantial luciferase reporter gene expression in PC3, MCF-7 and MDA-MB-231 cells but at levels that were approximately 2-fold less than those in the HEL (7.4 RLU) and K562 (9.2 RLU) cell lines (Fig 1B). Immunohistochemical (IHC) analysis, using a previously characterized affinity purified anti-tp antiserum [10, 13], confirmed TPα expression in early/low grade prostate and breast tumor tissues (Fig 1C & 1D), with expression progressively increasing in both prostate and breast tissue with increasing tumor grades (Fig 1C & 1D). By way of example, IHC expression of TPα was observed in the columnar epithelial cells lining the prostate glands and in fibromuscular stromal smooth muscle cells in low grade tumor tissue, with expression of TP increasing substantially with Gleason score (Fig 1C & Supplemental Fig. 1). Similarly, expression of TP in the breast cancer tissue was detected predominantly in the epithelial cells lining the secretory glands and increased progressively with increasing tumor grade (Fig 1D). The specificity of the affinity purified anti- TP antiserum was confirmed whereby the immunogenic peptide blocked all IHC staining in both tissue types while, as additional controls, a peptide based on unique sequences from the TP isoform had no effect on the anti-tp immune-staining (Supplemental Fig. 1). Furthermore, incubation of both PC3 and MDA-MB-231 cells with the TXA 2 mimetic U46619 led to concentration-dependent increases in cell proliferation (Fig 1E) and cell migration (Fig 1F), as assessed though the scratch-wound assay, and to levels that were not substantially different than those of the control agents (serum or VEGF). In both cell lines, the selective TP antagonist SQ29,548 specifically impaired the U46619-induced cell proliferation and cell migration, but did not affect the serum- or VEGF-responses (Fig 1E & 1F and data not shown). Similarly, the TXA 2 mimetic U46619 promoted cell proliferation and migration of the MCF-7 breast cancer cell line, while SQ29,548 specifically blocked both responses (data not shown). Collectively, these findings confirm TPα mrna expression and functional, Prm1-directed gene expression in prostate and breast cancer cells, including in the estrogen receptor (ER)-positive MCF-7 and triple negative (ER, PR and Her2/neu negative) MDA-MB-231 breast cancer cell lines. Furthermore, the expression of TPα correlates with increasing prostate and breast tumor grade while stimulation with the highly selective TXA 2 mimetic U46619 increases both cell proliferation and migration providing further evidence of a role of the TXA 2 /TP signaling axis in prostate and breast cancer progression Regulation of TPα mrna expression by functional GC-enriched and HIC1 cis-elements within Prm1 in PC3 cells Previous studies identified the key trans-acting factors and cis-acting elements within Prm1 regulating the expression of TPα in the megakaryoblastic platelet progenitor HEL cell line [8, 40, 41]. Though those studies, 3 key repressor regions, designated upstream repressor region (URR)1, URR2 and repressor region (RR)3, located within the core promoter, and 2 activator regions, designated upstream activator region (UAR) 1 and UAR2, were identified in Prm1 (Supplemental Fig 2 & Table 1). The transcriptional regulator Wilms Tumor (WT)-1 was found to bind to multiple GC-rich elements within the repressor regions of Prm1, where it plays a major role in repressing TPα expression in HEL cells [40]. Additionally, though bioinformatic analysis, using the MatInspector algorithm [63], two putative cis-elements for Page 8 of 34
11 hypermethylated in cancer (HIC) 1, designated HIC1 (a) (at -6736) and HIC1 (b) (at -6214), were identified within the URR2 and RR3, respectively. Both WT1 and HIC1 have been widely implicated in many cancers types, including breast and prostate cancers [42, 46, 48]. Hence, herein, it was sought to map the key transcriptionally-responsive regions within Prm1 in prostate (PC3) and in breast (MCF-7 and MDA-MB- 231) cancer cells while also seeking to determine whether the tumor suppressors WT1 and/or HIC1 play a role in the transcriptional regulation of TPα though Prm1 in those model carcinoma cell lines. Initially, 5 promoter deletional analysis in conjunction with genetic reporter assays established that the previously identified repressor regions (URR1, URR2 and RR3) within Prm1 are functional in the prostate PC3 cell line (Fig 2A). Specifically, 5 deletion of nucleotides from Prm1 to generate Prm1B resulted in a modest, yet significant, increase in luciferase expression (URR1; P = ). Similarly, 5 deletion of Prm1D to generate Prm1E yielded a 1.8-fold increase in luciferase expression (URR2; P < ), while deletion of Prm1I to generate Prm1J yielded a 1.6-fold increase (RR3; P < ). However, the activator regions UAR1 and UAR2 previously identified within Prm1 (Supplemental Fig 2 & Table 1) are not functional in PC3 cells. These 5 deletional analyses also identified a novel prostate-specific repressor region between to (Novel URR), as deletion of Prm1B to generate Prm1B resulted in a 1.5-fold increase in luciferase expression (P < ; Fig 2A & Table 1). Furthermore, 2 additional novel upstream activator regions (UARs) were identified between to (Prm1C- Prm1D; Novel UAR1) and to (Prm1E- Prm1G; Novel UAR2) in PC3 cells (Fig 2A & Table 1). Specifically, a 2.6- fold and 4.3-fold decrease in luciferase expression was observed on 5 deletion of nucleotides from Prm1C (- 7504) to generate Prm1D (-6848) and from Prm1E (-6648) to generate Prm1G (-6492), respectively (Fig 2A; P < in each case). Based on detailed bioinformatic analyses [63], it is proposed that these novel URR and novel UAR1/2 regions contain binding element(s) for cell-specific transcriptional regulator(s), as elaborated upon in the Discussion section. To investigate whether WT1 and/or HIC1 are involved in the transcriptional regulation of TPα expression in PC3 cells, the effect of mutation of the GC-enriched (WT1 binding) and HIC1 cis-acting elements within the common, previously identified URR1, URR2 and RR3 (Table 1) repressor regions was investigated in further gene reporter assays (Fig 2B - 2E). Specifically, mutation of the GC -8146* element within URR1 yielded a substantial increase in Prm1-directed luciferase expression (P < ; Fig 2B). Similarly, within URR2, mutation of the GC and GC elements individually resulted in 1.6- and 2-fold increases in Prm1D-directed luciferase expression (P = & , respectively) while their combined mutation led to a 3.7-fold increase in expression (P < ; Fig 2C), to a level substantially higher compared to individual mutation of GC (P = ) and GC (P = ). Furthermore, mutation of the GC element within the smaller Prm1I subfragment (i.e. RR3) yielded a 2.5-fold increase in luciferase expression (P < ; Fig 2C) indicating that the GC and GC elements act independently to repress Prm1-directed gene expression in PC3 cells. It was also discovered herein that GC and GC function independently to repress Prm1-directed gene expression in PC3 cells (Fig 2D). In terms of the putative HIC1 cis-elements within Prm1, mutation of the HIC1 (a) element within Prm1D (i.e. URR2) had no significant effect on Prm1-directed gene expression (P = ; Fig 2E). However, mutation of HIC1 (b) within Prm1I (i.e. RR3) yielded a 1.9-fold increase in expression (P = ), to a level that was not significantly different compared to that of Prm1J (P = ; Fig 2E). Collectively, these data suggest that transcription factor binding to the GC-enriched WT1 and HIC1 (b), but not HIC1 (a), elements within Prm1 may mediate transcriptional repression of TPα in PC3 cells WT1 and HIC1 repress TPα expression though their binding in vivo to specific cis-elements within Prm1 in PC3 cells To investigate whether WT1 actually binds in vivo in PC3 cells to some or all of the GC-enriched element(s) within Prm1, chomatin immunoprecipitation (ChIP) analyses were performed using chomatin isolated from the prostate carcinoma cells. Initially, endogenous expression of WT1 in PC3 cells was confirmed by immunoblot analysis (Fig 3A), where it is predominantly expressed as a 52/54 kda protein doublet corresponding to the main transcriptionally active (-KTS) forms of WT1 [40]. Thereafter, ChIP followed by PCR analyses, using primers specific to 3 distinct GC-regions of Prm1 and as indicated in the schematic in Fig 3B, generated amplicons from the input chomatin and anti-wt1 immunoprecipitates but not from the normal rabbit IgG or control (no primary (1 ) antibody/ -AB) immunoprecipitates (Fig 3B(i-iii)). As an additional control of the specificity of WT1 binding within these Prm1 repressor regions, PCR analysis using primers specific to the Prm3 (-1081 to -695) region of the TP gene, which does not contain any GC/WT1- elements, only generated an amplicon from the input chomatin but not from the anti-wt1, normal rabbit IgG or -AB immunoprecipitates (Fig 3B(iv)). Page 9 of 34
12 Thereafter, the effect of ectopic expression of the transcriptionally active forms of WT1, namely WT1 (+/-) and WT1 (-/-), on TPα mrna and on Prm1-directed reporter gene expression levels was examined in PC3 cells. Ectopic expression of WT1 (+/-) and WT1 (-/-) each significantly reduced TPα mrna expression (P = & , respectively; Fig 3C) and each also reduced Prm1 (P < 0.001, in each case)-directed reporter gene expression in PC3 cells (Fig 3D). In contrast, over-expression of WT1 (+/-) and WT1 (-/-) did not affect luciferase reporter gene expression by subfragments of Prm1 in which the GC-enriched WT1 ciselements were disrupted by site-directed mutagenesis (Fig 3E & data not shown). Immunoblot analysis confirmed over-expression of both the WT1 (+/-) (54 kda) and WT1 (-/-) (52 kda) forms of WT1 in the transfected PC3 cells (Fig 3F). Data presented herein (Fig 2E) suggested that HIC1 may mediate transcriptional repression of TPα though its binding to the putative HIC (b) element within the RR3 of Prm1 in PC3 cells. Hence, to investigate if HIC1 actually binds in vivo to the adjacent HIC1 (a) and/or HIC1 (b) elements within Prm1 in PC3 cells, ChIP assays were performed using an antibody specific to HIC1. Initially, endogenous expression of HIC1 (76 kda) was confirmed in PC3 cells (Fig 4A). Following ChIP, PCR analysis using pairs of primers surrounding the adjacent HIC1 (a/b) cis-acting elements within Prm1 generated amplicons from the input chomatin and from the anti-hic1 ChIP immunoprecipitates, but not from the normal rabbit IgG or -AB immunoprecipitates (Fig 4B(i-ii)). As an additional control of the specificity of HIC1 binding to these elements, PCR analysis using primers specific to the Prm3 (-1081 to -695) region of the TP gene only generated an amplicon from the input chomatin but not from the anti-hic1, normal rabbit IgG or -AB immunoprecipitates (Fig 4B(iii)). Ectopic expression analysis was also used to investigate the effect of HIC1 on TPα mrna expression and Prm1-directed gene expression in PC3 cells. HIC1 expression significantly reduced TPα mrna (P = ) and luciferase reporter gene expression directed by Prm1D (P < 0.001) in PC3 cells (Fig 4C & 4D). In contrast, ectopic expression of HIC1 did not affect reporter gene expression by subfragments of Prm1 in which the putative HIC1 cis-elements were mutated (Fig 4E & data not shown). Immunoblot analysis confirmed over-expression of HIC1 in the transfected PC3 cells (Fig 4F). Furthermore, sirna-mediated down-regulation of both WT1 and HIC1 each resulted in significant increases in TP mrna expression in PC3 cells (Supplemental Fig 3A) where effective disruption of WT1 and HIC1 expression was confirmed by both qrt-pcr and by western blot analyses (Supplemental Fig 3B). For example, at 72 h post-sirna transfection, there was 2.25 fold (p <0.0001) and 2.21 fold (p < ) -increases in TP mrna expression in the presence of sirna WT1 and sirna HIC1, respectively (Supplemental Fig 3A). As additional controls for specificity, it was confirmed that sirna WT1 had no effect on HIC1 levels and, conversely, sirna HIC1 had no effect on WT1 levels while the scrambled controls (sirna Control ) had no effect on either WT1 or HIC1 levels (Supplemental Fig 3B). Taken together, these data establish that WT1 and HIC1 can bind in vivo to several GC-enriched WT1 and the HIC1 (b) cis-acting elements, respectively, within Prm1 to transcriptionally repress TPα expression in the prostate cancer PC3 cell line Regulation of TPα expression by functional GC-enriched and HIC1 cis-elements within Prm1 in the breast cancer MCF-7 and MDA-MB-231 cell lines As stated, WT1, HIC1 and the TXA 2 /TP signaling axis have also been implicated in the development and progression of breast cancer [19, 20, 48, 50]. However, little is known about the mechanisms of transcriptional regulation of TPα though Prm1 in breast cancer cells. Hence, similar to studies in the prostate PC3 cells, it was sought to map the key transcriptionally active regions of Prm1 in the model MCF-7 (ER positive) and MDA-MB-231 (ER, PR and Her2/neu negative /triple negative) breast cancer cell lines and to investigate the possible role of WT1 and/or HIC1 in that transcriptional regulation. As in PC3 cells, 5 deletions in conjunction with genetic reporter analyses confirmed that the presence of the 3 previously identified upstream repressor regions (URR1, URR2 and RR3) within Prm1 are functional in MCF-7 cells (Fig 5A & Table 1), where 5 deletion of Prm1 to generate Prm1B (URR1), of Prm1D to generate Prm1E (URR2) and of Prm1I to generate Prm1J (RR3) each yielded substantial increases in luciferase expression (P = , & , respectively; Fig 5A). Similarly, the presence of functional URR1 (P = ), URR2 (P = ), RR3 (P = ) and the core promoter region (P < ) was also confirmed in the MDA-MB-231 cell line (Supplemental Fig 4A), despite the lack of statistical significance in some cases in these cells. As in PC3 cells, the UAR1 and UAR2 activator regions previously identified within Prm1 in HEL cells [8] are not functional in MCF-7 cells (Fig 5A & Table 1) while UAR2, but not UAR1, was confirmed to be functionally active in MDA-MB-231 cells (Supplemental Fig 4A & Table 1). Somewhat consistent with the latter, the two novel UARs identified herein in PC3 cells Page 10 of 34
13 between Prm1C-Prm1D (Novel UAR1) and Prm1E-PrmIG (Novel UAR2), respectively, were both also identified in the MCF-7 cells (Fig 2A & Table 1), while only the latter Novel UAR2 was identified in the MDA-MB-231 cell line (Supplemental Fig 4A & Table 1). Collectively, these data highlight important shared and also distinct regulatory regions within Prm1 to differentially regulate TP gene expression in a cell/tissue-specific manner (Table 1). In MCF-7 cells, specific mutation of the GC element within the common, previously identified URR1 resulted in a 2-fold increase in Prm1-directed luciferase expression (P = ; Fig 5B). Mutation of the GC and GC elements individually within URR2 each resulted in 1.8- and 2.1-fold increases in Prm1D-directed luciferase expression (P = & 0.001, respectively; Fig 5C). Double mutation of these elements within Prm1D led to a 7.7-fold increase in expression (P < ), to a level substantially higher compared to individual mutation of GC (P < ) and GC (P < ). Furthermore, mutation of the GC element within Prm1I (i.e. RR3) yielded a 1.5-fold increase in luciferase expression (P < ; Fig 5C). These data indicate that the GC and GC elements function independently to repress Prm1- directed gene expression in MCF-7 cells. The GC and GC cis-elements also function independently to repress Prm1-directed gene expression in MCF-7 cells (Fig 5D). Mutation of the putative HIC1 (a) element within Prm1D (i.e. URR2) had no significant effect on Prm1-directed gene expression (P = ), while mutation of HIC1 (b) within Prm1I (i.e. RR3) yielded a 1.3-fold increase in expression (P < ; Fig 5E). A similar set of results was obtained following mutation of GC-enriched WT1 cis-elements within Prm1 in MDA-MB-231 cells, but mutation of neither the HIC1 (a) and/or HIC1 (b) elements had any effect in this cell line (Supplemental Figs 4B - 4E). Collectively, these mutational data suggest that WT1 binding to the GC , GC -6717, GC -6340, GC and GC elements may mediate transcriptional repression of Prm1-directed TPα mrna expression in the breast cancer MCF-7 and MDA-MB-231 cell lines. The HIC1 (b) element also mediates repression in MCF-7 cells, but not in MDA-MB-231 cells, while the HIC1 (a) element is not functional in either breast cancer cell line WT1 and HIC1 repress TPα expression though their binding to specific cis-elements within Prm1 in MCF-7 and MDA-MB-231 cells The possible binding of WT1 in vivo to specific GC-enriched elements within Prm1 in the breast cancer cell lines was then investigated though ChIP analyses. Initially, endogenous expression of WT1 was confirmed in MCF-7 and MDA-MB-231 cells (Fig 6A & Supplemental Fig 5A). Following ChIP analyses, QT-PCR analysis using primers surrounding the 3 specific GC-enriched regions of Prm1 at GC ( to -8006), GC (-6831 to -6455) and at GC -6340, GC & GC (-6596 to -5917) generated amplicons from the input chomatin and the anti-wt1 immunoprecipitates, but not from the normal rabbit IgG or -AB immunoprecipitates (Fig 6B(i-iii) & Supplemental Fig 5B(i-iii)). As an additional control of WT1 binding within these regions, PCR analysis using primers based on Prm3 within the TP gene only generated an amplicon from the input chomatin but not from the anti-wt1, normal rabbit IgG or -AB immunoprecipitates (Fig 6B(iv) & Supplemental Fig 5B(iv)). QT-PCR analysis established that ectopic expression of WT1 (+/-) and WT1 (-/-) reduced TPα mrna expression in both MCF-7 (P = & , respectively; Fig 6C) and MDA-MB-231 cells (P = & , respectively; Supplemental Fig 5C), although the effects in MDA-MB-231 cells were not statistically significant. Furthermore, ectopic expression of both WT1 (+/-) and WT1 (-/-) reduced reporter gene expression directed by Prm1 in MCF-7 cells (Fig 6D; P = & ) and in MDA-MB-231 cells (Supplemental Fig 5D; P = & ). In contrast, in either breast cancer cell line, over-expression of WT1 (+/-) and WT1 (-/-) did not affect luciferase reporter gene expression by subfragments of Prm1 in which the GC-enriched WT1 cis-elements were disrupted by site-directed mutagenesis (Fig 6E, Supplemental 45E & data not shown). Immunoblot analysis confirmed over-expression of WT1 (+/-) and WT1 (-/-) proteins in transfected MCF-7 (Fig 6F) and MDA-MB-231 (Supplemental Fig 5F) cells. Data presented herein suggests that HIC1 mediates transcriptional repression of TPα though its possible binding to the putative HIC (b) element within the RR3 of Prm1 in MCF-7 cells (Fig 5E), but not in MDA-MB-231 cells (Supplemental Fig 4E). Hence, ChIP analyses were used to investigate if HIC1 actually binds in vivo to the adjacent HIC1 (a) and/or HIC1 (b) elements within Prm1 in MCF-7 cells. Endogenous expression of the 76 kda HIC1 protein was confirmed in MCF-7 cells (Fig 7A). Following ChIP, PCR analysis using primers surrounding the adjacent HIC1 (a/b) regions of Prm1 generated amplicons from the input chomatin and the anti-hic1 immunoprecipitates, but not from the normal rabbit IgG or -AB immunoprecipitates (Fig 7B(i-ii)). As previously described, the specificity of HIC1 binding was further confirmed whereby primers specific to the Prm3 region of the TP gene only generated an amplicon from the input chomatin but not from the anti-hic1, normal rabbit IgG or AB immunoprecipitates (Fig 7B(iii)). Page 11 of 34
14 Ectopic expression of HIC1 in MCF-7 cells significantly reduced TPα mrna expression (P = ; Fig 7C & 7F) and luciferase expression directed by Prm1D (P < 0.001; Fig 7D) but did not affect reporter gene expression by subfragments of Prm1 in which the HIC1 cis-elements were mutated (Fig 7E & data not shown). Furthermore, sirna-mediated down-regulation of WT1 and HIC1 each resulted in substantial increases in TP mrna expression in MCF-7 cells (e.g 4.19-fold and 10-fold increases in TP mrna with sirna WT1 and sirna HIC1, respectively, at 72 h post-sirna transfection; Supplemental Fig 3C) where effective sirna-mediated disruption of WT1 and HIC1 expression was confirmed by both qrt-pcr and western blot analyses (Supplemental Fig 3D & data not shown). Similarly, in MDA-MB-231 cells, sirnadown-regulation of WT1 resulted in a fold increase in TP mrna expression at 72 h, while the sirna HIC1 was without any effect in this cell line (Data not shown). Collectively, these data established that WT1 and HIC1 bind to several GC-enriched WT1 and to the HIC1 (b) cis-acting elements, respectively, within Prm1 to repress TPα mrna expression in the MCF-7 cancer line. Furthermore, the data also established that WT1, but not HIC1, transcriptionally regulates TP expression though Prm1 in the triple negative MDA-MB-231 cell line. Page 12 of 34
15 4. DISCUSSION In humans, the prostanoid TXA 2 signals though the TPα and TPβ isoforms of the T Prostanoid receptor or, in short, the TP, and plays a central role in hemostasis and in the regulation of vascular tone [1, 5]. Alterations in the levels of TXA 2, TXA 2 synthase (TXS) or the TPs have been implicated in various pathologies [1-3] and, more recently, in cancer development [19, 20], including prostate [19, 34, 37] and breast [28, 34, 35, 64] cancers. However, few studies to date have investigated the roles of the individual TP isoforms while, to the best of our knowledge, no study has examined the transcriptional regulation of TP or TP in cancer. In light of these findings, the aim of the current study was to investigate the expression and transcriptional regulation of TPα though Prm1 in prostate and breast cancers. Expression of TPα correlated with increasing prostate and breast tissue tumor grade while stimulation of the prostate and breast carcinoma cell lines with the selective TXA 2 mimetic U46619 increased both cell proliferation and migration providing further evidence of a role for the TXA 2 /TP signaling axis in prostate and breast cancer progression. Though detailed characterization of Prm1, genetic reporter assays confirmed that the previously identified URR1, URR2 and RR3 within Prm1 are functional in PC3, MCF-7 and MDA-MB-231 cells. In all cell lines, ectopic expression of WT1 repressed TPα mrna and Prm1-directed reporter gene expression while ChIP analysis confirmed that WT1 binds in vivo to the GC -8146, GC -6717, GC -6340, GC and GC cis-elements within Prm1 in PC3, MCF-7 and MDA-MB-231 cells. Furthermore, HIC1 represses TPα mrna expression though its binding to the HIC1 (b) element within Prm1 in PC3 and MCF-7 cells, but not in MDA-MB-231 cells. Due to the close proximity of several of the GC and of the HIC1 (a) /HIC1 (b) elements, ChIP analysis per se cannot distinguish specific binding of WT1 and HIC1, respectively, to some or all of those elements. However, from mutational analysis, it was confirmed that all of the WT1/GC elements and the HIC1 (b), but not HIC1 (a), element are functionally active. A role for both WT1 and HIC1 in the transcriptional regulation of TP mrna expression was further confirmed though sirna knockdown in PC3 and MCF-7 cells while only sirna to WT1, but to HIC1, affected TP mrna expression in the MDA-MB-231 cell line. It was also notable that while disruption of WT1 and HIC1 resulted in almost identical (2-fold) increases in TP mrna expression in the PC3 prostate line, there was ~4-fold increases in the breast cancer lines with sirna WT1 and an even greater (10-fold) increase in TP mrna expression in the MCF-7 breast cancer line with sirna HIC1. The basis of these cell specific, differential effects of WT1 and HIC1 knockdown on TP mrna expression is currently unknown and will be the basis of further studies. From a functional point of view, as each of the prostate and breast cancer cell lines used in the current study are known to express both the TP and TP isoforms of the TP, which are under the transcriptional regulation of distinct promoters within the same TXA2BR gene, any attempts at regulating TP expression, such as though sirna mediated approaches on WT1 or HIC1 cannot be assessed by evaluating the effects of that regulation on TP -mediated signaling as TP will still be expressed and signal. Amongst the many cell specific differences observed in the transcriptional activity of Prm1 and its profile of subfragments analyzed, it was particularly notable that the previously identified UAR1/UAR2, and shown to be regulated in HEL cells by GATA-1, Ets-1, Ets-2 and Oct-1 [8], was not found to be functionally active in the prostate PC3 or breast MCF-7 cancer cell lines (Table 1), pointing toward cell/tissue specific differences in the regulation of TP expression though Prm1 in the hematopoietic system. Moreover, as summarized in Table 1, additional cell-specific differences in the upstream regulatory regions within Prm1 were revealed herein. Included in this is a prostate-specific Novel URR (Prm1B-Prm1B ) identified in PC3 cells, a Novel UAR1 (Prm1C-1D) in PC3 and MCF-7 cells and an additional Novel UAR2 (Prm1E-Prm1G) in PC3, MCF-7 and MDA-MB-231 cells, again highlighting underlying differences in transcriptional competencies between the different tissue/carcinoma-derived cell types. The WT1 gene encodes the zinc finger transcription factor WT1, which exists as several isoforms of which the four most prevalent differ based on the presence or absence of exon (E) 5 or a Lys-Th-Ser (KTS) sequence within its DNA binding region [65]. As stated, the WT1 gene was originally identified as a tumor suppressor gene as its inactivation was associated with the development of Wilms tumor, a rare inherited pediatric cancer of the kidney [43-45]. However, subsequent studies have indicated that it can also function as an oncogene in certain human cancers, based on the findings that WT1 expression is up-regulated in certain malignant cancer lines [46-49]. It has been suggested that these contrasting roles for WT1 in cancer may be due to context-dependent variations for WT1 in the promotion/inhibition of cellular proliferation and in the regulation of the epithelial-mesenchymal transition [65, 66]. WT1 has recently emerged as an important target in chemotherapeutic approaches to treat certain cancers, and ongoing clinical trials involving WT1 are proving positive in reducing tumor growth in breast and lung cancer and in leukemia [67, Page 13 of 34
16 68]. Studies herein confirmed that WT1 is expressed in the prostate and breast cancer cell lines, and that it represses TPα mrna expression though its binding to several GC-enriched elements within Prm1. Since TPα/TPβ has been implicated in the development of prostate and breast cancers [19, 33, 34, 69, 70], the findings herein suggest that aberrant WT1 regulation of TP expression may contribute to such cancers. While, as stated, previous studies by us have identified a role for WT1 in the transcriptional regulation of Prm1/TP expression such as in megakaryoblastic HEL studies [8, 40, 41], this is the first report of the discovery of the role of HIC1 in this regard. Unlike WT1, the HIC1 gene has only been described as a tumor suppressor gene, and it was originally found to be hypermethylated or deleted in several human cancers, including brain, breast and colon cancers [50-52, 71-73]. Further evidence that HIC1 is a tumor suppressor gene was provided by reports that its expression is up-regulated by p53 [51, 74]. HIC1 encodes the zinc finger transcription factor HIC1, and its expression in the cancer tissue has been associated with reduced tumor grade and a better prognosis [75]. HIC1 can interact with the co-repressor carboxylterminal binding protein (CtBP) and the histone deacetylase (HDAC) inhibitor SIRT1 to cooperatively repress transcription of the SIRT1 gene thereby suppressing tumor growth [76, 77]. Inactivation of the HIC1 gene and reduced HIC1 protein expression have also been associated with the development of lung [78], gastric and liver [79], esophageal [80] and prostate [53] cancers. Furthermore, studies herein established that HIC1 represses TPα mrna expression though its binding to the HIC1 (b) element within Prm1 in prostate PC3 and breast MCF-7 cancer cell types. Notably, and in keeping with previous reports [81], HIC-1 was not detected in the MDA-MB-231 cells, including when assessed herein by qrt-pcr (Supplemental Fig 6), consistent with its inability to regulate TP expression though Prm1 in the basal-like/triple negative breast cancer cell line. Furthermore, ChIP analysis confirmed that HIC1 therefore does not bind to the HIC1 (a/b) elements within Prm1 in MDA-MB-231 cells (data not shown). Herein, as stated, an additional novel prostate-specific URR and two novel UARs, functionally active in both prostate and breast-derived cell lines, were identified within Prm1 (Table 1). In terms of the Novel URR (-7962 to -7859), bioinformatic analysis reveals a putative estrogen response element (ERE) within this repressor region which might act as a potential binding site for the ligand-bound androgen and estrogen steroid hormone receptors, either alone or along with co-repressors [82]. While androgens are widely known to play a central role in prostate cancer [83], since the discovery that estrogen production is increased with age in men, mainly due to the conversion of androgens to estrogens by the aromatase enzyme, recent studies suggest that estrogens also play an important role in prostate cancer progression [84, 85]. Whether the putative ERE identified within the novel URR of Prm1 regulates TP expression in the prostate remains to be investigated, being beyond the scope of the current study. Of the novel activator regions identified herein within Prm1 (Table 1), of particular note is the Novel UAR2 (-6648 to -6492) and found to be active in all 3 cell lines examined, namely PC3, MCF-7 and MDA-MB-231. Putative binding elements for stimulating protein (Sp) 1, KLF6 and early growth response (Egr)1 were identified within this region of Prm1. Recent studies by us in HEL cells have already established that both Sp1 and Egr-1 bind to multiple cis-elements within Prm1, including many of which over-lap with the WT1/GC elements investigated herein, to strongly up-regulate TPα mrna expression [8, 40, 41]. Given that the multifunctional transcription factor Egr1 is widely recognized as a key master-regulator in many aspects of prostate and breast cancers [86, 87], it will be of key interest to investigate the interplay between WT1 and Egr1 in the regulation of TP expression particularly as a function of tumor grade. KLF6 displays ubiquitous tissue expression in humans, and has been reported to act as a transcriptional activator [88]. Moreover, several studies have suggested that KLF6 plays a key role in prostate cancer progression [89, 90]. In terms of the Novel UAR1 (-7504 to -6848) identified herein and functionally active in both PC3 and ER-positive MCF-7 cells, but not in the triple negative MDA-MB-231 cell line, bioinformatic analysis reveals several candidate cis-elements but of particular note is the presence of multiple adjacent EREs. While still somewhat speculative, it is indeed possible that binding of the ER to some or all of these EREs within the Novel UAR1 may account for why this region is functionally active in both the ER-positive PC3 and MCF-7 lines but not in the ER-negative MDA-MB-231 cell line. Clarity on this issue will require further investigation, being beyond the scope of the current study. Overall, data presented herein establish that the transcriptional regulators WT1 and HIC1, both expressed and implicated in prostate and breast cancers, transcriptionally repress TPα expression though their binding to specific cis-elements within common, previously recognized regulatory regions within Prm1. In addition, several novel regulatory regions were identified accounting for cell/tissue specific regulation. Taken together with previous studies which investigated the factors regulating Prm1-directed TPα mrna expression in megakaryocytes [8, 40, 41], these findings provide a strong genetic basis for understanding the diverse physiological roles played by TXA 2 and the TPs within the vasculature and, herein, in the Page 14 of 34
17 progression of certain human cancers. It is suggested that aberrant regulation of TPα expression by WT1 and/or HIC1 may account, at least in part, for the enhanced involvement of TXA 2 signaling in tumor progression including in certain prostate and breast cancers. Furthermore, the studies may also provide a mechanistic basis accounting, at least in part, for the prophylactic benefits of Aspirin in reducing certain cancer risks by lowering overall TXA 2 levels. As an additional point, bearing in mind that the TP and TP isoforms display a number of important functional similarities but also differences in terms of their signaling [5] and regulation including in certain cancers [91, 92], coupled with the fact that they may be regulated by distinct promoters, in magakaryoblastic HEL cells at least [6], it will be of substantial interest to investigate the expression and transcriptional regulation of TP in human cancers, in particular in prostate and breast cancers. Supplementary data to this article can be found online at Acknowledgements: This work was supported by an Irish Cancer Society Research Award, co-funded by the Health Research Board in Ireland and the Movember Foundation (Grant no. PCI12KIN (MRCG/2012/3)). Sarah B. Eivers. M.Sc was part of the MolCellBiol Programme, funded under the Programme for Research in Third-Level Institutions (PRTLI, Ireland) and co-funded under the European Regional Development Fund (ERDF). Page 15 of 34
18 References: [1] D.F. Woodward, R.L. Jones, S. Narumiya, International Union of Basic and Clinical Pharmacology. LXXXIII: classification of prostanoid receptors, updating 15 years of progress, Pharmacol Rev 63 (2011) [2] G. Davi, F. Santilli, N. Vazzana, Thomboxane receptors antagonists and/or synthase inhibitors, Handb Exp Pharmacol (2012) [3] N. Nakahata, Thomboxane A2: physiology/pathophysiology, cellular signal transduction and pharmacology, Pharmacology & therapeutics 118 (2008) [4] F. Strittmatter, C. Gratzke, P. Weinhold, C.J. Steib, A.C. Hartmann, B. Schlenker, K.E. Andersson, P. Hedlund, C.G. Stief, M. Hennenberg, Thomboxane A2 induces contraction of human prostate smooth muscle by Rho kinase- and calmodulin-dependent mechanisms, Eur J Pharmacol 650 (2011) [5] B.T. Kinsella, Thomboxane A2 signaling in humans: a 'Tail' of two receptors, Biochem Soc Trans 29 (2001) [6] A.T. Coyle, B.T. Kinsella, Characterization of promoter 3 of the human thomboxane A receptor gene. A functional AP-1 and octamer motif are required for basal promoter activity, FEBS J 272 (2005) [7] A.T. Coyle, S.M. Miggin, B.T. Kinsella, Characterization of the 5' untranslated region of alpha and beta isoforms of the human thomboxane A2 receptor (TP). Differential promoter utilization by the TP isoforms, Eur J Biochem 269 (2002) [8] A.M. Gannon, B.T. Kinsella, Regulation of the human thomboxane A2 receptor gene by Sp1, Egr1, NF-E2, GATA-1, and Ets-1 in megakaryocytes, J Lipid Res 49 (2008) [9] S.M. Miggin, B.T. Kinsella, Expression and tissue distribution of the mrnas encoding the human thomboxane A2 receptor (TP) alpha and beta isoforms, Biochim Biophys Acta 1425 (1998) [10] S.M. Miggin, B.T. Kinsella, Thomboxane A(2) receptor mediated activation of the mitogen activated protein kinase cascades in human uterine smooth muscle cells, Biochim Biophys Acta 1539 (2001) [11] S.M. Miggin, B.T. Kinsella, Regulation of extracellular signal-regulated kinase cascades by alpha- and betaisoforms of the human thomboxane A(2) receptor, Mol Pharmacol 61 (2002) [12] M. Walsh, J.F. Foley, B.T. Kinsella, Investigation of the role of the carboxyl-terminal tails of the alpha and beta isoforms of the human thomboxane A(2) receptor (TP) in mediating receptor:effector coupling, Biochim Biophys Acta 1496 (2000) [13] K. Wikstrom, D.J. Kavanagh, H.M. Reid, B.T. Kinsella, Differential regulation of RhoA-mediated signaling by the TPalpha and TPbeta isoforms of the human thomboxane A2 receptor: independent modulation of TPalpha signaling by prostacyclin and nitric oxide, Cellular signaling 20 (2008) [14] L.P. Kelley-Hickie, B.T. Kinsella, Homologous desensitization of signaling by the beta (beta) isoform of the human thomboxane A2 receptor, Biochim Biophys Acta 1761 (2006) [15] L.P. Kelley-Hickie, M.B. O'Keeffe, H.M. Reid, B.T. Kinsella, Homologous desensitization of signaling by the alpha (alpha) isoform of the human thomboxane A2 receptor: a specific role for nitric oxide signaling, Biochim Biophys Acta 1773 (2007) [16] J.F. Foley, L.P. Kelley, B.T. Kinsella, Prostaglandin D(2) receptor-mediated desensitization of the alpha isoform of the human thomboxane A(2) receptor, Biochem Pharmacol 62 (2001) [17] H.M. Reid, B.T. Kinsella, The alpha, but not the beta, isoform of the human thomboxane A2 receptor is a target for nitric oxide-mediated desensitization. Independent modulation of Tp alpha signaling by nitric oxide and prostacyclin, J Biol Chem 278 (2003) [18] M.T. Walsh, J.F. Foley, B.T. Kinsella, The alpha, but not the beta, isoform of the human thomboxane A2 receptor is a target for prostacyclin-mediated desensitization, J Biol Chem 275 (2000) [19] P. Ekambaram, W. Lambiv, R. Cazzolli, A.W. Ashton, K.V. Honn, The thomboxane synthase and receptor signaling pathway in cancer: an emerging paradigm in cancer progression and metastasis, Cancer Metastasis Rev 30 (2011) [20] Y. Yang, L.Q. Tang, W. Wei, Prostanoids receptors signaling in different diseases/cancers progression, Journal of receptor and signal transduction research 33 (2013) [21] R.E. Langley, S. Burdett, J.F. Tierney, F. Cafferty, M.K. Parmar, G. Venning, Aspirin and cancer: has aspirin been overlooked as an adjuvant therapy?, British journal of cancer 105 (2011) [22] R.E. Langley, P.M. Rothwell, Potential biomarker for aspirin use in colorectal cancer therapy, Nat Rev Clin Oncol 10 (2013) [23] P.M. Rothwell, A. Algra, P. Amarenco, Medical treatment in acute and long-term secondary prevention after transient ischaemic attack and ischaemic stroke, Lancet 377 (2011) [24] P.M. Rothwell, F.G. Fowkes, J.F. Belch, H. Ogawa, C.P. Warlow, T.W. Meade, Effect of daily aspirin on long-term risk of death due to cancer: analysis of individual patient data from randomized trials, Lancet 377 (2011) [25] P.M. Rothwell, J.F. Price, F.G. Fowkes, A. Zanchetti, M.C. Roncaglioni, G. Tognoni, R. Lee, J.F. Belch, M. Wilson, Z. Mehta, T.W. Meade, Short-term effects of daily aspirin on cancer incidence, mortality, and nonvascular death: analysis of the time course of risks and benefits in 51 randomized controlled trials, Lancet 379 (2012) Page 16 of 34
19 [26] P.M. Rothwell, M. Wilson, C.E. Elwin, B. Norrving, A. Algra, C.P. Warlow, T.W. Meade, Long-term effect of aspirin on colorectal cancer incidence and mortality: 20-year follow-up of five randomized trials, Lancet 376 (2010) [27] P.M. Rothwell, M. Wilson, J.F. Price, J.F. Belch, T.W. Meade, Z. Mehta, Effect of daily aspirin on risk of cancer metastasis: a study of incident cancers during randomized controlled trials, Lancet 379 (2012) [28] J.E. Abraham, P. Harrington, K.E. Driver, J. Tyrer, D.F. Easton, A.M. Dunning, P.D. Pharoah, Common polymorphisms in the prostaglandin pathway genes and their association with breast cancer susceptibility and survival, Clin Cancer Res 15 (2009) [29] O. Moussa, A. Ciupek, D.K. Watson, P.V. Halushka, Urinary thomboxane B(2) and thomboxane receptors in bladder cancer: Opportunity for detection and monitoring, Prostaglandins & other lipid mediators 96 (2011) [30] M.C. Cathcart, K. Gately, R. Cummins, E. Kay, K.J. O'Byrne, G.P. Pidgeon, Examination of thomboxane synthase as a prognostic factor and therapeutic target in non-small cell lung cancer, Mol Cancer 10 (2011) 25. [31] J. Wei, W. Yan, X. Li, Y. Ding, H.H. Tai, Thomboxane receptor alpha mediates tumor growth and angiogenesis via induction of vascular endothelial growth factor expression in human lung cancer cells, Lung Cancer 69 (2010) [32] T. Dassesse, X. de Leval, L. de Leval, B. Pirotte, V. Castronovo, D. Waltregny, Activation of the thomboxane A2 pathway in human prostate cancer correlates with tumor Gleason score and pathologic stage, Eur Urol 50 (2006) ; discussion [33] D. Nie, M. Che, A. Zacharek, Y. Qiao, L. Li, X. Li, M. Lamberti, K. Tang, Y. Cai, Y. Guo, D. Grignon, K.V. Honn, Differential expression of thomboxane synthase in prostate carcinoma: role in tumor cell motility, Am J Pathol 164 (2004) [34] D. Nie, Y. Guo, D. Yang, Y. Tang, Y. Chen, M.T. Wang, A. Zacharek, Y. Qiao, M. Che, K.V. Honn, Thomboxane A2 receptors in prostate carcinoma: expression and its role in regulating cell motility via small GTPase Rho, Cancer Res 68 (2008) [35] P. Kelly, B.J. Moeller, J. Juneja, M.A. Booden, C.J. Der, Y. Daaka, M.W. Dewhirst, T.A. Fields, P.J. Casey, The G12 family of heterotrimeric G proteins promotes breast cancer invasion and metastasis, Proc Natl Acad Sci U S A 103 (2006) [36] P. Kelly, L.N. Stemmle, J.F. Madden, T.A. Fields, Y. Daaka, P.J. Casey, A role for the G12 family of heterotrimeric G proteins in prostate cancer invasion, J Biol Chem 281 (2006) [37] E.C. Turner, D.J. Kavanagh, E.P. Mulvaney, C. McLean, K. Wikstrom, H.M. Reid, B.T. Kinsella, Identification of an interaction between the TPalpha and TPbeta isoforms of the human thomboxane A2 receptor with protein kinase C-related kinase (PRK) 1: implications for prostate cancer, J Biol Chem 286 (2011) [38] M.T. Galgano, M. Conaway, A.M. Spencer, B.M. Paschal, H.F. Frierson, Jr., PRK1 distribution in normal tissues and carcinomas: overexpression and activation in ovarian serous carcinoma, Hum Pathol 40 (2009) [39] E. Metzger, N. Yin, M. Wissmann, N. Kunowska, K. Fischer, N. Friedrichs, D. Patnaik, J.M. Higgins, N. Potier, K.H. Scheidtmann, R. Buettner, R. Schule, Phosphorylation of histone H3 at theonine 11 establishes a novel chomatin mark for transcriptional regulation, Nature cell biology 10 (2008) [40] A.M. Gannon, B.T. Kinsella, The Wilms' tumor suppressor protein WT1 acts as a key transcriptional repressor of the human thomboxane A2 receptor gene in megakaryocytes, J Cell Mol Med 13 (2009) [41] A.M. Gannon, E.C. Turner, H.M. Reid, B.T. Kinsella, Regulated expression of the alpha isoform of the human thomboxane A2 receptor during megakaryocyte differentiation: a coordinated role for WT1, Egr1, and Sp1, J Mol Biol 394 (2009) [42] S. Ariyaratana, D.M. Loeb, The role of the Wilms tumor gene (WT1) in normal and malignant haematopoiesis, Expert Rev Mol Med 9 (2007) [43] M. Gessler, A. Poustka, W. Cavenee, R.L. Neve, S.H. Orkin, G.A. Bruns, Homozygous deletion in Wilms tumors of a zinc-finger gene identified by chomosome jumping, Nature 343 (1990) [44] D.A. Haber, A.J. Buckler, T. Glaser, K.M. Call, J. Pelletier, R.L. Sohn, E.C. Douglass, D.E. Housman, An internal deletion within an 11p13 zinc finger gene contributes to the development of Wilms' tumor, Cell 61 (1990) [45] K.M. Call, T. Glaser, C.Y. Ito, A.J. Buckler, J. Pelletier, D.A. Haber, E.A. Rose, A. Kral, H. Yeger, W.H. Lewis, et al., Isolation and characterization of a zinc finger polypeptide gene at the human chomosome 11 Wilms' tumor locus, Cell 60 (1990) [46] R. Koesters, M. Linnebacher, J.F. Coy, A. Germann, Y. Schwitalle, P. Findeisen, M. von Knebel Doeberitz, WT1 is a tumor-associated antigen in colon cancer that can be recognized by in vitro stimulated cytotoxic T cells, Int J Cancer 109 (2004) [47] H. Miwa, M. Beran, G.F. Saunders, Expression of the Wilms' tumor gene (WT1) in human leukemias, Leukemia 6 (1992) Page 17 of 34
20 [48] D.M. Loeb, E. Evron, C.B. Patel, P.M. Sharma, B. Niranjan, L. Buluwela, S.A. Weitzman, D. Korz, S. Sukumar, Wilms' tumor suppressor gene (WT1) is expressed in primary breast tumors despite tumor-specific promoter methylation, Cancer Res 61 (2001) [49] U. Rodeck, A. Bossler, C. Kari, C.W. Humpheys, T. Gyorfi, J. Maurer, E. Thiel, H.D. Menssen, Expression of the wt1 Wilms' tumor gene by normal and malignant human melanocytes, Int J Cancer 59 (1994) [50] H. Fujii, M.A. Biel, W. Zhou, S.A. Weitzman, S.B. Baylin, E. Gabrielson, Methylation of the HIC-1 candidate tumor suppressor gene in human breast cancer, Oncogene 16 (1998) [51] M.M. Wales, M.A. Biel, W. el Deiry, B.D. Nelkin, J.P. Issa, W.K. Cavenee, S.J. Kuerbitz, S.B. Baylin, p53 activates expression of HIC-1, a new candidate tumor suppressor gene on 17p13.3, Nat Med 1 (1995) [52] J.R. Melki, P.C. Vincent, S.J. Clark, Cancer-specific region of hypermethylation identified within the HIC1 putative tumor suppressor gene in acute myeloid leukaemia, Leukemia 13 (1999) [53] R.A. Morton, Jr., J.J. Watkins, G.S. Bova, M.M. Wales, S.B. Baylin, W.B. Isaacs, Hypermethylation of chomosome 17P locus D17S5 in human prostate tissue, J Urol 156 (1996) [54] K. Tajinda, J. Carroll, C.T. Roberts, Jr., Regulation of insulin-like growth factor I receptor promoter activity by wild-type and mutant versions of the WT1 tumor suppressor, Endocrinology 140 (1999) [55] C. Van Rechem, G. Boulay, S. Pinte, N. Stankovic-Valentin, C. Guerardel, D. Leprince, Differential regulation of HIC1 target genes by CtBP and NuRD, via an acetylation/sumoylation switch, in quiescent versus proliferating cells, Mol Cell Biol 30 (2010) [56] E.C. Turner, B.T. Kinsella, Regulation of the human prostacyclin receptor gene by the cholesterol-responsive SREBP1, J Lipid Res 53 (2012) [57] J. Renshaw, R.M. Orr, M.I. Walton, R. Te Poele, R.D. Williams, E.V. Wancewicz, B.P. Monia, P. Workman, K. Pritchard-Jones, Disruption of WT1 gene expression and exon 5 splicing following cytotoxic drug treatment: antisense down-regulation of exon 5 alters target gene expression and inhibits cell survival, Mol Cancer Ther 3 (2004) [58] B. Foveau, G. Boulay, S. Pinte, C. Van Rechem, B.R. Rood, D. Leprince, The receptor tyrosine kinase EphA2 is a direct target gene of hypermethylated in cancer 1 (HIC1), J Biol Chem 287 (2012) [59] K.J. Livak, T.D. Schmittgen, Analysis of relative gene expression data using real-time quantitative PCR and the 2(-Delta Delta C(T)) Method, Methods 25 (2001) [60] G.L. Keating, E.C. Turner, B.T. Kinsella, Regulation of the human prostacyclin receptor gene in megakaryocytes: Major roles for C/EBPdelta and PU.1, Biochim Biophys Acta 1819 (2012) [61] A.T. Coyle, B.T. Kinsella, Synthetic peroxisome proliferator-activated receptor gamma agonists rosiglitazone and troglitazone suppress transcription by promoter 3 of the human thomboxane A2 receptor gene in human erytholeukemia cells, Biochem Pharmacol 71 (2006) [62] A.T. Coyle, M.B. O'Keeffe, B.T. Kinsella, 15-deoxy Delta12,14-prostaglandin J2 suppresses transcription by promoter 3 of the human thomboxane A2 receptor gene though peroxisome proliferator-activated receptor gamma in human erytholeukemia cells, FEBS J 272 (2005) [63] K. Quandt, K. Frech, H. Karas, E. Wingender, T. Werner, MatInd and MatInspector: new fast and versatile tools for detection of consensus matches in nucleotide sequence data, Nucleic Acids Res 23 (1995) [64] G. Watkins, A. Douglas-Jones, R.E. Mansel, W.G. Jiang, Expression of thomboxane synthase, TBXAS1 and the thomboxane A2 receptor, TBXA2R, in human breast cancer, Int Semin Surg Oncol 2 (2005) 23. [65] P. Hohenstein, N.D. Hastie, The many facets of the Wilms' tumor gene, WT1, Hum Mol Genet 15 Spec No 2 (2006) R [66] E. Miller-Hodges, P. Hohenstein, WT1 in disease: shifting the epithelial-mesenchymal balance, J Pathol 226 (2011) [67] Y. Oka, A. Tsuboi, Y. Oji, I. Kawase, H. Sugiyama, WT1 peptide vaccine for the treatment of cancer, Curr Opin Immunol 20 (2008) [68] Y. Oka, A. Tsuboi, F. Fujiki, Z. Li, H. Nakajima, N. Hosen, T. Shirakata, S. Nishida, Y. Oji, I. Kawase, H. Sugiyama, WT1 peptide vaccine as a paradigm for "cancer antigen-derived peptide"-based immunotherapy for malignancies: successful induction of anti-cancer effect by vaccination with a single kind of WT1 peptide, Anticancer Agents Med Chem 9 (2009) [69] D. Nie, M. Lamberti, A. Zacharek, L. Li, K. Szekeres, K. Tang, Y. Chen, K.V. Honn, Thomboxane A(2) regulation of endothelial cell migration, angiogenesis, and tumor metastasis, Biochem Biophys Res Commun 267 (2000) [70] S. Kajita, K.H. Ruebel, M.B. Casey, N. Nakamura, R.V. Lloyd, Role of COX-2, thomboxane A2 synthase, and prostaglandin I2 synthase in papillary thyroid carcinoma growth, Mod Pathol 18 (2005) [71] K. Eguchi, Y. Kanai, K. Kobayashi, S. Hirohashi, DNA hypermethylation at the D17S5 locus in non-small cell lung cancers: its association with smoking history, Cancer Res 57 (1997) [72] A. Rathi, A.K. Virmani, K. Harada, C.F. Timmons, K. Miyajima, R.J. Hay, D. Mastrangelo, A. Maitra, G.E. Tomlinson, A.F. Gazdar, Aberrant methylation of the HIC1 promoter is a frequent event in specific pediatric neoplasms, Clin Cancer Res 9 (2003) [73] A. Waha, A. Koch, B. Meyer-Puttlitz, S. Weggen, N. Sorensen, J.C. Tonn, S. Albrecht, C.G. Goodyer, F. Berthold, O.D. Wiestler, T. Pietsch, Epigenetic silencing of the HIC-1 gene in human medulloblastomas, J Neuropathol Exp Neurol 62 (2003) Page 18 of 34
21 [74] C. Guerardel, S. Deltour, S. Pinte, D. Monte, A. Begue, A.K. Godwin, D. Leprince, Identification in the human candidate tumor suppressor gene HIC-1 of a new major alternative TATA-less promoter positively regulated by p53, J Biol Chem 276 (2001) [75] S. Pinte, N. Stankovic-Valentin, S. Deltour, B.R. Rood, C. Guerardel, D. Leprince, The tumor suppressor gene HIC1 (hypermethylated in cancer 1) is a sequence-specific transcriptional repressor: definition of its consensus binding sequence and analysis of its DNA binding and repressive properties, J Biol Chem 279 (2004) [76] S. Deltour, C. Guerardel, D. Leprince, Recruitment of SMRT/N-CoR-mSin3A-HDAC-repressing complexes is not a general mechanism for BTB/POZ transcriptional repressors: the case of HIC-1 and gammafbp-b, Proc Natl Acad Sci U S A 96 (1999) [77] S. Deltour, S. Pinte, C. Guerardel, B. Wasylyk, D. Leprince, The human candidate tumor suppressor gene HIC1 recruits CtBP though a degenerate GLDLSKK motif, Mol Cell Biol 22 (2002) [78] M. Hayashi, Y. Tokuchi, T. Hashimoto, S. Hayashi, K. Nishida, Y. Ishikawa, K. Nakagawa, S. Tsuchiya, S. Okumura, E. Tsuchiya, Reduced HIC-1 gene expression in non-small cell lung cancer and its clinical significance, Anticancer Res 21 (2001) [79] Y. Kanai, A.M. Hui, L. Sun, S. Ushijima, M. Sakamoto, H. Tsuda, S. Hirohashi, DNA hypermethylation at the D17S5 locus and reduced HIC-1 mrna expression are associated with hepatocarcinogenesis, Hepatology 29 (1999) [80] C.A. Eads, R.V. Lord, K. Wickramasinghe, T.I. Long, S.K. Kurumboor, L. Bernstein, J.H. Peters, S.R. DeMeester, T.R. DeMeester, K.A. Skinner, P.W. Laird, Epigenetic patterns in the progression of esophageal adenocarcinoma, Cancer Res 61 (2001) [81] G. Nicoll, D.N. Crichton, H.E. McDowell, N. Kernohan, T.R. Hupp, A.M. Thompson, Expression of the Hypermethylated in Cancer gene (HIC-1) is associated with good outcome in human breast cancer, British journal of cancer 85 (2001) [82] R.C. Tostes, D. Nigro, Z.B. Fortes, M.H. Carvalho, Effects of estrogen on the vascular system, Braz J Med Biol Res 36 (2003) [83] W.A. Ricke, Y. Wang, G.R. Cunha, Steroid hormones and carcinogenesis of the prostate: the role of estrogens, Differentiation 75 (2007) [84] G. Carruba, Estrogen and prostate cancer: an eclipsed truth in an androgen-dominated scenario, J Cell Biochem 102 (2007) [85] S.J. Ellem, G.P. Risbridger, The dual, opposing roles of estrogen in the prostate, Ann N Y Acad Sci 1155 (2009) [86] E. Adamson, I. de Belle, S. Mittal, Y. Wang, J. Hayakawa, K. Korkmaz, D. O'Hagan, M. McClelland, D. Mercola, Egr1 signaling in prostate cancer, Cancer Biol Ther 2 (2003) [87] A. Krones-Herzig, E. Adamson, D. Mercola, Early growth response 1 protein, an upstream gatekeeper of the p53 tumor suppressor, controls replicative senescence, Proc Natl Acad Sci U S A 100 (2003) [88] J. Kaczynski, T. Cook, R. Urrutia, Sp1- and Kruppel-like transcription factors, Genome Biol 4 (2003) 206. [89] X.F. Cheng, D. Li, M. Zhuang, Z.Y. Chen, D.X. Lu, T. Hattori, Growth inhibitory effect of Kruppel-like factor 6 on human prostatic carcinoma and renal carcinoma cell lines, Tohoku J Exp Med 216 (2008) [90] X. Huang, X. Li, B. Guo, KLF6 induces apoptosis in prostate cancer cells though up-regulation of ATF3, J Biol Chem 283 (2008) [91] O. Moussa, A.W. Ashton, M. Fraig, E. Garrett-Mayer, M.A. Ghoneim, P.V. Halushka, D.K. Watson, Novel role of thomboxane receptors beta isoform in bladder cancer pathogenesis, Cancer Res 68 (2008) [92] O. Moussa, A. Ciupek, D.K. Watson, P.V. Halushka, Urinary thomboxane B2 and thomboxane receptors in bladder cancer: opportunity for detection and monitoring, Prostaglandins Other Lipid Mediat 96 (2011) Page 19 of 34
22 Table 1. Activator and Repressor Regions identified within Prm1. Cell Type 1 Previously Identified Regulatory Regions 2 : Regulatory Region 2 Position within Prm1 HEL PC3 MCF-7 MDA-MB- 231 URR to Yes Yes Yes Yes URR to Yes Yes Yes Yes RR to Yes Yes Yes Yes UAR to Yes No No No UAR to Yes No No Yes Core to Yes Yes Yes Yes Novel Regulatory Regions Identified in the Current Study: Regulatory Region Position within Prm1 HEL PC3 MCF-7 MDA-MB- 231 Novel URR to No Yes No No Novel UAR to No Yes Yes No Novel UAR to No Yes Yes Yes 1 Transcriptional activity confirmed by luciferase-based genetic reporter assays. 2 [8, 40, 41] Page 20 of 34

 (C)")
 (i)")
")
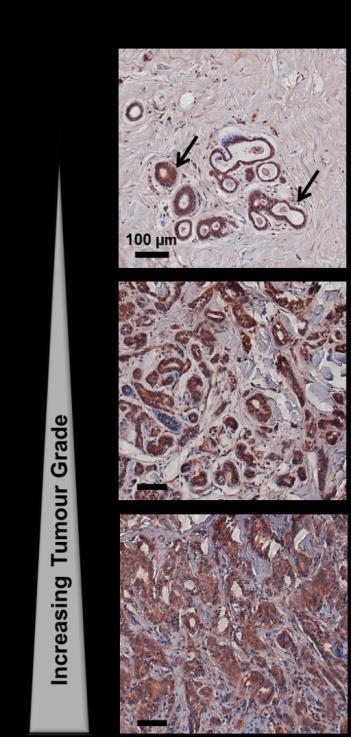
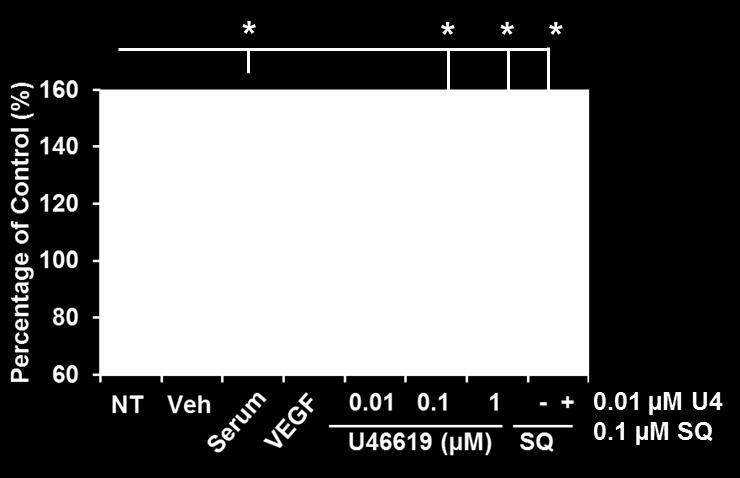
23 Figures & Figure Legends Figure 1 (A) (C) (D) (B) (E) (i) PC3 cells (ii) MDA-MB-231 cells Page 21 of 34
 relative to those")
.")
.")
, 50 ng/ l VEGF, vehicle (0.1 % EtOH, in serum free medium) or non-treated (NT).")
 PC3 and (ii) MDA-MB-231 cells were imaged immediately (0 h) across scratch-wounded cell monolayers or following incubation for 8 or 48 h, respectively, with U46619 (0.01-0.")
24 (F) (i) PC3 cells (ii) MDA-MB-231 cells Figure 1. Analysis of TPα Expression in the Prostate and Breast. Panel A: QT-PCR analysis of TPα mrna expression, normalized relative to 18S rrna levels, where data in the indicated cell lines is presented as mean TPα expression (± SEM, n 3) relative to those levels in HEL cells set to a value of 1. Panel B: pgl3b:prm1, encoding Prm1, was co-transfected with prl-tk into the indicated cell lines and luciferase activity assessed 48 h post-transfection. Results are expressed as mean firefly relative to renilla luciferase activity, expressed in arbitrary RLU (± SEM, n 5). Panels C & D: IHC analysis of paraffin-embedded, formalinfixed tissue from prostate (benign prostate hyperplasia, BPH and increasing tumor grade) and breast tissue (benign and increasing tumor grade) screened with an affinity purified anti-tp antibody (200X magnification; counterstained with haemotoxylin). Panel E: Proliferation of (i) PC3 and (ii) MDA-MB-231 cells incubated for 72 h with either U46619 ( µm), 0.1 µm SQ29,548, or 0.01 µm U46619 plus 0.1 µm SQ29,548 and, as controls, 10% FBS (serum), 50 ng/ l VEGF, vehicle (0.1 % EtOH, in serum free medium) or non-treated (NT). Results are presented as mean cell proliferation, expressed as a percentage of cell proliferation in the presence of the vehicle (%, ± S.E.M, n 3). Panel F: Migration of (i) PC3 and (ii) MDA-MB-231 cells were imaged immediately (0 h) across scratch-wounded cell monolayers or following incubation for 8 or 48 h, respectively, with U46619 ( μm), SQ29,548 (0.1 µm), r 0.05 µm U46619 plus 0.1 µm SQ29,548 and, as controls, 50 ng/μl VEGF or vehicle. Images, captured using a Nikon TMS inverted microscope, were analyzed using TScratch software (V1.0) and data is presented as mean percentage closure ± S.E.M., n 3. Asterisks in E & F indicate where proliferation or migration of PC3 or MDA-MB- 231 cells are significantly altered compared to vehicle-treated cells, where *, ** and *** indicate p > 0.05, 0.01, 0.001, respectively. Page 22 of 34

 GC -8146, (C) GC -6717 and GC -6206, (D) GC -6340 and GC -6276 and (E) HIC1 (a) and HIC1 (b) elements, where the 5 nucleotide of each")

25 (A) Figure 2 (B) (C) (D) (E) Figure 2. Identification of the main Regulatory Regions within Prm1 in PC3 cells Panel A: A schematic of the human TP genomic region spanning nucleotides to +786, where nucleotide +1 corresponds to the translational start site (ATG). Prm1 is located at to relative to ATG. Panels B - E: Schematics of Prm1 showing the positions of (B) GC -8146, (C) GC and GC -6206, (D) GC and GC and (E) HIC1 (a) and HIC1 (b) elements, where the 5 nucleotide of each cis-acting element is indicated and the star symbol indicates mutated elements. Panels A - E: Recombinant pgl3b plasmids encoding Prm1, the 5 deletion subfragments or their mutated derivatives, as indicated, were co-transfected with prl-tk into PC3 cells. Luciferase activity was assayed 48 h post-transfection and results are expressed as mean firefly relative to renilla luciferase activity, expressed in arbitrary RLU (± SEM, n 5). The asterisks indicate that deletion/mutation of Prm1 sequences significantly altered firefly luciferase reporter gene expression in PC3 cells, where *, **, *** and **** indicate p 0.05, 0.01, and , respectively. Page 23 of 34
.")
 GC -8146 (-8460 to -8437; solid arrows), (ii) GC -6717 (-6831 to -6455; open arrows), (iii) GC -6340, GC -6276 and GC -6206 (-6623 to")
 relative to those")
. Cells were harvested at 48 h post-transfection and assayed by QT-PCR analysis to measure TPα mrna expression, normalized relative to 18s rrna expression levels.")
, WT1 (-/-) or, as a negative control, pcdna3.")
26 Figure 3 (A) (B) (C) (D) (E) (F) Figure 3. ChIP Analysis of WT1 Binding to Prm1 in vivo in PC3 cells Panel A: Immunoblot analysis of WT1 and, as a protein loading control, HDJ2 expression in PC3 cells (50 µg whole cell protein/lane). Panel B: ChIP analysis of WT1 binding to Prm1 using either input chomatin or chomatin extracted from anti-wt1, normal rabbit IgG or no 1 antibody control (-AB) immunoprecipitates. PCR analysis was performed using primers to amplify the (i) GC (-8460 to -8437; solid arrows), (ii) GC (-6831 to -6455; open arrows), (iii) GC -6340, GC and GC (-6623 to -5895; grey arrows) regions of Prm1 within the TP gene. As a negative control (iv), primers were used to amplify the Prm3 (-1081 to -695) region of the TP gene (broken arrows). The bar chart shows mean levels of PCR product generated though real time quantitative- PCR from the individual test or control immunoprecipitates expressed as a percentage (± SEM) relative to those levels derived from the corresponding input chomatins. Panel C: PC3 cells were transiently transfected with recombinant pcdna3.1 encoding WT1 (+/-), WT1 (-/-) or, as a negative control, with pcdna3.1 alone (Control). Cells were harvested at 48 h post-transfection and assayed by QT-PCR analysis to measure TPα mrna expression, normalized relative to 18s rrna expression levels. Data is presented as mean relative TPα mrna expression levels (± SEM, n = 3), relative to levels in pcdna3.1 controltransfected cells set to a value of 1. Panels D - F: PC3 cells were transiently co-transfected with prl-tk plus pcdna3.1 encoding WT1 (+/-), WT1 (-/-) or, as a negative control, pcdna3.1 alone (Control) in the presence of either pgl3b:prm1 (Panel D) or pgl3b:prm1i GC(-6206)* (Panel E). In Panels D & E, cells were assayed 48 h posttransfection for mean luciferase activity (RLU ± SEM, n 5) or, in Panel F, were analyzed by immunoblotting to confirm over-expression of WT1 proteins in the transfected PC3 cells where blots were re-screened with anti-hdj-2 antisera to confirm uniform protein loading. Panels A & F: The positions of the molecular size markers (kda) are indicated, where images shown are representative of thee independent experiments. Panels C & D: The asterisks indicate that ectopic expression of WT1 (+/-) and WT1 (-/-) substantially reduced TPα mrna and Prm1-directed luciferase expression, where *and *** indicate p < 0.05 and 0.001, respectively. Page 24 of 34
.")
 HIC1 (a) (-6831 to -6455) and (ii) HIC1 (b) (-6344 to -5895) regions of Prm1 within the TP gene (indicated by solid and open")
 relative to those")


27 Figure 4 (A) (B) (C) (D) (E) (F) Figure 4. ChIP Analysis of HIC1 Binding to Prm1 in vivo in PC3 cells Panel A: Immunoblot analysis of HIC1 and, as protein loading control, HDJ2 expression in PC3 cells (50 µg whole cell protein/lane). Panel B: ChIP analysis of HIC1 binding to Prm1 using either input chomatin or chomatin extracted from anti-hic1, normal rabbit IgG or no 1 antibody (-AB) immunoprecipitates. PCR analysis was performed using primers surrounding the adjacent (i) HIC1 (a) (-6831 to -6455) and (ii) HIC1 (b) (-6344 to -5895) regions of Prm1 within the TP gene (indicated by solid and open arrows, respectively). As a negative control (iii), primers were used to amplify the Prm3 (-1081 to -695) region of the TP gene (broken arrows). The bar chart shows mean levels of PCR product generated though real time quantitative- PCR from the individual test or control immunoprecipitates expressed as a percentage (± SEM) relative to those levels derived from the corresponding input chomatins. Panel C: PC3 cells were transiently transfected with pcdna3.1:hic1, or, as a negative control, with pcdna3.1 alone (Control). Cells were harvested at 48 h post-transfection and assayed by QT-PCR analysis to measure TPα mrna expression, normalized relative to 18s rrna expression levels. Data is presented as mean relative TPα mrna expression levels (± SEM, n = 3), relative to those levels in pcdna3.1 control-transfected cells set to a value of 1. Panels D - F: PC3 cells were transiently co-transfected with prl-tk plus pcdna3.1:hic1 or, as a negative control, with pcdna3.1 alone (Control) in the presence of either pgl3b:prm1d (Panel D) or pgl3b:prm1i HIC1(b)* (Panel E). In Panels D & E, cells were assayed 48 h post-transfection for mean luciferase activity (RLU ± SEM, n 5) or, in Panel F, were analyzed by immunoblotting confirming over-expression of HIC1 protein in transfected PC3 cells where blots were re-screened with anti-hdj2 to confirm uniform protein loading. Panels A & F: The positions of the molecular size markers (kda) are indicated, where images shown are representative of thee independent experiments. Panels C & D: Asterisks indicate that ectopic expression of HIC1 substantially reduced TPα mrna and Prm1-directed luciferase expression, where ** and *** indicate p < 0.01 and 0.001, respectively. Page 25 of 34

 GC -8146, (C) GC -6717 and GC -6206, (D) GC -6340 and GC -6276 and (E) HIC1 (a) and")


28 (A) Figure 5 (B) (C) (D) (E) Figure 5. Identification of the main Regulatory Regions within Prm1 in MCF-7 cells Panel A: A schematic of the human TP genomic region spanning nucleotides to +786, where nucleotide +1 corresponds to the translational start site (ATG). Prm1 is located at to relative to ATG. Panels B - E: Schematics of Prm1 showing the positions of (B) GC -8146, (C) GC and GC -6206, (D) GC and GC and (E) HIC1 (a) and HIC1 (b) elements. In panels B - E, the 5 nucleotide of each cis-acting element is indicated and the star symbol indicates mutated elements. Panels A - E: Recombinant pgl3b plasmids encoding Prm1, the indicated 5 deletion subfragments or their mutated derivatives were co-transfected with prl-tk into MCF-7 cells. Luciferase activity was assessed 48 h post-transfection and results are expressed as mean firefly relative to renilla luciferase activity, expressed in arbitrary RLU (± SEM, n 5). The asterisks indicate that deletion/mutation of Prm1 sequences significantly increased reporter gene expression in MCF-7 cells, where *, **, *** and **** indicate p 0.05, 0.01, and , respectively. Page 26 of 34
.")
 GC -8146 (-8460 to -8437; solid arrows), (ii) GC -6717 (-6831 to -6455; open arrows), (iii) GC -6340, GC -6276 and GC -6206 (-6623 to")
 relative to those")
29 WT1 Keating GL et al TPa Prm1 in BCa & PCa BBA (GRM), (2014)1439, Figure 6 (A) (54 kda) (52 kda) (kda) (B) HDJ2 (44kDa) 44 (C) (D) (E) (F) Figure 6. ChIP Analysis of WT1 Binding to Prm1 in vivo in MCF-7 cells Panel A: Immunoblot analysis of WT1 and, as protein loading control, HDJ2 expression in MCF-7 cells (50 µg whole cell protein/lane). Panel B: ChIP analysis of WT1 binding to Prm1 using either input chomatin or chomatin extracted from anti-wt1, normal rabbit IgG or no 1 antibody control (-AB) immunoprecipitates. PCR analysis was performed using primers to amplify the (i) GC (-8460 to -8437; solid arrows), (ii) GC (-6831 to -6455; open arrows), (iii) GC -6340, GC and GC (-6623 to -5895; grey arrows) regions of Prm1 within the TP gene. As a negative control (iv), primers were used to amplify the Prm3 (-1081 to -695) region of the TP gene (broken arrows). The bar chart shows mean levels of PCR product generated though real time quantitative- PCR from the individual test or control immunoprecipitates expressed as a percentage (± SEM) relative to those levels derived from the corresponding input chomatins. Panel C: MCF-7 cells were transiently transfected with recombinant pcdna3.1 encoding WT1 (+/-), WT1 (-/- ), or, as a negative control, with pcdna3.1 alone (Control). Cells were harvested at 48 h post-transfection and assayed by QT-PCR analysis to measure TPα mrna expression, normalized relative to 18s rrna expression levels. Data is presented as mean relative TPα mrna expression levels (± SEM, n = 3), relative to levels in pcdna3.1 controltransfected cells set to a value of 1. Panels D -F: MCF-7 cells were transiently co-transfected with prl-tk plus pcdna3.1 encoding WT1 (+/-), WT1 (-/-) or, as a negative control, pcdna3.1 alone (Control) in the presence of either pgl3b:prm1 (Panel D) or pgl3b:prm1i GC(-6206)* (Panel E). In Panels D & E, cells were assayed 48 h posttransfection for mean luciferase activity (RLU ± SEM, n 5) or, in Panel F, were analyzed by immunoblotting to confirm over-expression of WT1 proteins in the transfected MCF-7 cells where blots were re-screened with anti-hdj-2 antisera to confirm uniform protein loading. Panels A & F: The positions of the molecular size markers (kda) are indicated, and images are representative of thee independent experiments. Panels C & D: the asterisks indicate that ectopic expression of WT1 (+/-) and WT1 (-/-) substantially reduced TPα mrna and Prm1-directed luciferase expression, where *, ** and *** indicate p < 0.05, 0.01, and 0.001, respectively. Page 27 of 34
.")
 HIC1 (a) (-6831 to -6455) and (ii) HIC1 (b) (-6344 to -5895) regions of Prm1 within the TP gene (indicated by solid and open")
 relative to")


 or, in Panel F, were analyzed by immunoblotting confirming over-expression of HIC1 protein")
30 Figure 7 (A) (B) (C) (D) (E) (F) Figure 7. ChIP Analysis of HIC1 Binding to Prm1 in vivo in MCF-7 cells Panel A: Immunoblot analysis of HIC1 and, as protein loading control, HDJ2 expression in MCF-7 cells (50 µg whole cell protein/lane). Panel B: ChIP analysis of HIC1 binding to Prm1, using either input chomatin or chomatin extracted from anti-hic1, normal rabbit IgG or no 1 antibody (-AB) immunoprecipitates. PCR analysis was performed using primers surrounding the adjacent (i) HIC1 (a) (-6831 to -6455) and (ii) HIC1 (b) (-6344 to -5895) regions of Prm1 within the TP gene (indicated by solid and open arrows, respectively). As a negative control (iii), primers were used to amplify the Prm3 (-1081 to -695) region of the TP gene (broken arrows). The bar chart shows mean levels of PCR product generated though real time quantitative- PCR from the individual test or control immunoprecipitates expressed as a percentage (± SEM) relative to those levels derived from the corresponding input chomatins. Panel C: MCF-7 cells were transiently transfected with pcdna3.1:hic1 or, as a negative control, with pcdna3.1 alone (Control). Cells were harvested at 48 h post-transfection and assayed by QT-PCR analysis to measure TPα mrna expression, normalized relative to 18s rrna expression levels. Data is presented as mean relative TPα mrna expression levels (± SEM, n = 3), relative to those levels in pcdna3.1 control-transfected cells set to a value of 1. Panels D - F: MCF-7 cells were transiently co-transfected with prl-tk plus pcdna3.1:hic1 or, as a negative control, with pcdna3.1 alone (Control) in the presence of either pgl3b:prm1d (Panel D) or pgl3b:prm1i HIC1(b) * (Panel E). In Panels D & E, cells were assayed 48 h post-transfection for mean luciferase activity (RLU ± SEM, n 5) or, in Panel F, were analyzed by immunoblotting confirming over-expression of HIC1 protein in transfected MCF-7 cells where blots were re-screened with anti-hdj2 to confirm uniform protein loading. Panels A & F: The positions of the molecular size markers (kda) are indicated, and images are representative of thee independent experiments. Panels C & D: Asterisks indicate that ectopic expression of HIC1 substantially reduced TPα mrna and Prm1-directed luciferase expression, where ** and *** indicate p < 0.01 and 0.001, respectively. Page 28 of 34
 Anti-TPα + TPα Peptide (iv) Anti-TPα + TPβ Peptide Supplemental Figure 1.")
 in the absence of a")
 immunogenic TP peptide, (iv) but")
 and (iv) indicate specific detection of TP expression in the prostate glandular")
31 Supplemental Figures & Supplemental Figure Legends Supplemental Figure 1 (i) No Primary Ab (ii) Anti-TPα 100 µm (iii) Anti-TPα + TPα Peptide (iv) Anti-TPα + TPβ Peptide Supplemental Figure 1. IHC Analysis of TPα Expression. IHC analyses of paraffin-embedded, formalin-fixed prostate tissue screened either (i) in the absence of a primary antibody or with the (ii) affinity purified anti-tp antibody. The specificity of the anti-tp antibody was confirmed whereby the (iii) immunogenic TP peptide, (iv) but not a TP peptide, competed out the anti-tp immune-staining. The arrows in (ii) and (iv) indicate specific detection of TP expression in the prostate glandular epithelial cells and in the fibromuscular stromal smooth muscle cells. All sections were counterstained with haemotoxylin and images shown were captured at 200X magnification. Page 29 of 34
 and Prm3 (-1394 to +1), where the relative positions of exon (E) 1, intron (I) 1 and")
32 Supplemental Figure 2 Supplemental Figure 2. Localization of the main Regulatory Regions within Prm1 in HEL cells. A schematic of the human TP genomic region spanning nucleotides to +786 and encoding Prm1 (-8500 to -5895) and Prm3 (-1394 to +1), where the relative positions of exon (E) 1, intron (I) 1 and E2 are indicated. Nucleotide +1 corresponds to the translational start site (ATG). The positions of upstream activator region (UAR) 1 and UAR2, upstream repressor region (URR) 1 and URR2, and of repressor region (RR) 3 within the core Prm1 are also indicated. Recombinant pgl3b plasmids encoding Prm1, the indicated 5 deletion subfragments of Prm1 or, as controls, pgl3b:sv40 and pgl3b were co-transfected with prl-tk into HEL cells. Cells were assayed for luciferase activity 48 h post-transfection and results are expressed as mean firefly relative to renilla luciferase activity, expressed in arbitrary RLU (± SEM, n 6). The asterisks indicate that deletion of Prm1 sequences yielded significant changes in reporter gene expression in HEL cells, where **, *** and **** indicate p 0.01, and , respectively. Page 30 of 34
 and/or MCF-7 (Panels C & D) cells were transfected with sirna WT1, sirna HIC1 or the scrambled controls (sirna Control ).")

33 Supplemental Figure 3 (A) (B) (i) sirna WT1 (ii) sirna HIC1 (C) (D) (i) sirna WT1 (ii) sirna HIC1 Supplemental Figure 3. Effect of sirna-mediated down-regulation of WT1 and HIC1 on TP mrna expression. PC3 (Panels A & B) and/or MCF-7 (Panels C & D) cells were transfected with sirna WT1, sirna HIC1 or the scrambled controls (sirna Control ). The effect of sirna knockdown of WT1 or HIC1 expression on TP WT1 and/or HIC1 mrna expression was assessed by qrt-pcr, as indicated. In Panels A & C, the asterisks indicate that sirna-mediated down-regulation of WT1 and HIC1 expression led to significant increases in TP mrna expression at 72 h post-sirna transfection, where *, and **** indicate p 0.05 and , respectively. Panels B & D: qrt-pcr analysis of WT1 and/or HIC1 mrna following transfection of cells for 0 72 h, as indicated, with either sirna WT1, sirna HIC1 or the scrambled controls (sirna Control ). The asterisks indicate that sirna-mediated down-regulation led to significant decreases in WT1 and HIC1 mrna expression, where **, *** and **** indicate p 0.01, and , respectively. The insets in B show expression of WT1 and HIC1 by SDS-PAGE and immunoblotting (IB), where membranes were backblotted with anti-hdj-2 antibody to confirm uniform protein loading. The relative positions of the molecular size markers (kda) are indicated. Data; n 3. Page 31 of 34


 HIC1 (a) and HIC1 (b) elements, where the 5 nucleotide of each cis-acting element is indicated and the")


34 (A) Supplemental Figure 4 (B) (C) (D) (E) Supplemental Figure 4. Identification of the main Regulatory Regions within Prm1 in MDA-MB-231 cells Panel A: A schematic of the human TP genomic region spanning nucleotides to +786, where nucleotide +1 corresponds to the translational start site (ATG). Prm1 is located at to relative to ATG. Panels B - E: Schematics of Prm1 showing the positions of (B) GC -8146, (C) GC and GC -6206, (D) GC and GC and (E) HIC1 (a) and HIC1 (b) elements, where the 5 nucleotide of each cis-acting element is indicated and the star symbol indicates mutated elements. Panels A E: Recombinant pgl3b plasmids encoding Prm1, the indicated 5 deletion subfragments or their mutated derivatives were co-transfected with prl-tk into MDA-MB-231 cells. Cells were assayed for luciferase activity 48 h post-transfection and results are expressed as mean firefly relative to renilla luciferase activity, expressed in arbitrary RLU (± SEM, n 5). The asterisks indicate that deletion/mutation of Prm1 sequences significantly altered reporter gene expression, where *, **, *** and **** indicate p 0.05, 0.01, and , respectively. Page 32 of 34

 GC -8146 (-8460 to -8437; solid arrows), (ii) GC -6717 (-6831 to -6455; open arrows), (iii) GC -6340, GC -6276 and GC -6206 (-6623 to")
 relative to those")
, WT1 (-/-) or, as a negative control, with pcdna3.1 alone (Control).")
, relative to levels in pcdna3.1 control-transfected cells set to a value of 1.")
35 Supplemental Figure 5 (A) (B) (C) (D) (E) WT1 (+/-) WT1 (-/-) Control (F) Supplemental Figure 5. ChIP Analysis of WT1 Binding to Prm1 in vivo in MDA-MB-231 cells Panel A: Immunoblot analysis of WT1 and, as protein loading control, HDJ2 expression in MDA-MB-231 cells (50 µg whole cell protein/lane). Panel B: ChIP analysis of WT1 binding to Prm1 using either input chomatin or chomatin extracted from anti-wt1, normal rabbit IgG or no 1 antibody control(-ab) immunoprecipitates. PCR analysis was performed using primers to amplify the (i) GC (-8460 to -8437; solid arrows), (ii) GC (-6831 to -6455; open arrows), (iii) GC -6340, GC and GC (-6623 to -5895; grey arrows) regions of Prm1 within the TP gene. As a negative control (iv), primers were used to amplify the Prm3 (-1081 to -695) region of the TP gene (indicated by broken arrows). The bar chart shows mean levels of PCR product generated though real time quantitative- PCR from the individual test or control immunoprecipitates expressed as a percentage (± SEM) relative to those levels derived from the corresponding input chomatins. Panel C: MDA-MB-231 cells were transiently transfected with recombinant pcdna3.1 encoding WT1 (+/-), WT1 (-/-) or, as a negative control, with pcdna3.1 alone (Control). Cells were harvested at 48 h post-transfection and assayed by QT-PCR analysis to measure TPα mrna expression, normalized relative to 18s rrna expression levels. Data is presented as mean relative TPα mrna expression levels (± SEM, n = 3), relative to levels in pcdna3.1 control-transfected cells set to a value of 1. Panels D - F: MDA-MB-231 cells were transiently co-transfected with prl-tk plus pcdna3.1 encoding WT1 (+/-), WT1 (-/-) or, as a negative control, pcdna3.1 alone (Control) in the presence of either pgl3b:prm1 (Panel D) or pgl3b:prm1i GC(-6206)* (Panel E). In Panels D & E, cells were assayed 48 h post-transfection for mean luciferase activity (RLU ± SEM, n 5) or, in Panel F, were analyzed by immunoblotting to confirm over-expression of WT1 proteins in the transfected MDA-MB-231 cells where blots were re-screened with anti-hdj-2 antisera to confirm uniform protein loading. Panels A & F: The positions of the molecular size markers (kda) are indicated, and images are representative of thee independent experiments. Panels C & D: The asterisks indicate that ectopic expression of WT1 (+/-) and WT1 (-/-) substantially reduced TPα mrna and Prm1-directed luciferase expression, where *** indicates p < Page 33 of 34
(A) PCR primers (arrows) designed to distinguish wild type (P1+P2), targeted (P1+P2) and excised (P1+P3)14-
 PCR primers (arrows) designed to distinguish wild type (P1+P2), targeted (P1+P2) and excised (P1+P3)14-") 1 Supplemental Figure Legends Figure S1. Mammary tumors of ErbB2 KI mice with 14-3-3σ ablation have elevated ErbB2 transcript levels and cell proliferation (A) PCR primers (arrows) designed to distinguish
1 Supplemental Figure Legends Figure S1. Mammary tumors of ErbB2 KI mice with 14-3-3σ ablation have elevated ErbB2 transcript levels and cell proliferation (A) PCR primers (arrows) designed to distinguish
Soft Agar Assay. For each cell pool, 100,000 cells were resuspended in 0.35% (w/v)
") SUPPLEMENTARY MATERIAL AND METHODS Soft Agar Assay. For each cell pool, 100,000 cells were resuspended in 0.35% (w/v) top agar (LONZA, SeaKem LE Agarose cat.5004) and plated onto 0.5% (w/v) basal agar.
SUPPLEMENTARY MATERIAL AND METHODS Soft Agar Assay. For each cell pool, 100,000 cells were resuspended in 0.35% (w/v) top agar (LONZA, SeaKem LE Agarose cat.5004) and plated onto 0.5% (w/v) basal agar.
Supplementary data Supplementary Figure 1 Supplementary Figure 2
 Supplementary data Supplementary Figure 1 SPHK1 sirna increases RANKL-induced osteoclastogenesis in RAW264.7 cell culture. (A) RAW264.7 cells were transfected with oligocassettes containing SPHK1 sirna
SUPPLEMENTARY INFORMATION
 SUPPLEMENTARY INFORMATION FOR Liver X Receptor α mediates hepatic triglyceride accumulation through upregulation of G0/G1 Switch Gene 2 (G0S2) expression I: SUPPLEMENTARY METHODS II: SUPPLEMENTARY FIGURES
HEK293FT cells were transiently transfected with reporters, N3-ICD construct and
 Supplementary Information Luciferase reporter assay HEK293FT cells were transiently transfected with reporters, N3-ICD construct and increased amounts of wild type or kinase inactive EGFR. Transfections
Supplementary Information POLO-LIKE KINASE 1 FACILITATES LOSS OF PTEN-INDUCED PROSTATE CANCER FORMATION
 Supplementary Information POLO-LIKE KINASE 1 FACILITATES LOSS OF PTEN-INDUCED PROSTATE CANCER FORMATION X. Shawn Liu 1, 3, Bing Song 2, 3, Bennett D. Elzey 3, 4, Timothy L. Ratliff 3, 4, Stephen F. Konieczny
MTC-TT and TPC-1 cell lines were cultured in RPMI medium (Gibco, Breda, The Netherlands)
") Supplemental data Materials and Methods Cell culture MTC-TT and TPC-1 cell lines were cultured in RPMI medium (Gibco, Breda, The Netherlands) supplemented with 15% or 10% (for TPC-1) fetal bovine serum
Supplemental data Materials and Methods Cell culture MTC-TT and TPC-1 cell lines were cultured in RPMI medium (Gibco, Breda, The Netherlands) supplemented with 15% or 10% (for TPC-1) fetal bovine serum
Regulation of the Human Prostacyclin Receptor Gene by the Cholesterol-responsive Sterol Response Element Binding Protein (SREBP) 1.
 1.") Regulation of the Human Prostacyclin Receptor Gene by the Cholesterol-responsive Sterol Response Element Binding Protein (SREBP) 1. Elizebeth C. Turner and B. Therese Kinsella* UCD School of Biomolecular
Regulation of the Human Prostacyclin Receptor Gene by the Cholesterol-responsive Sterol Response Element Binding Protein (SREBP) 1. Elizebeth C. Turner and B. Therese Kinsella* UCD School of Biomolecular
Protocol for Gene Transfection & Western Blotting
 The schedule and the manual of basic techniques for cell culture Advanced Protocol for Gene Transfection & Western Blotting Schedule Day 1 26/07/2008 Transfection Day 3 28/07/2008 Cell lysis Immunoprecipitation
The Schedule and the Manual of Basic Techniques for Cell Culture
 The Schedule and the Manual of Basic Techniques for Cell Culture 1 Materials Calcium Phosphate Transfection Kit: Invitrogen Cat.No.K2780-01 Falcon tube (Cat No.35-2054:12 x 75 mm, 5 ml tube) Cell: 293
(a) Significant biological processes (upper panel) and disease biomarkers (lower panel)
 Significant biological processes (upper panel) and disease biomarkers (lower panel)") Supplementary Figure 1. Functional enrichment analyses of secretomic proteins. (a) Significant biological processes (upper panel) and disease biomarkers (lower panel) 2 involved by hrab37-mediated secretory
Supplementary Figure 1. Functional enrichment analyses of secretomic proteins. (a) Significant biological processes (upper panel) and disease biomarkers (lower panel) 2 involved by hrab37-mediated secretory
Supplementary Information
 Supplementary Information Supplementary Figure 1. CD4 + T cell activation and lack of apoptosis after crosslinking with anti-cd3 + anti-cd28 + anti-cd160. (a) Flow cytometry of anti-cd160 (5D.10A11) binding
TFEB-mediated increase in peripheral lysosomes regulates. Store Operated Calcium Entry
 TFEB-mediated increase in peripheral lysosomes regulates Store Operated Calcium Entry Luigi Sbano, Massimo Bonora, Saverio Marchi, Federica Baldassari, Diego L. Medina, Andrea Ballabio, Carlotta Giorgi
HCC1937 is the HCC1937-pcDNA3 cell line, which was derived from a breast cancer with a mutation
 SUPPLEMENTARY INFORMATION Materials and Methods Human cell lines and culture conditions HCC1937 is the HCC1937-pcDNA3 cell line, which was derived from a breast cancer with a mutation in exon 20 of BRCA1
SUPPLEMENTAL INFORMATION
 SUPPLEMENTAL INFORMATION EXPERIMENTAL PROCEDURES Tryptic digestion protection experiments - PCSK9 with Ab-3D5 (1:1 molar ratio) in 50 mm Tris, ph 8.0, 150 mm NaCl was incubated overnight at 4 o C. The
MicroRNA sponges: competitive inhibitors of small RNAs in mammalian cells
 MicroRNA sponges: competitive inhibitors of small RNAs in mammalian cells Margaret S Ebert, Joel R Neilson & Phillip A Sharp Supplementary figures and text: Supplementary Figure 1. Effect of sponges on
Regulation of the human prostacyclin receptor gene by the cholesterol-responsive SREBP1
 Regulation of the human prostacyclin receptor gene by the cholesterol-responsive SREBP1 Elizebeth C. Turner and B. Therese Kinsella 1 UCD School of Biomolecular and Biomedical Sciences, UCD Conway Institute
(Stratagene, La Jolla, CA) (Supplemental Fig. 1A). A 5.4-kb EcoRI fragment
 (Supplemental Fig. 1A). A 5.4-kb EcoRI fragment") SUPPLEMENTAL INFORMATION Supplemental Methods Generation of RyR2-S2808D Mice Murine genomic RyR2 clones were isolated from a 129/SvEvTacfBR λ-phage library (Stratagene, La Jolla, CA) (Supplemental Fig.
SUPPLEMENTAL INFORMATION Supplemental Methods Generation of RyR2-S2808D Mice Murine genomic RyR2 clones were isolated from a 129/SvEvTacfBR λ-phage library (Stratagene, La Jolla, CA) (Supplemental Fig.
Supplementary Figure 1 Role of Raf-1 in TLR2-Dectin-1-mediated cytokine expression
 Supplementary Figure 1 Supplementary Figure 1 Role of Raf-1 in TLR2-Dectin-1-mediated cytokine expression. Quantitative real-time PCR of indicated mrnas in DCs stimulated with TLR2-Dectin-1 agonist zymosan
hexahistidine tagged GRP78 devoid of the KDEL motif (GRP78-His) on SDS-PAGE. This
 on SDS-PAGE. This") SUPPLEMENTAL FIGURE LEGEND Fig. S1. Generation and characterization of. (A) Coomassie staining of soluble hexahistidine tagged GRP78 devoid of the KDEL motif (GRP78-His) on SDS-PAGE. This protein was expressed
SUPPLEMENTAL FIGURE LEGEND Fig. S1. Generation and characterization of. (A) Coomassie staining of soluble hexahistidine tagged GRP78 devoid of the KDEL motif (GRP78-His) on SDS-PAGE. This protein was expressed
Supplementary Information and Figure legends
 Supplementary Information and Figure legends Table S1. Primers for quantitative RT-PCR Target Sequence (5 -> 3 ) Target Sequence (5 -> 3 ) DAB2IP F:TGGACGATGTGCTCTATGCC R:GGATGGTGATGGTTTGGTAG Snail F:CCTCCCTGTCAGATGAGGAC
p47 negatively regulates IKK activation by inducing the lysosomal degradation of polyubiquitinated NEMO
 Supplementary Information p47 negatively regulates IKK activation by inducing the lysosomal degradation of polyubiquitinated NEMO Yuri Shibata, Masaaki Oyama, Hiroko Kozuka-Hata, Xiao Han, Yuetsu Tanaka,
A Hepatocyte Growth Factor Receptor (Met) Insulin Receptor hybrid governs hepatic glucose metabolism SUPPLEMENTARY FIGURES, LEGENDS AND METHODS
 Insulin Receptor hybrid governs hepatic glucose metabolism SUPPLEMENTARY FIGURES, LEGENDS AND METHODS") A Hepatocyte Growth Factor Receptor (Met) Insulin Receptor hybrid governs hepatic glucose metabolism Arlee Fafalios, Jihong Ma, Xinping Tan, John Stoops, Jianhua Luo, Marie C. DeFrances and Reza Zarnegar
A Hepatocyte Growth Factor Receptor (Met) Insulin Receptor hybrid governs hepatic glucose metabolism Arlee Fafalios, Jihong Ma, Xinping Tan, John Stoops, Jianhua Luo, Marie C. DeFrances and Reza Zarnegar
Supplementary Information Titles Journal: Nature Medicine
 Supplementary Information Titles Journal: Nature Medicine Article Title: Corresponding Author: Supplementary Item & Number Supplementary Fig.1 Fig.2 Fig.3 Fig.4 Fig.5 Fig.6 Fig.7 Fig.8 Fig.9 Fig. Fig.11
Supplementary Figure 1. HOPX is hypermethylated in NPC. (a) Methylation levels of HOPX in Normal (n = 24) and NPC (n = 24) tissues from the
 Methylation levels of HOPX in Normal (n = 24) and NPC (n = 24) tissues from the") Supplementary Figure 1. HOPX is hypermethylated in NPC. (a) Methylation levels of HOPX in Normal (n = 24) and NPC (n = 24) tissues from the genome-wide methylation microarray data. Mean ± s.d.; Student
Supplementary Figure 1. HOPX is hypermethylated in NPC. (a) Methylation levels of HOPX in Normal (n = 24) and NPC (n = 24) tissues from the genome-wide methylation microarray data. Mean ± s.d.; Student
TRAF6 ubiquitinates TGFβ type I receptor to promote its cleavage and nuclear translocation in cancer
 Supplementary Information TRAF6 ubiquitinates TGFβ type I receptor to promote its cleavage and nuclear translocation in cancer Yabing Mu, Reshma Sundar, Noopur Thakur, Maria Ekman, Shyam Kumar Gudey, Mariya
Supporting Information
 Supporting Information Pang et al. 10.1073/pnas.1322009111 SI Materials and Methods ELISAs. These assays were performed as previously described (1). ELISA plates (MaxiSorp Nunc; Thermo Fisher Scientific)
Graveley Lab shrna knockdown followed by RNA-seq Biosample Preparation and Characterization Document
 Graveley Lab shrna knockdown followed by RNA-seq Biosample Preparation and Characterization Document Wet Lab: Sara Olson and Lijun Zhan Computational Lab: Xintao Wei and Michael Duff PI: Brenton Graveley
Analysis of small RNAs from Drosophila Schneider cells using the Small RNA assay on the Agilent 2100 bioanalyzer. Application Note
 Analysis of small RNAs from Drosophila Schneider cells using the Small RNA assay on the Agilent 2100 bioanalyzer Application Note Odile Sismeiro, Jean-Yves Coppée, Christophe Antoniewski, and Hélène Thomassin
Table S1. Primer sequences used for qrt-pcr. CACCATTGGCAATGAGCGGTTC AGGTCTTTGCGGATGTCCACGT ACTB AAGTCCATGTGCTGGCAGCACT ATCACCACTCCGAAGTCCGTCT LCOR
 Table S1. Primer sequences used for qrt-pcr. ACTB LCOR KLF6 CTBP1 CDKN1A CDH1 ATF3 PLAU MMP9 TFPI2 CACCATTGGCAATGAGCGGTTC AGGTCTTTGCGGATGTCCACGT AAGTCCATGTGCTGGCAGCACT ATCACCACTCCGAAGTCCGTCT CGGCTGCAGGAAAGTTTACA
Supplemental information
 Carcinoemryonic antigen-related cell adhesion molecule 6 (CEACAM6) promotes EGF receptor signaling of oral squamous cell carcinoma metastasis via the complex N-glycosylation y Chiang et al. Supplemental
Cell isolation. Spleen and lymph nodes (axillary, inguinal) were removed from mice
 were removed from mice") Supplementary Methods: Cell isolation. Spleen and lymph nodes (axillary, inguinal) were removed from mice and gently meshed in DMEM containing 10% FBS to prepare for single cell suspensions. CD4 + CD25
Supplementary Methods: Cell isolation. Spleen and lymph nodes (axillary, inguinal) were removed from mice and gently meshed in DMEM containing 10% FBS to prepare for single cell suspensions. CD4 + CD25
Online Data Supplement. Anti-aging Gene Klotho Enhances Glucose-induced Insulin Secretion by Upregulating Plasma Membrane Retention of TRPV2
 Online Data Supplement Anti-aging Gene Klotho Enhances Glucose-induced Insulin Secretion by Upregulating Plasma Membrane Retention of TRPV2 Yi Lin and Zhongjie Sun Department of physiology, college of
Data Sheet TIGIT / NFAT Reporter - Jurkat Cell Line Catalog #60538
 Data Sheet TIGIT / NFAT Reporter - Jurkat Cell Line Catalog #60538 Background: TIGIT is a co-inhibitory receptor that is highly expressed in Natural Killer (NK) cells, activated CD4+, CD8+ and regulatory
Supplementary information
 Supplementary information Human Cytomegalovirus MicroRNA mir-us4-1 Inhibits CD8 + T Cell Response by Targeting ERAP1 Sungchul Kim, Sanghyun Lee, Jinwook Shin, Youngkyun Kim, Irini Evnouchidou, Donghyun
General Laboratory methods Plasma analysis: Gene Expression Analysis: Immunoblot analysis: Immunohistochemistry:
 General Laboratory methods Plasma analysis: Plasma insulin (Mercodia, Sweden), leptin (duoset, R&D Systems Europe, Abingdon, United Kingdom), IL-6, TNFα and adiponectin levels (Quantikine kits, R&D Systems
Construction of a hepatocellular carcinoma cell line that stably expresses stathmin with a Ser25 phosphorylation site mutation
 Construction of a hepatocellular carcinoma cell line that stably expresses stathmin with a Ser25 phosphorylation site mutation J. Du 1, Z.H. Tao 2, J. Li 2, Y.K. Liu 3 and L. Gan 2 1 Department of Chemistry,
SUPPORTING MATREALS. Methods and Materials
 SUPPORTING MATREALS Methods and Materials Cell Culture MC3T3-E1 (subclone 4) cells were maintained in -MEM with 10% FBS, 1% Pen/Strep at 37ºC in a humidified incubator with 5% CO2. MC3T3 cell differentiation
RayBio KinaseSTAR TM Akt Activity Assay Kit
 Activity Assay Kit User Manual Version 1.0 March 13, 2015 RayBio KinaseSTAR TM Akt Activity Kit Protocol (Cat#: 68AT-Akt-S40) RayBiotech, Inc. We Provide You With Excellent Support And Service Tel:(Toll
Impact of hyper-o-glcnacylation on apoptosis and NF-κB activity SUPPLEMENTARY METHODS
 SUPPLEMENTARY METHODS 3D culture and cell proliferation- MiaPaCa-2 cell culture in 3D was performed as described previously (1). Briefly, 8-well glass chamber slides were evenly coated with 50 µl/well
Supplemental Information
 Supplemental Information Supplemental Experimental Procedures: Tissue culture and cell lines Cell culture was conducted as described earlier (Wang et al., 2011). PA-1 and MCF7 were maintained in Eagle's
Islet viability assay and Glucose Stimulated Insulin Secretion assay RT-PCR and Western Blot
 Islet viability assay and Glucose Stimulated Insulin Secretion assay Islet cell viability was determined by colorimetric (3-(4,5-dimethylthiazol-2-yl)-2,5- diphenyltetrazolium bromide assay using CellTiter
York criteria, 6 RA patients and 10 age- and gender-matched healthy controls (HCs).
.") MATERIALS AND METHODS Study population Blood samples were obtained from 15 patients with AS fulfilling the modified New York criteria, 6 RA patients and 10 age- and gender-matched healthy controls (HCs).
MATERIALS AND METHODS Study population Blood samples were obtained from 15 patients with AS fulfilling the modified New York criteria, 6 RA patients and 10 age- and gender-matched healthy controls (HCs).
Supplementary Figure S1. Venn diagram analysis of mrna microarray data and mirna target analysis. (a) Western blot analysis of T lymphoblasts (CLS)
 Western blot analysis of T lymphoblasts (CLS)") Supplementary Figure S1. Venn diagram analysis of mrna microarray data and mirna target analysis. (a) Western blot analysis of T lymphoblasts (CLS) and their exosomes (EXO) in resting (REST) and activated
Supplementary Figure S1. Venn diagram analysis of mrna microarray data and mirna target analysis. (a) Western blot analysis of T lymphoblasts (CLS) and their exosomes (EXO) in resting (REST) and activated
RNA extraction, RT-PCR and real-time PCR. Total RNA were extracted using
 Supplementary Information Materials and Methods RNA extraction, RT-PCR and real-time PCR. Total RNA were extracted using Trizol reagent (Invitrogen,Carlsbad, CA) according to the manufacturer's instructions.
Supplemental Data. TGF-β-mediated mir-181a expression promotes breast cancer metastasis by targeting Bim.
 Supplemental Data TGF-β-mediated mir-181a expression promotes breast cancer metastasis by targeting Bim. Molly A. Taylor 1, Khalid Sossey-Alaoui 2, Cheryl L. Thompson 3, David Danielpour 4, and William
SOMAPLEX REVERSE PHASE PROTEIN MICROARRAY HUMAN KIDNEY TUMOR & NORMAL TISSUE
 SOMAPLEX REVERSE PHASE PROTEIN MICROARRAY HUMAN KIDNEY TUMOR & NORMAL TISSUE 45 CLINICAL CASES SERIAL DILUTION MULTIPLE PROTEIN CONCENTRATION QUANTITATIVE ASSAY PRODUCT NUMBER: PM1-001-N SOMAPLEX REVERSE
Supplementary Figure 1
 A B D Relative TAp73 mrna p73 Supplementary Figure 1 25 2 15 1 5 p63 _-tub. MDA-468 HCC1143 HCC38 SUM149 MDA-468 HCC1143 HCC38 SUM149 HCC-1937 MDA-MB-468 ΔNp63_ TAp73_ TAp73β E C Relative ΔNp63 mrna TAp73
Figure S1 Time-dependent down-modulation of HER3 by EZN No Treatment. EZN-3920, 2 μm. Time, h
 Figure S1 Time-dependent down-modulation of HER3 by EZN-392 HE ER3 mrna A, %Contr rol 12 No Treatment EZN-392, 2 μm 1 8 6 4 2 2 8 24 Time, h Figure S2. Specific target down-modulation by HER3 (EZN-392)
(a) Schematic diagram of the FS mutation of UVRAG in exon 8 containing the highly instable
 Schematic diagram of the FS mutation of UVRAG in exon 8 containing the highly instable") Supplementary Figure 1. Frameshift (FS) mutation in UVRAG. (a) Schematic diagram of the FS mutation of UVRAG in exon 8 containing the highly instable A 10 DNA repeat, generating a premature stop codon
Supplementary Figure 1. Frameshift (FS) mutation in UVRAG. (a) Schematic diagram of the FS mutation of UVRAG in exon 8 containing the highly instable A 10 DNA repeat, generating a premature stop codon
HIV-1 Virus-like Particle Budding Assay Nathan H Vande Burgt, Luis J Cocka * and Paul Bates
 HIV-1 Virus-like Particle Budding Assay Nathan H Vande Burgt, Luis J Cocka * and Paul Bates Department of Microbiology, Perelman School of Medicine at the University of Pennsylvania, Philadelphia, USA
Supplementary Figure (OH) 22 nanoparticles did not affect cell viability and apoposis. MDA-MB-231, MCF-7, MCF-10A and BT549 cells were
 22 nanoparticles did not affect cell viability and apoposis. MDA-MB-231, MCF-7, MCF-10A and BT549 cells were") Supplementary Figure 1. Gd@C 82 (OH) 22 nanoparticles did not affect cell viability and apoposis. MDA-MB-231, MCF-7, MCF-10A and BT549 cells were treated with PBS, Gd@C 82 (OH) 22, C 60 (OH) 22 or GdCl
Supplementary Figure 1. Gd@C 82 (OH) 22 nanoparticles did not affect cell viability and apoposis. MDA-MB-231, MCF-7, MCF-10A and BT549 cells were treated with PBS, Gd@C 82 (OH) 22, C 60 (OH) 22 or GdCl
Aberrant Promoter CpG Methylation is a Mechanism for Lack of Hypoxic Induction of
 Aberrant Promoter CpG Methylation is a Mechanism for Lack of Hypoxic Induction of PHD3 in a Diverse Set of Malignant Cells Abstract The prolyl-hydroxylase domain family of enzymes (PHD1-3) plays an important
SUPPLEMENTARY INFORMATION
 Supplementary Figures Supplementary Figure S1. Binding of full-length OGT and deletion mutants to PIP strips (Echelon Biosciences). Supplementary Figure S2. Binding of the OGT (919-1036) fragments with
Supplemental Information
 Supplemental Information Tobacco-specific Carcinogen Induces DNA Methyltransferases 1 Accumulation through AKT/GSK3β/βTrCP/hnRNP-U in Mice and Lung Cancer patients Ruo-Kai Lin, 1 Yi-Shuan Hsieh, 2 Pinpin
Supplementary Data Table of Contents:
 Supplementary Data Table of Contents: - Supplementary Methods - Supplementary Figures S1(A-B) - Supplementary Figures S2 (A-B) - Supplementary Figures S3 - Supplementary Figures S4(A-B) - Supplementary
XTRAKT FFPE Kit / Manual
 XTRAKT FFPE Kit / Manual For manual extraction of RNA, mirna and/or DNA from Formalin Fixed Paraffin Embedded (FFPE) tissue samples Catalog No. # XTK2.0-96 For research use only. Not intended for diagnostic
Total Histone H3 Acetylation Detection Fast Kit (Colorimetric)
") Total Histone H3 Acetylation Detection Fast Kit (Colorimetric) Catalog Number KA1538 48 assays Version: 02 Intended for research use only www.abnova.com Table of Contents Introduction... 3 Intended Use...
Total Histone H3 Acetylation Detection Fast Kit (Colorimetric) Catalog Number KA1538 48 assays Version: 02 Intended for research use only www.abnova.com Table of Contents Introduction... 3 Intended Use...
Chromatin Immunoprecipitation (ChIPs) Protocol (Mirmira Lab)
 Protocol (Mirmira Lab)") Chromatin Immunoprecipitation (ChIPs) Protocol (Mirmira Lab) Updated 12/3/02 Reagents: ChIP sonication Buffer (1% Triton X-100, 0.1% Deoxycholate, 50 mm Tris 8.1, 150 mm NaCl, 5 mm EDTA): 10 ml 10 % Triton
Chromatin Immunoprecipitation (ChIPs) Protocol (Mirmira Lab) Updated 12/3/02 Reagents: ChIP sonication Buffer (1% Triton X-100, 0.1% Deoxycholate, 50 mm Tris 8.1, 150 mm NaCl, 5 mm EDTA): 10 ml 10 % Triton
Supplementary Figures
 Supplementary Figures Supplementary Figure 1 DOT1L regulates the expression of epithelial and mesenchymal markers. (a) The expression levels and cellular localizations of EMT markers were confirmed by
Serum Amyloid A3 Gene Expression in Adipocytes is an Indicator. of the Interaction with Macrophages
 Serum Amyloid A3 Gene Expression in Adipocytes is an Indicator of the Interaction with Macrophages Yohei Sanada, Takafumi Yamamoto, Rika Satake, Akiko Yamashita, Sumire Kanai, Norihisa Kato, Fons AJ van
p = formed with HCI-001 p = Relative # of blood vessels that formed with HCI-002 Control Bevacizumab + 17AAG Bevacizumab 17AAG
 A.. Relative # of ECs associated with HCI-001 1.4 1.2 1.0 0.8 0.6 0.4 0.2 0.0 ol b p < 0.001 Relative # of blood vessels that formed with HCI-001 1.4 1.2 1.0 0.8 0.6 0.4 0.2 0.0 l b p = 0.002 Control IHC:
TITLE: The Role of hcdc4 as a Tumor Suppressor Gene in Genomic Instability Underlying Prostate Cancer
 AD Award Number: TITLE: The Role of hcdc4 as a Tumor Suppressor Gene in Genomic Instability Underlying Prostate Cancer PRINCIPAL INVESTIGATOR: Audrey van Drogen, Ph.D. CONTRACTING ORGANIZATION: Sidney
S1a S1b S1c. S1d. S1f S1g S1h SUPPLEMENTARY FIGURE 1. - si sc Il17rd Il17ra bp. rig/s IL-17RD (ng) -100 IL-17RD
 -100 IL-17RD") SUPPLEMENTARY FIGURE 1 0 20 50 80 100 IL-17RD (ng) S1a S1b S1c IL-17RD β-actin kda S1d - si sc Il17rd Il17ra rig/s15-574 - 458-361 bp S1f S1g S1h S1i S1j Supplementary Figure 1. Knockdown of IL-17RD enhances
SUPPLEMENTARY FIGURE 1 0 20 50 80 100 IL-17RD (ng) S1a S1b S1c IL-17RD β-actin kda S1d - si sc Il17rd Il17ra rig/s15-574 - 458-361 bp S1f S1g S1h S1i S1j Supplementary Figure 1. Knockdown of IL-17RD enhances
Supplementary Information Supplementary Fig. 1. Elevated Usp9x in melanoma and NRAS mutant melanoma cells are dependent on NRAS for 3D growth.
 Supplementary Information Supplementary Fig. 1. Elevated Usp9x in melanoma and NRAS mutant melanoma cells are dependent on NRAS for 3D growth. a. Immunoblot for Usp9x protein in NRAS mutant melanoma cells
Instructions for Use. APO-AB Annexin V-Biotin Apoptosis Detection Kit 100 tests
 3URGXFW,QIRUPDWLRQ Sigma TACS Annexin V Apoptosis Detection Kits Instructions for Use APO-AB Annexin V-Biotin Apoptosis Detection Kit 100 tests For Research Use Only. Not for use in diagnostic procedures.
FOXO Reporter Kit PI3K/AKT Pathway Cat. #60643
 Data Sheet FOXO Reporter Kit PI3K/AKT Pathway Cat. #60643 Background The PI3K/AKT signaling pathway is essential for cell growth and survival. Disruption of this pathway or its regulation has been linked
(A) RT-PCR for components of the Shh/Gli pathway in normal fetus cell (MRC-5) and a
 RT-PCR for components of the Shh/Gli pathway in normal fetus cell (MRC-5) and a") Supplementary figure legends Supplementary Figure 1. Expression of Shh signaling components in a panel of gastric cancer. (A) RT-PCR for components of the Shh/Gli pathway in normal fetus cell (MRC-5) and
Supplementary figure legends Supplementary Figure 1. Expression of Shh signaling components in a panel of gastric cancer. (A) RT-PCR for components of the Shh/Gli pathway in normal fetus cell (MRC-5) and
Nature Methods: doi: /nmeth Supplementary Figure 1
 Supplementary Figure 1 Subtiligase-catalyzed ligations with ubiquitin thioesters and 10-mer biotinylated peptides. (a) General scheme for ligations between ubiquitin thioesters and 10-mer, biotinylated
Supplementary Fig. 1. GPRC5A post-transcriptionally down-regulates EGFR expression. (a) Plot of the changes in steady state mrna levels versus
 Plot of the changes in steady state mrna levels versus") Supplementary Fig. 1. GPRC5A post-transcriptionally down-regulates EGFR expression. (a) Plot of the changes in steady state mrna levels versus changes in corresponding proteins between wild type and Gprc5a-/-
Supplementary Fig. 1. GPRC5A post-transcriptionally down-regulates EGFR expression. (a) Plot of the changes in steady state mrna levels versus changes in corresponding proteins between wild type and Gprc5a-/-
Supplementary Figures
 Supplementary Figures Supplementary Figure 1. Confirmation of Dnmt1 conditional knockout out mice. a, Representative images of sorted stem (Lin - CD49f high CD24 + ), luminal (Lin - CD49f low CD24 + )
Supporting Online Material Material and Methods References Supplemental Figures S1, S2, and S3
 Supporting Online Material Material and Methods References Supplemental Figures S1, S2, and S3 Sarbassov et al. 1 Material and Methods Materials Reagents were obtained from the following sources: protein
Integrin v 3 targeted therapy for Kaposi s sarcoma with an in vitro evolved antibody 1
 Integrin v 3 targeted therapy for Kaposi s sarcoma with an in vitro evolved antibody 1 CHRISTOPH RADER, 2 MIKHAIL POPKOV, JOHN A. NEVES, AND CARLOS F. BARBAS III 2 Department of Molecular Biology and The
A complete next-generation sequencing workfl ow for circulating cell-free DNA isolation and analysis
 APPLICATION NOTE Cell-Free DNA Isolation Kit A complete next-generation sequencing workfl ow for circulating cell-free DNA isolation and analysis Abstract Circulating cell-free DNA (cfdna) has been shown
Chemical Chaperones Mitigate Experimental Asthma By Attenuating Endoplasmic
 Chemical Chaperones Mitigate Experimental Asthma By Attenuating Endoplasmic Reticulum Stress Lokesh Makhija, BE, Veda Krishnan, MSc, Rakhshinda Rehman, MTech, Samarpana Chakraborty, MSc, Shuvadeep Maity,
Phosphate buffered saline (PBS) for washing the cells TE buffer (nuclease-free) ph 7.5 for use with the PrimePCR Reverse Transcription Control Assay
 for washing the cells TE buffer (nuclease-free) ph 7.5 for use with the PrimePCR Reverse Transcription Control Assay") Catalog # Description 172-5080 SingleShot Cell Lysis Kit, 100 x 50 µl reactions 172-5081 SingleShot Cell Lysis Kit, 500 x 50 µl reactions For research purposes only. Introduction The SingleShot Cell Lysis
Catalog # Description 172-5080 SingleShot Cell Lysis Kit, 100 x 50 µl reactions 172-5081 SingleShot Cell Lysis Kit, 500 x 50 µl reactions For research purposes only. Introduction The SingleShot Cell Lysis
Mouse Cathepsin B ELISA Kit
 GenWay Biotech, Inc. 6777 Nancy Ridge Drive San Diego, CA 92121 Phone: 858.458.0866 Fax: 858.458.0833 Email: techline@genwaybio.com http://www.genwaybio.com Mouse Cathepsin B ELISA Kit Catalog No. GWB-ZZD154
Single Cell Quantitative Polymer Chain Reaction (sc-qpcr)
") Single Cell Quantitative Polymer Chain Reaction (sc-qpcr) Analyzing gene expression profiles from a bulk population of cells provides an average profile which may obscure important biological differences
Single Cell Quantitative Polymer Chain Reaction (sc-qpcr) Analyzing gene expression profiles from a bulk population of cells provides an average profile which may obscure important biological differences
Anti-Lamin B1/LMNB1 Picoband Antibody
 Anti-Lamin B1/LMNB1 Picoband Antibody Catalog Number:PB9611 About LMNB1 Lamin-B1 is a protein that in humans is encoded by the LMNB1 gene. The nuclear lamina consists of a two-dimensional matrix of proteins
Supplementary Fig. 1. Identification of acetylation of K68 of SOD2
 Supplementary Fig. 1. Identification of acetylation of K68 of SOD2 A B H. sapiens 54 KHHAAYVNNLNVTEEKYQEALAK 75 M. musculus 54 KHHAAYVNNLNATEEKYHEALAK 75 X. laevis 55 KHHATYVNNLNITEEKYAEALAK 77 D. rerio
SUPPLEMENTARY INFORMATION
 Supplementary Table 1. Cell sphingolipids and S1P bound to endogenous TRAF2. Sphingolipid Cell pmol/mg TRAF2 immunoprecipitate pmol/mg Sphingomyelin 4200 ± 250 Not detected Monohexosylceramide 311 ± 18
Graveley Lab shrna knockdown followed by RNA-seq Biosample Preparation and Characterization Document
 Graveley Lab shrna knockdown followed by RNA-seq Biosample Preparation and Characterization Document Wet Lab: Sara Olson and Lijun Zhan Computational Lab: Xintao Wei and Michael Duff PI: Brenton Graveley
In vitro DNase I foot printing. In vitro DNase I footprinting was performed as described
 Supplemental Methods In vitro DNase I foot printing. In vitro DNase I footprinting was performed as described previously 1 2 using 32P-labeled 211 bp fragment from 3 HS1. Footprinting reaction mixes contained
Sestrin2 and BNIP3 (Bcl-2/adenovirus E1B 19kDa-interacting. protein3) regulate autophagy and mitophagy in renal tubular cells in. acute kidney injury
 regulate autophagy and mitophagy in renal tubular cells in. acute kidney injury") Sestrin2 and BNIP3 (Bcl-2/adenovirus E1B 19kDa-interacting protein3) regulate autophagy and mitophagy in renal tubular cells in acute kidney injury by Masayuki Ishihara 1, Madoka Urushido 2, Kazu Hamada
Sestrin2 and BNIP3 (Bcl-2/adenovirus E1B 19kDa-interacting protein3) regulate autophagy and mitophagy in renal tubular cells in acute kidney injury by Masayuki Ishihara 1, Madoka Urushido 2, Kazu Hamada
Recombinant Protein Expression Retroviral system
 Recombinant Protein Expression Retroviral system Viruses Contains genome DNA or RNA Genome encased in a protein coat or capsid. Some viruses have membrane covering protein coat enveloped virus Ø Essential
Cells and reagents. Synaptopodin knockdown (1) and dynamin knockdown (2)
 and dynamin knockdown (2)") Supplemental Methods Cells and reagents. Synaptopodin knockdown (1) and dynamin knockdown (2) podocytes were cultured as described previously. Staurosporine, angiotensin II and actinomycin D were all obtained
Supplemental Methods Cells and reagents. Synaptopodin knockdown (1) and dynamin knockdown (2) podocytes were cultured as described previously. Staurosporine, angiotensin II and actinomycin D were all obtained
EpiQuik Total Histone H3 Acetylation Detection Fast Kit (Colorimetric)
") EpiQuik Total Histone H3 Acetylation Detection Fast Kit (Colorimetric) Base Catalog # PLEASE READ THIS ENTIRE USER GUIDE BEFORE USE The EpiQuik Total Histone H3 Acetylation Detection Fast Kit (Colorimetric)
EpiQuik Total Histone H3 Acetylation Detection Fast Kit (Colorimetric) Base Catalog # PLEASE READ THIS ENTIRE USER GUIDE BEFORE USE The EpiQuik Total Histone H3 Acetylation Detection Fast Kit (Colorimetric)
Data Sheet IL-2-Luciferase Reporter (Luc) - Jurkat Cell Line Catalog # 60481
 - Jurkat Cell Line Catalog # 60481") 642 Cornerstone Court W, Ste B Tel: 1.858.829.382 Data Sheet IL-2-Luciferase Reporter (Luc) - Jurkat Cell Line Catalog # 6481 Description Human IL-2 reporter construct is stably integrated into the genome
642 Cornerstone Court W, Ste B Tel: 1.858.829.382 Data Sheet IL-2-Luciferase Reporter (Luc) - Jurkat Cell Line Catalog # 6481 Description Human IL-2 reporter construct is stably integrated into the genome
CHAPTER 4 RESULTS. showed that all three replicates had similar growth trends (Figure 4.1) (p<0.05; p=0.0000)
 (p<0.05; p=0.0000)") CHAPTER 4 RESULTS 4.1 Growth Characterization of C. vulgaris 4.1.1 Optical Density Growth study of Chlorella vulgaris based on optical density at 620 nm (OD 620 ) showed that all three replicates had similar
CHAPTER 4 RESULTS 4.1 Growth Characterization of C. vulgaris 4.1.1 Optical Density Growth study of Chlorella vulgaris based on optical density at 620 nm (OD 620 ) showed that all three replicates had similar
Supplementary Materials for
 immunology.sciencemag.org/cgi/content/full/2/16/eaan6049/dc1 Supplementary Materials for Enzymatic synthesis of core 2 O-glycans governs the tissue-trafficking potential of memory CD8 + T cells Jossef
Phospho-AKT Sampler Kit
 Phospho-AKT Sampler Kit E 0 5 1 0 0 3 Kits Includes Cat. Quantity Application Reactivity Source Akt (Ab-473) Antibody E021054-1 50μg/50μl IHC, WB Human, Mouse, Rat Rabbit Akt (Phospho-Ser473) Antibody
m 6 A mrna methylation regulates AKT activity to promote the proliferation and tumorigenicity of endometrial cancer
 SUPPLEMENTARY INFORMATION Articles https://doi.org/10.1038/s41556-018-0174-4 In the format provided by the authors and unedited. m 6 A mrna methylation regulates AKT activity to promote the proliferation
Supplementary Information for. Inhibitors of Hedgehog Acyltransferase Block Sonic Hedgehog Signaling. Marilyn D. Resh 1,2,6*
 Supplementary Information for Inhibitors of Hedgehog Acyltransferase Block Sonic Hedgehog Signaling Elissaveta Petrova 1,5, Jessica Rios-Esteves 1,2, Ouathek Ouerfelli 3, J. Fraser Glickman 4, and Marilyn
Human Obestatin ELISA
 K-ASSAY Human Obestatin ELISA For the quantitative determination of obestatin in human serum and plasma Cat. No. KT-495 For Research Use Only. 1 Rev. 081309 K-ASSAY PRODUCT INFORMATION Human Obestatin
Cell lines and tissue samples. The 18 human NSCLC cell lines used in this. study included eight adenocarcinoma cell lines (ADCs; A427, A549, LC319,
 Supplementary Materials and Methods Cell lines and tissue samples. The 18 human NSCLC cell lines used in this study included eight adenocarcinoma cell lines (ADCs; A427, A549, LC319, NCI-H1373, PC-3, PC-9,
SUPPLEMENT. Materials and methods
 SUPPLEMENT Materials and methods Cell culture and reagents Cell media and reagents were from Invitrogen unless otherwise indicated. Antibiotics and Tet-certified serum were from Clontech. In experiments
NF-κB p65 (Phospho-Thr254)
") Assay Biotechnology Company www.assaybiotech.com Tel: 1-877-883-7988 Fax: 1-877-610-9758 NF-κB p65 (Phospho-Thr254) Colorimetric Cell-Based ELISA Kit Catalog #: OKAG02015 Please read the provided manual
Assay Biotechnology Company www.assaybiotech.com Tel: 1-877-883-7988 Fax: 1-877-610-9758 NF-κB p65 (Phospho-Thr254) Colorimetric Cell-Based ELISA Kit Catalog #: OKAG02015 Please read the provided manual
Human Apolipoprotein A1 EIA Kit
 A helping hand for your research Product Manual Human Apolipoprotein A1 EIA Kit Catalog Number: 83901 96 assays 1 Table of Content Product Description 3 Assay Principle 3 Kit Components 3 Storage 4 Reagent
SUPPLEMENTAL MATERIAL. Supplementary Methods
 SUPPLEMENTAL MATERIAL Supplementary Methods Culture of cardiomyocytes, fibroblasts and cardiac microvascular endothelial cells The isolation and culturing of neonatal rat ventricular cardiomyocytes was