Supplementary information
|
|
|
- Helen Aubrey Lucas
- 5 years ago
- Views:
Transcription
1 Supplementary information Human Cytomegalovirus MicroRNA mir-us4-1 Inhibits CD8 + T Cell Response by Targeting ERAP1 Sungchul Kim, Sanghyun Lee, Jinwook Shin, Youngkyun Kim, Irini Evnouchidou, Donghyun Kim, Young-Kook Kim, Young-Eui Kim, Jin-Hyun Ahn, Stanley R. Riddell, Efstratios Stratikos, V. Narry Kim, and Kwangseog Ahn * * To whom correspondence should be addressed: ( ) ksahn@snu.ac.kr 1
 Schematic representation of the HCMV whole genome and mirnas within")
2 Supplementary Figure 1 Supplementary Figure 1. Representation of the genomic locations of HCMV mir-us4-1, mir-us5-1, and mir-us5-2 and transfection validation for microarray (a) Schematic representation of the HCMV whole genome and mirnas within the US2-US11 region of the HCMV genome. The HCMV genome consists of 2 linked segments (L and S), each comprising a unique long and a unique short region (UL and US) flanked by inverted repeats (TRL and IRL, TRS and IRS). Three mirnas (mir-us4-1, mir-us5-1, and mir-us5-2) are located within the US2-US11 region. MiR-US4-1 is encoded between the US3 ORF and the US5 ORF with (+) transcriptional orientation. mir-us5-1 and mir-us5-2 are encoded between the US6 ORF and the US7 ORF with (+) orientation, similar to mir-us4-1. (b) Immunoblot analysis to determine the transfection efficiency for microarray analysis. A GFP-targeting sirna was used as control mirna. sirna-pdi targets the coding region of PDI mrna. 2
3 Supplementary Figure 2 Supplementary Figure 2. Sequences of ERAP1 isoforms and seed-binding region-mutated mir-us4-1 (a) Comparison of ERAP1 isoforms a and b. sierap1, sierap1a, and sierap1b binding sites are indicated in red, green, and blue, respectively. The C-terminal sequence of ERAP1a and ERAP1b is shown in black boxes. (b) The sequence of the wild-type mir-us4-1 sequence and the seed region point mutant, mir-us4-1(m). 3
4 Supplementary Figure 3 Supplementary Figure 3. PCR efficiency of primers of both ERAP1 isoforms is equal and the expression level of ERAP1b mrna is higher than that of ERAP1a mrna in various cell lines (a) The relative expression levels of ERAP1a and ERAP1b mrna in HEK293T, HeLa-K b, 4
5 U373MG, HFF, and HFF-TEL cells were analyzed using qrt-pcr and normalized to GAPDH mrna levels. Data are presented as means ± s.d., n = 3, and is representative of 3 independent experiments. (b) 10 pg of pgl3-cmv-erap1a vector DNA and pgl3-cmv-erap1b vector DNA were analyzed by qrt-pcr with primers for ERAP1a, ERAP1b, and firefly luciferase. The fold value of firefly serves as a normalization control. Relative fold value of ERAP1a and ERAP1b are calculated and presented in graph as means ± s.d., n = 3, representative of 2 independent experiments. (c) We transfected 1 µg of pgl3-cmv-erap1a vector DNA and pgl3-cmv-erap1b vector DNA into mouse embryonic fibroblast cell line, NIH3T3. After 24 h post transfection, cells were harvested and total RNA was extracted, followed by cdna synthesis. cdna was analyzed by qrt-pcr with primers for ERAP1a, ERAP1b, and GAPDH. GAPDH serves as a normalization control. Relative fold value of ERAP1a and ERAP1b are calculated and are presented in graph as means ± s.d., n = 3, representative of 2 independent experiments. 5
 Expression levels of HCMV mir-us4-1 (a) and mir-16 as a loading control (b) were analyzed using RNA blot analysis.")
6 Supplementary Figure 4 Supplementary Figure 4. Dose-dependent expression of HCMV mir-us4-1 in HEK293T cells (a, b) Expression levels of HCMV mir-us4-1 (a) and mir-16 as a loading control (b) were analyzed using RNA blot analysis. A total of 40 μg total RNA extracted from the indicated cells was resolved on a 12.5% urea-polyacrylamide gel and transferred to a Zetaprobe-GT membrane. Oligonucleotide probes complementary to the mature sequence of each mirna were end-labeled using T4 polynucleotide kinase. Probes were hybridized with membranes and washed. Blots were analyzed using a BAS detector. 6
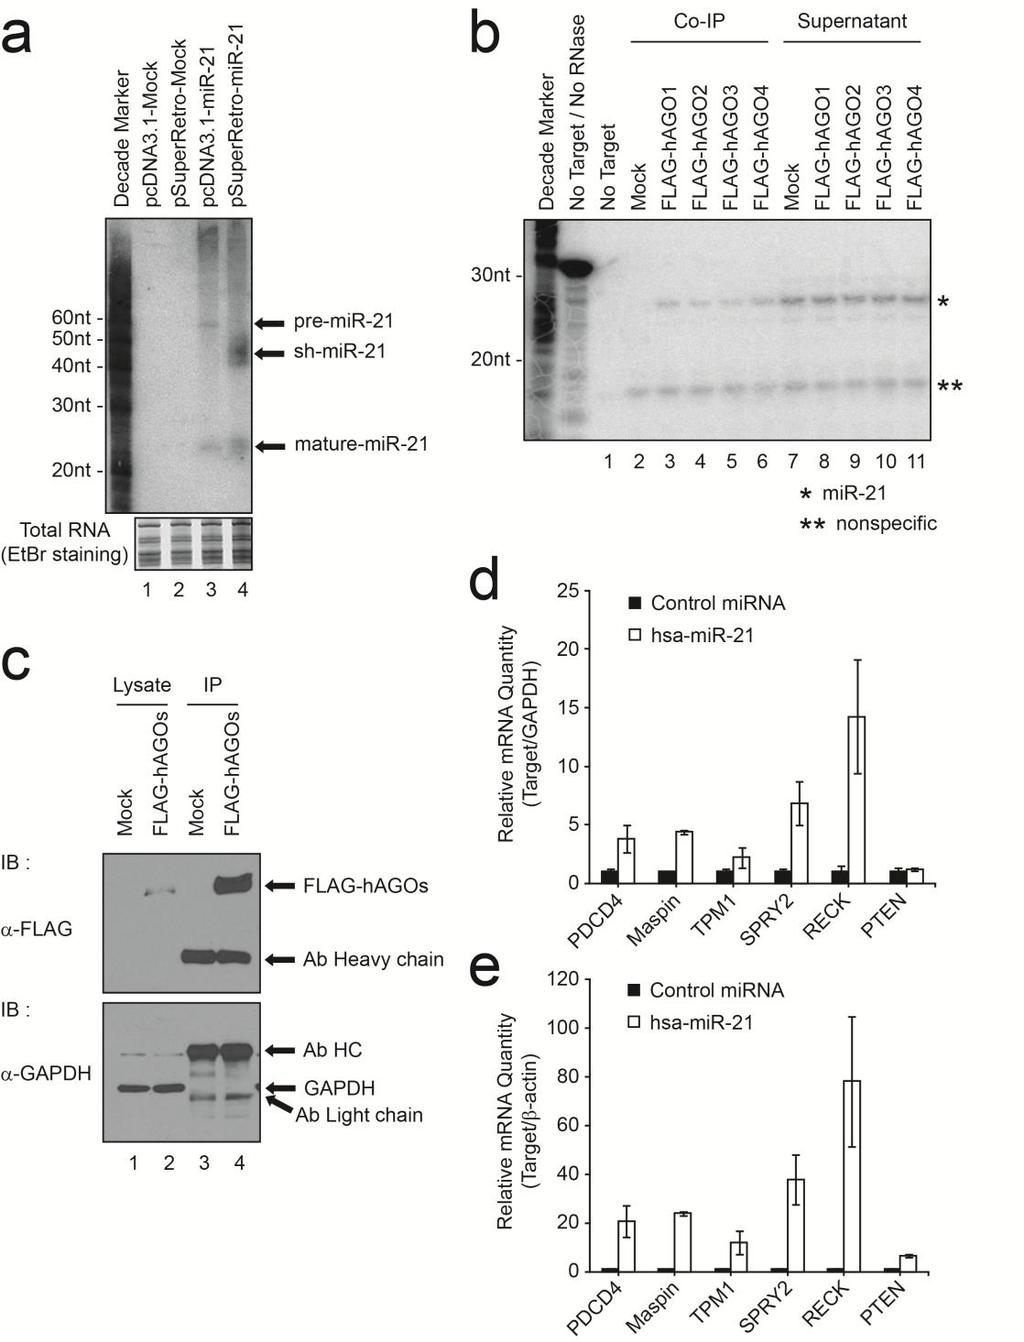
7 Supplementary Figure 5 7
8 Supplementary Figure 5. Experimental validation of RISC IP analysis (a) Expression levels of hsa-mir-21. HEK293T cells were transfected with pcdna3.1(+) mock vector, psuperretro mock vector, pcdna3.1(+)-mir-21 vector, or psuperretro-mir-21 vector. The pcdna3.1(+)-mir-21 vector expressed endogenous human mir-21. After 3 days, total RNA was harvested using Trizol reagent and analyzed using RNA blot analysis. (b) HEK293T cells were transfected with psuperrestro-mir-21, followed by transfection of Mock or FLAGhAGOs vectors. After 48 h, RISC IP was performed, and mirnas were extracted from immunoprecipitates, followed by RPA to detect the mir-21. (c) Immunoblot for expression levels of FLAG-hAGOs. HEK293T cells were transfected with empty (Mock) or N-terminally FLAG-tagged human AGO1, 2, 3, and 4 (FLAG-hAGOs) vectors. To investigate the expression and IP, protein samples from the RISC IP were analyzed by immunoblot analysis with anti- FLAG M2 mab and anti-gapdh Ab. (d, e) qrt-pcr was performed to compare the levels of the indicated mrnas using total RNA samples from RISC IP. The value was normalized to GAPDH (d) or β-actin (e) levels. Data are presented as means ± s.e.m. of 3 independent experiments. 8

9 Supplementary Figure 6 Supplementary Figure 6. Generation of HCMV ΔUS4 The 6 nt UCGCGA sequence in the hairpin structure of mir-us4-1 was substituted with the GACAAU sequence, disrupting the cropping process of the Drosha complex in the nucleus, and finally resulting in completely diminished pre-mir-us4-1 and subsequent reduction of mature mir-us4-1 production. The HCMV REV used in this study is similar to the HCMV WT and was made using the same method used for the construction of HCMV ΔUS4 with HCMV ΔUS4 as the template. 9
10 Supplementary Figure 7 Supplementary Figure 7. The mrna level of ERAP1b is downregulated by mir-us4-1 during HCMV infection HFF cells were infected with wild-type HCMV AD169, the ΔUS4 mutant, or the revertant for 1 h at MOI = 5. The total RNA was extracted at 0 h, 24 h, 48 h, and 72 h post infection from infected cells or uninfected cells. qrt-pcr was performed to analyze the level of (a) ERAP1a, ERAP1b, and (b) IE1 mrna. GAPDH served as a normalization control. Data are presented as means ± s.e.m. of 3 independent experiments. 10
, PDI, ERp57, and")
11 Supplementary Figure 8 Supplementary Figure 8. HCMV mir-us4-1 does not affect the expression of components of the MHC class I peptide loading complex Expression levels of Tapasin, MHC class I heavy chain (HC), PDI, ERp57, and GAPDH. Using aliquots from Fig. 6, cells were lysed with 1% NP-40 and analyzed by immunoblot analysis. GAPDH served as loading control. 11
12 Supplementary Figure 9 Supplementary Figure 9. MHC class I cell surface level of CP, RT, and DK donor fibroblasts infected with HCMV WT, ΔUS4, or RV798 CP, RT, and DK fibroblasts were uninfected or infected with HCMV AD169 wild-type (AD169 WT), HCMV AD169 ΔUS4 mutant (AD169 ΔUS4), or HCMV RV798 (RV798) at MOI = 2 for 1 h. At 48 h post infection, the cells were harvested and flow cytometry was performed using mab W6/32 (HLA-A-, B-, C-specific). Lines in the plots are indicated by short names. No 1st Ab indicates an untreated condition, in which the mab W6/32 was not used in the uninfected cells. 12

13 Supplementary Figure 10 Supplementary Figure 10. CP, RT, and DK fibroblasts infected with HCMV RV798 express the viral mrna of UL16, UL105, IE1, UL28, and UL23 CP, RT, and DK fibroblasts were infected with HCMV RV798 at MOI = 2 for 1 h. At 0 h and 48 h post infection, we performed RT-PCR to validate the expression of mrnas from UL16, UL105, IE1, UL28, and UL23 genes. GAPDH served as loading control. 13
14 Supplementary Figure 11 14
15 Supplementary Figure 11. Validation of ERAP1 knockdown by HCMV mir-us4-1 in fibroblasts (a) CP, (b) RT, and (c) DK fibroblasts were transfected with control mirna, mir-us4-1, or sierap1 RNA oligomer duplexes twice at 36 h intervals. At 24 h after the last transfection, cells were infected with HCMV RV798 at MOI = 2 for 1 h. At 48 h post infection, we performed qrt- PCR to analyze the levels of ERAP1a and ERAP1b mrnas. Relative fold change was normalized to GAPDH level. Data are presented as means ± s.d., n = 3, representative of 2 independent experiments. 15
16 Supplementary Table 1. Primers or DNA oligomers used in this paper Control mirna Forward GATCCCCGGTTATGTACAGGAACGCATTCAAGA (sigfp) GATGCGTTCCTGTACATAACCTTTTTTTA Reverse AGCTTAAAAAAAGGTTATGTACAGGAACGCATC TCTTGAATGCGTTCCTGTACATAACCGGG mir-us4-1 Forward GATCCCCCGTCTTCGACGTGCAGGGGGATTTCA AGAGAATCCCCCTGCACGTCCATGTCGTTTTTA Reverse AGCTTAAAAA CGACATGGACGTGCAGGGGGATTCTCTTGAAAT CCCCCTGCACGTCCATGTCGGGG mir-us4-1(m) Forward GATCCCC CGACATGGACGTGCAGGGGGATTTCAAGAGAAT CCCCCTGCACGTCCATGTCGTTTTTA Reverse AGCTTAAAAA CGACATGGACGTGCAGGGGGATTCTCTTGAAAT CCCCCTGCACGTCGAAGACGGGG sierap1 Forward GATCCCCAACGTAGTGATGGGACACCATTTTTCA AGAGAAAATGGTGTCCCATCACTACGTTTTTTTA Reverse AGCTTAAAAAAACGTAGTGATGGGACACCATTT TCTCTTGAAAAATGGTGTCCCATCACTACGTTGG G sierap1a Forward GATCCCCCATCTAGCAAATGAGGCACTGTTCTTT CAAGAGAAGAACAGTGCCTCATTTGCTAGATGT TTTTA Reverse AGCTTAAAAACATCTAGCAAATGAGGCACTGTT CTTCTCTTGAAAGAACAGTGCCTCATTTGCTAGA TGGGG 16
17 sierap1b Forward GATCCCCGGGCTGACTTGTAAAGGCCAAGTCAT TCAAGAGATGACTTGGCCTTTACAAGTCAGCCC TTTTTA Reverse AGCTTAAAAAGGGCTGACTTGTAAAGGCCAAGT CATCTCTTGAATGACTTGGCCTTTACAAGTCAGC CCGGG ERAP1a 3 -UTR Forward CTAGCTAGCAAATCCATCAGAATCTCAGACTACA G Reverse AACTGCAGTCATTTTATGTGTTAATTTTTTATTAA AT ERAP1b 3 -UTR Forward GCTCTAGAAAATTCCTCCCTTGCCAGGTTCCTG Reverse AACTGCAGGGTTTCTGCACATTGTTGTGGCAAT ERAP1 C -term Forward GGAAATTCCATATGAATGAAGTGGAAACTCAATT CAAGGC Reverse CCGCTCGAGCATACGTTCAAGCTTTTCACTTTGC AG US4 mutagenesis Forward GTGCGGATTAGTGGTCGTGGACAACCATGGACG TGCAGGGGG Reverse CCCCCTGCACGTCCATGGTTGTCCACGACCACT AATCCGCAC US4 homologous Forward CGTCAAGAGTCACGTCAGTCGCCCACCCCCATT arm ACACGGCGATATCCCGAGGCCTGGTGATGATGG CGGGATCG Reverse TATTTTTTCTGTCGCGATAGTCGACGATATGTCGC GATAGACAACTCCGGTCAGAAGAACTCGTCAAG AAGGCG UL56 (RT-PCR) Forward CACAAGAGTCTGCCTGTGGA Reverse GCATTTGACCAAATCGTCCT UL28 (RT-PCR) Forward GCCTCGTCAGTGTGTACGAA 17
18 Reverse GCCCTCTACGATCTCATCCA UL23 (RT-PCR) Forward ACTTCATCACCGTCCCAGAG Reverse AGGTTCCACGTGGTTACTGC UL16 (RT-PCR) Forward TGGGTAGCAAGTCCTCCAAC Reverse CAACCACAGGTCAACCACAG UL105 (RT-PCR) Forward CAAGAGGAGACCCACGACAT Reverse GAAAAATGTCGCGGAAGGTA UL123(IE1) (qrt- Forward CAAGAGGAGACCCACGACAT PCR and RT-PCR) Reverse GAAAAATGTCGCGGAAGGTA GAPDH (qrt- Forward AGAAGGCTGGGGCTCATTTG PCR) Reverse AGGGGCCATCCACAGTCTTC beta-actin (qrt- Forward GAAAAATGTCGCGGAAGGTA PCR) Reverse GAAAAATGTCGCGGAAGGTA pcdna3.1-mir-21 Forward CGGAATTCTGGGGTTCGATCTTAACAGGCCAG Reverse CCGCTCGAGACCAGACAGAAGGACCAGAGTTT CT PDCD4 (qrt-pcr) Forward GAAAATGCTGGGACTGAGGA Reverse TGGACTGGTTGGCACAGTTA Maspin (qrt-pcr) Forward CACAGATGGCCACTTTGAGA Reverse GGCCTCCATGTTCATCATCT TPM1 (qrt-pcr) Forward TCATCATTGAGAGCGACCTG Reverse CTCAGCCTCCTTCAGCTTGT SPRY2 (qrt-pcr) Forward CCCCTCTGTCCAGATCCATA Reverse CCCAAATCTTCCTTGCTCAG RECK (qrt-pcr) Forward GCAGGGGAAGTTGGTTGTTA Reverse TGCCAGCAAAACAAGAACAG PTEN (qrt-pcr) Forward ACCAGGACCAGAGGAAACCT Reverse GCTAGCCTCTGGATTTGACG 18
Human cytomegalovirus microrna mir-us4-1 inhibits CD8 + T cell responses by targeting the aminopeptidase ERAP1
 Human cytomegalovirus microrna inhibits CD8 + T cell responses by targeting the aminopeptidase ERAP1 211 Nature America, Inc. All rights reserved. Sungchul Kim 1, Sanghyun Lee 1, Jinwook Shin 2, Youngkyun
HEK293FT cells were transiently transfected with reporters, N3-ICD construct and
 Supplementary Information Luciferase reporter assay HEK293FT cells were transiently transfected with reporters, N3-ICD construct and increased amounts of wild type or kinase inactive EGFR. Transfections
MicroRNA sponges: competitive inhibitors of small RNAs in mammalian cells
 MicroRNA sponges: competitive inhibitors of small RNAs in mammalian cells Margaret S Ebert, Joel R Neilson & Phillip A Sharp Supplementary figures and text: Supplementary Figure 1. Effect of sponges on
Tel: ; Fax: ;
 Tel.: +98 216 696 9291; Fax: +98 216 696 9291; E-mail: mrasadeghi@pasteur.ac.ir Tel: +98 916 113 7679; Fax: +98 613 333 6380; E-mail: abakhshi_e@ajums.ac.ir A Soluble Chromatin-bound MOI 0 1 5 0 1 5 HDAC2
Figure S1. Reduction in glomerular mir-146a levels correlate with progression to higher albuminuria in diabetic patients.
 Supplementary Materials Supplementary Figures Figure S1. Reduction in glomerular mir-146a levels correlate with progression to higher albuminuria in diabetic patients. Figure S2. Expression level of podocyte
Nature Structural & Molecular Biology: doi: /nsmb Supplementary Figure 1. Differential expression of mirnas from the pri-mir-17-92a locus.
 Supplementary Figure 1 Differential expression of mirnas from the pri-mir-17-92a locus. (a) The mir-17-92a expression unit in the third intron of the host mir-17hg transcript. (b,c) Impact of knockdown
Supplementary Figure 1
 Supplementary Figure 1 Asymmetrical function of 5p and 3p arms of mir-181 and mir-30 families and mir-142 and mir-154. (a) Control experiments using mirna sensor vector and empty pri-mirna overexpression
Supplementary Figure 1. Prevalence of U539C and G540A nucleotide and E172K amino acid substitutions among H9N2 viruses. Full-length H9N2 NS
 Supplementary Figure 1. Prevalence of U539C and G540A nucleotide and E172K amino acid substitutions among H9N2 viruses. Full-length H9N2 NS nucleotide sequences (a, b) or amino acid sequences (c) from
Supplementary Figure 1. SC35M polymerase activity in the presence of Bat or SC35M NP encoded from the phw2000 rescue plasmid.
 1 2 3 4 5 6 7 8 9 10 11 12 13 14 15 16 17 18 19 20 21 22 23 24 25 26 27 Supplementary Figure 1. SC35M polymerase activity in the presence of Bat or SC35M NP encoded from the phw2000 rescue plasmid. HEK293T
Supplementary Material
 Supplementary Material Summary: The supplementary information includes 1 table (Table S1) and 4 figures (Figure S1 to S4). Supplementary Figure Legends Figure S1 RTL-bearing nude mouse model. (A) Tumor
Scaffold function of long noncoding RNA HOTAIR in protein ubiquitination
 Yoon et al, page Scaffold function of long noncoding RNA HOTAIR in protein ubiquitination Je-Hyun Yoon,, Kotb Abdelmohsen, Jiyoung Kim, Xiaoling Yang, Jennifer L. Martindale, Kumiko Tominaga-Yamanaka,
Supplementary Figure 1. Confocal immunofluorescence showing mitochondrial translocation of Drp1. Cardiomyocytes treated with H 2 O 2 were prestained
 Supplementary Figure 1. Confocal immunofluorescence showing mitochondrial translocation of Drp1. Cardiomyocytes treated with H 2 O 2 were prestained with MitoTracker (red), then were immunostained with
Table S1. Primer sequences used for qrt-pcr. CACCATTGGCAATGAGCGGTTC AGGTCTTTGCGGATGTCCACGT ACTB AAGTCCATGTGCTGGCAGCACT ATCACCACTCCGAAGTCCGTCT LCOR
 Table S1. Primer sequences used for qrt-pcr. ACTB LCOR KLF6 CTBP1 CDKN1A CDH1 ATF3 PLAU MMP9 TFPI2 CACCATTGGCAATGAGCGGTTC AGGTCTTTGCGGATGTCCACGT AAGTCCATGTGCTGGCAGCACT ATCACCACTCCGAAGTCCGTCT CGGCTGCAGGAAAGTTTACA
p47 negatively regulates IKK activation by inducing the lysosomal degradation of polyubiquitinated NEMO
 Supplementary Information p47 negatively regulates IKK activation by inducing the lysosomal degradation of polyubiquitinated NEMO Yuri Shibata, Masaaki Oyama, Hiroko Kozuka-Hata, Xiao Han, Yuetsu Tanaka,
Soft Agar Assay. For each cell pool, 100,000 cells were resuspended in 0.35% (w/v)
") SUPPLEMENTARY MATERIAL AND METHODS Soft Agar Assay. For each cell pool, 100,000 cells were resuspended in 0.35% (w/v) top agar (LONZA, SeaKem LE Agarose cat.5004) and plated onto 0.5% (w/v) basal agar.
SUPPLEMENTARY MATERIAL AND METHODS Soft Agar Assay. For each cell pool, 100,000 cells were resuspended in 0.35% (w/v) top agar (LONZA, SeaKem LE Agarose cat.5004) and plated onto 0.5% (w/v) basal agar.
SUPPLEMENTARY INFORMATION
 DOI: 10.1038/ncb2566 Figure S1 CDKL5 protein expression pattern and localization in mouse brain. (a) Multiple-tissue western blot from a postnatal day (P) 21 mouse probed with an antibody against CDKL5.
Supplementary Figure 1. AdipoR1 silencing and overexpression controls. (a) Representative blots (upper and lower panels) showing the AdipoR1 protein
 Representative blots (upper and lower panels) showing the AdipoR1 protein") Supplementary Figure 1. AdipoR1 silencing and overexpression controls. (a) Representative blots (upper and lower panels) showing the AdipoR1 protein content relative to GAPDH in two independent experiments.
Supplementary Figure 1. AdipoR1 silencing and overexpression controls. (a) Representative blots (upper and lower panels) showing the AdipoR1 protein content relative to GAPDH in two independent experiments.
P. Mathijs Voorhoeve, Carlos le Sage, Mariette Schrier, Ad J.M. Gillis, Hans Stoop,
 Supplemental Data A Genetic Screen Implicates mirna-372 and mirna-373 As Oncogenes in Testicular Germ Cell Tumors P. Mathijs Voorhoeve, Carlos le Sage, Mariette Schrier, Ad J.M. Gillis, Hans Stoop, Remco
Supplemental Figure 1
 Supplemental Figure 1 1a 1c PD-1 MFI fold change 6 5 4 3 2 1 IL-1α IL-2 IL-4 IL-6 IL-1 IL-12 IL-13 IL-15 IL-17 IL-18 IL-21 IL-23 IFN-α Mut Human PD-1 promoter SBE-D 5 -GTCTG- -1.2kb SBE-P -CAGAC- -1.kb
Supplementary Figure 1: si-craf but not si-braf sensitizes tumor cells to radiation.
 Supplementary Figure 1: si-craf but not si-braf sensitizes tumor cells to radiation. (a) Embryonic fibroblasts isolated from wildtype (WT), BRAF -/-, or CRAF -/- mice were irradiated (6 Gy) and DNA damage
Supplementary Fig. 1. GPRC5A post-transcriptionally down-regulates EGFR expression. (a) Plot of the changes in steady state mrna levels versus
 Plot of the changes in steady state mrna levels versus") Supplementary Fig. 1. GPRC5A post-transcriptionally down-regulates EGFR expression. (a) Plot of the changes in steady state mrna levels versus changes in corresponding proteins between wild type and Gprc5a-/-
Supplementary Fig. 1. GPRC5A post-transcriptionally down-regulates EGFR expression. (a) Plot of the changes in steady state mrna levels versus changes in corresponding proteins between wild type and Gprc5a-/-
Supplemental information contains 7 movies and 4 supplemental Figures
 1 2 3 4 5 6 7 8 9 10 11 12 13 14 15 16 17 18 19 20 21 22 23 24 25 26 27 Supplemental information contains 7 movies and 4 supplemental Figures Movies: Movie 1. Single virus tracking of A4-mCherry-WR MV
Supplementary Figure 1 IL-27 IL
 Tim-3 Supplementary Figure 1 Tc0 49.5 0.6 Tc1 63.5 0.84 Un 49.8 0.16 35.5 0.16 10 4 61.2 5.53 10 3 64.5 5.66 10 2 10 1 10 0 31 2.22 10 0 10 1 10 2 10 3 10 4 IL-10 28.2 1.69 IL-27 Supplementary Figure 1.
(A) SW480, DLD1, RKO and HCT116 cells were treated with DMSO or XAV939 (5 µm)
 SW480, DLD1, RKO and HCT116 cells were treated with DMSO or XAV939 (5 µm)") Supplementary Figure Legends Figure S1. Tankyrase inhibition suppresses cell proliferation in an axin/β-catenin independent manner. (A) SW480, DLD1, RKO and HCT116 cells were treated with DMSO or XAV939
Supplementary Figure Legends Figure S1. Tankyrase inhibition suppresses cell proliferation in an axin/β-catenin independent manner. (A) SW480, DLD1, RKO and HCT116 cells were treated with DMSO or XAV939
Effects of UBL5 knockdown on cell cycle distribution and sister chromatid cohesion
 Supplementary Figure S1. Effects of UBL5 knockdown on cell cycle distribution and sister chromatid cohesion A. Representative examples of flow cytometry profiles of HeLa cells transfected with indicated
Supplementary Fig. S1. Schematic diagram of minigenome segments.
 open reading frame 1565 (segment 5) 47 (-) 3 5 (+) 76 101 125 149 173 197 221 246 287 open reading frame 890 (segment 8) 60 (-) 3 5 (+) 172 Supplementary Fig. S1. Schematic diagram of minigenome segments.
SUPPLEMENTARY FIGURES
 SUPPLEMENTARY FIGURES Figure S1. Clinical significance of ZNF322A overexpression in Caucasian lung cancer patients. (A) Representative immunohistochemistry images of ZNF322A protein expression in tissue
33VASTVNGATSANNHGEPPS51PADARPR58
 Pro-rich region Trans-membrane region 214 246 359 381 UL50 1 397 211SSRTAS216PPPPPR222 NLS CR1 CR2 CR3 CR4 UL53 1 376 11RERRS15ALRS19LLRKRRR25 33VASTVNGATSANNHGEPPS51PADARPR58 FIG S1. UL97 phosphorylation
A. List of selected proteins with high SILAC (H/L) ratios identified in mass
 ratios identified in mass") Supplementary material Figure S1. Interaction between UBL5 and FANCI A. List of selected proteins with high SILAC (H/L) ratios identified in mass spectrometry (MS)-based analysis of UBL5-interacting proteins,
Supplementary material Figure S1. Interaction between UBL5 and FANCI A. List of selected proteins with high SILAC (H/L) ratios identified in mass spectrometry (MS)-based analysis of UBL5-interacting proteins,
RNA interference induced hepatotoxicity results from loss of the first synthesized isoform of microrna-122 in mice
 SUPPLEMENTARY INFORMATION RNA interference induced hepatotoxicity results from loss of the first synthesized isoform of microrna-122 in mice Paul N Valdmanis, Shuo Gu, Kirk Chu, Lan Jin, Feijie Zhang,
Predictive PP1Ca binding region in BIG3 : 1,228 1,232aa (-KAVSF-) HEK293T cells *** *** *** KPL-3C cells - E E2 treatment time (h)
 HEK293T cells *** *** *** KPL-3C cells - E E2 treatment time (h)") Relative expression ERE-luciferase activity activity (pmole/min) activity (pmole/min) activity (pmole/min) activity (pmole/min) MCF-7 KPL-3C ZR--1 BT-474 T47D HCC15 KPL-1 HBC4 activity (pmole/min) a d
Relative expression ERE-luciferase activity activity (pmole/min) activity (pmole/min) activity (pmole/min) activity (pmole/min) MCF-7 KPL-3C ZR--1 BT-474 T47D HCC15 KPL-1 HBC4 activity (pmole/min) a d
SUPPLEMENTARY INFORMATION
 doi: 10.1038/nature05732 SUPPLEMENTARY INFORMATION Supplemental Data Supplement Figure Legends Figure S1. RIG-I 2CARD undergo robust ubiquitination a, (top) At 48 h posttransfection with a GST, GST-RIG-I-2CARD
Supplementary Information
 Supplementary Information mediates STAT3 activation at retromer-positive structures to promote colitis and colitis-associated carcinogenesis Zhang et al. a b d e g h Rel. Luc. Act. Rel. mrna Rel. mrna
SUPPLEMENTAL FIGURE LEGENDS
 SUPPLEMENTAL FIGURE LEGENDS Supplemental Figure S1: Endogenous interaction between RNF2 and H2AX: Whole cell extracts from 293T were subjected to immunoprecipitation with anti-rnf2 or anti-γ-h2ax antibodies
SUPPLEMENTARY INFORMATION. Supp. Fig. 1. Autoimmunity. Tolerance APC APC. T cell. T cell. doi: /nature06253 ICOS ICOS TCR CD28 TCR CD28
 Supp. Fig. 1 a APC b APC ICOS ICOS TCR CD28 mir P TCR CD28 P T cell Tolerance Roquin WT SG Icos mrna T cell Autoimmunity Roquin M199R SG Icos mrna www.nature.com/nature 1 Supp. Fig. 2 CD4 + CD44 low CD4
FIG S1 Examination of eif4b expression after virus infection. (A) A549 cells
 A549 cells") Supplementary Figure Legends FIG S1 Examination of expression after virus infection. () 549 cells were infected with herpes simplex virus (HSV) (MOI = 1), and harvested at the indicated times, followed
Supplementary Figure Legends FIG S1 Examination of expression after virus infection. () 549 cells were infected with herpes simplex virus (HSV) (MOI = 1), and harvested at the indicated times, followed
 DOI: 10.1038/ncb2210 b. ICAM1 ng ml -1 P = 0.0001 Small RNA (15-30nts) ng ml -1 Cell Lysate Exosome HDL Plasma HDL Normal Human HDL mirnas R = 0.45 P < 0.0001 Normal Human Exosome mirnas Figure S1. Characterization
SUPPLEMENTARY MATERIAL
 SYPPLEMENTARY FIGURE LEGENDS SUPPLEMENTARY MATERIAL Figure S1. Phylogenic studies of the mir-183/96/182 cluster and 3 -UTR of Casp2. (A) Genomic arrangement of the mir-183/96/182 cluster in vertebrates.
MicroRNAs Modulate the Noncanonical NF- B Pathway by Regulating IKK Expression During Macrophage Differentiation
 MicroRNAs Modulate the Noncanonical NF- B Pathway by Regulating IKK Expression During Macrophage Differentiation Tao Li 1 *, Michael J. Morgan 1 *, Swati Choksi 1, Yan Zhang 1, You-Sun Kim 2#, Zheng-gang
Supplementary Figure 1. PAQR3 knockdown inhibits SREBP-2 processing in CHO-7 cells CHO-7 cells were transfected with control sirna or a sirna
 Supplementary Figure 1. PAQR3 knockdown inhibits SREBP-2 processing in CHO-7 cells CHO-7 cells were transfected with control sirna or a sirna targeted for hamster PAQR3. At 24 h after the transfection,
Supplementary Fig. 1. Delivery of mirnas via Red Fluorescent Protein.
 prfp-vector RFP Exon1 Intron RFP Exon2 prfp-mir-124 mir-93/124 RFP Exon1 Intron RFP Exon2 Untransfected prfp-vector prfp-mir-93 prfp-mir-124 Supplementary Fig. 1. Delivery of mirnas via Red Fluorescent
Circular RNAs (circrnas) act a stable mirna sponges
 act a stable mirna sponges") Circular RNAs (circrnas) act a stable mirna sponges cernas compete for mirnas Ancestal mrna (+3 UTR) Pseudogene RNA (+3 UTR homolgy region) The model holds true for all RNAs that share a mirna binding
Circular RNAs (circrnas) act a stable mirna sponges cernas compete for mirnas Ancestal mrna (+3 UTR) Pseudogene RNA (+3 UTR homolgy region) The model holds true for all RNAs that share a mirna binding
Nature Structural and Molecular Biology: doi: /nsmb Supplementary Figure 1
 Supplementary Figure 1 Mutational analysis of the SA2-Scc1 interaction in vitro and in human cells. (a) Autoradiograph (top) and Coomassie stained gel (bottom) of 35 S-labeled Myc-SA2 proteins (input)
Supplementary Figure 1.TRIM33 binds β-catenin in the nucleus. a & b, Co-IP of endogenous TRIM33 with β-catenin in HT-29 cells (a) and HEK 293T cells
 and HEK 293T cells") Supplementary Figure 1.TRIM33 binds β-catenin in the nucleus. a & b, Co-IP of endogenous TRIM33 with β-catenin in HT-29 cells (a) and HEK 293T cells (b). TRIM33 was immunoprecipitated, and the amount of
Supplementary Figure 1.TRIM33 binds β-catenin in the nucleus. a & b, Co-IP of endogenous TRIM33 with β-catenin in HT-29 cells (a) and HEK 293T cells (b). TRIM33 was immunoprecipitated, and the amount of
Supplementary Materials
 Supplementary Materials Supplementary Figure S1 Regulation of Ubl4A stability by its assembly partner A, The translation rate of Ubl4A is not affected in the absence of Bag6. Control, Bag6 and Ubl4A CRISPR
Supplementary Figure 1 IMQ-Induced Mouse Model of Psoriasis. IMQ cream was
 Supplementary Figure 1 IMQ-Induced Mouse Model of Psoriasis. IMQ cream was painted on the shaved back skin of CBL/J and BALB/c mice for consecutive days. (a, b) Phenotypic presentation of mouse back skin
Supplementary Materials for
 www.sciencesignaling.org/cgi/content/full/2/1/ra81/dc1 Supplementary Materials for Delivery of MicroRNA-126 by Apoptotic Bodies Induces CXCL12- Dependent Vascular Protection Alma Zernecke,* Kiril Bidzhekov,
Supporting Information
 Supporting Information Palmisano et al. 10.1073/pnas.1202174109 Fig. S1. Expression of different transgenes, driven by either viral or human promoters, is up-regulated by amino acid starvation. (A) Quantification
S1a S1b S1c. S1d. S1f S1g S1h SUPPLEMENTARY FIGURE 1. - si sc Il17rd Il17ra bp. rig/s IL-17RD (ng) -100 IL-17RD
 -100 IL-17RD") SUPPLEMENTARY FIGURE 1 0 20 50 80 100 IL-17RD (ng) S1a S1b S1c IL-17RD β-actin kda S1d - si sc Il17rd Il17ra rig/s15-574 - 458-361 bp S1f S1g S1h S1i S1j Supplementary Figure 1. Knockdown of IL-17RD enhances
SUPPLEMENTARY FIGURE 1 0 20 50 80 100 IL-17RD (ng) S1a S1b S1c IL-17RD β-actin kda S1d - si sc Il17rd Il17ra rig/s15-574 - 458-361 bp S1f S1g S1h S1i S1j Supplementary Figure 1. Knockdown of IL-17RD enhances
Supplementary Information. Induction of p53-independent apoptosis by ectopic expression of HOXA5
 Supplementary Information Induction of p53-independent apoptosis by ectopic expression of in human liposarcomas Dhong Hyun Lee 1, *, Charles Forscher 1, Dolores Di Vizio 2, 3, and H. Phillip Koeffler 1,
Supplementary Figure 1. Normal T lymphocyte populations in Dapk -/- mice. (a) Normal thymic development in Dapk -/- mice. Thymocytes from WT and Dapk
 Normal thymic development in Dapk -/- mice. Thymocytes from WT and Dapk") Supplementary Figure 1. Normal T lymphocyte populations in Dapk -/- mice. (a) Normal thymic development in Dapk -/- mice. Thymocytes from WT and Dapk -/- mice were stained for expression of CD4 and CD8.
Supplementary Figure 1. Normal T lymphocyte populations in Dapk -/- mice. (a) Normal thymic development in Dapk -/- mice. Thymocytes from WT and Dapk -/- mice were stained for expression of CD4 and CD8.
Supplementary information. MARCH8 inhibits HIV-1 infection by reducing virion incorporation of envelope glycoproteins
 Supplementary information inhibits HIV-1 infection by reducing virion incorporation of envelope glycoproteins Takuya Tada, Yanzhao Zhang, Takayoshi Koyama, Minoru Tobiume, Yasuko Tsunetsugu-Yokota, Shoji
Lentiviral Delivery of Combinatorial mirna Expression Constructs Provides Efficient Target Gene Repression.
 Supplementary Figure 1 Lentiviral Delivery of Combinatorial mirna Expression Constructs Provides Efficient Target Gene Repression. a, Design for lentiviral combinatorial mirna expression and sensor constructs.
Supplementary Materials for
 www.sciencesignaling.org/cgi/content/full/8/406/ra126/dc1 Supplementary Materials for The microrna mir-485 targets host and influenza virus transcripts to regulate antiviral immunity and restrict viral
SUPPLEMENTARY INFORMATION. Supplementary Figures S1-S9. Supplementary Methods
 SUPPLEMENTARY INFORMATION SUMO1 modification of PTEN regulates tumorigenesis by controlling its association with the plasma membrane Jian Huang 1,2#, Jie Yan 1,2#, Jian Zhang 3#, Shiguo Zhu 1, Yanli Wang
microrna-200b and microrna-200c promote colorectal cancer cell proliferation via
 Supplementary Materials microrna-200b and microrna-200c promote colorectal cancer cell proliferation via targeting the reversion-inducing cysteine-rich protein with Kazal motifs Supplementary Table 1.
Supplementary Figures
 MiR-29 controls innate and adaptive immune responses against intracellular bacterial infection by targeting IFN-γ Feng Ma 1,2,5, Sheng Xu 1,5, Xingguang Liu 1, Qian Zhang 1, Xiongfei Xu 1, Mofang Liu 3,
Supplementary Figure 1. Establishment of prostacyclin-secreting hmscs. (a) PCR showed the integration of the COX-1-10aa-PGIS transgene into the
 PCR showed the integration of the COX-1-10aa-PGIS transgene into the") Supplementary Figure 1. Establishment of prostacyclin-secreting hmscs. (a) PCR showed the integration of the COX-1-10aa-PGIS transgene into the genomic DNA of hmscs (PGI2- hmscs). Native hmscs and plasmid
Supplementary Figure 1. Establishment of prostacyclin-secreting hmscs. (a) PCR showed the integration of the COX-1-10aa-PGIS transgene into the genomic DNA of hmscs (PGI2- hmscs). Native hmscs and plasmid
RAW264.7 cells stably expressing control shrna (Con) or GSK3b-specific shrna (sh-
 or GSK3b-specific shrna (sh-") 1 a b Supplementary Figure 1. Effects of GSK3b knockdown on poly I:C-induced cytokine production. RAW264.7 cells stably expressing control shrna (Con) or GSK3b-specific shrna (sh- GSK3b) were stimulated
1 a b Supplementary Figure 1. Effects of GSK3b knockdown on poly I:C-induced cytokine production. RAW264.7 cells stably expressing control shrna (Con) or GSK3b-specific shrna (sh- GSK3b) were stimulated
TRAF6 ubiquitinates TGFβ type I receptor to promote its cleavage and nuclear translocation in cancer
 Supplementary Information TRAF6 ubiquitinates TGFβ type I receptor to promote its cleavage and nuclear translocation in cancer Yabing Mu, Reshma Sundar, Noopur Thakur, Maria Ekman, Shyam Kumar Gudey, Mariya
A Normal Exencephaly Craniora- Spina bifida Microcephaly chischisis. Midbrain Forebrain/ Forebrain/ Hindbrain Spinal cord Hindbrain Hindbrain
 A Normal Exencephaly Craniora- Spina bifida Microcephaly chischisis NTD Number of embryos % among NTD Embryos Exencephaly 52 74.3% Craniorachischisis 6 8.6% Spina bifida 5 7.1% Microcephaly 7 1% B Normal
SUPPLEMENTARY INFORMATION
 doi:10.1038/nature12652 Supplementary Figure 1. PRDM16 interacts with endogenous EHMT1 in brown adipocytes. Immunoprecipitation of PRDM16 complex by flag antibody (M2) followed by Western blot analysis
ACC ELOVL MCAD. CPT1α 1.5 *** 0.5. Reverbα *** *** 0.5. Fasted. Refed
 Supplementary Figure A 8 SREBPc 6 5 FASN ELOVL6.5.5.5 ACC.5.5 CLOCK.5.5 CRY.5.5 PPARα.5.5 ACSL CPTα.5.5.5.5 MCAD.5.5 PEPCK.5.5 G6Pase 5.5.5.5 BMAL.5.5 Reverbα.5.5 Reverbβ.5.5 PER.5.5 PER B Fasted Refed
Supplementary Table 1. Metabolic parameters in GFP and OGT-treated mice
 Supplementary Table 1. Metabolic parameters in GFP and OGT-treated mice Fasted Refed GFP OGT GFP OGT Liver G6P (mmol/g) 0.03±0.01 0.04±0.02 0.60±0.04 0.42±0.10 A TGs (mg/g of liver) 20.08±5.17 16.29±0.8
Conditional and reversible disruption of essential herpesvirus protein functions
 nature methods Conditional and reversible disruption of essential herpesvirus protein functions Mandy Glaß, Andreas Busche, Karen Wagner, Martin Messerle & Eva Maria Borst Supplementary figures and text:
Supplementary Figure 1. Spatial distribution of LRP5 and β-catenin in intact cardiomyocytes. (a) and (b) Immunofluorescence staining of endogenous
 and (b) Immunofluorescence staining of endogenous") Supplementary Figure 1. Spatial distribution of LRP5 and β-catenin in intact cardiomyocytes. (a) and (b) Immunofluorescence staining of endogenous LRP5 in intact adult mouse ventricular myocytes (AMVMs)
Supplementary Figure 1. Spatial distribution of LRP5 and β-catenin in intact cardiomyocytes. (a) and (b) Immunofluorescence staining of endogenous LRP5 in intact adult mouse ventricular myocytes (AMVMs)
mir-7a regulation of Pax6 in neural stem cells controls the spatial origin of forebrain dopaminergic neurons
 Supplemental Material mir-7a regulation of Pax6 in neural stem cells controls the spatial origin of forebrain dopaminergic neurons Antoine de Chevigny, Nathalie Coré, Philipp Follert, Marion Gaudin, Pascal
Supplementary Figure 1. Repression of hepcidin expression in the liver of mice treated with
 Supplementary Figure 1. Repression of hepcidin expression in the liver of mice treated with DMN Immunohistochemistry for hepcidin and H&E staining (left). qrt-pcr assays for hepcidin in the liver (right).
Supplementary Figure 1
 Supplementary Figure 1 YAP negatively regulates IFN- signaling. (a) Immunoblot analysis of Yap knockdown efficiency with sh-yap (#1 to #4 independent constructs) in Raw264.7 cells. (b) IFN- -Luc and PRDs
Supplementary Materials for
 www.sciencesignaling.org/cgi/content/full/9/439/ra78/dc1 Supplementary Materials for Small heterodimer partner mediates liver X receptor (LXR) dependent suppression of inflammatory signaling by promoting
Intracellular MHC class II molecules promote TLR-triggered innate. immune responses by maintaining Btk activation
 Intracellular MHC class II molecules promote TLR-triggered innate immune responses by maintaining Btk activation Xingguang Liu, Zhenzhen Zhan, Dong Li, Li Xu, Feng Ma, Peng Zhang, Hangping Yao and Xuetao
SUPPLEMENTARY INFORMATION
 DOI: 10.1038/ncb3076 Supplementary Figure 1 btrcp targets Cep68 for degradation during mitosis. a) Cep68 immunofluorescence in interphase and metaphase. U-2OS cells were transfected with control sirna
T H E J O U R N A L O F C E L L B I O L O G Y
 Supplemental material Chairoungdua et al., http://www.jcb.org/cgi/content/full/jcb.201002049/dc1 T H E J O U R N A L O F C E L L B I O L O G Y Figure S1. Expression of CD9 and CD82 inhibits Wnt/ -catenin
Supplementary Figure 1. MAT IIα is Acetylated at Lysine 81.
 IP: Flag a Mascot PTM Modified Mass Error Position Gene Names Score Score Sequence m/z [ppm] 81 MAT2A;AMS2;MATA2 35.6 137.28 _AAVDYQK(ac)VVR_ 595.83-2.28 b Pre-immu After-immu Flag- WT K81R WT K81R / Flag
SUPPLEMENTARY INFORMATION
 SUPPLEMENTARY INFORMATION doi:10.10/nature10195 NCBI gene: Tagged Subunit(s: HA-Vpx; FLAG-Cul4 HA-DCAF1 FLAG-Cul4 HA-FLAG-Vpx Mock Vpx (SIVmac 100 (a ; 0.159 (b ; 0.05 DCAF1 DDB1 DDA1 Cul4A 1; 0.024591
Cellular MicroRNA and P Bodies Modulate Host-HIV-1 Interactions. 指導教授 : 張麗冠博士 演講者 : 黃柄翰 Date: 2009/10/19
 Cellular MicroRNA and P Bodies Modulate Host-HIV-1 Interactions 指導教授 : 張麗冠博士 演講者 : 黃柄翰 Date: 2009/10/19 1 MicroRNA biogenesis 1. Pri mirna: primary mirna 2. Drosha: RNaseIII 3. DCR 1: Dicer 1 RNaseIII
The functional investigation of the interaction between TATA-associated factor 3 (TAF3) and p53 protein
 and p53 protein") THESIS BOOK The functional investigation of the interaction between TATA-associated factor 3 (TAF3) and p53 protein Orsolya Buzás-Bereczki Supervisors: Dr. Éva Bálint Dr. Imre Miklós Boros University of
THESIS BOOK The functional investigation of the interaction between TATA-associated factor 3 (TAF3) and p53 protein Orsolya Buzás-Bereczki Supervisors: Dr. Éva Bálint Dr. Imre Miklós Boros University of
Supplementary Table 1. List of primers used in this study
 Supplementary Table 1. List of primers used in this study Gene Forward primer Reverse primer Rat Met 5 -aggtcgcttcatgcaggt-3 5 -tccggagacacaggatgg-3 Rat Runx1 5 -cctccttgaaccactccact-3 5 -ctggatctgcctggcatc-3
Nature Genetics: doi: /ng.3731
 Supplementary Figure 1 Circadian profiles of Adarb1 transcript and ADARB1 protein in mouse tissues. (a) Overlap of rhythmic transcripts identified in the previous transcriptome analyses. The mouse liver
Supplementary Information
 Supplementary Information Supplementary Figure 1. EBV-gB 23-431 mainly exists as trimer in HEK 293FT cells. (a) Western blotting analysis for DSS crosslinked FLAG-gB 23-431. HEK 293FT cells transfected
The autoimmune disease-associated PTPN22 variant promotes calpain-mediated Lyp/Pep
 SUPPLEMENTARY INFORMATION The autoimmune disease-associated PTPN22 variant promotes calpain-mediated Lyp/Pep degradation associated with lymphocyte and dendritic cell hyperresponsiveness Jinyi Zhang, Naima
A Hepatocyte Growth Factor Receptor (Met) Insulin Receptor hybrid governs hepatic glucose metabolism SUPPLEMENTARY FIGURES, LEGENDS AND METHODS
 Insulin Receptor hybrid governs hepatic glucose metabolism SUPPLEMENTARY FIGURES, LEGENDS AND METHODS") A Hepatocyte Growth Factor Receptor (Met) Insulin Receptor hybrid governs hepatic glucose metabolism Arlee Fafalios, Jihong Ma, Xinping Tan, John Stoops, Jianhua Luo, Marie C. DeFrances and Reza Zarnegar
A Hepatocyte Growth Factor Receptor (Met) Insulin Receptor hybrid governs hepatic glucose metabolism Arlee Fafalios, Jihong Ma, Xinping Tan, John Stoops, Jianhua Luo, Marie C. DeFrances and Reza Zarnegar
Nature Genetics: doi: /ng Supplementary Figure 1
 Supplementary Figure 1 MSI2 interactors are associated with the riboproteome and are functionally relevant. (a) Coomassie blue staining of FLAG-MSI2 immunoprecipitated complexes. (b) GO analysis of MSI2-interacting
HIF-inducible mir-191 promotes migration in breast cancer through complex regulation of TGFβ-signaling in hypoxic microenvironment.
 HIF-inducible mir-9 promotes migration in breast cancer through complex regulation of TGFβ-signaling in hypoxic microenvironment. Neha Nagpal, Hafiz M Ahmad, Shibu Chameettachal3, Durai Sundar, Sourabh
Supplemental Figure S1. Expression of Cirbp mrna in mouse tissues and NIH3T3 cells.
 SUPPLEMENTAL FIGURE AND TABLE LEGENDS Supplemental Figure S1. Expression of Cirbp mrna in mouse tissues and NIH3T3 cells. A) Cirbp mrna expression levels in various mouse tissues collected around the clock
Electron micrograph of phosphotungstanic acid-stained exosomes derived from murine
 1 SUPPLEMENTARY INFORMATION SUPPLEMENTARY FIGURES Supplementary Figure 1. Physical properties of murine DC-derived exosomes. a, Electron micrograph of phosphotungstanic acid-stained exosomes derived from
EGFR shrna A: CCGGCGCAAGTGTAAGAAGTGCGAACTCGAGTTCGCACTTCTTACACTTGCG TTTTTG. EGFR shrna B: CCGGAGAATGTGGAATACCTAAGGCTCGAGCCTTAGGTATTCCACATTCTCTT TTTG
 Supplementary Methods Sequence of oligonucleotides used for shrna targeting EGFR EGFR shrna were obtained from the Harvard RNAi consortium. The following oligonucleotides (forward primer) were used to
Figure S1 Time-dependent down-modulation of HER3 by EZN No Treatment. EZN-3920, 2 μm. Time, h
 Figure S1 Time-dependent down-modulation of HER3 by EZN-392 HE ER3 mrna A, %Contr rol 12 No Treatment EZN-392, 2 μm 1 8 6 4 2 2 8 24 Time, h Figure S2. Specific target down-modulation by HER3 (EZN-392)
Profiles of gene expression & diagnosis/prognosis of cancer. MCs in Advanced Genetics Ainoa Planas Riverola
 Profiles of gene expression & diagnosis/prognosis of cancer MCs in Advanced Genetics Ainoa Planas Riverola Gene expression profiles Gene expression profiling Used in molecular biology, it measures the
Supplementary Figure 1 Transcription assay of nine ABA-responsive PP2C. Transcription assay of nine ABA-responsive PP2C genes. Total RNA was isolated
 Supplementary Figure 1 Transcription assay of nine ABA-responsive PP2C genes. Transcription assay of nine ABA-responsive PP2C genes. Total RNA was isolated from 7 day-old seedlings treated with or without
Supplemental Materials. STK16 regulates actin dynamics to control Golgi organization and cell cycle
 Supplemental Materials STK16 regulates actin dynamics to control Golgi organization and cell cycle Juanjuan Liu 1,2,3, Xingxing Yang 1,3, Binhua Li 1, Junjun Wang 1,2, Wenchao Wang 1, Jing Liu 1, Qingsong
Supplementary Figure 1.
 Supplementary Figure 1. Female Pro-ins2 -/- mice at 5-6 weeks of age were either inoculated i.p. with a single dose of CVB4 (1x10 5 PFU/mouse) or PBS and treated with αgalcer or control vehicle. On day
Supplementary Figure 1
 Supplementary Figure 1 a γ-h2ax MDC1 RNF8 FK2 BRCA1 U2OS Cells sgrna-1 ** 60 sgrna 40 20 0 % positive Cells (>5 foci per cell) b ** 80 sgrna sgrna γ-h2ax MDC1 γ-h2ax RNF8 FK2 MDC1 BRCA1 RNF8 FK2 BRCA1
Supplementary Information. Supplementary Figure 1
 Supplementary Information Supplementary Figure 1 1 Supplementary Figure 1. Functional assay of the hcas9-2a-mcherry construct (a) Gene correction of a mutant EGFP reporter cell line mediated by hcas9 or
Supplementary Figures
 Supplementary Figures Supplementary Figure 1 Characterization of stable expression of GlucB and sshbira in the CT26 cell line (a) Live cell imaging of stable CT26 cells expressing green fluorescent protein
Supplementary Figure 1
 A B D Relative TAp73 mrna p73 Supplementary Figure 1 25 2 15 1 5 p63 _-tub. MDA-468 HCC1143 HCC38 SUM149 MDA-468 HCC1143 HCC38 SUM149 HCC-1937 MDA-MB-468 ΔNp63_ TAp73_ TAp73β E C Relative ΔNp63 mrna TAp73
Inventory of Supplemental Data: Supplemental Figures 1-7. Supplemental Tables 1-8. Supplemental References. Supplemental Video:
 Inventory of Supplemental Data: Supplemental Figures -7 Supplemental Tables -8 Supplemental References Supplemental Video: Note that the video shows JHU-9 cells transfected with mir-93a antagomir or control
SUPPLEMENTARY FIGURES AND TABLE
 SUPPLEMENTARY FIGURES AND TABLE Supplementary Figure S1: Characterization of IRE1α mutants. A. U87-LUC cells were transduced with the lentiviral vector containing the GFP sequence (U87-LUC Tet-ON GFP).
Published online 17 July 2010 Nucleic Acids Research, 2010, Vol. 38, No doi: /nar/gkq637
 Published online 17 July 2010 Nucleic Acids Research, 2010, Vol. 38, No. 21 7673 7688 doi:10.1093/nar/gkq637 GAM/ZFp/ZNF512B is central to a gene sensor circuitry involving cell-cycle regulators, TGFb
SUPPLEMENTARY INFORMATION
 doi:10.1038/nature12215 Supplementary Figure 1. The effects of full and dissociated GR agonists in supporting BFU-E self-renewal divisions. BFU-Es were cultured in self-renewal medium with indicated GR