Supplementary Figure (OH) 22 nanoparticles did not affect cell viability and apoposis. MDA-MB-231, MCF-7, MCF-10A and BT549 cells were
|
|
|
- Isabel Park
- 5 years ago
- Views:
Transcription
1 Supplementary Figure (OH) 22 nanoparticles did not affect cell viability and apoposis. MDA-MB-231, MCF-7, MCF-10A and BT549 cells were treated with PBS, 82 (OH) 22, C 60 (OH) 22 or GdCl 3 (all 50 μm) for 3, 6, 10 or 21 days. (a, c, e, g) Cell viability was detected using CCK-8 assay. (b, d, f, h) Cells apoptosis analysis was detected using double staining with annexin V and PI. All the data are represented as mean ± s.e.m. (n = 3 each). 1
2 Supplementary Figure 2. MDA-MB-231 cells were treated with PBS (A, E, I), 82 (OH) 22 (B, F, J), C 60 (OH) 22 (C, G, K) or GdCl 3 (D, H, L) (50 μm) for 21 days. Cellular morphology of cells cultured on 2D/3D-matrigel cultures (a) and Scattering assay (b) were visualized. mean ± s.e.m. (n = 3 each). To compact cells, 2
3 *p < 0.05; to scattered cells, # p < 0.05 (one-way ANOVA, Tukey s post-hoc test). MDA-MB-231 cells were cultured with 20 ng/ml TGF-β supplement for 24 hours after treatment with PBS or Gd@C 82 (OH) 22 for 21 days and further seeded for 2D- and 3D-matrigel cultures. Morphological changes (c) and Scattering assay (d) were observed. Scale bar = 50 μm. mean ± s.e.m. (n = 3 each). To loose cells, *p < 0.05; to scattered cells, # p < 0.05; to compact cells, & p < 0.05 (two-way ANOVA, Bonferroni s post-hoc test). MDA-MB-231 cells were cultured in hypoxia and treated with PBS (A, E, I), 50 μm Gd@C 82 (OH) 22 (B, F, J), C 60 (OH) 22 (C, G, K) and GdCl 3 (D, H, L) for 10 days. Cellular morphology of cells cultured on 2D/3D-matrigel cultures (Scale bar = 50 μm) (e) and Scattering assay (f) were visualization. mean ± s.e.m. (n = 3 each). To compact cells, *p < 0.05; to scattered cells, # p < 0.05 (one-way ANOVA, Tukey s post-hoc test). MDA-MB-231 cells were transfected with HIF-1α expressing plasmid and/or treated with 20 ng/ml TGF-β with further culture in presence of Gd@C 82 (OH) 22 or PBS under hypoxia for 10 days. Cellular morphology of cells cultured on 2D/3D-matrigel cultures (Scale bar = 50 μm) (g) and Scattering assay (h) were visualized. mean ± s.e.m. (n = 3 each). To compact cells, *p < 0.05; to scattered cells, # p < 0.05 (two-way ANOVA, Bonferroni s post-hoc test). 3
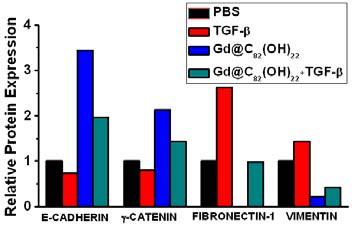
4 Supplementary Figure 3. MCF-7 and MCF-10A cells were treated with PBS, 82 (OH) 22, C 60 (OH) 22 and GdCl 3 (all 50 μm) for 21 days. (a) Cellular morphology of MCF-7 cells was observed on 2D- and 3D-matrigel culture or monolayer adherent culture. Scale bar = 50 μm. (c) Cellular morphology of MCF-10A cells on 2D- and 3D-matrigel cultures. Scale bar = 50 μm. Actin cytoskeleton (red) was observed. (Scale bar = 12.5 μm). (b, d) mrna levels of EMT markers (e-cadherin, γ-catenin, vimentin and fibronectin-1) were analyzed by real-time PCR (mean ± s.e.m., n = 3 each). *p < 0.05 (one-way ANOVA, Tukey s post-hoc test). 4
5 Supplementary Figure 4. (a) MDA-MB-231 cells were cultured and treated for 21 days with PBS and 82 (OH) 22 (0.1, 1, 10 and 50 μm). Representative images are shown. (b) Cell motility was evaluated by wound healing assay. 5
6 Supplementary Figure 5. BT549 cells were treated with PBS, 82 (OH) 22, C 60 (OH) 22 or GdCl 3 (50 μm) for 21 days. (a) Cellular morphology was observed in 2D- and 3D-matrigel cultures. Scale bar = 50 μm. (b) mrna levels of EMT markers (e-cadherin, γ-catenin, vimentin and fibronectin-1) were analyzed by real-time PCR (mean ± s.e.m., n = 3 each). *p < 0.05 (one-way ANOVA, Tukey s post-hoc test). (c, d) Cell migration and invasion were examined using trans-well cell culture chambers and Matrigel-coated ones (mean ± s.e.m., n = 6 each). *p < 0.05 and **p < 0.01 (one-way ANOVA, Tukey s post-hoc test). 6
7 Supplementary Figure 6. MDA-MB-231 cells were treated with PBS, 82 (OH) 22, C 60 (OH) 22 or GdCl 3 for 21 days and then subjected to agent withdrawal of for 14-day. (a) Cellular morphology. Scale bar = 50 μm. Actin cytoskeleton (red) was observed. (Scale bar = 12.5 μm). (b) Cell scattering assay. (mean ± s.e.m., n = 3 each). To compact cells, *p < 0.05; to scattered cells, # p < 0.05 (one-way ANOVA, Tukey s post-hoc test). (c) The changes of color of cell mass prepared by centrifugation before and after withdrawal. (d) The mrna level of EMT markers (e-cadherin, γ-catenin, vimentin and fibronectin-1) were analyzed by real-time PCR (mean ± s.e.m., n = 3 each). *p < 0.05 (one-way ANOVA, Tukey s post-hoc test). (e, f) Cell migration and invasion were examined using trans-well cell culture chambers and Matrigel-coated ones (mean ± s.e.m., n = 6 each). **p < 0.01 (one-way ANOVA, Tukey s post-hoc test). 7
8 j 8
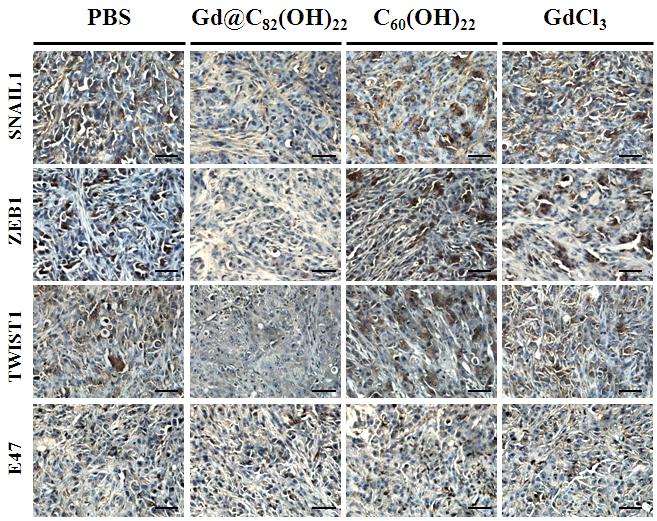
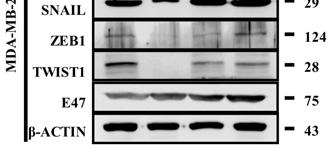
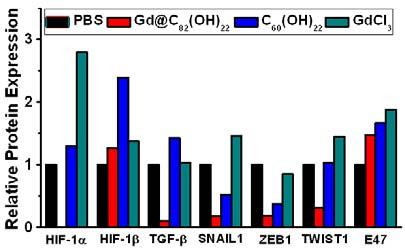
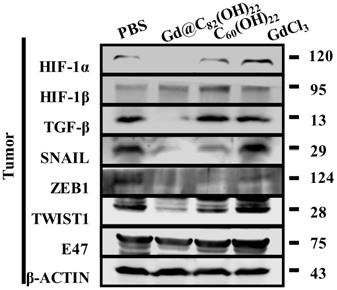
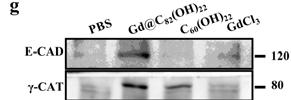
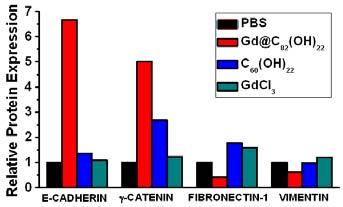
9 Supplementary Figure 7. Inhibition of tumor growth by 82 (OH) 22 in a mouse xenograft model. (a) Experimental design of approach II (terminal treatment) mice model. Tumor growth curves in approach II (b) mice were plotted. (mean ± s.e.m., n = 5 each). *p < 0.05 (two-way ANOVA, Bonferroni s post-hoc test). (c) Expressions of EMT markers in tumors (approach I) sections were detected using immuno-histochemical method (Scale bars represent 25 μm). Expression of Ki-67 (d) and active-caspase-3 (g) in tumor tissues of the approach I or II mice (Scale bars represent 25 μm). Ki-67 (e, f) and active-caspase-3 (h, i) positive cells were quantified (mean ± s.e.m., n = 3 each). *p < 0.05 and **p < 0.01 (one-way ANOVA, Tukey s post-hoc test). (j) Expression of SNAIL, ZEB1, TWIST1 and E47 in tumors were detected using immuno-histochemical method. 9


10 Supplementary Figure 8. KEGG (Kyoto Encyclopedia of Genes and Genomes) analysis of cancer pathway in MDA-MB-231 cells treated with PBS or 82 (OH) 22. Nodes were labeled using the gene names. Both the diminished (blue) and elevated (red) gene expression are indicated. 10
11 Supplementary Figure 9. BT549 cells were cultured in ultra-low attachment dishes (a) or adherent monolayer culture plate (b) for 10 days, and treated with PBS, Paclitaxel (5 nm or 10 nm), 82 (OH) 22, C 60 (OH) 22 or GdCl 3 (50 μm) for another 24 h, 48 h or 72 h. Cell viability was evaluated using CCK-8 assay. After treatment with PBS, Paclitaxel (5 nm or 10 nm), Gd@C 82 (OH) 22, C 60 (OH) 22 or GdCl 3 (50 μm) for 21 days, BT549 were dispersed into single cells and plated in suspension cultures. Tumorspheres were evaluated using the ALDEFLUOR assay (c) and quantified (d). All the data are represented as mean ± s.e.m. (n = 3 each) with *p < 0.05 and **p < 0.01 (one-way ANOVA, Tukey s post-hoc test). 11
12 Supplementary Figure (OH) 22 significantly inhibited the formation of primary and secondary tumorsphere formation and did not appreciably inhibit normal epithelial stem cells. MDA-MB-231 cells were maintained in PBS and 82 (OH) 22 for 21 days and further dispersed into single cells for mammosphere formation assay. The primary mammospheres were dispersed into single cells for secondary mammosphere formation assay as a measure of self-renewal. a) Primary and secondary mammosphere. b) The tumorspheres (> 70 μm) were quantitated (mean ± s.e.m., n = 3 each). **p < 0.01 (one-way ANOVA, Tukey s post-hoc test). MCF-10A cells were maintained in PBS and Gd@C 82 (OH) 22 for 21 days and further dispersed into single cells for ALDEFLUOR assay and mammosphere formation assay (c). The mammopheres were counted (d) by microscopy (> 70 μm) (mean ± s.e.m., n = 3 each). 12
13 Supplementary Figure 11. BT549 cells were treated with PBS, 82 (OH) 22, C 60 (OH) 22 and GdCl 3 (all 50 μm) under hypoxia for 10 days. (a) Cellular morphology on 2D- and 3D-matrigel cultures. (b, c) Cell migration and invasion were examined using trans-well cell culture chambers and Matrigel-coated ones (mean ± s.e.m., n = 3 each). **p < 0.01 (one-way ANOVA, Tukey s post-hoc test). MDA-MB-231 cells were treated with PBS, Gd@C 82 (OH) 22, C 60 (OH) 22 or GdCl 3 (50 μm) for 10 days under hypoxia. ELISA analysis for expression of TGF-β (d), IL-6 (e) and IL-8 (f) in supernatant culture medium were determined. All the data are represented as mean ± s.e.m. (n = 3 each) with *p < 0.05 and **p < 0.01 (one-way ANOVA, Tukey s post-hoc test). 13
14 Supplementary Figure 12. MDA-MB-231 and BT549 cells were treated with PBS, 82 (OH) 22, C 60 (OH) 22 or GdCl 3 (all 50 μm) for 10 days under hypoxia. (a, c) Cell viability was detected using CCK-8 assay. (b, d) Cells apoptosis analysis was detected using double staining with annexin V and PI. All the data are represented as mean ± s.e.m. (n = 3 each) with *p < 0.05 (one-way ANOVA, Tukey s post-hoc test). 14
 22, C 60 (OH) 22 or GdCl 3 for 21 days once a day i.p. before sacrifice. (a) Serum ALT (A), AST (B), BUN (C), CREA (D), CK (E) and CRP (F) levels.")
15 a b PBS Gd@C 82 (OH) 22 C 60 (OH) 22 GdCl 3 Supplementary Figure 13. Toxicity of Gd@C 82 (OH) 22 nanoparticles in vivo. Nude mice were injected with either 0.1 ml PBS, or 2.5 μmol/kg Gd@C 82 (OH) 22, C 60 (OH) 22 or GdCl 3 for 21 days once a day i.p. before sacrifice. (a) Serum ALT (A), AST (B), BUN (C), CREA (D), CK (E) and CRP (F) levels. (b) HE staining of various tissues (liver, spleen, kidney, heart and lung). 15
16 Supplementary Figure 14. The size and zeta potential measurement of the 82 (OH) 22 nanoparticle in different ph solutions. (a) ph = 4.3, the average size is ~40 nm; (b) ph = 5.1, the average size is ~116 nm; (c) ph = 7.4, the average size is ~175 nm; (d) ph = 8.5, the average size is ~84 nm; (e) ph = 9.7, the average size is 38 nm; (f) The average size of the Gd@C 82 (OH) 22 nanoparticles in different ph solutions. 16

17 a b c d e f g h i j 17


 Figure 1d, (c,")
")
")
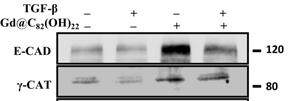
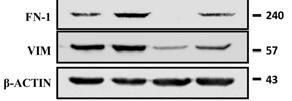
18 k l m n o p Supplementary Figure 15. All Western blot results have been quantified using Gelpro32 analysis software. (a, b) Figure 1d, (c, d) Figure 2g, (e, f) Figure 3c, (g, h) Figure 3j, (i, j) Figure 4c, (k, l) Figure 7e, (m, n) Figure 7i, (o, p) Figure 8b. 18
19 19
20 20
21 21
22 Supplementary Figure 16. Uncropped western blots with indicated areas of selection. 22
23 Supplementary Table 1. Anti-tumor activity of 82 (OH) 22 nanoparticles in mice model by approach I (early treatment). Group Tumor Weight (g) T-test Inhibition rate (%) PBS 0.32 ± 0.25 / / Gd@C 82 (OH) ± 0.03 p < C 60 (OH) ± 0.04 p < GdCl ± 0.20 p > * MDA-MB-231 cells were injected s.c. and mice were treated with PBS, Gd@C 82 (OH) 22, C 60 (OH) 22 or GdCl 3 daily at day 0 for 21 days. And at the day 21 st, the mice were executed and analysed. 23
24 Supplementary Table 2. Anti-tumor activity of 82 (OH) 22 nanoparticles in mice model by approach II (terminal treatment). Group Tumor Weight (g) T-test Inhibition rate (%) PBS 0.45 ± 0.12 / / Gd@C 82 (OH) ± 0.10 p < C 60 (OH) ± 0.12 p > GdCl ± 0.17 p > * MDA-MB-231 cells were injected s.c. When the tumors grew to 100 mm 3, the mice were treated with PBS, Gd@C 82 (OH) 22, C 60 (OH) 22 or GdCl 3 daily for 21 days. And after 21 days, the mice were executed and analysed. 24
25 Supplementary Table 3. Incidence of lung and liver metastases in mice with MDA-MB-231 cells injection i.v. (metastasis model) Lung metastases Liver metastases PBS* 6/6 4/6 82 (OH) 22 * 1/6 0/6 C 60 (OH) 22 * 5/6 3/6 GdCl 3 * 6/6 6/6 * MDA-MB-231 cells were injected i.v and mice were treated with PBS, Gd@C 82 (OH) 22, C 60 (OH) 22 or GdCl 3 daily at day 0 for 21 days. And at the day 21 st, the mice were executed and analysed. * The numbers represent the number of mice with lung or liver metastases/the number of mice in every group. 25
26 Supplementary Table 4. Summary of tumor formation in mice models Groups A B C D E F G H I Injected cell number Mice model Cancer stem cells Approach I Approach II Withdrawal Metastasis Delivery approach Peritoneal Peritoneal Peritoneal Peritoneal Peritoneal Peritoneal Peritoneal Peritoneal Tail vein Injection PBS Gd@C 82 (OH) C 60 (OH) GdCl
27 Supplementary Table 5. Sequence of the oligonucleotides for real-time PCR experiments Gene Sense Strand (5'-3') Antisense Strand (5'-3') Amplicon (bp) bmi1 AAATGCTGGAGAACTGGAAAG CTGTGGATGAGGAGACTGC 124 csf1 GCAGCGGCTGATTGACAGT CAGCTGCACAATGGCGAT 185 klf4 ACATGGCTGTCAGCGACGCG GCCAGCGGTTATTCGGGGCAC 108 lin28a TTCGGCTTCCTGTCCATGAC TGACTCAAGGCCTTTGGAAG 123 nanog CAACCAGACCCAGAACATCC TTCCAAAGCAGCCTCCAAG 185 cd44 CAGGGACAGCTGCAGCCTCA ACCTCGTCCCATGGGGTGTG 122 cd24 CCAACTAATGCCACCACCA GACGTTTCTTGGCCTGAGTC 118 aldh1 TCGTCTGCTGCTGGCGACAATG CCCAACCTGCACAGTAGCGCAA 113 ptgs2 (cox2) TGAAACCCACTCCAAACACA GAGAAGGCTTCCCAGCTTTT 185 tgf-β GGAAATTGAGGGCTTTCGCC CCGGTAGTGAACCCGTTGAT 90 hif1α TTTTTCAAGCAGTAGGAATTGGA GTGATGTAGTAGCTGCATGATCG 66 snail TGCGCTACTGCTGCGCGAAT GGGCTGCTGGAAGGTAAACTCTGGA 147 zeb1 AAGAATTCACAGTGGAGAGAAGCCA CGTTTCTTGCAGTTTGGGCATT 50 e47 GCATTGAGGCCTTGTGGA GGTAACGGTGGAGTCTCAGG 96 twist1 GGAGTCCGCAGTCTTACGAG TCTGGAGGACCTGGTAGAGG 200 cdh1 (e-cadherin) TGCCCAGAAAATGAAAAAGG GTGTATGTGGCAATGCGTTC 199 jup (γ-catenin) CCCCGCCTGGTGCAGAACTG GGAGAGTGTGCCCGTGGCAC 153 vim (vimentin) CGAGGAGAGCAGGATTTCTC GGTATCAACCAGAGGGAGTGA 90 fn-1(fibronectin-1) AGGCAGGCTCAGCAAATG TTAGGACGCTCATAAGTGTCACCC
28 cdh2 (n-cadherin) ACAGTGGCCACCTACAAAGG CCGAGATGGGGTTGATAATG 200 ocln (occludin) TGCCGCGTTGGTGATCTTT GCCCAGGATAGCACTCACTATT 100 ctnna1 (α-catenin) CCATGCAGGCAACATAAACTTC GGCTCCAACAGTCTCTCAACT 81 ctnnb1 (β-catenin) CCCACTGGCCTCTGATAAAGG ACGCAAAGGTGCATGATTTG 80 il-6 GGATTCAATGAGGAGACTTGCC TGGCATTTGTGGTTGGGTCA 208 il-8 TAAAGACATACTCCAAACC ACTTCTCCACAACCCTC 165 vegf CGCAAGAAATCCCGGTATAA TCTCCGCTCTGAGCAAGG 111 mmp-2 ACAGAACCCTTGGAGCCAAT GAAAGGTTCTAAGGCAGCCA 142 mmp-9 CGTCTTCCAGTACCGAGAGA GCAGGATGTCATAGGTCACG 119 gapdh TCCCATCACCATCTTCCAGG CCATCACGCCACAGTTTCC 98 28
29 Supplementary Table 6. List of proteins tested by antibodies and characteristics of the corresponding antibodies used Protein Assay Antibody Origin Dilution Incubation period E-CADHERIN WB mmab # , BD 1:5000 overnight E-CADHERIN IHC mmab # , BD 1:50 overnight E-CADHERIN IF mmab # , BD 1:100 overnight γ-catenin WB mmab #sc-8415, Santa Cruz 1:1000 overnight γ- CATENIN IHC mmab #sc-8415, Santa Cruz 1:50 overnight γ- CATENIN IF mmab #sc-8415, Santa Cruz 1:50 overnight FIBRONECTIN-1 WB mmab # , BD 1:5000 overnight FIBRONECTIN-1 IHC mmab # , BD 1:200 overnight FIBRONECTIN-1 IF mmab # , BD 1:200 overnight VIMENTIN WB mmab # , BD 1:5000 overnight VIMENTIN IHC mmab # , BD 1:100 overnight VIMENTIN IF mmab # , BD 1:200 overnight TWIST1 WB rpab #sc-15393, Santa Cruz 1:1000 overnight TWIST1 IHC rpab #sc-15393, Santa Cruz 1:50 overnight SNAIL WB rpab #sc-28199, Santa Cruz 1:1000 overnight SNAIL IHC rpab #sc-28199, Santa Cruz 1:100 overnight ZEB1 WB rpab #sc-25388, Santa Cruz 1:1000 overnight ZEB1 IHC rpab #sc-25388, Santa Cruz 1:50 overnight E47 WB mmab # , BD 1:5000 overnight 29
30 E47 IHC mmab # , BD 1:50 overnight COX2 WB gpab #sc-23984, Santa Cruz 1:1000 overnight COX2 IHC gpab #sc-23984, Santa Cruz 1:50 overnight TGF-β WB rpab #sc-146, Santa Cruz 1:1000 overnight TGF-β IHC rpab #sc-146, Santa Cruz 1:50 overnight HIF1α WB mmab # , BD 1:5000 overnight HIF1α IHC mmab # , BD 1:50 overnight HIF1β WB mmab # , BD 1:5000 overnight HIF1β IHC mmab # , BD 1:200 overnight β-actin WB mmab #M20010, Abmart 1: hour Abbreviations: WB, Western blot; IHC, immunohistochemistry; IF, immunofluorescence; mmab, mouse monoclonal antibody; rpab, rabbit polyclonal antibody; gpab, goat polyclonal antibody. 30
Supplementary Figure 1. HOPX is hypermethylated in NPC. (a) Methylation levels of HOPX in Normal (n = 24) and NPC (n = 24) tissues from the
 Methylation levels of HOPX in Normal (n = 24) and NPC (n = 24) tissues from the") Supplementary Figure 1. HOPX is hypermethylated in NPC. (a) Methylation levels of HOPX in Normal (n = 24) and NPC (n = 24) tissues from the genome-wide methylation microarray data. Mean ± s.d.; Student
Supplementary Figure 1. HOPX is hypermethylated in NPC. (a) Methylation levels of HOPX in Normal (n = 24) and NPC (n = 24) tissues from the genome-wide methylation microarray data. Mean ± s.d.; Student
(a) Significant biological processes (upper panel) and disease biomarkers (lower panel)
 Significant biological processes (upper panel) and disease biomarkers (lower panel)") Supplementary Figure 1. Functional enrichment analyses of secretomic proteins. (a) Significant biological processes (upper panel) and disease biomarkers (lower panel) 2 involved by hrab37-mediated secretory
Supplementary Figure 1. Functional enrichment analyses of secretomic proteins. (a) Significant biological processes (upper panel) and disease biomarkers (lower panel) 2 involved by hrab37-mediated secretory
An epithelial-to-mesenchymal transition-inducing potential of. granulocyte macrophage colony-stimulating factor in colon. cancer
 An epithelial-to-mesenchymal transition-inducing potential of granulocyte macrophage colony-stimulating factor in colon cancer Yaqiong Chen, Zhi Zhao, Yu Chen, Zhonglin Lv, Xin Ding, Renxi Wang, He Xiao,
Supplementary Information and Figure legends
 Supplementary Information and Figure legends Table S1. Primers for quantitative RT-PCR Target Sequence (5 -> 3 ) Target Sequence (5 -> 3 ) DAB2IP F:TGGACGATGTGCTCTATGCC R:GGATGGTGATGGTTTGGTAG Snail F:CCTCCCTGTCAGATGAGGAC
PKCζ Promotes Breast Cancer Invasion by Regulating Expression of E-cadherin and Zonula Occludens-1 (ZO-1) via NFκB-p65
 via NFκB-p65") SUPPLEMENTARY INFORMATION TITLE: PKCζ Promotes Breast Cancer Invasion by Regulating Expression of E-cadherin and Zonula Occludens-1 (ZO-1) via NFκB-p65 RUNNING TITLE: PKCζ-NFκB Signaling in Breast Cancer
SUPPLEMENTARY INFORMATION TITLE: PKCζ Promotes Breast Cancer Invasion by Regulating Expression of E-cadherin and Zonula Occludens-1 (ZO-1) via NFκB-p65 RUNNING TITLE: PKCζ-NFκB Signaling in Breast Cancer
SUPPLEMENTARY INFORMATION
 DOI: 10.1038/ncb2607 Figure S1 Elf5 loss promotes EMT in mammary epithelium while Elf5 overexpression inhibits TGFβ induced EMT. (a, c) Different confocal slices through the Z stack image. (b, d) 3D rendering
Type of file: PDF Size of file: 0 KB Title of file for HTML: Supplementary Information Description: Supplementary Figures
 Type of file: PDF Size of file: 0 KB Title of file for HTML: Supplementary Information Description: Supplementary Figures Supplementary Figure 1 mir-128-3p is highly expressed in chemoresistant, metastatic
Supplementary Figures
 Supplementary Figures Supplementary Figure 1 DOT1L regulates the expression of epithelial and mesenchymal markers. (a) The expression levels and cellular localizations of EMT markers were confirmed by
Supplementary Figure 1. Validation of astrocytes. Primary astrocytes were
 Supplementary Figure 1. Validation of astrocytes. Primary astrocytes were separated from the glial cultures using a mild trypsinization protocol. Anti-glial fibrillary acidic protein (GFAP) immunofluorescent
(A) Dose response curves of HMLE_shGFP (blue circle), HMLE_shEcad (red square),
 Dose response curves of HMLE_shGFP (blue circle), HMLE_shEcad (red square),") Supplementary Figures and Tables Figure S1. Validation of EMT-selective small molecules (A) Dose response curves of HMLE_shGFP (blue circle), HMLE_shEcad (red square), and HMLE_Twist (black diamond) cells
Supplementary Figures and Tables Figure S1. Validation of EMT-selective small molecules (A) Dose response curves of HMLE_shGFP (blue circle), HMLE_shEcad (red square), and HMLE_Twist (black diamond) cells
Supplemental Data. TGF-β-mediated mir-181a expression promotes breast cancer metastasis by targeting Bim.
 Supplemental Data TGF-β-mediated mir-181a expression promotes breast cancer metastasis by targeting Bim. Molly A. Taylor 1, Khalid Sossey-Alaoui 2, Cheryl L. Thompson 3, David Danielpour 4, and William
SUPPLEMENTARY INFORMATION
 DOI: 10.1038/ncb3021 Supplementary figure 1 Characterisation of TIMPless fibroblasts. a) Relative gene expression of TIMPs1-4 by real time quantitative PCR (RT-qPCR) in WT or ΔTimp fibroblasts (mean ±
Supplementary Figure 1. Deletion of Smad3 prevents B16F10 melanoma invasion and metastasis in a mouse s.c. tumor model.
 A B16F1 s.c. Lung LN Distant lymph nodes Colon B B16F1 s.c. Supplementary Figure 1. Deletion of Smad3 prevents B16F1 melanoma invasion and metastasis in a mouse s.c. tumor model. Highly invasive growth
Nature Methods: doi: /nmeth Supplementary Figure 1
 Supplementary Figure 1 Finite-element analysis of cell cluster dynamics in different cluster trap architectures. (a) Cluster-Chip (b) Filter (c) A structure identical to the Cluster-Chip except that one
mir-509-5p and mir-1243 increase the sensitivity to gemcitabine by inhibiting
 mir-509-5p and mir-1243 increase the sensitivity to gemcitabine by inhibiting epithelial-mesenchymal transition in pancreatic cancer Hidekazu Hiramoto, M.D. 1,3, Tomoki Muramatsu, Ph.D. 1, Daisuke Ichikawa,
Supplementary Figure S1 Expression of mir-181b in EOC (A) Kaplan-Meier
 Kaplan-Meier") Supplementary Figure S1 Expression of mir-181b in EOC (A) Kaplan-Meier curves for progression-free survival (PFS) and overall survival (OS) in a cohort of patients (N=52) with stage III primary ovarian
Supplementary Figure S1 Expression of mir-181b in EOC (A) Kaplan-Meier curves for progression-free survival (PFS) and overall survival (OS) in a cohort of patients (N=52) with stage III primary ovarian
Supplementary Table 1. Characterization of HNSCC PDX models established at MSKCC
 Supplementary Table 1. Characterization of HNSCC PDX models established at MSKCC Supplementary Table 2. Drug content and loading efficiency estimated with F-NMR and UV- Vis Supplementary Table 3. Complete
Supplementary Figure 1. The CagA-dependent wound healing or transwell migration of gastric cancer cell. AGS cells transfected with vector control or
 Supplementary Figure 1. The CagA-dependent wound healing or transwell migration of gastric cancer cell. AGS cells transfected with vector control or 3xflag-CagA expression vector were wounded using a pipette
(A) RT-PCR for components of the Shh/Gli pathway in normal fetus cell (MRC-5) and a
 RT-PCR for components of the Shh/Gli pathway in normal fetus cell (MRC-5) and a") Supplementary figure legends Supplementary Figure 1. Expression of Shh signaling components in a panel of gastric cancer. (A) RT-PCR for components of the Shh/Gli pathway in normal fetus cell (MRC-5) and
Supplementary figure legends Supplementary Figure 1. Expression of Shh signaling components in a panel of gastric cancer. (A) RT-PCR for components of the Shh/Gli pathway in normal fetus cell (MRC-5) and
Supplementary fig. 1. Crystals induce necroptosis does not involve caspases, TNF receptor or NLRP3. A. Mouse tubular epithelial cells were pretreated
 Supplementary fig. 1. Crystals induce necroptosis does not involve caspases, TNF receptor or NLRP3. A. Mouse tubular epithelial cells were pretreated with zvad-fmk (10µM) and exposed to calcium oxalate
Supplementary Table S1. Tumor samples used for analysis Tumor size (cm) BNG (grade) ERα PR. pn-
 BNG (grade) ERα PR. pn-") Supplementary Table S1. Tumor samples used for analysis Sample# Age Tumor size (cm) pn- Stage Stage BNG (grade) ERα PR HER2 (FISH) Triple negative T1 46 3 N1a III 2 Pos Neg N T2 58 1 N(i-) I 3 Pos Neg
Supplementary Table S1. Tumor samples used for analysis Sample# Age Tumor size (cm) pn- Stage Stage BNG (grade) ERα PR HER2 (FISH) Triple negative T1 46 3 N1a III 2 Pos Neg N T2 58 1 N(i-) I 3 Pos Neg
(A) PCR primers (arrows) designed to distinguish wild type (P1+P2), targeted (P1+P2) and excised (P1+P3)14-
 PCR primers (arrows) designed to distinguish wild type (P1+P2), targeted (P1+P2) and excised (P1+P3)14-") 1 Supplemental Figure Legends Figure S1. Mammary tumors of ErbB2 KI mice with 14-3-3σ ablation have elevated ErbB2 transcript levels and cell proliferation (A) PCR primers (arrows) designed to distinguish
1 Supplemental Figure Legends Figure S1. Mammary tumors of ErbB2 KI mice with 14-3-3σ ablation have elevated ErbB2 transcript levels and cell proliferation (A) PCR primers (arrows) designed to distinguish
TMA-VARESE COHORT-1 TMA-BERN COHORT-2
 Supplementary Figure 1 TMA-VARESE COHORT-1 TOTAL SAMPLES #5 GLEASON SCORE Number Percentage 6 16 32% = 7 17 34% >7 17 34% TUMOR STAGE T2C 28 56% T3A- 21 42% T3C-T4 1 2% NODE STATUS N 42 84% N1 8 16% PSA
5K ALDEFLUOR-positive/ CXCR1-negative. 5K ALDEFLUOR-positive/ CXCR1-positive BAAA BAAA CXCR1-APC BAAA BAAA CXCR1-APC
 A +DEAB -DEAB K ALDEFLUOR-positive/ CXCR-negative BAAA BAAA CXCR-APC B +DEAB -DEAB K ALDEFLUOR-positive/ CXCR-positive BAAA BAAA CXCR-APC C Supplemental Figure. Tumorigenicity of the ALDEFLUOR-positive/CXCR-positive
supplementary information
 DOI: 10.1038/ncb1875 Figure S1 (a) The 79 surgical specimens from NSCLC patients were analysed by immunohistochemistry with an anti-p53 antibody and control serum (data not shown). The normal bronchi served
Figure S1: Effects on haptotaxis are independent of effects on cell velocity A)
") Supplemental Figures Figure S1: Effects on haptotaxis are independent of effects on cell velocity A) Velocity of MV D7 fibroblasts expressing different GFP-tagged Ena/VASP family proteins in the haptotaxis
Supplemental Figures Figure S1: Effects on haptotaxis are independent of effects on cell velocity A) Velocity of MV D7 fibroblasts expressing different GFP-tagged Ena/VASP family proteins in the haptotaxis
Supplementary Figure 1. Repression of hepcidin expression in the liver of mice treated with
 Supplementary Figure 1. Repression of hepcidin expression in the liver of mice treated with DMN Immunohistochemistry for hepcidin and H&E staining (left). qrt-pcr assays for hepcidin in the liver (right).
A263 A352 A204. Pan CK. pstat STAT3 pstat3 STAT3 pstat3. Columns Columns 1-6 Positive control. Omentum. Rectosigmoid A195.
 pstat3 75 Pan CK A A263 A352 A24 B Columns 1-6 Positive control A195 A22 A24 A183 Rectal Nodule STAT3 pstat3 STAT3 pstat3 Columns 7-12 Omentum Rectosigmoid Left Ovary Right Ovary Omentum Uterus Uterus
Supplementary Figure 1. Basal level EGFR across a panel of ESCC lines. Immunoblots demonstrate the expression of phosphorylated and total EGFR as
 Supplementary Figure 1. Basal level EGFR across a panel of ESCC lines. Immunoblots demonstrate the expression of phosphorylated and total EGFR as well as their downstream effectors across a panel of ESCC
Supplemental Materials. Stromal Modulation Reverses Primary Resistance to Immune Checkpoint Blockade in. Pancreatic Cancer.
 Supplemental Materials Stromal Modulation Reverses Primary Resistance to Immune Checkpoint Blockade in Pancreatic Cancer Jun Zhao 1, Zhilan Xiao 2, 3, Tingting Li 1, 4, Huiqin Chen 5, Ying Yuan 5, Alan
Mitosis. Single Nano Micro Milli Macro. Primary. PCNA expression
 a b c DAPI YFP CC3 DAPI YFP PCNA DAPI YFP ph3 DAPI YFP KI67 e 6 Mitosis f 1 PCNA expression %ph3 + /YFP + n= 63 87 61 3 13 8 n= 15 3 9 1 5 %PCNA+/YFP+ 8 6 Supplementary Figure 1. Proliferation/apoptosis
Supplementary Figure 1. Characterization of NMuMG-ErbB2 and NIC breast cancer cells expressing shrnas targeting LPP. NMuMG-ErbB2 cells (a) and NIC
 and NIC") Supplementary Figure 1. Characterization of NMuMG-ErbB2 and NIC breast cancer cells expressing shrnas targeting LPP. NMuMG-ErbB2 cells (a) and NIC cells (b) were engineered to stably express either a LucA-shRNA
Supplementary Figure 1. Characterization of NMuMG-ErbB2 and NIC breast cancer cells expressing shrnas targeting LPP. NMuMG-ErbB2 cells (a) and NIC cells (b) were engineered to stably express either a LucA-shRNA
(A) Cells grown in monolayer were fixed and stained for surfactant protein-c (SPC,
 Cells grown in monolayer were fixed and stained for surfactant protein-c (SPC,") Supplemental Figure Legends Figure S1. Cell line characterization (A) Cells grown in monolayer were fixed and stained for surfactant protein-c (SPC, green) and co-stained with DAPI to visualize the nuclei.
Supplemental Figure Legends Figure S1. Cell line characterization (A) Cells grown in monolayer were fixed and stained for surfactant protein-c (SPC, green) and co-stained with DAPI to visualize the nuclei.
Supplementary Figure 1. The mir-182 binding site of SMAD7 3 UTR and the. mutated sequence.
 Supplementary Figure 1. The mir-182 binding site of SMAD7 3 UTR and the mutated sequence. 1 Supplementary Figure 2. Expression of mir-182 and SMAD7 in various cell lines. (A) Basal levels of mir-182 expression
Supplementary Figure 1. Expression of CUGBP1 in non-parenchymal liver cells treated with TGF-β
 Supplementary Figures Supplementary Figure 1. Expression of CUGBP1 in non-parenchymal liver cells treated with TGF-β and LPS. Non-parenchymal liver cells were isolated and treated with or without TGF-β
SUPPLEMENTARY INFORMATION
 DOI:.38/ncb3399 a b c d FSP DAPI 5mm mm 5mm 5mm e Correspond to melanoma in-situ Figure a DCT FSP- f MITF mm mm MlanaA melanoma in-situ DCT 5mm FSP- mm mm mm mm mm g melanoma in-situ MITF MlanaA mm mm
NLRX1: 5 -GCTCCATGGCTTAGAGCATC-3 (forward) 5 -AACTCCTCCTCCGTCCTGAT-3 (reverse) β-actin
 5 -AACTCCTCCTCCGTCCTGAT-3 (reverse) β-actin") NLRX1 β-actin 1 2 3 4 5 6 1 2 3 4 5 6 NLRX1 (667 bp) β-actin (523 bp) Supplementary Figure 1: Expression of NLRX1 in human cell lines. 1: HeLa, 2: HEK293T, 3: MCF-7, 4:Ramos, 5:Jurkat, 6: THP1. The following
NLRX1 β-actin 1 2 3 4 5 6 1 2 3 4 5 6 NLRX1 (667 bp) β-actin (523 bp) Supplementary Figure 1: Expression of NLRX1 in human cell lines. 1: HeLa, 2: HEK293T, 3: MCF-7, 4:Ramos, 5:Jurkat, 6: THP1. The following
Yanrong Su *, Nathan R. Hopfinger, Theresa D. Nguyen, Thomas J. Pogash, Julia Santucci-Pereira and Jose Russo *
 Su et al. Journal of Experimental & Clinical Cancer Research (2018) 37:314 https://doi.org/10.1186/s13046-018-0988-8 RESEARCH Open Access Epigenetic reprogramming of epithelial mesenchymal transition in
Fang et al. NMuMG. PyVmT unstained Anti-CCR2-PE MDA-MB MCF MCF10A
 A NMuMG PyVmT 16.5+.5 47.+7.2 Fang et al. unstained Anti-CCR2-PE 4T1 Control 37.6+6.3 56.1+.65 MCF1A 16.1+3. MCF-7 3.1+5.4 MDA-M-231 42.1+5.5 unstained Secondary antibody only Anti-CCR2 SUPPLEMENTAL FIGURE
Supplementary Figure 1. SA-β-Gal positive senescent cells in various cancer tissues. Representative frozen sections of breast, thyroid, colon and
 Supplementary Figure 1. SA-β-Gal positive senescent cells in various cancer tissues. Representative frozen sections of breast, thyroid, colon and stomach cancer were stained with SA-β-Gal and nuclear fast
SUPPLEMENTAL TEXT AND FIGURES
 SUPPLEMENTAL TEXT AND FIGURES Prrx1 isoform switching regulates pancreatic cancer invasion and metastatic colonization Shigetsugu Takano, Maximilian Reichert, Basil Bakir, Koushik K. Das, Takahiro Nishida,
Oncolytic Adenovirus Complexes Coated with Lipids and Calcium Phosphate for Cancer Gene Therapy
 Oncolytic Adenovirus Complexes Coated with Lipids and Calcium Phosphate for Cancer Gene Therapy Jianhua Chen, Pei Gao, Sujing Yuan, Rongxin Li, Aimin Ni, Liang Chu, Li Ding, Ying Sun, Xin-Yuan Liu, Yourong
Supplementary Figure 1. Identification of tumorous sphere-forming CSCs and CAF feeder cells. The LEAP (Laser-Enabled Analysis and Processing)
") Supplementary Figure 1. Identification of tumorous sphere-forming CSCs and CAF feeder cells. The LEAP (Laser-Enabled Analysis and Processing) platform with laser manipulation to efficiently purify lung
Supplementary Figure 1. Identification of tumorous sphere-forming CSCs and CAF feeder cells. The LEAP (Laser-Enabled Analysis and Processing) platform with laser manipulation to efficiently purify lung
p = formed with HCI-001 p = Relative # of blood vessels that formed with HCI-002 Control Bevacizumab + 17AAG Bevacizumab 17AAG
 A.. Relative # of ECs associated with HCI-001 1.4 1.2 1.0 0.8 0.6 0.4 0.2 0.0 ol b p < 0.001 Relative # of blood vessels that formed with HCI-001 1.4 1.2 1.0 0.8 0.6 0.4 0.2 0.0 l b p = 0.002 Control IHC:
SREBP-2 promotes stem cell-like properties and metastasis by transcriptional activation of c-myc in prostate cancer
 SREBP-2 promotes stem cell-like properties and metastasis by transcriptional activation of c-myc in prostate cancer Supplementary Material Supplementary Methods Supplementary References Supplementary Figure
Table S1. Primer sequences used for qrt-pcr. CACCATTGGCAATGAGCGGTTC AGGTCTTTGCGGATGTCCACGT ACTB AAGTCCATGTGCTGGCAGCACT ATCACCACTCCGAAGTCCGTCT LCOR
 Table S1. Primer sequences used for qrt-pcr. ACTB LCOR KLF6 CTBP1 CDKN1A CDH1 ATF3 PLAU MMP9 TFPI2 CACCATTGGCAATGAGCGGTTC AGGTCTTTGCGGATGTCCACGT AAGTCCATGTGCTGGCAGCACT ATCACCACTCCGAAGTCCGTCT CGGCTGCAGGAAAGTTTACA
Inhibition of TGFβ enhances chemotherapy action against triple negative breast cancer by abrogation of
 SUPPLEMENTAL DATA Inhibition of TGFβ enhances chemotherapy action against triple negative breast cancer by abrogation of cancer stem cells and interleukin-8 Neil E. Bhola 1, Justin M. Balko 1, Teresa C.
Supplementary Figure 1. Antibiotic partially rescues mice from sepsis. (ab) BALB/c mice under CLP were treated with antibiotic or PBS.
 BALB/c mice under CLP were treated with antibiotic or PBS.") 1 Supplementary Figure 1. Antibiotic partially rescues mice from sepsis. (ab) BALB/c mice under CLP were treated with antibiotic or PBS. (a) Survival curves. WT Sham (n=5), WT CLP or WT CLP antibiotic
1 Supplementary Figure 1. Antibiotic partially rescues mice from sepsis. (ab) BALB/c mice under CLP were treated with antibiotic or PBS. (a) Survival curves. WT Sham (n=5), WT CLP or WT CLP antibiotic
Does EMT Contribute to Radiation Resistance in Human Breast Cancer?
 AD Award Number: W81XWH-10-1-0592 TITLE: Does EMT Contribute to Radiation Resistance in Human Breast Cancer? PRINCIPAL INVESTIGATOR: Anupama Munshi, Ph.D CONTRACTING ORGANIZATION: University of Oklahoma
Supplementary Materials for
 www.sciencesignaling.org/cgi/content/full/7/310/ra11/dc1 Supplementary Materials for STAT3 Induction of mir-146b Forms a Feedback Loop to Inhibit the NF-κB to IL-6 Signaling Axis and STAT3-Driven Cancer
Supplementary Fig. 1. GPRC5A post-transcriptionally down-regulates EGFR expression. (a) Plot of the changes in steady state mrna levels versus
 Plot of the changes in steady state mrna levels versus") Supplementary Fig. 1. GPRC5A post-transcriptionally down-regulates EGFR expression. (a) Plot of the changes in steady state mrna levels versus changes in corresponding proteins between wild type and Gprc5a-/-
Supplementary Fig. 1. GPRC5A post-transcriptionally down-regulates EGFR expression. (a) Plot of the changes in steady state mrna levels versus changes in corresponding proteins between wild type and Gprc5a-/-
Supplemental Figure 1. Western blot analysis indicated that MIF was detected in the fractions of
 Supplemental Figure Legends Supplemental Figure 1. Western blot analysis indicated that was detected in the fractions of plasma membrane and cytosol but not in nuclear fraction isolated from Pkd1 null
Supplementary Figure 1.TRIM33 binds β-catenin in the nucleus. a & b, Co-IP of endogenous TRIM33 with β-catenin in HT-29 cells (a) and HEK 293T cells
 and HEK 293T cells") Supplementary Figure 1.TRIM33 binds β-catenin in the nucleus. a & b, Co-IP of endogenous TRIM33 with β-catenin in HT-29 cells (a) and HEK 293T cells (b). TRIM33 was immunoprecipitated, and the amount of
Supplementary Figure 1.TRIM33 binds β-catenin in the nucleus. a & b, Co-IP of endogenous TRIM33 with β-catenin in HT-29 cells (a) and HEK 293T cells (b). TRIM33 was immunoprecipitated, and the amount of
Programmed necrosis, not apoptosis, is a key mediator of cell loss and DAMP-mediated inflammation in dsrna-induced retinal degeneration
 Programmed necrosis, not apoptosis, is a key mediator of cell loss and DAMP-mediated inflammation in dsrna-induced retinal degeneration The Harvard community has made this article openly available. Please
Supplementary Figures for
 mirns regulate s Supplementary igures for MicroRNs Reprogram Normal ibroblasts into Cancer ssociated ibroblasts in Ovarian Cancer nirban K. Mitra, Marion Zillhardt, Youjia Hua, Payal iwari, ndrea E. Murmann,
Supplemental Information. Tissue Myeloid Progenitors Differentiate. into Pericytes through TGF-b Signaling. in Developing Skin Vasculature
 Cell Reports, Volume 18 Supplemental Information Tissue Myeloid Progenitors Differentiate into Pericytes through TGF-b Signaling in Developing Skin Vasculature Tomoko Yamazaki, Ani Nalbandian, Yutaka Uchida,
Supplementary Information
 Supplementary Information Figure S1. Int6 gene silencing efficiency. (A) Western Blot analysis of Int6 expression at different times after sirna transfection. Int6 expression is strongly silenced in Int6
Supplementary Materials and Methods
 DD2 suppresses tumorigenicity of ovarian cancer cells by limiting cancer stem cell population Chunhua Han et al. Supplementary Materials and Methods Analysis of publicly available datasets: To analyze
Title page. Title: MicroRNA-155 Controls Exosome Synthesis and Promotes Gemcitabine Resistance in
 Title page Title: MicroRNA- Controls Synthesis and Promotes Gemcitabine Resistance in Pancreatic Ductal Adenocarcinoma Authors Manabu Mikamori, Daisaku Yamada, Hidetoshi Eguchi, Shinichiro Hasegawa, Tomoya
Fig 1 CD163. CD11b S100A9. Sirius Red. 100μm ** ** CD163. CD11b S100A9 ** Sirius Red (PL) Sirius Red SUM Mo.
 Sirius Red SUM Mo.") T47D T47D + o SU-59 Fig SU-59 + o IHC score (-3) IHC score (-2) CD63 3 2 IHC score (-3) CD63 3 ** 2 CDb CDb * * SA9 SA9 ** * 2 IHC score (-4) αsa αsa 4 ** ** 2 Sirius Red μm IHC score (%) Sirius Red 8
T47D T47D + o SU-59 Fig SU-59 + o IHC score (-3) IHC score (-2) CD63 3 2 IHC score (-3) CD63 3 ** 2 CDb CDb * * SA9 SA9 ** * 2 IHC score (-4) αsa αsa 4 ** ** 2 Sirius Red μm IHC score (%) Sirius Red 8
Figure S1. PMVs from THP-1 cells expose phosphatidylserine and carry actin. A) Flow
 Flow") SUPPLEMENTARY DATA Supplementary Figure Legends Figure S1. PMVs from THP-1 cells expose phosphatidylserine and carry actin. A) Flow cytometry analysis of PMVs labelled with annexin-v-pe (Guava technologies)
SUPPLEMENTARY DATA Supplementary Figure Legends Figure S1. PMVs from THP-1 cells expose phosphatidylserine and carry actin. A) Flow cytometry analysis of PMVs labelled with annexin-v-pe (Guava technologies)
Supplementary Figure S I: Effects of D4F on body weight and serum lipids in apoe -/- mice.
 Supplementary Figures: Supplementary Figure S I: Effects of D4F on body weight and serum lipids in apoe -/- mice. Male apoe -/- mice were fed a high-fat diet for 8 weeks, and given PBS (model group) or
Suppl Video: Tumor cells (green) and monocytes (white) are seeded on a confluent endothelial
 and monocytes (white) are seeded on a confluent endothelial") Supplementary Information Häuselmann et al. Monocyte induction of E-selectin-mediated endothelial activation releases VE-cadherin junctions to promote tumor cell extravasation in the metastasis cascade
Supplementary Information Häuselmann et al. Monocyte induction of E-selectin-mediated endothelial activation releases VE-cadherin junctions to promote tumor cell extravasation in the metastasis cascade
Supplementary Figure 1. A. Bar graph representing the expression levels of the 19 indicated genes in the microarrays analyses comparing human lung
 Supplementary Figure 1. A. Bar graph representing the expression levels of the 19 indicated genes in the microarrays analyses comparing human lung immortalized broncho-epithelial cells (AALE cells) expressing
Reduction of metastatic and angiogenic potency of malignant cancer by Eupatorium. fortunei via suppression of MMP-9 activity and VEGF production
 Supplementary Information Reduction of metastatic and angiogenic potency of malignant cancer by Eupatorium fortunei via suppression of MMP-9 activity and VEGF production Aeyung Kim, Minju Im, Nam-Hui Yim
Mesenchymal Stem Cells Reshape and Provoke Proliferation of Articular. State Key Laboratory of Bioreactor Engineering, East China University of
 Mesenchymal Stem Cells Reshape and Provoke Proliferation of Articular Chondrocytes by Paracrine Secretion Lei Xu, Yuxi Wu, Zhimiao Xiong, Yan Zhou, Zhaoyang Ye *, Wen-Song Tan * State Key Laboratory of
Supplemental Methods Supplemental Table 1. Supplemental Figure 1. Supplemental Figure 2. Supplemental Figure 3. Supplemental Figure 4.
 Supplemental Methods TGF-B1 ELISA Supernatants were collected from AT2 cells cultured for 1, 2, 3, or 4 days and frozen at -80 degrees C until use in the ELISA. A commercially available mouse TGF-B1 Duo
Supplementary Figures
 Supplementary Figures Supplementary Figure 1. Confirmation of Dnmt1 conditional knockout out mice. a, Representative images of sorted stem (Lin - CD49f high CD24 + ), luminal (Lin - CD49f low CD24 + )
Supplementary Figure 1: Expression of NFAT proteins in Nfat2-deleted B cells (a+b) Protein expression of NFAT2 (a) and NFAT1 (b) in isolated splenic
 Protein expression of NFAT2 (a) and NFAT1 (b) in isolated splenic") Supplementary Figure 1: Expression of NFAT proteins in Nfat2-deleted B cells (a+b) Protein expression of NFAT2 (a) and NFAT1 (b) in isolated splenic B cells from WT Nfat2 +/+, TCL1 Nfat2 +/+ and TCL1 Nfat2
Supplementary Figure 1: Expression of NFAT proteins in Nfat2-deleted B cells (a+b) Protein expression of NFAT2 (a) and NFAT1 (b) in isolated splenic B cells from WT Nfat2 +/+, TCL1 Nfat2 +/+ and TCL1 Nfat2
Supplementary Figure 1. Establishment of prostacyclin-secreting hmscs. (a) PCR showed the integration of the COX-1-10aa-PGIS transgene into the
 PCR showed the integration of the COX-1-10aa-PGIS transgene into the") Supplementary Figure 1. Establishment of prostacyclin-secreting hmscs. (a) PCR showed the integration of the COX-1-10aa-PGIS transgene into the genomic DNA of hmscs (PGI2- hmscs). Native hmscs and plasmid
Supplementary Figure 1. Establishment of prostacyclin-secreting hmscs. (a) PCR showed the integration of the COX-1-10aa-PGIS transgene into the genomic DNA of hmscs (PGI2- hmscs). Native hmscs and plasmid
Supplementary Table 3. 3 UTR primer sequences. Primer sequences used to amplify and clone the 3 UTR of each indicated gene are listed.
 Supplemental Figure 1. DLKI-DIO3 mirna/mrna complementarity. Complementarity between the indicated DLK1-DIO3 cluster mirnas and the UTR of SOX2, SOX9, HIF1A, ZEB1, ZEB2, STAT3 and CDH1with mirsvr and PhastCons
Material and Methods. Flow Cytometry Analyses:
 Material and Methods Flow Cytometry Analyses: Immunostaining of breast cancer cells for HER2 was performed by incubating cells with anti- HER2/neu APC (Biosciences, Cat# 340554), anti-her2/neu PE (Biosciences,
Supplemental Figure 1. (A) Western blot for the expression of RIPK1 in HK-2 cells treated with or without LPS (1 µg/ml) for indicated times.
 Western blot for the expression of RIPK1 in HK-2 cells treated with or without LPS (1 µg/ml) for indicated times.") Supplemental Figure 1. (A) Western blot for the expression of RIPK1 in HK-2 cells treated with or without LPS (1 µg/ml) for indicated times. Western blots shown are representative results from 3 independent
Supplemental Figure 1. (A) Western blot for the expression of RIPK1 in HK-2 cells treated with or without LPS (1 µg/ml) for indicated times. Western blots shown are representative results from 3 independent
CD34 + VEGFR-3 + progenitor cells have a potential to differentiate towards lymphatic endothelial cells
 CD34 + VEGFR-3 + progenitor cells have a potential to differentiate towards lymphatic endothelial cells Tan YZ et al. J Cell Mol Med. (2014 Mar;18(3):422-33) Denise Traxler-Weidenauer April 2014 Introduction
Supplementary Figure 1: Hsp60 / IEC mice are embryonically lethal (A) Light microscopic pictures show mouse embryos at developmental stage E12.
 Light microscopic pictures show mouse embryos at developmental stage E12.") Supplementary Figure 1: Hsp60 / IEC mice are embryonically lethal (A) Light microscopic pictures show mouse embryos at developmental stage E12.5 and E13.5 prepared from uteri of dams and subsequently genotyped.
Supplementary Figure 1: Hsp60 / IEC mice are embryonically lethal (A) Light microscopic pictures show mouse embryos at developmental stage E12.5 and E13.5 prepared from uteri of dams and subsequently genotyped.
Supplemental Figure 1
 Supplemental Figure 1 A S100A4: SFLGKRTDEAAFQKLMSNLDSNRDNEVDFQEYCVFLSCIAMMCNEFFEGFPDK Overlap: SF G DE KLM LD N D VDFQEY VFL I M N FF G PD S100A2: SFVGEKVDEEGLKKLMGSLDENSDQQVDFQEYAVFLALITVMCNDFFQGCPDR
Supplemental Information
 Supplemental Information Tobacco-specific Carcinogen Induces DNA Methyltransferases 1 Accumulation through AKT/GSK3β/βTrCP/hnRNP-U in Mice and Lung Cancer patients Ruo-Kai Lin, 1 Yi-Shuan Hsieh, 2 Pinpin
Supplementary data Supplementary Figure 1 Supplementary Figure 2
 Supplementary data Supplementary Figure 1 SPHK1 sirna increases RANKL-induced osteoclastogenesis in RAW264.7 cell culture. (A) RAW264.7 cells were transfected with oligocassettes containing SPHK1 sirna
Nimbolide inhibits pancreatic cancer growth and metastasis through ROS-mediated
 Nimbolide inhibits pancreatic cancer growth and metastasis through ROS-mediated apoptosis and inhibition of epithelial-to-mesenchymal transition Ramadevi Subramani a, Ph.D., Elizabeth Gonzalez b, MS.,
(a) Schematic diagram of the FS mutation of UVRAG in exon 8 containing the highly instable
 Schematic diagram of the FS mutation of UVRAG in exon 8 containing the highly instable") Supplementary Figure 1. Frameshift (FS) mutation in UVRAG. (a) Schematic diagram of the FS mutation of UVRAG in exon 8 containing the highly instable A 10 DNA repeat, generating a premature stop codon
Supplementary Figure 1. Frameshift (FS) mutation in UVRAG. (a) Schematic diagram of the FS mutation of UVRAG in exon 8 containing the highly instable A 10 DNA repeat, generating a premature stop codon
In vitro scratch assay: method for analysis of cell migration in vitro labeled fluorodeoxyglucose (FDG)
") In vitro scratch assay: method for analysis of cell migration in vitro labeled fluorodeoxyglucose (FDG) 1 Dr Saeb Aliwaini 13/11/2015 Migration in vivo Primary tumors are responsible for only about 10%
In vitro scratch assay: method for analysis of cell migration in vitro labeled fluorodeoxyglucose (FDG) 1 Dr Saeb Aliwaini 13/11/2015 Migration in vivo Primary tumors are responsible for only about 10%
Supplementary Figure 1. mrna expression of chitinase and chitinase-like protein in splenic immune cells. Each splenic immune cell population was
 Supplementary Figure 1. mrna expression of chitinase and chitinase-like protein in splenic immune cells. Each splenic immune cell population was sorted by FACS. Surface markers for sorting were CD11c +
Supplementary Figure 1
 Supplementary Figure 1 A B mir-141, human cell lines mir-2c, human cell lines mir-141, hepatocytes mir-2c, hepatocytes Relative RNA.1.8.6.4.2 Relative RNA.3.2.1 Relative RNA 1.5 1..5 Relative RNA 2. 1.5
Supplementary Figure 1: si-craf but not si-braf sensitizes tumor cells to radiation.
 Supplementary Figure 1: si-craf but not si-braf sensitizes tumor cells to radiation. (a) Embryonic fibroblasts isolated from wildtype (WT), BRAF -/-, or CRAF -/- mice were irradiated (6 Gy) and DNA damage
AAV-TBGp-Cre treatment resulted in hepatocyte-specific GH receptor gene recombination
 AAV-TBGp-Cre treatment resulted in hepatocyte-specific GH receptor gene recombination Supplementary Figure 1. Generation of the adult-onset, liver-specific GH receptor knock-down (alivghrkd, Kd) mouse
Supplementary Figure 1. IDH1 and IDH2 mutation site sequences on WHO grade III
 Supplementary Materials: Supplementary Figure 1. IDH1 and IDH2 mutation site sequences on WHO grade III patient samples. Genomic DNA samples extracted from punch biopsies from either FFPE or frozen tumor
supplementary information
 DOI: 10.1038/ncb2133 Figure S1 Actomyosin organisation in human squamous cell carcinoma. (a) Three examples of actomyosin organisation around the edges of squamous cell carcinoma biopsies are shown. Myosin
Supplementary Figure 1. EC-specific Deletion of Snail1 Does Not Affect EC Apoptosis. (a,b) Cryo-sections of WT (a) and Snail1 LOF (b) embryos at
 Cryo-sections of WT (a) and Snail1 LOF (b) embryos at") Supplementary Figure 1. EC-specific Deletion of Snail1 Does Not Affect EC Apoptosis. (a,b) Cryo-sections of WT (a) and Snail1 LOF (b) embryos at E10.5 were double-stained for TUNEL (red) and PECAM-1 (green).
Supplementary Figure 1. EC-specific Deletion of Snail1 Does Not Affect EC Apoptosis. (a,b) Cryo-sections of WT (a) and Snail1 LOF (b) embryos at E10.5 were double-stained for TUNEL (red) and PECAM-1 (green).
Aspirin blocks growth of breast tumor cells and tumor-initiating cells and induces reprogramming factors of mesenchymal to epithelial transition
 Laboratory Investigation (2015) 95, 702 717 2015 USCAP, Inc All rights reserved 0023-6837/15 Aspirin blocks growth of breast tumor cells and tumor-initiating cells and induces reprogramming factors of
Supplemental Figure 1. Isolation and characterization of CD133+ neurosphere-like
 SUPPLEMENTL FIGURE LEGENDS Supplemental Figure 1. Isolation and characterization of CD133+ neurosphere-like spheroids from a human brain tumor sample or glioma xenograft. () CD133+ tumor cells isolated
Supplementary Data Table of Contents:
 Supplementary Data Table of Contents: - Supplementary Methods - Supplementary Figures S1(A-B) - Supplementary Figures S2 (A-B) - Supplementary Figures S3 - Supplementary Figures S4(A-B) - Supplementary
Supplementary Figure S1. Effect of Glucose on Energy Balance in WT and KHK A/C KO
 Supplementary Figure S1. Effect of Glucose on Energy Balance in WT and KHK A/C KO Mice. WT mice and KHK-A/C KO mice were provided drinking water containing 10% glucose or tap water with normal chow ad
* This work was funded by the Breast Cancer Research Trust (New Zealand), The Dick Roberts Trust (New Zealand), Cancer Science Institute (Singapore),
, The Dick Roberts Trust (New Zealand), Cancer Science Institute (Singapore),") THE JOURNAL OF BIOLOGICAL CHEMISTRY VOL. 287, NO. 51, pp. 42502 42515, December 14, 2012 2012 by The American Society for Biochemistry and Molecular Biology, Inc. Published in the U.S.A. Artemin Stimulates
THE JOURNAL OF BIOLOGICAL CHEMISTRY VOL. 287, NO. 51, pp. 42502 42515, December 14, 2012 2012 by The American Society for Biochemistry and Molecular Biology, Inc. Published in the U.S.A. Artemin Stimulates
Supplementary Figure 1. Normal T lymphocyte populations in Dapk -/- mice. (a) Normal thymic development in Dapk -/- mice. Thymocytes from WT and Dapk
 Normal thymic development in Dapk -/- mice. Thymocytes from WT and Dapk") Supplementary Figure 1. Normal T lymphocyte populations in Dapk -/- mice. (a) Normal thymic development in Dapk -/- mice. Thymocytes from WT and Dapk -/- mice were stained for expression of CD4 and CD8.
Supplementary Figure 1. Normal T lymphocyte populations in Dapk -/- mice. (a) Normal thymic development in Dapk -/- mice. Thymocytes from WT and Dapk -/- mice were stained for expression of CD4 and CD8.
Supplementary Figures for
 Supplementary Figures for SOX2 suppresses CDKN1A to sustain growth of lung squamous cell carcinoma Takuya Fukazawa 1, Minzhe Guo 4, 5, Naomasa Ishida 1, Tomoki Yamatsuji 1, Munenori Takaoka 1, Etsuko Yokota
Cell Migration and Invasion Assays INCUCYTE LIVE-CELL ANALYSIS SYSTEM. Real-time automated measurements of cell motility inside your incubator
 Cell Migration and Invasion Assays INCUCYTE LIVE-CELL ANALYSIS SYSTEM Real-time automated measurements of cell motility inside your incubator See the whole story Real-time cell motility visualization and
Figure S1. ERBB3 mrna levels are elevated in Luminal A breast cancers harboring ERBB3
 Supplemental Figure Legends. Figure S1. ERBB3 mrna levels are elevated in Luminal A breast cancers harboring ERBB3 ErbB3 gene copy number gain. Supplemental Figure S1. ERBB3 mrna levels are elevated in
EPIGENETIC RE-EXPRESSION OF HIF-2α SUPPRESSES SOFT TISSUE SARCOMA GROWTH
 EPIGENETIC RE-EXPRESSION OF HIF-2α SUPPRESSES SOFT TISSUE SARCOMA GROWTH Supplementary Figure 1. Supplementary Figure 1. Characterization of KP and KPH2 autochthonous UPS tumors. a) Genotyping of KPH2
Supplementary Figure 1. Characterization of ALDH-positive cell population in MCF-7 cells. (a) Expression level of stem cell markers in MCF-7 cells or
 Expression level of stem cell markers in MCF-7 cells or") Supplementary Figure 1. Characterization of ALDH-positive cell population in MCF-7 cells. (a) Expression level of stem cell markers in MCF-7 cells or ALDH-positive cell population by qpcr. Data represent
Supplementary Figure 1. Characterization of ALDH-positive cell population in MCF-7 cells. (a) Expression level of stem cell markers in MCF-7 cells or ALDH-positive cell population by qpcr. Data represent
Supplemental Figure S1A Notch1
 Supplemental Figure S1A Notch1 erage) epth of Cove ormalized De Log1(No Notch exons Figure S1: A) Relative coverage of Notch1 and Notch 2 exons in HCC2218, HCC1187, MB157, MDA-MB157 cell lines. Blue color