Loss of protein association causes cardiolipin degradation in Barth syndrome
|
|
|
- Paulina Rodgers
- 5 years ago
- Views:
Transcription
1 SUPPLEMENTARY INFORMATION Loss of protein association causes cardiolipin degradation in Barth syndrome Yang Xu 1, Colin K.L. Phoon 2, Bob Berno 5, Kenneth D Souza 6, Esthelle Hoedt 4, Guoan Zhang 4, Thomas A. Neubert 4, Richard M. Epand 5, 6, Mindong Ren 1, 3 1, 3*, and Michael Schlame 1 Department of Anesthesiology, 2 Department of Pediatrics, 3 Department of Cell Biology, and 4 Kimmel Center for Biology and Medicine at the Skirball Institute and Department of Biochemistry and Molecular Pharmacology, New York University School of Medicine, New York, New York 10016, USA and 5 Department of Chemistry and 6 Department of Biochemistry and Biomedical Sciences, McMaster University, Hamilton, Ontario L8S 4K1, Canada 1
2 SUPPLEMENTARY RESULTS Supplementary Table 1. BTHS increases the acyl turnover of CL in human lymphoblasts a Phospholipid species PC 36:2 PE 36:2 PE 38:2 PI 36:1 PI 36:2 Control k (10-3 h -1 ) 200±4 80±8 100±12 172±9 191±18 t h (h) BTHS k (10-3 h -1 ) 249±11 125±7 104±13 285±8 307±29 t h (h) CL 70:3 CL 70:4 CL 72:6 CL 72:7 CL 74:7 37±3 27±5 40± ±16 151±18 149± a Rate constants with standard errors (k) and half-life times (t h ) were estimated from q values in Fig. 1c by non-linear regression. 2
3 Supplementary Table P-NMR spectroscopy reveals motional restriction of CL but not of PC, PE, and MLCL a Source of mitochondria Mouse liver Genotype Detergent N Signal intensity (Percent of total 31 P signal) Wild-type Digitonin SDS 5 4 PC PE CL MLCL 28±3 12±1 0±0 0±0 37±5 14±3 5±1 0±0 Mouse kidney Wild-type Digitonin SDS ±2 24±2 15±2 21±2 0±0 4±1 0±0 0±0 TAZKD Digitonin SDS ±3 25±4 19±1 28±1 0±0 5±1 1.2± ±0.2 Human lymphoblast Control Digitonin SDS BTHS Digitonin SDS a Membranes were prepared from mitochondria and solubilized with digitonin or SDS. 31 P-NMR spectra were acquired in a 700 MHz instrument equipped with a cryoprobe; the signals of individual phospholipids were quantified. In the presence of SDS, all phospholipids (PC, PE, CL, MLCL) produced resolvable signals. In the presence of digitonin, only PC, PE, and MLCL were detectable. Data are mean values with SEM of the indicated number of replicates (N). 3

4 Supplementary Figure 1. Tafazzin deficiency increases the glycerol turnover of CL. Mouse embryonic fibroblasts were grown in the presence of D-[U- 13 C 6 ]-glucose for 2 days, after which the medium was switched to unlabeled glucose. Lipids were extracted at different time points and analyzed by MS. (a) Spectra acquired during the labeling period show an increase of signals corresponding to CL 70:4 isotopomers with 1, 2, and 3 labeled glycerols. The equation shows the relation between spectral intensities (n i, m i ), the fraction of labeled precursor (p) and the fraction of newly synthesized CL 70:4 (q) in the cells. (b) The fractional synthesis (q) of CL and MLCL species rose and vanished faster in tafazzin knock-out cells (ΔTAZ) than in wild-type cells (WT). The intracellular proportion of labeled precursor (p) was similar in both cell lines. Data are mean values with SEM (N=3). 4
 Mitochondria were isolated from lymphoblasts of BTHS patients and sub-fractionated by Percoll density gradient centrifugation into high-density mitochondria (H), low-density mitochondria (L), and")
5 Supplementary Figure 2. CL but not MLCL is associated with proteins. (a) Mitochondria were isolated from lymphoblasts of BTHS patients and sub-fractionated by Percoll density gradient centrifugation into high-density mitochondria (H), low-density mitochondria (L), and mitochondria-associated membranes (MAM). The MLCL/CL ratios were higher in low-density mitochondria than in high-density mitochondria (P<0.004, paired t-test) and in MAM (P<0.002, paired t-test). Data are means with SEM (N=3). Mitochondria were also treated with different amounts of digitonin followed by centrifugation at 100,000 g. The MLCL/CL ratios were determined in the non-solubilized pellets. Digitonin solubilized MLCL more readily than CL, 5
6 resulting in a concentration-dependent decrease of the MLCL/CL ratio in the pellets (P<0.001, ANOVA). Data are mean values with ranges of duplicate determinations. (b) Mouse liver mitochondria (20 mg protein per sample) were incubated in hypotonic medium (15 mm Tris, ph 7.4) for 30 min. Membranes were re-collected by centrifugation (39,000 g, 15 min) and solubilized with either digitonin (3 g/g protein) or SDS (1.5 g/g protein). Static 31 P-NMR spectra of the samples (volume 0.6 ml) were acquired on a 700 MHz spectrometer equipped with a cryo-probe. In the presence of SDS, 31 P signals of the major mitochondrial phospholipids PC, PE, and CL were detectable. In the presence of digitonin, the CL signal was not detectable because of line broadening, which indicates tight protein association. (c) Mitochondria were isolated from liver and kidney of TAZKD mice, solubilized with n-dodecyl β-d-maltoside (DDM, 2.5 g/g protein) and loaded on a sucrose density gradient. The gradient was spun for 20 hours at 158,000 g at 4 C and fractions were analyzed by MS. The MLCL/CL ratio decreased from low to high density (P<0.005 for liver; P<0.02 for kidney, ANOVA). Data are means with SEM (N=3). 6
 and harvested in the logarithmic (log) or stationary (stat) phase of")
. Logarithmic growth increased the MLCL/CL ratio under starvation condition (**P<0.01).")
7 Supplementary Figure 3. The MLCL/CL ratio is reduced by stationary growth, bezafibrate, and resveratrol. Lymphoblasts from BTHS patients were cultured in normal medium or in starvation medium (starv, 3% fetal bovine serum) and harvested in the logarithmic (log) or stationary (stat) phase of growth. Lipids were analyzed by MS to determine the MLCL/CL ratios of corresponding molecular species (CL-MLCL pairs formed by loss of 18:1 or 16:0). Starvation increased the MLCL/CL ratio in the logarithmic growth phase (*P<0.05). Logarithmic growth increased the MLCL/CL ratio under starvation condition (**P<0.01). Treatment with 400 µm bezafibrate (BZF) or 40 µm resveratrol (RSV) decreased the MLCL/CL ratio (***P<0.001). Data (means±s.e.m., N=3) were analyzed by t-test. 7

8 Supplementary Figure 4. Resveratrol stabilizes CL. (a) BTHS lymphoblasts were cultured ±40 µm resveratrol (RSV) for 36 hours. The fractional synthesis of CL and MLCL was estimated from the 13 C labeling pattern after incubation with D-[U- 13 C 6 ]-glucose for 24 hours. RSV decreased the fractional synthesis of CL (P<0.01) and MLCL (P<0.003). Data (mean values with SEM, N=3) were analyzed by t-test. (b) BTHS lymphoblasts were incubated with D-[U- 13 C 6 ]-glucose. The MLCL/CL ratio (upper graphs) and the proportion of old and newly synthesized CL and MLCL (lower graphs) were determined by MS. Upon addition of RSV (40 μm), the MLCL/CL ratio decreased over 24 hours. This transition was caused by the stabilization of preexisting CL. Upon withdrawal of RSV, the MLCL/CL ratio returned to the pre-rsv level within 24 hours. This transition was caused by rapid clearance of preexisting CL. 8

9 9

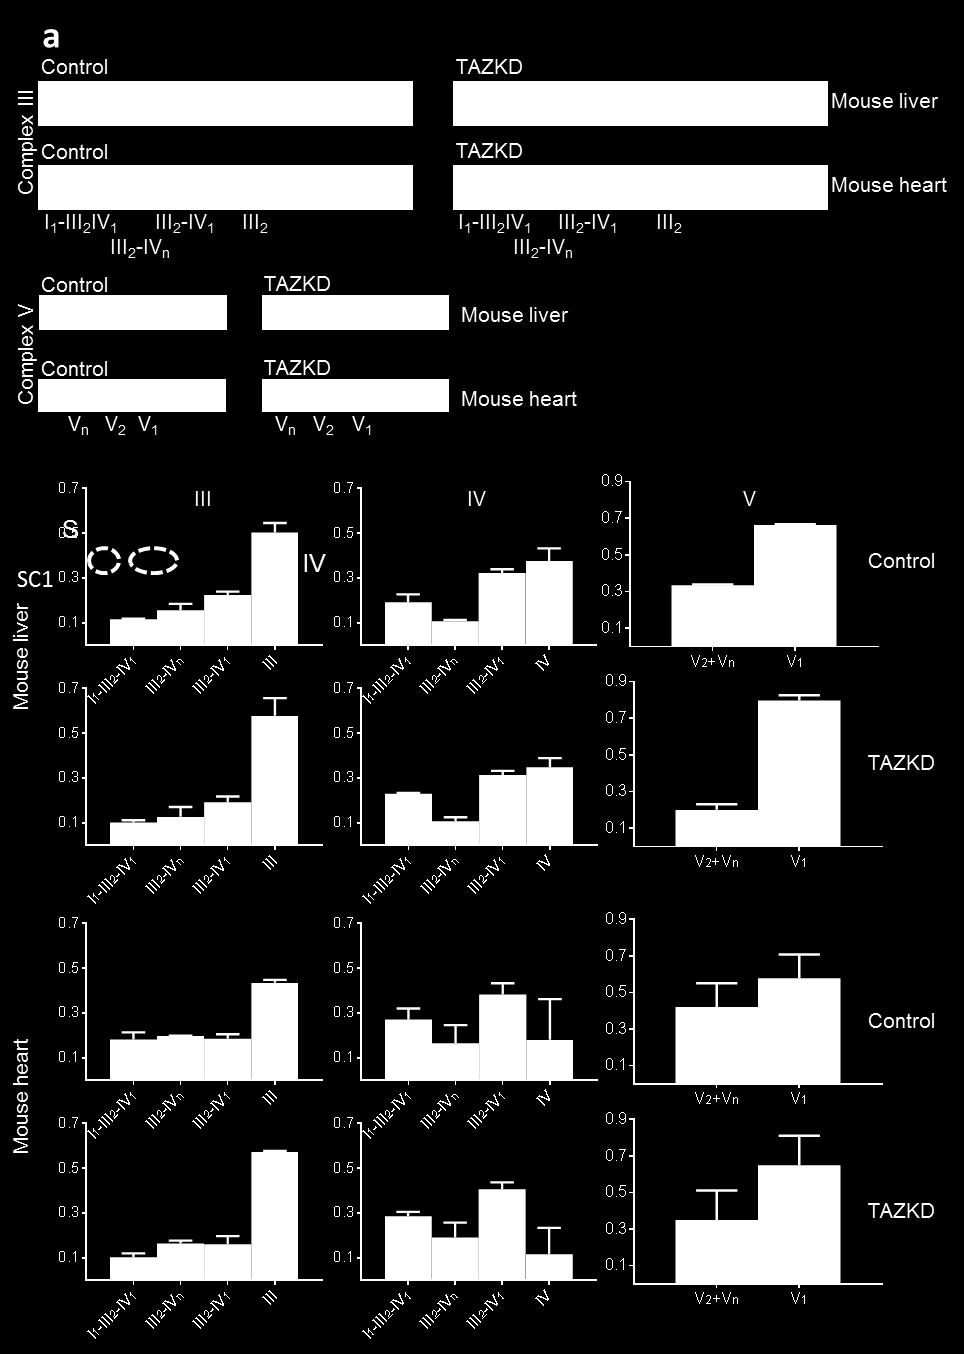
10 Supplementary Figure 5. Tafazzin deficiency affects supercomplexes. (a) Mitochondria were isolated from liver and heart of TAZKD mice and controls. Mitochondria were solubilized with digitonin and separated by 2D-Blue Native/SDS-PAGE followed by quantitative Western Blot analysis with the LiCor system, using fluorescent secondary antibodies. The primary antibodies recognized UQCRC2 (complex III), MtCO1 (complex IV), and F1α (complex V). Data are mean values with ranges from 2 experiments. Tafazzin knockdown reduced the supercomplexassociated portion of complex III and V. (b) Mitochondria were isolated from human lymphoblasts of BTHS patients and controls. The distribution of the ADP-ATP carrier (ANT1) was analyzed by 2D-Blue Native/SDS-PAGE as above. The positions of molecular weight markers are indicated (masses in kda). The carrier was found in 4 regions of the gel. BTHS increased the proportion of the ADP-ATP carrier recovered below 100 kda from 24±2% to 33±3%. Data are mean values with ranges from 2 experiments. (c) Human lymphoblasts were cultured ± exogenous oleic acid (18:1) for 4 days. Mitochondria were isolated and analyzed by 2D-Blue Native/SDS-PAGE followed by Western Blot analysis. BTHS reduced the supercomplexassociated portion of complex III and V, which was partially reversed by oleic acid. 10
 Mitochondrial membranes were isolated from normal lymphoblasts, solubilized with digitonin, and separated by sucrose density gradient centrifugation.")
11 Supplementary Figure 6. CL is enriched in the supercomplex fraction. (a) Mitochondrial membranes were isolated from normal lymphoblasts, solubilized with digitonin, and separated by sucrose density gradient centrifugation. Protein concentration was measured and 1D-Blue Native PAGE was performed in the 5 gradient fractions. Protein complexes were recovered in fraction 4, and supercomplexes (SC) in fraction 5. Lipids were analyzed by MS; CL was recovered in fractions 4 and 5; PC and PE were recovered in fractions 3-5. (b) The same experiment was done with BTHS lymphoblasts treated ±40 µm resveratrol (RSV) for 24 hrs. RSV treatment increased the proportion of CL in fraction 5 but did not alter the distribution of PC and PE. (c) The molecular species composition of CL was identical in fractions 4 and 5. All experiments were performed in triplicates. Data are mean values with SEM (* P<0.001, t-test). 11
12 Supplementary Figure 7. 3-Bromopyruvate increases the relative abundance of mitochondrial proteins. Normal lymphoblasts were cultured in SILAC medium containing either light or heavylabeled amino acids. Each culture was divided in two aliquots one of which was treated with 80 µm 3-bromopyruvate for 5 hrs. Subsequently, two SILAC proteomics analyses were performed. For the forward analysis, heavy-labeled treated and light-labeled untreated cells were mixed in equal proportions and for the reverse analysis, heavy-labeled untreated and light-labeled treated cells were mixed in equal proportions. The graph shows a histogram of the lymphoblast proteome, in which mitochondrial proteins are shown in red bars and non-mitochondrial proteins in open bars. 3-Bromopyruvate treatment induced an about 1.7-fold increase in the relative abundance of mitochondrial proteins. The SILAC ratios of the identified subunits of complexes I, III, IV, and V are indicated above the histogram. The raw MS files are accessible through the link ftp://massive.ucsd.edu/msv /raw/barth_syndrome/. 12

13 13
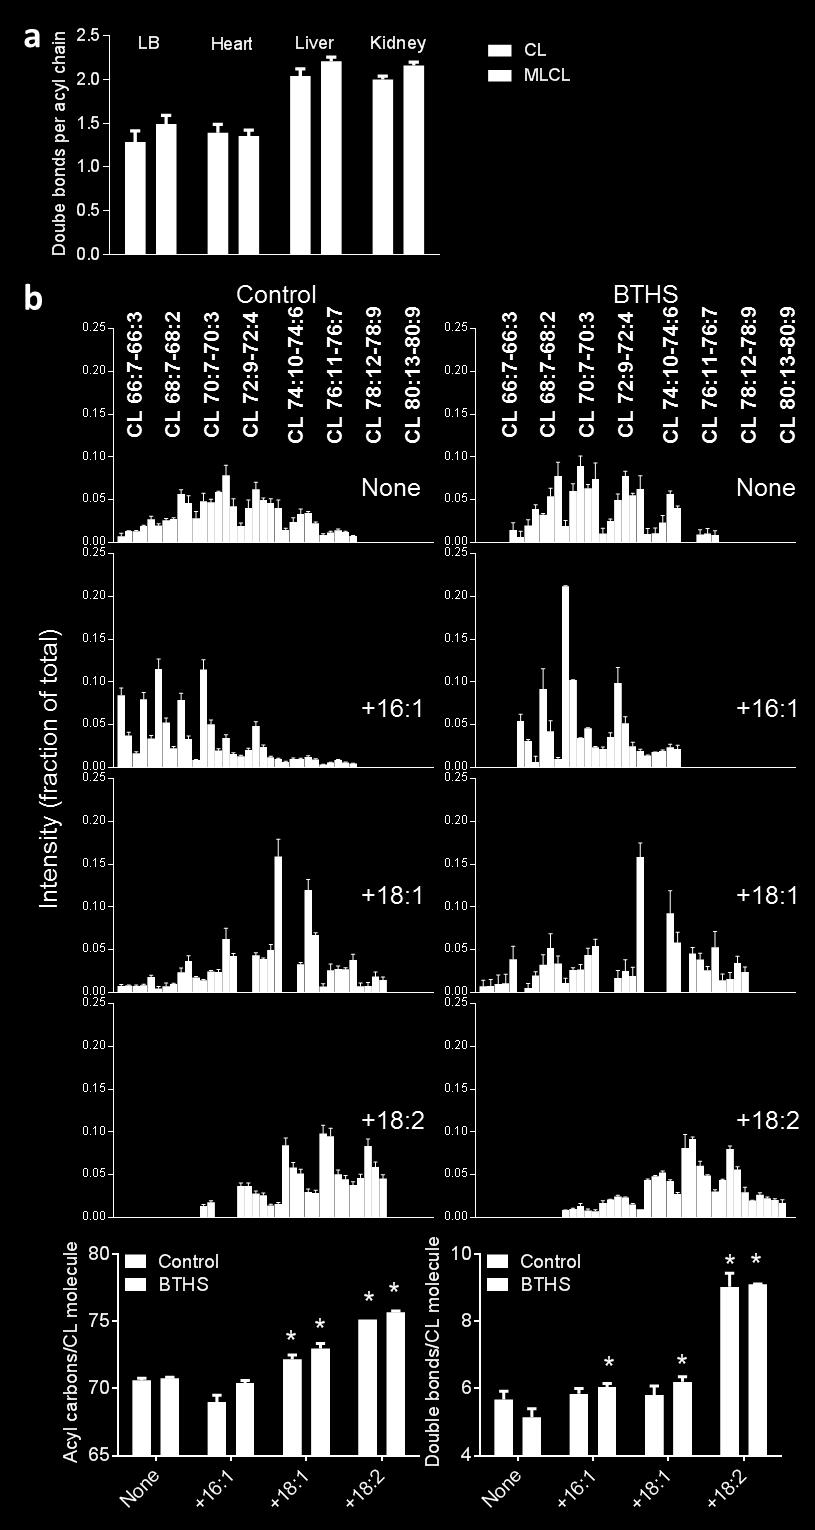
14 Supplementary Figure 8. Exogenous fatty acids alter the molecular composition of CL. (a) CL and MLCL were analyzed in lymphoblasts of BTHS patients and in heart, liver and kidney of TAZKD mice. The average number of double bonds per acyl chain was similar in CL and MLCL. Data are mean values with SEM (N=4). (b) Human lymphoblasts were grown in the presence of 0.1 mm palmitoleic acid (16:1), oleic acid (18:1), or linoleic acid (18:2) for 4 days. The molecular composition of CL was determined by MS. Data (means with SEM, N=3) of treated samples were compared to controls by t-test (*P<0.05). All exogenous fatty acids increased the unsaturation of CL in BTHS but not in controls. 18:1 and 18:2 increased the chain length in BTHS and controls. 14
Supplementary Materials for
 www.sciencesignaling.org/cgi/content/full/7/308/ra4/dc1 Supplementary Materials for Antipsychotics Activate mtorc1-dependent Translation to Enhance Neuronal Morphological Complexity Heather Bowling, Guoan
Supplementary Materials for
 advances.sciencemag.org/cgi/content/full/3/2/e1602038/dc1 Supplementary Materials for Mitochondrial metabolic regulation by GRP78 Manoj Prasad, Kevin J. Pawlak, William E. Burak, Elizabeth E. Perry, Brendan
SUPPLEMENTARY INFORMATION
 SUPPLEMENTARY INFORMATION FOR Liver X Receptor α mediates hepatic triglyceride accumulation through upregulation of G0/G1 Switch Gene 2 (G0S2) expression I: SUPPLEMENTARY METHODS II: SUPPLEMENTARY FIGURES
Supplementary Material. Contents include:
 Supplementary Material Contents include: 1. Supplementary Figures (p. 2-7) 2. Supplementary Figure Legends (p. 8-9) 3. Supplementary Tables (p. 10-12) 4. Supplementary Table Legends (p. 13) 1 Wellen_FigS1
SUPPLEMENTARY INFORMATION
 SUPPLEMENTARY INFORMATION doi:1.138/nature9814 a A SHARPIN FL B SHARPIN ΔNZF C SHARPIN T38L, F39V b His-SHARPIN FL -1xUb -2xUb -4xUb α-his c Linear 4xUb -SHARPIN FL -SHARPIN TF_LV -SHARPINΔNZF -SHARPIN
Supplementary Materials for
 www.sciencesignaling.org/cgi/content/full/8/407/ra127/dc1 Supplementary Materials for Loss of FTO in adipose tissue decreases Angptl4 translation and alters triglyceride metabolism Chao-Yung Wang,* Shian-Sen
Figure S1. PMVs from THP-1 cells expose phosphatidylserine and carry actin. A) Flow
 Flow") SUPPLEMENTARY DATA Supplementary Figure Legends Figure S1. PMVs from THP-1 cells expose phosphatidylserine and carry actin. A) Flow cytometry analysis of PMVs labelled with annexin-v-pe (Guava technologies)
SUPPLEMENTARY DATA Supplementary Figure Legends Figure S1. PMVs from THP-1 cells expose phosphatidylserine and carry actin. A) Flow cytometry analysis of PMVs labelled with annexin-v-pe (Guava technologies)
SUPPLEMENTAL DATA AGING, April 2013, Vol.5 No.4
 SUPPLEMENTAL DATA Figure S1. Under CR conditions, the atg32δ mutation elevates the extent of oxidative damage to proteins. WT and atg32δ strains were cultured in the nutrient rich YP medium initially containing
6. TNF-α regulates oxidative stress, mitochondrial function and autophagy in neuronal cells
 6. TNF-α regulates oxidative stress, mitochondrial function and autophagy in neuronal cells 6.1 TNF-α induces mitochondrial oxidative stress in SH-SY5Y cells. The dysregulation of mitochondria and oxidative
Nature Medicine: doi: /nm.4078
 Supplementary Figure 1. Cetuximab induces ER stress response in DiFi cells. (a) Scheme of SILAC proteome. (b) MS-base read out of SILAC experiment. The histogram of log 2 -transformed normalized H/L ratios
Supplemental Information for: Localization of anionic phospholipids in Escherichia coli cells
 Supplemental Information for: Localization of anionic phospholipids in Escherichia coli cells Piercen M. Oliver, a John A. Crooks, a Mathias Leidl, b Earl J. Yoon, a Alan Saghatelian, b and Douglas B.
Biosynthesis of Fatty Acids
 Biosynthesis of Fatty Acids Fatty acid biosynthesis takes place in the cytosol rather than the mitochondria and requires a different activation mechanism and different enzymes and coenzymes than fatty
BIOLOGICAL MOLECULES REVIEW-UNIT 1 1. The factor being tested in an experiment is the A. data. B. variable. C. conclusion. D. observation. 2.
 BIOLOGICAL MOLECULES REVIEW-UNIT 1 1. The factor being tested in an experiment is the A. data. B. variable. C. conclusion. D. observation. 2. A possible explanation for an event that occurs in nature is
Supplementary Figure 1
 Supplementary Figure 1 A B mir-141, human cell lines mir-2c, human cell lines mir-141, hepatocytes mir-2c, hepatocytes Relative RNA.1.8.6.4.2 Relative RNA.3.2.1 Relative RNA 1.5 1..5 Relative RNA 2. 1.5
ALLOSTERIC REGULATION OF GPCR ACTIVITY BY PHOSPHOLIPIDS
 Supplementary Information ALLOSTERIC REGULATION OF GPCR ACTIVITY BY PHOSPHOLIPIDS Rosie Dawaliby 1, Cataldo Trubbia 1, Cédric Delporte 3,4, Matthieu Masureel 2, Pierre Van Antwerpen 3,4, Brian K. Kobilka
m 6 A mrna methylation regulates AKT activity to promote the proliferation and tumorigenicity of endometrial cancer
 SUPPLEMENTARY INFORMATION Articles https://doi.org/10.1038/s41556-018-0174-4 In the format provided by the authors and unedited. m 6 A mrna methylation regulates AKT activity to promote the proliferation
7/11/17. Cell Function & Chemistry. Molecular and Cellular Biology. 2. Bio-Chemical Foundations & Key Molecules of a Cell
 Molecular and Cellular Biology Cell Function & Chemistry 2. Bio-Chemical Foundations & Key Molecules of a Cell Prof. Dr. Klaus Heese Interaction Molecular Bonds Define Cellular Functions Water H 2 O Interactions
a b G75 G60 Sw-2 Sw-1 Supplementary Figure 1. Structure predictions by I-TASSER Server.
 a b G75 2 2 G60 Sw-2 Sw-1 Supplementary Figure 1. Structure predictions by I-TASSER Server. a. Overlay of top 10 models generated by I-TASSER illustrates the potential effect of 7 amino acid insertion
Quantification of PtdInsP 3 molecular species in cells and tissues by mass spectrometry
 Nature Methods Quantification of PtdInsP 3 molecular species in cells and tissues by mass spectrometry Jonathan Clark, Karen E Anderson, Veronique Juvin, Trevor S Smith, Fredrik Karpe, Michael J Wakelam,
CHY2026: General Biochemistry. Lipid Metabolism
 CHY2026: General Biochemistry Lipid Metabolism Lipid Digestion Lipid Metabolism Fats (triglycerides) are high metabolic energy molecules Fats yield 9.3 kcal of energy (carbohydrates and proteins 4.1 kcal)
The building blocks for this molecule are A) amino acids B) simple sugars C) fats D) molecular bases
 amino acids B) simple sugars C) fats D) molecular bases") 1. Base your answer to the following question on the diagram below and on your knowledge of biology. The diagram represents a portion of a starch molecule. The building blocks for this molecule are A)
1. Base your answer to the following question on the diagram below and on your knowledge of biology. The diagram represents a portion of a starch molecule. The building blocks for this molecule are A)
Supplementary Figure 1
 Supplementary Figure 1 Supplementary Figure 1 Schematic depiction of the tandem Fc GDF15. Supplementary Figure 2 Supplementary Figure 2 Gfral mrna levels in the brains of both wild-type and knockout Gfral
Supplementary material: Materials and suppliers
 Supplementary material: Materials and suppliers Electrophoresis consumables including tris-glycine, acrylamide, SDS buffer and Coomassie Brilliant Blue G-2 dye (CBB) were purchased from Ameresco (Solon,
Supplementary Figure 1.
 Supplementary Figure 1. Visualization of endoplasmic reticulum-mitochondria interaction by in situ proximity ligation assay. A) Illustration of targeted proteins in mitochondria (M), endoplasmic reticulum
Mass-Spectrometric Analysis of Lipids (Lipidomics)
") Mass-Spectrometric Analysis of Lipids (Lipidomics) 1. Identification 2. Quantification 3. Metabolism Why to do lipidomics? Biology: Functions of different lipids? Medicine: Diagnostics and Therapy Industry:
Mass-Spectrometric Analysis of Lipids (Lipidomics) 1. Identification 2. Quantification 3. Metabolism Why to do lipidomics? Biology: Functions of different lipids? Medicine: Diagnostics and Therapy Industry:
Mouse model of human Barth syndrome
 Mouse model of human Barth syndrome Zaza Khuchua, PhD Cincinnati Children s Research Foundation Cincinnati, OH, USA Barry J. Byrne, MD, PhD University of Florida Department of Pediatrics Gainesville, FL,
Supplementary Figure 1
 Supplementary Figure 1 6 HE-50 HE-116 E-1 HE-108 Supplementary Figure 1. Targeted drug response curves of endometrial cancer cells. Endometrial cancer cell lines were incubated with serial dilutions of
ANSC/NUTR 618 Lipids & Lipid Metabolism
 I. Overall concepts A. Definitions ANC/NUTR 618 Lipids & Lipid Metabolism 1. De novo synthesis = synthesis from non-fatty acid precursors a. Carbohydrate precursors (glucose, lactate, and pyruvate) b.
Fatty Acid and Triacylglycerol Metabolism 1
 Fatty Acid and Triacylglycerol Metabolism 1 Mobilization of stored fats and oxidation of fatty acids Lippincott s Chapter 16 What is the first lecture about What is triacylglycerol Fatty acids structure
The Role of LCPUFA in Obesity. M.Tom Clandinin. The Alberta Institute for Human Nutrition The University of Alberta Edmonton, Alberta, Canada
 The Role of LCPUFA in Obesity by M.Tom Clandinin The Alberta Institute for Human Nutrition The University of Alberta Edmonton, Alberta, Canada How big is the Conceptual Problem? Some assumptions: 150lb
Supplementary Figure 1. Comparative analysis of thermal denaturation of enzymatically
 Supplementary Figures Supplementary Figure 1. Comparative analysis of thermal denaturation of enzymatically synthesized polyubiquitin chains of different length. a, Differential scanning calorimetry traces
The Mycobacterium tuberculosis MmpL11 cell wall lipid transporter is important for
 Supplemental materials The Mycobacterium tuberculosis MmpL11 cell wall lipid transporter is important for biofilm formation, intracellular growth and non-replicating persistence Catherine C. Wright, 1
Expression constructs
 Gene expressed in bebe3 ZmBEa Expression constructs 35S ZmBEa Pnos:Hygromycin r 35S Pnos:Hygromycin r 35S ctp YFP Pnos:Hygromycin r B -1 Chl YFP- Merge Supplemental Figure S1: Constructs Used for the Expression
Supplementary Figure 1. Overview of steps in the construction of photosynthetic protocellular systems
 Supplementary Figure 1 Overview of steps in the construction of photosynthetic protocellular systems (a) The small unilamellar vesicles were made with phospholipids. (b) Three types of small proteoliposomes
Suppl. Figure 1. T 3 induces autophagic flux in hepatic cells. (A) RFP-GFP-LC3 transfected HepG2/TRα cells were visualized and cells were quantified
 RFP-GFP-LC3 transfected HepG2/TRα cells were visualized and cells were quantified") Suppl. Figure 1. T 3 induces autophagic flux in hepatic cells. (A) RFP-GFP-LC3 transfected HepG2/TRα cells were visualized and cells were quantified for RFP-LC3 puncta (red dots) representing both autolysosomes
Suppl. Figure 1. T 3 induces autophagic flux in hepatic cells. (A) RFP-GFP-LC3 transfected HepG2/TRα cells were visualized and cells were quantified for RFP-LC3 puncta (red dots) representing both autolysosomes
D CD8 T cell number (x10 6 )
") IFNγ Supplemental Figure 1. CD T cell number (x1 6 ) 18 15 1 9 6 3 CD CD T cells CD6L C CD5 CD T cells CD6L D CD8 T cell number (x1 6 ) 1 8 6 E CD CD8 T cells CD6L F Log(1)CFU/g Feces 1 8 6 p
IFNγ Supplemental Figure 1. CD T cell number (x1 6 ) 18 15 1 9 6 3 CD CD T cells CD6L C CD5 CD T cells CD6L D CD8 T cell number (x1 6 ) 1 8 6 E CD CD8 T cells CD6L F Log(1)CFU/g Feces 1 8 6 p
Abnormalities of Intermediary Metabolism in Barth Syndrome
 Abnormalities of Intermediary Metabolism in Barth Syndrome Richard I. Kelley, M.D., Ph.D. Kennedy Krieger Institute Department of Pediatrics Johns Hopkins University Is Barth Syndrome a Mitochondrial Disease?
Aggregated neutrophil extracellular traps limit inflammation by degrading cytokines and chemokines
 CORRECTION NOTICE Nat. Med. doi:10.1038/nm.3547; corrected online 25 August 2014 Aggregated neutrophil extracellular traps limit inflammation by degrading cytokines and chemokines Christine Schauer, Christina
Supplemental Materials. STK16 regulates actin dynamics to control Golgi organization and cell cycle
 Supplemental Materials STK16 regulates actin dynamics to control Golgi organization and cell cycle Juanjuan Liu 1,2,3, Xingxing Yang 1,3, Binhua Li 1, Junjun Wang 1,2, Wenchao Wang 1, Jing Liu 1, Qingsong
ABSTRACT INTRODUCTION
 /, 2017, Vol. 8, (No. 19), pp: 30672-30691 Specific changes in mitochondrial lipidome alter mitochondrial proteome and increase the geroprotective efficiency of lithocholic acid in chronologically aging
Student name ID # 2. (4 pts) What is the terminal electron acceptor in respiration? In photosynthesis?
 What is the terminal electron acceptor in respiration? In photosynthesis?") 1. Membrane transport. A. (4 pts) What ion couples primary and secondary active transport in animal cells? What ion serves the same function in plant cells? 2. (4 pts) What is the terminal electron acceptor
1. Membrane transport. A. (4 pts) What ion couples primary and secondary active transport in animal cells? What ion serves the same function in plant cells? 2. (4 pts) What is the terminal electron acceptor
Summary of fatty acid synthesis
 Lipid Metabolism, part 2 1 Summary of fatty acid synthesis 8 acetyl CoA + 14 NADPH + 14 H+ + 7 ATP palmitic acid (16:0) + 8 CoA + 14 NADP + + 7 ADP + 7 Pi + 7 H20 1. The major suppliers of NADPH for fatty
Helen Kim, Ph.D. and John Cutts. Dept of Pharmacology & Toxicology University of Alabama at Birmingham
 Understanding the actions of a dietary anti-oxidant at the protein and small molecule level using top-down proteomics, enzyme assays and mass spectrometry elen Kim, Ph.D. and John Cutts Mar 9, 2012 UAB
From Atoms to Cells: Fundamental Building Blocks. Models of atoms. A chemical connection
 From Atoms to Cells: A chemical connection Fundamental Building Blocks Matter - all materials that occupy space & have mass Matter is composed of atoms Atom simplest form of matter not divisible into simpler
How do we retain emphasis on function?
 Systems Biology Systems biology studies biological systems by systematically perturbing them (biologically, genetically, or chemically); monitoring the gene, protein, and informational pathway responses;
Nature Immunology: doi: /ni Supplementary Figure 1
 Supplementary Figure 1 Fatty acid oxidation is emphasized in 1 macrophages compared with that in macrophages. Gene expression of mitochondrial OXPHOS (Atp5j, Cox4i1, Uqcrc1/2, Ndufs1, Sdhb) and β-oxidation
Fatty Acid and Triacylglycerol Metabolism 1
 Fatty Acid and Triacylglycerol Metabolism 1 Mobilization of stored fats and oxidation of fatty acids Lippincott s Chapter 16 What is the first lecture about What is triacylglycerol Fatty acids structure
The Structure and Function of Biomolecules
 The Structure and Function of Biomolecules The student is expected to: 9A compare the structures and functions of different types of biomolecules, including carbohydrates, lipids, proteins, and nucleic
Nature Structural & Molecular Biology: doi: /nsmb Supplementary Figure 1. Generation and validation of mtef4-knockout mice.
 Supplementary Figure 1 Generation and validation of mtef4-knockout mice. (a) Alignment of EF4 (E. coli) with mouse, yeast and human EF4. (b) Domain structures of mouse mtef4 compared to those of EF4 (E.
Zool 3200: Cell Biology Exam 1 1/30/15
 Name: TRASK Zool 3200: Cell Biology Exam 1 1/30/15 Answer each of the following short- and long- answer questions in the space provided; circle the BEST answer or answers for each of the multiple choice
Tala Saleh. Razi Kittaneh ... Nayef Karadsheh
 Tala Saleh Razi Kittaneh... Nayef Karadsheh β-oxidation of Fatty Acids The oxidation of fatty acids occurs in 3 steps: Step 1: Activation of the Fatty acid FA + HS-CoA + ATP FA-CoA + AMP + PPi - The fatty
N α -Acetylation of yeast ribosomal proteins and its effect on protein synthesis
 JOURNAL OF PROTEOMICS 74 (2011) 431 441 available at www.sciencedirect.com www.elsevier.com/locate/jprot N α -Acetylation of yeast ribosomal proteins and its effect on protein synthesis Masahiro Kamita
McWilliams et al., http :// /cgi /content /full /jcb /DC1
 Supplemental material JCB McWilliams et al., http ://www.jcb.org /cgi /content /full /jcb.201603039 /DC1 THE JOURNAL OF CELL BIOLOGY Figure S1. In vitro characterization of mito-qc. (A and B) Analysis
The rabbit femoral artery was prepared and each arterial ring was permeabilized
 Online Supplement Nakmura et al. cgmp-dependent relaxation of smooth muscle Materials and Methods Measurement of tension The rabbit femoral artery was prepared and each arterial ring was permeabilized
Supplementary Materials for
 www.sciencesignaling.org/cgi/content/full/6/278/rs11/dc1 Supplementary Materials for In Vivo Phosphoproteomics Analysis Reveals the Cardiac Targets of β-adrenergic Receptor Signaling Alicia Lundby,* Martin
Supplemental Information. Inhibition of the Proteasome b2 Site Sensitizes. Triple-Negative Breast Cancer Cells
 Cell Chemical Biology, Volume 24 Supplemental Information Inhibition of the Proteasome b2 Site Sensitizes Triple-Negative Breast Cancer Cells to b5 Inhibitors and Suppresses Nrf1 Activation Emily S. Weyburne,
SUPPLEMENTARY INFORMATION
 doi:10.1038/nature12652 Supplementary Figure 1. PRDM16 interacts with endogenous EHMT1 in brown adipocytes. Immunoprecipitation of PRDM16 complex by flag antibody (M2) followed by Western blot analysis
Central injection of fibroblast growth factor 1 induces sustained remission of diabetic hyperglycemia in rodents
 Central injection of fibroblast growth factor 1 induces sustained remission of diabetic hyperglycemia in rodents Jarrad M Scarlett 1,,1, Jennifer M Rojas 1,1, Miles E Matsen 1, Karl J Kaiyala 3, Darko
Supplementary Figure 1
 Supplementary Figure 1 how HFD how HFD Epi WT p p Hypothalamus p p Inguinal WT T Liver Lean mouse adipocytes p p p p p p Obese mouse adipocytes Kidney Muscle Spleen Heart p p p p p p p p Extracellular
7SK ChIRP-seq is specifically RNA dependent and conserved between mice and humans.
 Supplementary Figure 1 7SK ChIRP-seq is specifically RNA dependent and conserved between mice and humans. Regions targeted by the Even and Odd ChIRP probes mapped to a secondary structure model 56 of the
SUPPLEMENTARY INFORMATION
 DOI: 10.1038/ncb3311 A B TSC2 -/- MEFs C Rapa Hours WCL 0 6 12 24 36 pakt.s473 AKT ps6k S6K CM IGF-1 Recipient WCL - + - + - + pigf-1r IGF-1R pakt ps6 AKT D 1 st SILAC 2 nd SILAC E GAPDH FGF21 ALKPGVIQILGVK
Cardiac-specific succinate dehydrogenase deficiency in Barth syndrome
 Research Article Cardiac-specific succinate dehydrogenase deficiency in Barth syndrome Jan Dudek 1, I-Fen Cheng 1,2, Arpita Chowdhury 1, Katharina Wozny 3, Martina Balleininger 1, Robert Reinhold 1, Silke
Supplementary Information. Supplementary Figures
 Supplementary Information Supplementary Figures Supplementary Figure 1: Mutational analysis of the ADP-based coupled ATPase-AK activity. (a) Proposed model for the coupled ATPase/AK reaction upon addition
Nature Neuroscience: doi: /nn Supplementary Figure 1. Large-scale calcium imaging in vivo.
 Supplementary Figure 1 Large-scale calcium imaging in vivo. (a) Schematic illustration of the in vivo camera imaging set-up for large-scale calcium imaging. (b) High-magnification two-photon image from
Supplementary Figure 1. Deletion of Smad3 prevents B16F10 melanoma invasion and metastasis in a mouse s.c. tumor model.
 A B16F1 s.c. Lung LN Distant lymph nodes Colon B B16F1 s.c. Supplementary Figure 1. Deletion of Smad3 prevents B16F1 melanoma invasion and metastasis in a mouse s.c. tumor model. Highly invasive growth
2.2 Cell Construction
 2.2 Cell Construction Elemental composition of typical bacterial cell C 50%, O 20%, N 14%, H 8%, P 3%, S 1%, and others (K +, Na +, Ca 2+, Mg 2+, Cl -, vitamin) Molecular building blocks Lipids Carbohydrates
a 10 4 Link et al. Supplementary Figure 1 Nature Immunology: doi: /ni.1842 Cells per mouse ( 10 5 ) TRPV2KO anti-gr1 anti-gr anti-f4/80
 TRPV2KO anti-gr1 anti-gr anti-f4/80") a 10 4 WT 10 4 TRPV2KO 10 3 10 3 anti-gr1 10 2 10 1 anti-gr1 10 2 10 1 10 0 10 0 10 1 10 2 10 3 10 4 anti-f4/80 42.3 45.2 10 0 10 0 10 1 10 2 10 3 10 4 anti-f4/80 10 4 10 4 40 42.5 anti-cd11b 10 3 10 2
a 10 4 WT 10 4 TRPV2KO 10 3 10 3 anti-gr1 10 2 10 1 anti-gr1 10 2 10 1 10 0 10 0 10 1 10 2 10 3 10 4 anti-f4/80 42.3 45.2 10 0 10 0 10 1 10 2 10 3 10 4 anti-f4/80 10 4 10 4 40 42.5 anti-cd11b 10 3 10 2
Supplementary Materials
 Supplementary Materials Figure S1. MTT Cell viability assay. To measure the cytotoxic potential of the oxidative treatment, the MTT [3-(4,5-dimethylthiazol- 2-yl)-2,5-diphenyl tetrazolium bromide] assay
hexahistidine tagged GRP78 devoid of the KDEL motif (GRP78-His) on SDS-PAGE. This
 on SDS-PAGE. This") SUPPLEMENTAL FIGURE LEGEND Fig. S1. Generation and characterization of. (A) Coomassie staining of soluble hexahistidine tagged GRP78 devoid of the KDEL motif (GRP78-His) on SDS-PAGE. This protein was expressed
SUPPLEMENTAL FIGURE LEGEND Fig. S1. Generation and characterization of. (A) Coomassie staining of soluble hexahistidine tagged GRP78 devoid of the KDEL motif (GRP78-His) on SDS-PAGE. This protein was expressed
Molecular and Cellular Biology. 2. Bio-Chemical Foundations & Key Molecules of a Cell
 Molecular and Cellular Biology 2. Bio-Chemical Foundations & Key Molecules of a Cell Prof. Dr. Klaus Heese Cell Function & Chemistry Interaction 1 Molecular Bonds Define Cellular Functions Interactions
User s Manual and Instructions
 User s Manual and Instructions Mitochondria Activity Assay (Cytochrome C Oxidase Activity Assay) Kit Catalog Number: KC310100 Introduction Mitochondria are the eukaryotic subcellular organelles that contain
Supplementary Figure 1. Confocal immunofluorescence showing mitochondrial translocation of Drp1. Cardiomyocytes treated with H 2 O 2 were prestained
 Supplementary Figure 1. Confocal immunofluorescence showing mitochondrial translocation of Drp1. Cardiomyocytes treated with H 2 O 2 were prestained with MitoTracker (red), then were immunostained with
SUPPLEMENTARY FIGURES
 SUPPLEMENTARY FIGURES Supplementary Figure 1. (A) Left, western blot analysis of ISGylated proteins in Jurkat T cells treated with 1000U ml -1 IFN for 16h (IFN) or left untreated (CONT); right, western
WT MSD MPS-IIIA. Lysosomal ph
 7 6 Lysosomal ph 5 4 3 2 1 Supplementary figure S1. Lysosomal ph was measure in, and MPSIIIA MEFs using a Lysosensor yellow/blue-dextran (Molecular Probes) as a lysosomal ph indicator (see methods). P
Chapter 7: Membranes
 Chapter 7: Membranes Roles of Biological Membranes The Lipid Bilayer and the Fluid Mosaic Model Transport and Transfer Across Cell Membranes Specialized contacts (junctions) between cells What are the
Lecture 5: Cell Metabolism. Biology 219 Dr. Adam Ross
 Lecture 5: Cell Metabolism Biology 219 Dr. Adam Ross Cellular Respiration Set of reactions that take place during the conversion of nutrients into ATP Intricate regulatory relationship between several
Real-time imaging reveals the single steps of brain metastasis fo mation r
 Real-time imaging reveals the single steps of brain metastasis fo mation r Yvonne Kienast, Louisa von Baumgarten, Martin Fuhrmann, Wolfgang E.F. Klinkert, Roland Goldbrunner, Jochen Herms and Frank Winkler
Nature Structural & Molecular Biology: doi: /nsmb.3218
 Supplementary Figure 1 Endogenous EGFR trafficking and responses depend on biased ligands. (a) Lysates from HeLa cells stimulated for 2 min. with increasing concentration of ligands were immunoblotted
CHAPTER 4. Tryptophan fluorescence quenching by brominated lipids
 CHAPTER 4 Tryptophan fluorescence quenching by brominated lipids 102 4.1 INTRODUCTION The structure and dynamics of biological macromolecules have been widely studied with fluorescence quenching. The accessibility
Nature Biotechnology: doi: /nbt Supplementary Figure 1
 Supplementary Figure 1 The timeline of the NGAG method for extraction of N-linked glycans and glycosite-containing peptides. The timeline can be changed based on the number of samples. Supplementary Figure
Supplementary Materials for
 www.sciencesignaling.org/cgi/content/full/6/305/ra106/dc1 Supplementary Materials for Controlling Long-Term Signaling: Receptor Dynamics Determine Attenuation and Refractory Behavior of the TGF-β Pathway
Supplementary Materials for
 www.sciencesignaling.org/cgi/content/full/8/375/ra41/dc1 Supplementary Materials for Actin cytoskeletal remodeling with protrusion formation is essential for heart regeneration in Hippo-deficient mice
Cellular Pathways That Harvest Chemical Energy. Cellular Pathways That Harvest Chemical Energy. Cellular Pathways In General
 Cellular Pathways That Harvest Chemical Energy A. Obtaining Energy and Electrons from Glucose Lecture Series 12 Cellular Pathways That Harvest Chemical Energy B. An Overview: Releasing Energy from Glucose
LIPID METABOLISM. Sri Widia A Jusman Department of Biochemistry & Molecular Biology FMUI
 LIPID METABOLISM Sri Widia A Jusman Department of Biochemistry & Molecular Biology FMUI Lipid metabolism is concerned mainly with fatty acids cholesterol Source of fatty acids from dietary fat de novo
Molecular building blocks
 2.22 Cell Construction Elemental l composition of ftypical lbacterial cell C 50%, O 20%, N 14%, H 8%, P 3%, S 1%, and others (K +, Na +, Ca 2+, Mg 2+, Cl -, vitamin) Molecular building blocks Lipids Carbohydrates
MS1 and MS2 crosstalk in label free quantitation of mass spectrometry data independent acquisitions
 MS1 and MS2 crosstalk in label free quantitation of mass spectrometry data independent acquisitions MS1 528.18 +++ m/z 568.98 ++ m/z 678.34 ++ m/z MS2/SWATH June 9th, 2013 Matthew J. Rardin SIRT3 regulated
Phospholipid characterization by a TQ-MS data based identification scheme
 P-CN1716E Phospholipid characterization by a TQ-MS data based identification scheme ASMS 2017 MP-406 Tsuyoshi Nakanishi 1, Masaki Yamada 1, Ningombam Sanjib Meitei 2, 3 1 Shimadzu Corporation, Kyoto, Japan,
Effects of Cholesterol on Membranes: Physical Properties
 Effects of Cholesterol on Membranes: Physical Properties Removes gel to liquid crystal phase transition New intermediate phase called liquid ordered - ordering of the membrane lipids due to condensation
Supplemental Figure 1. Western blot analysis indicated that MIF was detected in the fractions of
 Supplemental Figure Legends Supplemental Figure 1. Western blot analysis indicated that was detected in the fractions of plasma membrane and cytosol but not in nuclear fraction isolated from Pkd1 null
Quiz 4 Review Guide Fall 2018
 Quiz 4 Review Guide Fall 2018 Major Topics: Enzyme Kinetics: o reaction rates and catalysis; transition state binding theory o Michaelis-Menten equation and interpretation o Inhibitors types and explanations
Chapter 1 Membrane Structure and Function
 Chapter 1 Membrane Structure and Function Architecture of Membranes Subcellular fractionation techniques can partially separate and purify several important biological membranes, including the plasma and
Higher Biology. Unit 2: Metabolism and Survival Topic 2: Respiration. Page 1 of 25
 Higher Biology Unit 2: Metabolism and Survival Topic 2: Respiration Page 1 of 25 Sub Topic: Respiration I can state that: All living cells carry out respiration. ATP is the energy currency of the cell
SUPPLEMENTARY INFORMATION
 DOI: 10.1038/ncb2988 Supplementary Figure 1 Kif7 L130P encodes a stable protein that does not localize to cilia tips. (a) Immunoblot with KIF7 antibody in cell lysates of wild-type, Kif7 L130P and Kif7
Physical effects underlying the transition from primitive to modern cell membranes
 Physical effects underlying the transition from primitive to modern cell membranes Itay Budin and Jack W. Szostak* *To whom correspondence should be addressed. Email: szostak@molbio.mgh.harvard.edu This
Pyruvate Alanine 0.15 *** ** ***
 SUPPLEMENTARY FIGURES Glucose ΔµM from fresh media / mg protein -1-2 -3 - -.1 -.3 -.5 Lactate Alanine Formate ΔµM from fresh media / mg protein 5 3 2 1.15.1.5.6..2.. NS-3 WT-NS G93A-NS Supplementary Figure
Fatty acids and phospholipids
 PYS 4xx Intro 2 1 PYS 4xx Intro 2 - Molecular building blocks We now describe in more detail the nomenclature and composition of several classes of compounds of relevance to the cell, including: membrane
SUPPLEMENTARY INFORMATION
 SUPPLEMENTARY INFORMATION doi:10.1038/nature13418 Supplementary Results: USP30 opposes autophagic flux In HEK-293 cells, USP30 overexpression increased basal LC3-II levels, dependent on enzymatic activity,
PHOSPHOLIPIDS METABOLISM. BY Dr. Walid Said Zaki Dr. Marwa Ali LECTURER OF BIOCHEMISTRY AND MOLECULAR BIOLOGY
 PHOSPHOLIPIDS METABOLISM BY Dr. Walid Said Zaki Dr. Marwa Ali LECTURER OF BIOCHEMISTRY AND MOLECULAR BIOLOGY 1. State the definition and classification of Phospholipids. 2. Describe the general structure
Oxidative Phosphorylation
 Electron Transport Chain (overview) The NADH and FADH 2, formed during glycolysis, β- oxidation and the TCA cycle, give up their electrons to reduce molecular O 2 to H 2 O. Electron transfer occurs through
Supplementary Figure 1. BMS enhances human T cell activation in vitro in a
 Supplementary Figure 1. BMS98662 enhances human T cell activation in vitro in a concentration-dependent manner. Jurkat T cells were activated with anti-cd3 and anti-cd28 antibody in the presence of titrated