Supporting Online Material for
|
|
|
- Chastity Mae Brown
- 6 years ago
- Views:
Transcription

1 Supporting Online Material for Rescued Tolerant CD8 T Cells Are Preprogrammed to Reestablish the Tolerant State Andrea Schietinger, Jeffrey J. Delrow, Ryan S. Basom, Joseph N. Blattman, Philip D. Greenberg* *To whom correspondence should be addressed. pgreen@u.washington.edu This PDF file includes: Materials and Methods Figs. S1 to S9 Table S1 References Published 19 January 2012 on Science Express DOI: /science
2 SUPPORTING ONLINE MATERIAL Materials and Methods Mice TCR GAG Rag2 -/-, Alb:GAG Rag2 -/-, [TCR GAG Rag2 -/- x Alb:GAG Rag2 -/- ]F1, Alb:GAG Thy.1.1, TCR GAG Thy1.1 mice have been described previously (6-8). C57BL/6 (B6) and Thy1.1 mice were purchased from The Jackson Laboratory. Il15 -/- mice were provided by Murali- Krishna Kaja. Il15 -/- mice were crossed to Alb:GAG Thy1.1 mice in our animal facility to generate Alb:GAG Il15 -/- Thy1.1 mice. Lymphopenia was induced by sublethal total body irradiation (TBI; 5.0 or 5.5Gy). The neutralizing mouse anti-il7 monoclonal antibody (M25) was a kind gift from Amgen. The antibody was administered intraperitoneally (i.p.) to lymphopenic Alb:GAG Il15 -/- Thy1.1 mice at 1mg per mouse at 2-day intervals. The treatment was initiated at the day of radiation and continued till termination of the experiment as indicated. All mice were bred and maintained in a specific pathogen-free barrier facility at the University of Washington. Experiments were performed in compliance with the University of Washington Institutional Animal Care and Use Committee regulations. Antibodies and reagents The FMuLV GAG peptide (CCLCLTVFL) was purchased from Pi Proteomics. The H2- D b /GAG-tetramer was synthesized by the Immune Monitoring Core at the Fred Hutchinson Cancer Research Center. The fluorochrome-conjugated antibodies were purchased from BD Biosciences, ebioscience and Biolegend.
3 Flow cytometric analysis Flow cytometric analysis was performed using FACSCanto and LSRII; cells were sorted using BD FACS Aria (BD Biosciences, San Jose, CA) at the Cell Analysis Facility, Department of Immunology, University of Washington. Flow data were analyzed with FlowJo7.6 (Tree Star Inc, Ashland, OR). Listeria infection Listeria monocytogenes acta, inlb strains expressing the FMuLV GAG epitope (CCLCLTVFL) (LM-GAG) or a control vector (LM-Ø) were provided by Cerus Corporation. L. monocytogenes was grown in Brain-Heart Infusion broth (Sigma). At a midlog growth phase, culture samples were measured by OD and diluted in PBS for the desired titer; mice were infected i.p. with 3x10 7 cfu of LM-GAG or LM-Ø. Adoptive T cell transfers and generation of memory T cells Tolerant CD8 + T cells were isolated from spleens of [TCR GAG Rag2 -/- x Alb:GAG Rag2 -/- ]F1 (Tolerant) mice. Unless otherwise stated, tolerant T cells were sorted for CD8/CD44 hi expression and adoptively transferred (i.v.) into normal hosts or sublethally irradiated, lymphopenic hosts one day post radiation. TCR GAG memory cells were generated by transfer of 1x10 6 naïve TCR GAG CD8 T cells (Thy1.1) into congenically-marked B6 (Thy1.2) hosts, followed by i.p. infection one day later with 3x10 7 cfu LM-GAG. Splenic CD44 hi /CD62L hi memory TCR GAG T cells were sorted at least two months post infection. BrdU labeling Beginning 72 hours before analysis, 1mg BrdU (BD Biosciences) was injected i.p. into each mouse every 24 hours for 3 doses. Splenocytes were then analyzed for BrdU incorporation.
4 Intracellular BrdU staining was performed using APC BrdU Flow Kit (BD Biosciences) as per manufacturer's protocol. Degranulation assay, intracellular cytokine staining and CFSE labeling Intracellular cytokine staining was performed using the Cytofix/Cytoperm Plus kit (BD Biosciences) per the manufacturer s instructions. Briefly, approximately 10 5 naïve, tolerant, memory, rescued or re-tolerized TCR GAG CD8 + T cells were mixed with 10 6 congenically marked splenocytes and incubated with 1μg/ml GAG peptide for 5 h at 37 C in the presence of GolgiPlug (brefeldin A). After staining for cell-surface molecules, the cells were fixed, permeabilized, and stained with antibodies to IFN- (XMG1.2) and TNF- (MP6-XT22). For measurement of cell proliferation in vivo, tolerant TCR GAG CD8 + T cells were incubated with 10 μm carboxyfluorescein succinimidyl ester (CFSE; Invitrogen) in serum-free HBSS for 15 min at 37 C. The reaction was quenched with pure FCS and the cells were washed twice with serum-free medium before transfer into indicated hosts. Microarray sample preparation (mrna and mirna) For mrna array: Replicate samples were isolated from spleens and sorted as follows: naïve (n=3; CD8/CD44 lo ), tolerant (n=3; CD8/CD44 hi ), central memory (n=3; CD8/CD90.1/CD44 hi /CD62L hi, 60 days post infection), rescued (n=4; CD8/CD90.2, 22 days post transfer into lymphopenic Alb:GAG Thy.1.1 hosts) and re-tolerized (n=2; CD8/CD90.2, 3-4 months post transfer into lymphopenic B6 Thy.1.1 hosts) TCR GAG CD8 + T cells. After sort, cells were washed twice with cold PBS and cell pellets were frozen and stored at -80 C until all samples were collected. RNA was isolated using Qiagen RNeasy Plus Mini Kit per the manufacturer s instructions and the yield was determined on a NanoDrop ND-1000 spectrophotometer (Thermo Scientific, Wilmington, DE). Samples that had an appropriate yield
5 (typically 100ng total RNA) were subsequently analyzed for RNA integrity using an Agilent 2100 Bioanalyzer (Agilent Technologies, Inc., Santa Clara, CA). RNA that was determined to be of high quality was converted to cdna and labeled for subsequent microarray analysis using the MouseRef-8v2.0 Expression BeadChip Kit (Illumina, Inc., San Diego, CA). Sample hybridization scanning and data acquisition was performed by the Genomics Shared Resource at the Fred Hutchinson Cancer Research Center. For microrna array: Replicate samples were isolated from spleens and sorted as described above; naïve (n=3; CD8/CD44 lo ), tolerant (n=3; CD8/CD44 hi ), central memory (n=3; CD8/CD90.1/CD44 hi /CD62L hi, 60 days post infection), rescued (n=3; CD8/CD90.2, 22 days post transfer into lymphopenic Alb:GAG Thy.1.1 hosts) TCR GAG CD8 + T cells. After sort, cells were washed twice with cold PBS and cell pellets were stored at -80 C until all samples were collected. Total RNA of re-tolerized T cell samples was generated at later time points for subsequent qpcr of mir-181a. Microarray data analysis The complete dataset consisting of all arrays was processed using the Bioconductor package lumi by employing quantile normalization (32). The dataset was initially filtered by flagging probes that were below a defined signal noise floor, which was calculated as the 75 th percentile of the negative control probe signals within each array. For each pair-wise comparison (using naïve as the reference), a probe was retained if at least half of the samples in at least one condition were not flagged by the intensity filter. We further filtered each pair-wise comparison through the application of a variance filter, using the shorth function of the Bioconductor package genefilter. Differential gene expression was determined using the Bioconductor package limma (33), and a false discovery rate (FDR) method was used to correct for multiple testing
6 (34). Significant differential gene expression was defined as log 2 (ratio) 1 (± 2-fold) and FDR K-means cluster analysis was performed for those genes found to be differentially expressed in one or more comparison. The normalized log 2 signal intensities were mean-centered at the probe-level and replicate samples were averaged prior to clustering. The number of clusters was selected using the figure of merit (FOM) method by Yeung et al. (35). K-means clustering and cluster number estimation were performed using the TM4 microarray software suite MultiExperimental Viewer (MeV) (36). Principal component analysis (PCA) plots were generated using Partek software version 6.4 (Partek Inc., St. Louis, MO), and probability calculations were determined using the hypergeometric distribution. Gene names were associated with GO biological process domain terms using BioMart within Ensembl (release 62). Gene set enrichment analysis (GSEA; was used to determine whether predefined gene sets show enrichment in particular T cell samples (37, 38). The microarray data have been deposited in the Gene Expression Omnibus with accession code GSE MicroRNA array profiling and analysis MicroRNA array profiling and analysis were performed by Exiqon Services, Vedbaek, Denmark. The quality of the total RNA was verified by an Agilent 2100 Bioanalyzer profile. 200 ng total RNA from sample and reference (common reference pool was generated using small amounts of all 9 individual naïve, tolerant and memory T cell samples) was labeled with Hy3 and Hy5 fluorescent label, respectively, using the mircury LNA Array power labeling kit (Exiqon, Denmark) following the procedure described by the manufacturer. The Hy3 -labeled samples and a Hy5 -labeled reference RNA sample were mixed pair-wise and hybridized to the mircury LNA array version 11.0 mmu (Exiqon, Denmark). The hybridization was
7 performed according to the mircury LNA array manual using a Tecan HS4800 hybridization station (Tecan, Austria). After hybridization the microarray slides were scanned and stored in an ozone free environment (ozone level below 2.0 ppb) in order to prevent potential bleaching of the fluorescent dyes. The mircury LNA array microarray slides were scanned using the Agilent G2565BA Microarray Scanner System (Agilent Technologies, Inc., USA) and the image analysis was carried out using the ImaGene 8.0 software (BioDiscovery, Inc., USA). The quantified signals were background corrected (Normexp with offset value 10 Ritchie et al., 2007) and normalized using the global Lowess (LOcally WEighted Scatterplot Smoothing) regression algorithm. Due to space limitations in Figure 4F the full names for mmu-mir-466 and mmu-mir-297 are mmu-mir-466a-3p/mmu-mir-466b-3p/mmu-mir-466c-3p/m and mmu-mir- 297a*/mmu-miR-297b-3p/mmu-miR-297c* respectively. microrna real-time qpcr: All microrna real-time qpcr experiments were performed by Exiqon Services, Vedbaek, Denmark. 10ng total RNA was reverse transcribed in 10 µl reactions using the mircury LNA Universal RT microrna PCR, Polyadenylation and cdna synthesis kit (Exiqon); each sample was processed in triplicates. cdna was diluted 100 x and 4 μl was used in 10 μl PCR reactions according to the protocol for mircury LNA Universal RT microrna PCR; each microrna was assayed once by qpcr in triplicate cdna. The amplification was performed in a LightCycler 480 Real-Time PCR System (Roche) in 384 well plates. Expression of mir-181a was normalized to mir-34a and mir-let7a. LNATM PCR primer sets for mir-181a: Exiqon Cat.no Data pre-processing: The LightCycler 480 software was used to determine the Cp value, and to generate amplification- and melting curves. LinRegPCR (ver 11.5) software was used to determine the amplification efficiency. The average amplification efficiency was used to correct
8 the Raw Cp values. Reference mirnas were analyzed for stability using SLqPCR algorithim (similar to genorm) and a selection of the most stable reference mirnas were used to normalize all measurements on a well-to-well basis. Statistical analyses Statistical analyses were performed with Prism version 5.0, GraphPad Software, using unpaired two tailed Student s t tests. A P value of <0.05 was considered statistically significant.
9 Supplementary Figure 1 A TCR GAG CD8 + T cell V 3 V 12 FMuLV GAG B x TCR GAG Alb:GAG Naïve GAG-specific CD8 T cells GAG expression in the liver H2-D b FBL TCR GAG xalb:gag Tolerant GAG-specific peripheral CD8 T cells Supplementary Figure 1: Double-transgenic mouse model of peripheral CD8 T cell tolerance. (A) Transgenic mice (TCR GAG ) were engineered to have CD8 T cells expressing a D b -restricted Vα3/Vβ12 receptor specific for the Friend murine leukemia virus (FMuLV) GAG epitope, an immunodominant antigen from the FMuLV-transformed mouse leukemia cell line, FBL. (B) TCR GAG transgenic mice were crossed to a second transgenic mouse strain, Alb:GAG, which selectively expresses the gag transgene in hepatocytes under control of the albumin promoter. Double-transgenic TCR GAG xalb:gag mice have tolerant GAG-specific CD8 T cells in the periphery. The mouse strains were backcrossed onto the Rag2 -/- background.
10 Supplementary Figure 2 A Lymphopenia-mediated Homeostatic Proliferation count Lymphorepletion Ab bsolute lymphocyte [10 3 / l] Days after radiation B Host: Alb:GAG (Thy1.1) or B6 (Thy1.1) Donor T cells: Tolerant TCR GAG CD8 T cells (Thy1.2) HP Post-HP Days -2 or -1 0 ~ Total body radiation (5Gy) Adoptive transfer of tolerant T cells into lymphopenic hosts Analysis of tolerant T cells in lymphopenic hosts Analysis of tolerant T cells in lymphoreplete hosts Supplementary Figure 2: Radiation-induced lymphopenia and lymphorepletion. (A) Lymphocyte reconstitution in mice following lymphopenia induced by sublethal total body irradiation (5Gy TBI). Adoptively transferred T cells undergo homeostatic proliferation (HP) in lymphopenic hosts. Once normal cellularity of the lymphoid compartment is restored (lymphorepletion) transferred T cells cease their proliferative drive (post-hp). (B) Experimental scheme. Tolerant TCR GAG CD8 T cells (Thy1.2) are transferred into lymphopenic Alb:GAG (Thy1.1) or B6 WT (Thy1.1) mice. Analysis of homeostatically proliferating T cells is performed days post transfer (HP, red). 3-4 months post radiation, mice are lymphoreplete and analysis of transferred T cells is carried out (post-hp, blue).

 Experimental scheme. Re-tolerized TCR GAG CD8 T cells were isolated and sorted (CD8 + Thy1.2 + ) from spleens of lymphorepleted Alb:GAG Thy1.1 or B6 Thy1.")

11 Supplementary Figure 3 A B % of CD D8 T cells Exp #1 Exp #2 Re-tolerized T cells isolated from spleens of B6 WT mice, and adoptively transferred into second set of B6 WT mice Re-tolerized T cells isolated from spleens of GAG mice, and adoptively transferred into second set of GAG mice Exp #1: T cells transferred Exp #2: T cells transferred Supplementary Figure 3: Re-tolerized TCR GAG CD8 T cells fail to respond to immunization even in non-tolerogenic hosts. (A) Experimental scheme. Re-tolerized TCR GAG CD8 T cells were isolated and sorted (CD8 + Thy1.2 + ) from spleens of lymphorepleted Alb:GAG Thy1.1 or B6 Thy1.1 mice and transferred into a second set of normal Alb:GAG Thy1.1 or B6 Thy1.1 mice. One day after secondary transfer mice were immunized with 3x10 7 cfu of LM-GAG and 7 days later spleens assessed for expansion of donor T cells (B). The responsiveness of T cells during HP does not reflect activity of a minor, non-tolerogenic subpopulation since naïve T cells that have undergone HP should have retained their responsive phenotype in the absence of self-antigen (39); furthermoretcr expression levels, in this model, did not correlate with T cell responsiveness since rescued T cells in lymphopenic p Alb:GAG mice expressed lower TCR compared to tolerant T cells, and re-tolerized T cells isolated from lymphoreplete B6 hosts expressed significantly higher levels of TCR.
12 Supplementary Figure 4 A B Supplementary Figure 4: Replicative senescence (Hayflick limit) is not the cause of unresponsiveness during the post-hp phase. (A) Experimental Scheme. Re-tolerized T cells were isolated and sorted (CD8 + Thy1.2 + ) from spleens of lymphorepleted Alb:GAG Thy1.1 mice and transferred into a second set of lymphopenic Alb:GAG Thy1.1 mice one day after TBI. 22 days after secondary transfer mice were immunized with 3x10 7 cfu of LM-GAG and 7 days later peripheral blood analyzed by FACS (B); ** P =
13 Supplementary Figure 5 TCR GAG specific CD8 + T cells Naïve Memory Tolerant Rescued Isolated and sorted (CD8 + /CD44 lo ) from naïve TCR GAG mice. Re-Tolerized Isolated and sorted Isolated and Isolated and sorted Isolated and sorted (CD62L hi /CD44 hi ) sorted (CD8 + /Thy1.2 + )from (CD8 + /Thy1.2 + )f from (CD62L hi /CD44 hi ) ~ 8 weeks post infection. For details see Materials and Methods. (CD8 + /CD44 hi ) from tolerant TCR GAG xalb:gag mice. lymphopenic Alb:GAG (Thy1.1) mice days post transfer. lymphoreplete B6 WT (Thy1.1) mice >3-4 months post transfer. Total RNA-isolation mrna Array micrornaarray Illumina MouseRef-8 v2.0 Expression BeadChips Exiqon mircury LNA Array (v.11.0 mmu) Supplementary Figure 5: Scheme for genome-wide mrna and microrna expression profiling of naïve, memory, tolerant, rescued and re-tolerized TCR GAG CD8Tcells.For detailed information on isolation, purification of samples and downstream analyses see Materials and Methods. Note: microrna array has not been performed on re-tolerized T cell samples (see text).
![Supplementary Figure 6 A Tolerance-specific genes [ T/RT] Cluster 9 N M T RS RT Gene Name Alternative Name LAG3 NDRG1 E2F1 and E2F2 RGS16 PTPLA PTPRS Lymphocyte-activation gene 3 N-myc downstream](/docs-images/72/66753068/images/14-0.jpg "regulated 1 E2F transcription factor 1 and 2 Regulator of G protein signaling 16 protein tyrosine phosphatase-like, member A protein tyrosine phosphatase, h receptor type S Cluster 13 Mitotic and")
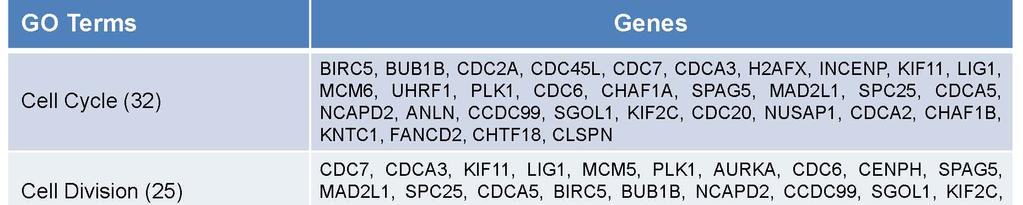
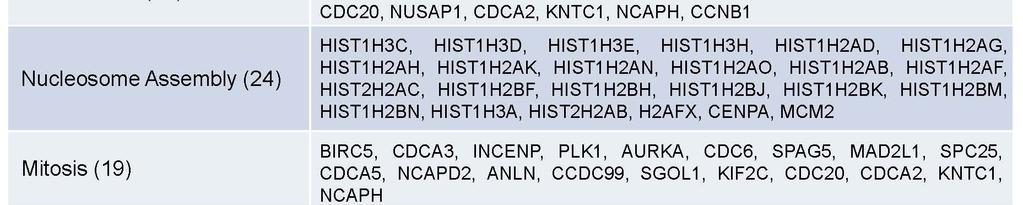
14 Supplementary Figure 6 A Tolerance-specific genes [ T/RT] Cluster 9 N M T RS RT Gene Name Alternative Name LAG3 NDRG1 E2F1 and E2F2 RGS16 PTPLA PTPRS Lymphocyte-activation gene 3 N-myc downstream regulated 1 E2F transcription factor 1 and 2 Regulator of G protein signaling 16 protein tyrosine phosphatase-like, member A protein tyrosine phosphatase, h receptor type S Cluster 13 Mitotic and spindle assembly checkpoint regulators CCDC99 Coiled-coil domain containing 99/Spindly RCC1 Regulator of chromatin condensation CENPA Centromere protein A CENPM Centromere protein M CENPH Centromere protein H INCENP BIRC5 BUB1B MAD2L1 Inner centromere protein antigen Baculoviral IAP repeat containing 5/Survivin budding uninhibited by benzimidazoles 1 homolog MAD2 mitotic arrest deficient-like 1 Histones Hist1 H2AB, H2AG, H2AF, H2AN, H2AH, H2AK, H2AD, H2AC, H2AO Hist1 H2BM, H2BN, H2BH, H2BK, H2BF, H2BJ, H2BN Hist1 H3A, H3E, H3C, H3D, H3H Hist2 H2AB, H2AC Minichromosome maintenance protein complex MCM10 MCM6 MCM5 MCM2 Cell division cycle proteins CDCA2 CDCA3 CDCA5 CDCA7 CDC6 CDC45L CDC20 CDC7 CDC2A Kinesins KIF15 KIF2C KIF22 KIF11 KIF4
15 B
![C Rescue-associated genes [ M/RS and T/RT or M/RS and T/RT] Cluster 1 N M T RS RT Gene Name Alternative Name EGR1 EGR2 DUSP2 JMJD3 GPR83 Early growth response protein 1 Early growth](/docs-images/72/66753068/images/16-0.jpg "response protein 2 Dual specific phosphatase 2/PAC-1 Jumonji domain containing 3 G protein-coupled receptor 83 Cluster 2 Ly86 ID2 GRN FASL Lymphocyte antigen 86/MD-1 Inhibitor of DNA")


16 C Rescue-associated genes [ M/RS and T/RT or M/RS and T/RT] Cluster 1 N M T RS RT Gene Name Alternative Name EGR1 EGR2 DUSP2 JMJD3 GPR83 Early growth response protein 1 Early growth response protein 2 Dual specific phosphatase 2/PAC-1 Jumonji domain containing 3 G protein-coupled receptor 83 Cluster 2 Ly86 ID2 GRN FASL Lymphocyte antigen 86/MD-1 Inhibitor of DNA binding 2 Granulin FAS ligand Cluster 7 KLRA7,10,16 S100A8,9 CCR5 IFITM2, 3, 6 MMP9 CHI3L3 Killer cell lectin-like receptor family A members 7, 10, 16 S100 calcium binding proteins 8 and 9/Mrp8 and Mrp14 Chemokine receptor, CC Motif, receptor 5 Interferon induced transmembrane proteins 2, 3 and 6 Matrix metalloproteinase 9 Chitinase 3-like 3 Cluster 8 CXCR3 IL10Ra Ly6C1 STAT4 AHNAK1 Chemokine (C-X-C motif) receptor 3 Interleukin 10 receptor, alpha Lymphocyte antigen 6 complex, locus C1 Signal transducer and activator of transcription 4 AHNAK1 nucleoprotein Cluster 10 PRF1 Ly6A IFNG Perforin Lymphocyte antigen 6 complex, locus A Interferon gamma Cluster 11 GZMM Ly6E IL12RB1 KLRK1 CCR5 CCL5 NRARP S100A EOMES TBX21 PLCG2 RGS1 GATA3 Granzyme M Lymphocyte antigen 6 complex, locus E IL-12 receptor beta 1 Killer cell lectin-like receptor subfamily K, member 1 Chemokine receptor, CC Motif, receptor 5 Chemokine receptor, CC Motif, ligand 5/RANTES Notch-regulated ankyrin-repeat protein S100 calcium binding protein A Eomesodermin T-box 21, T-bet Phospholipase C, gamma 2 Regulator of G protein signaling 1 GATA binding protein 3
17 Supplementary Figure 6: K-means clustering of gene expression profiles for naïve, memory, tolerant, rescued and re-tolerized T cells. K-means clusters show log 2 - transformed expression intensities mean-centered at the probe-level. (A) Tolerance-specific genes uniquely up-regulated in tolerant and re-tolerized T cells are represented in clusters 9 and 13. (B) Gene ontology (GO) analysis of tolerance-specific genes from clusters 9 and 13. Shown are the top 6 GO terms with the identified genes. (C) Rescue-associated gene sets, clusters 1, 2, 7, 8, 10 and 11. Clusters represent genes up- or down-regulated in memory and rescued T cells (red or green boxes) but not in tolerant or re-tolerized T cells. Gene names and alternative names are shown.


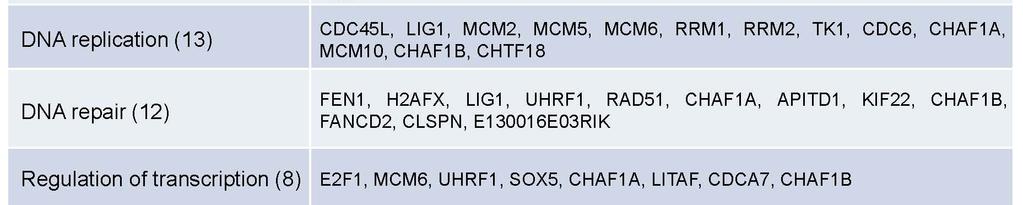
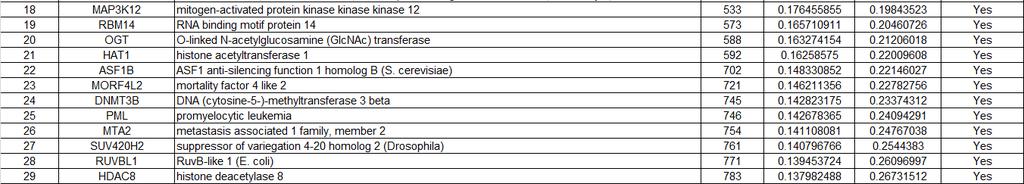
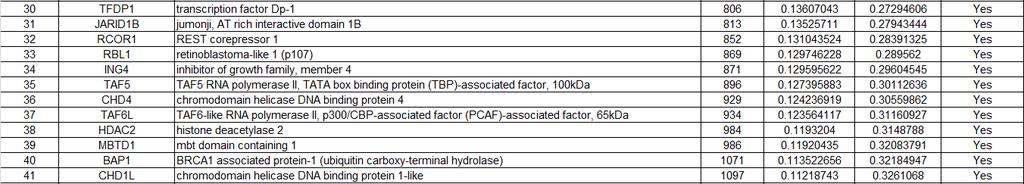
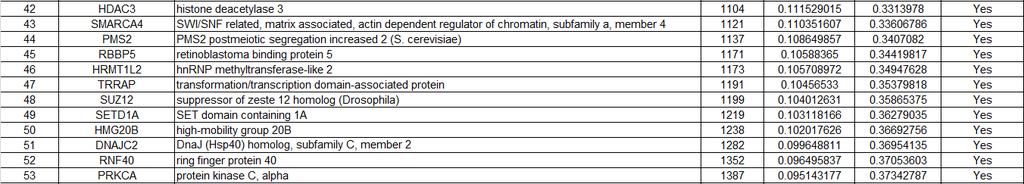
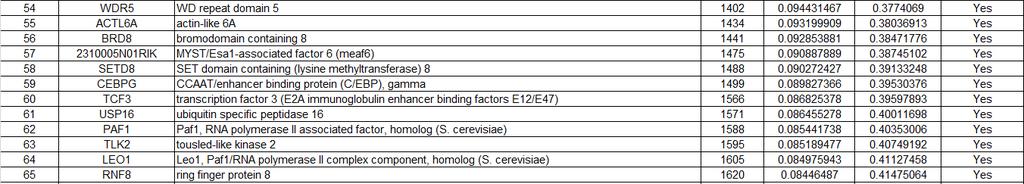
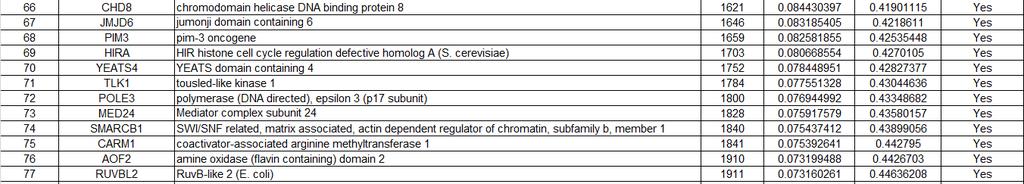
18 Supplementary Figure 7 A B GO term: chromatin modification CDK2 HMGN3 Gene names NES = HMGN3 CCNB1 IRF4 NASP EZH2 JMJD3 DOT1L BRCA2 DNMT1 SUV39H1 CBX2 ING2 JARID1D TADA2L MAP3K12 RBM14 FBXL10 SMARCC1 RBM14 OGT HAT1 ASF1B MORF4L2 DNMT3B PML MTA2 SUV420H2 RUVBL1 HDAC8 TFDP1 JARID1B RCOR1 RBL1 ING4 TAF5 CHD4 CHD4 TAF6L HDAC2 MBTD1 BAP1 CHD1L HDAC3 SMARCA4 PMS2 RBBP5 TRRAP SUZ12 SETD1A HMG20B DNAJC2 RNF40 PRKCA HRMT1L2 PRKCA WDR5 ACTL6A BRD8 SETD8 CEBPG TCF3 USP16 PAF1 TLK2 LEO1 RNF8 CHD8 JMJD6 PIM3 HIRA YEATS N01RIK YEATS4 TLK1 POLE3 MED24 SMARCB1 CARM1 RUVBL2 USP21 TAF12 SMYD2 DPY30 SS18L1 MAP3K7 RB1 WBP7 GTF3C4 TDRD3 AOF2 CBX4 HDAC6 JMJD5 YEATS2 SKP1A EHMT L05RIK PRMT2 TGFB1 SCMH1 BRDT BRPF1 HDAC7 CTR9 MEN1 AOF1 NSBP RIK MEN1 BMI P03RIK BAT3 INO80 FOXP RIK JMJD1C PHF16 BCOR NIPBL MSX3 EYA3 PBRM1 MYST4 SUPT3H
19 C
.")
.")
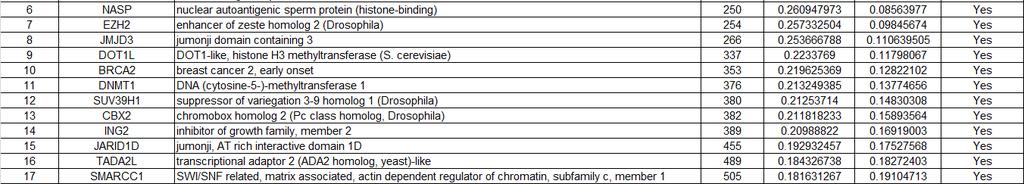
20 Supplementary Figure 7: Gene set enrichment analysis of genes regulating chromatin modification in memory and rescued T cell samples versus tolerant and re-tolerized T cell samples. Expression data were analyzed for genes involved in chromatin modification using gene set enrichment analysis (GSEA). Gene set consists of 330 genes found in the gene ontology term chromatin modification ( GO: chromatin modification; consisting of 376 genes total; 330 genes found on microarray). (A) Gene set enrichment plot showing skewing to the left, indicating enrichment of chromatin modifying genes in tolerant and re-tolerized T cells compared to memory and rescued T cells. The distribution of the genes is listed according to rank position. 120 genes were found to be enriched in data set. NES, normalized enrichment score. (B) Corresponding heat map displaying the expression levels of the 120 most enriched genes. Expression levels are represented as a gradient from high (red) to low (blue). Gene names listed in red are examples for DNA-methyltransferases (DNMT1), histone demethylases (JMJD3), histone acetyltransferases (HAT1), and histone deacetylases (HDAC2, HDAC3). All 120 genes including ranked metric score and enrichment score (ES) are listed in (C).


 superfamily, member 13b GABA(A) receptor-associated protein tropomyosin 3 sortilin 1 AIF1 allograft")
 ITGB2 integrin, beta 2 (complement component 3 receptor 3 and 4 subunit) MTPN myotrophin ABR active BCR-related gene SLC2A9")
 NAGA N-acetylgalactosaminidase, alphaphosphodiesterase PDE4A 4A GHITM growth hormone inducible transmembrane protein DNAJB12")
 VTI1B vesicle transport through interaction with t-snares homolog 1B (yeast) HEXB hexosaminidase B (beta polypeptide) SPG21 spastic paraplegia 21,")
 FTH1 ferritin, heavy polypeptide 1 LSM10 LSM10, U7 small nuclear RNA associated CMTM7 CKLF-like MARVEL transmembrane domain containing 7 DAZAP2 DAZ")
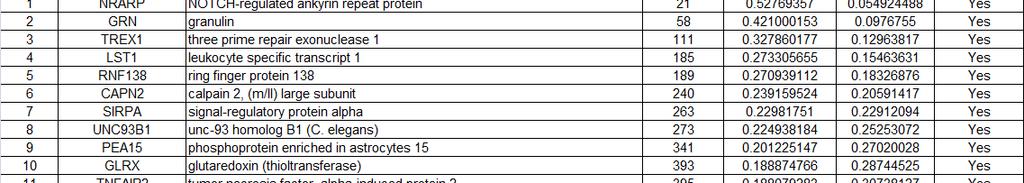
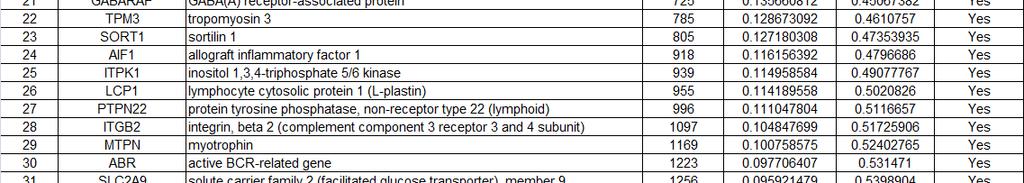
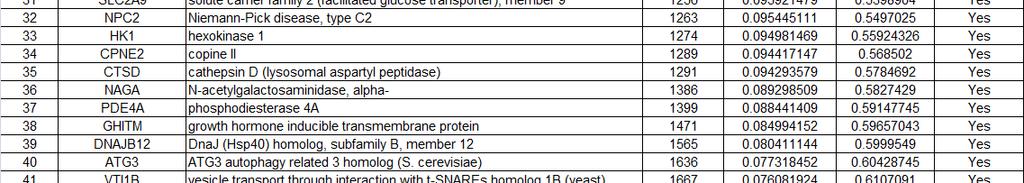
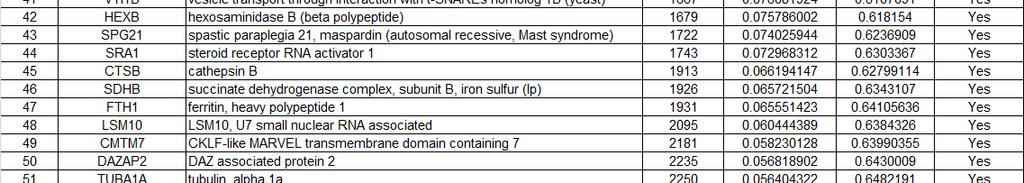
21 Supplementary Figure 8 A Expression of mir-181a Array qpcr B C mir-181a target genes NES = NRARP GRN TREX1 LST1 RNF138 CAPN2 SIRPA UNC93B1 PEA15 GLRX TNFAIP2 RAB31 MVP DUSP7 CD68 ARPC1A GNS BLOC1S1 NDUFA6 TNFSF13B GABARAP TPM3 SORT1 Gene names NOTCH-regulated ankyrin repeat protein granulin three prime repair exonuclease 1 leukocyte specific transcript 1 ring finger protein 138 calpain 2, (m/ii) large subunit signal-regulatory protein alpha unc-93 homolog B1 (C. elegans) phosphoprotein h enriched din astrocytes t 15 glutaredoxin (thioltransferase) tumor necrosis factor, alpha-induced protein 2 RAB31, member RAS oncogene family major vault protein dual specificity phosphatase 7 CD68 molecule actin related protein 2/3 complex, subunit 1A, 41kDa glucosamine (N-acetyl)-6-sulfatase (Sanfilippo disease IIID) biogenesis of lysosome-related organelles complex-1, subunit 1 NADH dehydrogenase (ubiquinone) 1 alpha subcomplex, 6, 14kDa tumor necrosis factor (ligand) superfamily, member 13b GABA(A) receptor-associated protein tropomyosin 3 sortilin 1 AIF1 allograft inflammatory factor 1 ITPK1 inositol 1,3,4-triphosphate 5/6 kinase LCP1 lymphocyte cytosolic protein 1 (L-plastin) PTPN22 protein tyrosine phosphatase, non-receptor type 22 (lymphoid) ITGB2 integrin, beta 2 (complement component 3 receptor 3 and 4 subunit) MTPN myotrophin ABR active BCR-related gene SLC2A9 solute carrier family 2 (facilitated glucose transporter), member 9 NPC2 Niemann-Pick disease, type C2 HK1 hexokinase 1 CPNE2 copine II CTSD cathepsin D (lysosomal aspartyl peptidase) NAGA N-acetylgalactosaminidase, alphaphosphodiesterase PDE4A 4A GHITM growth hormone inducible transmembrane protein DNAJB12 DnaJ (Hsp40) homolog, subfamily B, member 12 ATG3 ATG3 autophagy related 3 homolog (S. cerevisiae) VTI1B vesicle transport through interaction with t-snares homolog 1B (yeast) HEXB hexosaminidase B (beta polypeptide) SPG21 spastic paraplegia 21, maspardin (autosomal recessive, Mast syndrome) SRA1 steroid receptor RNA activator 1 CTSB cathepsin B SDHB succinate dehydrogenase complex, subunit B, iron sulfur (Ip) FTH1 ferritin, heavy polypeptide 1 LSM10 LSM10, U7 small nuclear RNA associated CMTM7 CKLF-like MARVEL transmembrane domain containing 7 DAZAP2 DAZ associated protein 2 TUBA1A tubulin, alpha 1a PDLIM2 PDZ and LIM domain 2 (mystique) TACC1 transforming, acidic coiled-coil containing protein 1 RAC1 BST1 RASSF2 ras-related related C3 botulinum toxin substrate 1 bone marrow stromal cell antigen 1 Ras association (RalGDS/AF-6) domain family 2

22 D
23 Supplementary Figure 8: mir-181a expression and enrichment of mir-181a predicted target genes in TCR GAG CD8 T cells. (A) Comparison of mir-181a expression determined by microrna array (blue) and qrt-pcr (green). The diagram shows the average fold change between average for each assay and the different T cell samples [memory (M1, M2, M3), tolerant t (T1, T2, T3), rescued (RS1, RS2, RS3)]. A fold change higher than one indicates up-regulation, and a fold change less than one a down-regulation in the samples compared to the assay average. (B)-(D) Gene set enrichment analysis (GSEA) of mir-181a predicted target genes. Predicted target genes were compiled from published reports (27, 40, 41). A total of 124 target genes were compared to microarray data from memory, tolerant, rescued and re-tolerized TCR GAG CD8 T cell samples. (B) Gene set enrichment plot showing skewing to the left, indicating enrichment of predicted target genes for memory, tolerant, rescued and re-tolerized T cells. NES, normalized enrichment score. Nominal p-value (C) Corresponding heat map displaying the correlation of the 56 most enriched genes with mrna target expression levels inversely correlated with mir-181a expression levels. Expression levels are represented as a gradient from high (red) to low (blue). Individual genes including ranked metric score and ES are listed in (D).
24 Supplementary Figure 9 T cell Memory T cell Memory Stable and functional? Unstable but functional Transient Rescue Unstable but functional Lymphorepletion Tolerance Stable but dysfunctional Lymphopenia Antigen stimulation in appropriate context (professional APC, e.g. LM-GAG) CD8 T cell states Antigen stimulation in tolerogenic context (tolerogenic APC or non-apc, e.g. GAG-expression hepatocytes) Ground state Naïve T cell Supplementary Figure 9: Model for peripheral CD8 T cell tolerance. Naive peripheral CD8 T cells, when triggered by antigen, can transition into distinct T cell states depending on the conditions as indicated: (Left) A first encounter with (foreign) antigen presented on professional antigen presenting cells (APC) frequently results in the generation of long-lived memory CD8 T cells (e.g. naïve TCR GAG CD8 T cells become memory T cells after LM-GAG infection). Memory CD8 T cells are functional. (Right) Peripheral naïve CD8 T cells that encounter (self-) antigen under tolerogenic conditions can be deleted (not shown) or become tolerant and dysfunctional. The initial encounter(s) with (self-) antigen in the periphery results in the establishment of a tolerance-specific program associated with functional unresponsiveness. The tolerance-program can be temporarily overridden under lymphopenic conditions and tolerant T cells become transiently rescued, but it is eventually reasserted in lymphoreplete hosts and rescued T cells return to their imprinted, tolerant state (epigenetic memory). The model of stable and unstable T cell states and T cell plasticity has been adapted from the review by K.M. Murphy and B. Stockinger (42).
25 Supplementary Table S1: Full list of genes in each K-means cluster. Log 2 -transformed expression intensities that were mean-centered at the probe level for naïve, memory, tolerant, rescued and re-tolerized T cells are shown.
26 Supplementary Table 1 Cluster Probe ID Target ID Naïve Memory Tolerant Rescued Re-tolerized PLEKHG PRICKLE ITGAE TRAT INPP5F ITGAE CEP RASL11B RASL11B TTC FADS NFKBID FRMD CSNK1E CSNK1E ACVR2B MDK SESN IVNS1ABP DLG J05RIK FBLN LOC H23RIK LTA CCL SV2A EXT TMEM87A MATK BACH RAMP PLEKHG VANGL KCNMB EPHX AMPD ADCY DUSP JMJD TTC RCAN JMJD USP6NL JARID1D GTF2IRD RASGRP ENG PBX XKRX SQLE EGR GPR ITGAE IRF IFT EGR E07RIK DDIT SV2A ITGAE TTC AMPD TPCN TRAT TUBB2B TUBB2B TTC DUSP PARD6G LRRC ITGAE SSBP ST6GAL HECTD TNF RNF19A DSCR1L TCF CSRNP TIMP KIF1B TMEM GPR ID FCGR2B CST SMPDL3B LY6D NRP SRPK H2-AA FCRLA CCR P2RY ASNS FCRLA LOC H2-AB RASL ARRDC FAIM CYP4F LY6D CIITA TNFRSF13C FCER2A BLK BLK GNPTAB H2-DMB CTSH SCD FCRLA CASP GZMK KCNK CD B3GNT NAPSA VPREB BTK NAPSA PLD EDG MEF2C TCTEX1D
27 IL4I LOC KCNK M09RIK MANSC LMO NRP NAPSA LY RNASE BCL11A FASL GRN BZRAP TMEM HIST1H4K XIST HIST1H4J HIST1H4C MAPK HIST1H4F HIST1H4M ENSMUSG MID HIST1H4I M10RIK DENND1C ANKS BC NFKBIZ SPO NISCH MIB SNAPC A230050P20RIK OGT LRRFIP F23RIK LRRC CLK ATP13A ZFP N20RIK NARG TRPC CHKB RBM IL11RA TARDBP RAB OGT SNORA HNRPDL RTEL SFXN SBF ZC3H7A TNRC6A SLC35B A07RIK AKAP ATP2A LOC ATP2A A930025D01RIK RCCD C20RIK G17RIK RMND CCDC BC OGT AKAP8L EG USP CCDC PANK XLR4C ABCA D02RIK PRPF40B CLK GDI WDR DVL ANKZF CLK KRTCAP ABCA F23RIK BTBD ZFP A930025D01RIK DDX26B ARGLU NCAPD ORF FAM116B E4F ANKRD SKIV2L SH2B G10RIK WHRN CLK LOC RAB MDN OAS1B HNRPDL TCEA ANKS EXDL PDE1B RGL USP SFRS O09RIK GTPBP GTPBP RTEL SAMD9L SLC35B SFRS ASB ZFP I16RIK SFRS ADCK AW SEC61A
28 NXF IRF KLHL LGALS USP BRF SFI L10RIK LUC7L HMHA DDB D15RIK DDB RGL UBE1L APPL SPNS DIDO TCOF ANKZF DALRD TIA ZFC3H TRIM GDI APBB AOC D4WSU114E P08RIK CCNL AKAP PRR SLCO4A METT11D XLR4A RDH ZFP PCTK NDOR RPS15A SNAPC BRWD ZFYVE LGALS BRWD ING UBP LMBR1L KRBA TMC CLK CXXC H03RIK STX1A CBX CCDC DNASE1L METAPL MYCBP WBP KRBA NDOR TMOD GOLGA I05RIK ZC3H7A OVGP PARP SIRT DGKA AW FBXL FBXL MAN2C TRIM RHEBL JMJD1A P08RIK FYCO DMTF TBX IKBKE TMEM63B MAP4K TMC LOC ABCC DGKA KIFC CYP4F ARID3B FRAP CDC PSG SH3GL TMC RFX TNRC6A ZFP JMJD VAMP CLCF CLCF ZFP HIST1H1C IL6RA DOS THRA URM ADRB L05RIK WFDC LMO EPM2AIP PTPRK CYP2D HSD3B NPFF CSTF SCML TSC22D VAMP VAMP SEPP GDI ORAOV RAD PACS TRIB GRM TLE
MATERIALS AND METHODS. Neutralizing antibodies specific to mouse Dll1, Dll4, J1 and J2 were prepared as described. 1,2 All
 MATERIALS AND METHODS Antibodies (Abs), flow cytometry analysis and cell lines Neutralizing antibodies specific to mouse Dll1, Dll4, J1 and J2 were prepared as described. 1,2 All other antibodies used
Supplementary Materials for
 immunology.sciencemag.org/cgi/content/full/2/16/eaan6049/dc1 Supplementary Materials for Enzymatic synthesis of core 2 O-glycans governs the tissue-trafficking potential of memory CD8 + T cells Jossef
Supplementary Table S1. Primers used for quantitative real-time polymerase chain reaction. Marker Sequence (5 3 ) Accession No.
 Accession No.") Supplementary Tables Supplementary Table S1. Primers used for quantitative real-time polymerase chain reaction Marker Sequence (5 3 ) Accession No. Angiopoietin 1, ANGPT1 A CCCTCCGGTGAATATTGGCTGG NM_001146.3
Supplementary Tables Supplementary Table S1. Primers used for quantitative real-time polymerase chain reaction Marker Sequence (5 3 ) Accession No. Angiopoietin 1, ANGPT1 A CCCTCCGGTGAATATTGGCTGG NM_001146.3
SUPPLEMENTARY INFORMATION
 Complete but curtailed T-cell response to very-low-affinity antigen Dietmar Zehn, Sarah Y. Lee & Michael J. Bevan Supp. Fig. 1: TCR chain usage among endogenous K b /Ova reactive T cells. C57BL/6 mice
Blocking antibodies and peptides. Rat anti-mouse PD-1 (29F.1A12, rat IgG2a, k), PD-
, PD-") Supplementary Methods Blocking antibodies and peptides. Rat anti-mouse PD-1 (29F.1A12, rat IgG2a, k), PD- L1 (10F.9G2, rat IgG2b, k), and PD-L2 (3.2, mouse IgG1) have been described (24). Anti-CTLA-4 (clone
Supplementary Methods Blocking antibodies and peptides. Rat anti-mouse PD-1 (29F.1A12, rat IgG2a, k), PD- L1 (10F.9G2, rat IgG2b, k), and PD-L2 (3.2, mouse IgG1) have been described (24). Anti-CTLA-4 (clone
Supplementary Figure S1. PTPN2 levels are not altered in proliferating CD8+ T cells. Lymph node (LN) CD8+ T cells from C57BL/6 mice were stained with
 CD8+ T cells from C57BL/6 mice were stained with") Supplementary Figure S1. PTPN2 levels are not altered in proliferating CD8+ T cells. Lymph node (LN) CD8+ T cells from C57BL/6 mice were stained with CFSE and stimulated with plate-bound α-cd3ε (10µg/ml)
Supplementary Figure S1. PTPN2 levels are not altered in proliferating CD8+ T cells. Lymph node (LN) CD8+ T cells from C57BL/6 mice were stained with CFSE and stimulated with plate-bound α-cd3ε (10µg/ml)
TNFSF13B tumor necrosis factor (ligand) superfamily, member 13b NF-kB pathway cluster, Enrichment Score: 3.57
 superfamily, member 13b NF-kB pathway cluster, Enrichment Score: 3.57") Appendix 2. Highly represented clusters of genes in the differential expression of data. Immune Cluster, Enrichment Score: 5.17 GO:0048584 positive regulation of response to stimulus GO:0050778 positive
Appendix 2. Highly represented clusters of genes in the differential expression of data. Immune Cluster, Enrichment Score: 5.17 GO:0048584 positive regulation of response to stimulus GO:0050778 positive
CPM (x 10-3 ) Tregs +Teffs. Tregs alone ICOS CLTA-4
 Tregs +Teffs. Tregs alone ICOS CLTA-4") A 2,5 B 4 Number of cells (x 1-6 ) 2, 1,5 1, 5 CPM (x 1-3 ) 3 2 1 5 1 15 2 25 3 Days of culture 1/1 1/2 1/4 1/8 1/16 1/32 Treg/Teff ratio C alone alone alone alone CD25 FoxP3 GITR CD44 ICOS CLTA-4 CD127
A 2,5 B 4 Number of cells (x 1-6 ) 2, 1,5 1, 5 CPM (x 1-3 ) 3 2 1 5 1 15 2 25 3 Days of culture 1/1 1/2 1/4 1/8 1/16 1/32 Treg/Teff ratio C alone alone alone alone CD25 FoxP3 GITR CD44 ICOS CLTA-4 CD127
T-cell activation T cells migrate to secondary lymphoid tissues where they interact with antigen, antigen-presenting cells, and other lymphocytes:
 Interactions between innate immunity & adaptive immunity What happens to T cells after they leave the thymus? Naïve T cells exit the thymus and enter the bloodstream. If they remain in the bloodstream,
Supporting Online Material for
 www.sciencemag.org/cgi/content/full/1175194/dc1 Supporting Online Material for A Vital Role for Interleukin-21 in the Control of a Chronic Viral Infection John S. Yi, Ming Du, Allan J. Zajac* *To whom
Supplementary Figure 1. Characterization of basophils after reconstitution of SCID mice
 Supplementary figure legends Supplementary Figure 1. Characterization of after reconstitution of SCID mice with CD4 + CD62L + T cells. (A-C) SCID mice (n = 6 / group) were reconstituted with 2 x 1 6 CD4
Supplementary Figure 1. mrna expression of chitinase and chitinase-like protein in splenic immune cells. Each splenic immune cell population was
 Supplementary Figure 1. mrna expression of chitinase and chitinase-like protein in splenic immune cells. Each splenic immune cell population was sorted by FACS. Surface markers for sorting were CD11c +
and follicular helper T cells is Egr2-dependent. (a) Diagrammatic representation of the
 Diagrammatic representation of the") Supplementary Figure 1. LAG3 + Treg-mediated regulation of germinal center B cells and follicular helper T cells is Egr2-dependent. (a) Diagrammatic representation of the experimental protocol for the
Supplementary Figure 1. LAG3 + Treg-mediated regulation of germinal center B cells and follicular helper T cells is Egr2-dependent. (a) Diagrammatic representation of the experimental protocol for the
Commercially available HLA Class II tetramers (Beckman Coulter) conjugated to
 conjugated to") Class II tetramer staining Commercially available HLA Class II tetramers (Beckman Coulter) conjugated to PE were combined with dominant HIV epitopes (DRB1*0101-DRFYKTLRAEQASQEV, DRB1*0301- PEKEVLVWKFDSRLAFHH,
Class II tetramer staining Commercially available HLA Class II tetramers (Beckman Coulter) conjugated to PE were combined with dominant HIV epitopes (DRB1*0101-DRFYKTLRAEQASQEV, DRB1*0301- PEKEVLVWKFDSRLAFHH,
Rho GTPase activating protein 8 /// PRR5- ARHGAP8 fusion
 Probe Set ID RefSeq Transcript ID Gene Title Gene Symbol 205980_s_at NM_001017526 /// NM_181334 /// NM_181335 Rho GTPase activating protein 8 /// PRR5- ARHGAP8 fusion ARHGAP8 /// LOC553158 FC ALK shrna
* Kyoto Encyclopedia of Genes and Genomes.
 Supplemental Material Complete gene expression data using Affymetrix 3PRIME IVT ID Chip (54,614 genes) and human immature dendritic cells stimulated with rbmasnrs, IL-8 and control (media) has been deposited
TITLE: MODULATION OF T CELL TOLERANCE IN A MURINE MODEL FOR IMMUNOTHERAPY OF PROSTATIC ADENOCARCINOMA
 AD Award Number: DAMD17-01-1-0085 TITLE: MODULATION OF T CELL TOLERANCE IN A MURINE MODEL FOR IMMUNOTHERAPY OF PROSTATIC ADENOCARCINOMA PRINCIPAL INVESTIGATOR: ARTHUR A HURWITZ, Ph.d. CONTRACTING ORGANIZATION:
Nature Immunology: doi: /ni Supplementary Figure 1. Huwe1 has high expression in HSCs and is necessary for quiescence.
 Supplementary Figure 1 Huwe1 has high expression in HSCs and is necessary for quiescence. (a) Heat map visualizing expression of genes with a known function in ubiquitin-mediated proteolysis (KEGG: Ubiquitin
Transduction of lentivirus to human primary CD4+ T cells
 Transduction of lentivirus to human primary CD4 + T cells Human primary CD4 T cells were stimulated with anti-cd3/cd28 antibodies (10 µl/2 5 10^6 cells of Dynabeads CD3/CD28 T cell expander, Invitrogen)
U118MG. Supplementary Figure 1 U373MG U118MG 3.5 A CCF-SSTG
 A172 CCF-SSTG1 15 - - - 1 1 1 2 2 3 4 6 7 8 10101112131617192022-1 1 1 2 2 3 4 6 7 8 10 10 11 12 13 16 17 19 20 22 T98G U373MG - - - 1 1 1 2 2 3 4 6 7 8 10 10 11 12 13 16 17 19 20 22-1 1 1 2 2 3 4 6 7
York criteria, 6 RA patients and 10 age- and gender-matched healthy controls (HCs).
.") MATERIALS AND METHODS Study population Blood samples were obtained from 15 patients with AS fulfilling the modified New York criteria, 6 RA patients and 10 age- and gender-matched healthy controls (HCs).
MATERIALS AND METHODS Study population Blood samples were obtained from 15 patients with AS fulfilling the modified New York criteria, 6 RA patients and 10 age- and gender-matched healthy controls (HCs).
Electron micrograph of phosphotungstanic acid-stained exosomes derived from murine
 1 SUPPLEMENTARY INFORMATION SUPPLEMENTARY FIGURES Supplementary Figure 1. Physical properties of murine DC-derived exosomes. a, Electron micrograph of phosphotungstanic acid-stained exosomes derived from
of whole cell cultures in U-bottomed wells of a 96-well plate are shown. 2
 Supplementary online material Supplementary figure legends Supplementary Figure 1 Exposure to T reg cells causes loss of T resp cells in co-cultures. T resp cells were stimulated with CD3+CD28 alone or
Supplementary Figure 1. Efficiency of Mll4 deletion and its effect on T cell populations in the periphery. Nature Immunology: doi: /ni.
 Supplementary Figure 1 Efficiency of Mll4 deletion and its effect on T cell populations in the periphery. Expression of Mll4 floxed alleles (16-19) in naive CD4 + T cells isolated from lymph nodes and
Figure S1. Generation of inducible PTEN deficient mice and the BMMCs (A) B6.129 Pten loxp/loxp mice were mated with B6.
 B6.129 Pten loxp/loxp mice were mated with B6.") Figure S1. Generation of inducible PTEN deficient mice and the BMMCs (A) B6.129 Pten loxp/loxp mice were mated with B6.129-Gt(ROSA)26Sor tm1(cre/ert2)tyj /J mice. To induce deletion of the Pten locus,
Figure S1. Generation of inducible PTEN deficient mice and the BMMCs (A) B6.129 Pten loxp/loxp mice were mated with B6.129-Gt(ROSA)26Sor tm1(cre/ert2)tyj /J mice. To induce deletion of the Pten locus,
Nature Immunology: doi: /ni.3412
 Supplementary Figure 1 Gata1 expression in heamatopoietic stem and progenitor populations. (a) Unsupervised clustering according to 100 top variable genes across single pre-gm cells. The two main cell
T cell-mediated immunity
 T cell-mediated immunity Overview For microbes within phagosomes in phagocytes.cd4+ T lymphocytes (TH1) Activate phagocyte by cytokines studies on Listeria monocytogenes For microbes infecting and replicating
Nature Immunology: doi: /ni Supplementary Figure 1. Gene expression profile of CD4 + T cells and CTL responses in Bcl6-deficient mice.
 Supplementary Figure 1 Gene expression profile of CD4 + T cells and CTL responses in Bcl6-deficient mice. (a) Gene expression profile in the resting CD4 + T cells were analyzed by an Affymetrix microarray
Supporting Information
 Supporting Information van der Windt et al. 10.1073/pnas.1221740110 SI Materials and Methods Mice and Reagents. C57BL/6 and major histocompatibility complex class I-restricted OVA-specific T-cell receptor
B6.SJL (Ly5.2) mice were obtained from Taconic Farms. Rag1-deficient mice were
 mice were obtained from Taconic Farms. Rag1-deficient mice were") Supplementary Methods Mice. B6.SJL (Ly5.2) mice were obtained from Taconic Farms. Rag1-deficient mice were purchased from The Jackson Laboratory. Real-time PCR Total cellular RNA was extracted from the
Supplementary Methods Mice. B6.SJL (Ly5.2) mice were obtained from Taconic Farms. Rag1-deficient mice were purchased from The Jackson Laboratory. Real-time PCR Total cellular RNA was extracted from the
Supplemental Table 1. Primer sequences for transcript analysis
 Supplemental Table 1. Primer sequences for transcript analysis Primer Sequence (5 3 ) Primer Sequence (5 3 ) Mmp2 Forward CCCGTGTGGCCCTC Mmp15 Forward CGGGGCTGGCT Reverse GCTCTCCCGGTTTC Reverse CCTGGTGTGCCTGCTC
Supplementary information for: Community detection for networks with. unipartite and bipartite structure. Chang Chang 1, 2, Chao Tang 2
 Supplementary information for: Community detection for networks with unipartite and bipartite structure Chang Chang 1, 2, Chao Tang 2 1 School of Life Sciences, Peking University, Beiing 100871, China
Nature Immunology: doi: /ni Supplementary Figure 1. Cellularity of leukocytes and their progenitors in naive wild-type and Spp1 / mice.
 Supplementary Figure 1 Cellularity of leukocytes and their progenitors in naive wild-type and Spp1 / mice. (a, b) Gating strategies for differentiated cells including PMN (CD11b + Ly6G hi and CD11b + Ly6G
Supplementary Figures
 Inhibition of Pulmonary Anti Bacterial Defense by IFN γ During Recovery from Influenza Infection By Keer Sun and Dennis W. Metzger Supplementary Figures d a Ly6G Percentage survival f 1 75 5 1 25 1 5 1
Cell isolation. Spleen and lymph nodes (axillary, inguinal) were removed from mice
 were removed from mice") Supplementary Methods: Cell isolation. Spleen and lymph nodes (axillary, inguinal) were removed from mice and gently meshed in DMEM containing 10% FBS to prepare for single cell suspensions. CD4 + CD25
Supplementary Methods: Cell isolation. Spleen and lymph nodes (axillary, inguinal) were removed from mice and gently meshed in DMEM containing 10% FBS to prepare for single cell suspensions. CD4 + CD25
Trim29 gene-targeting strategy. (a) Genotyping of wildtype mice (+/+), Trim29 heterozygous mice (+/ ) and homozygous mice ( / ).
 Genotyping of wildtype mice (+/+), Trim29 heterozygous mice (+/ ) and homozygous mice ( / ).") Supplementary Figure 1 Trim29 gene-targeting strategy. (a) Genotyping of wildtype mice (+/+), Trim29 heterozygous mice (+/ ) and homozygous mice ( / ). (b) Immunoblot analysis of TRIM29 in lung primary
Supplementary Figure 1 Trim29 gene-targeting strategy. (a) Genotyping of wildtype mice (+/+), Trim29 heterozygous mice (+/ ) and homozygous mice ( / ). (b) Immunoblot analysis of TRIM29 in lung primary
7SK ChIRP-seq is specifically RNA dependent and conserved between mice and humans.
 Supplementary Figure 1 7SK ChIRP-seq is specifically RNA dependent and conserved between mice and humans. Regions targeted by the Even and Odd ChIRP probes mapped to a secondary structure model 56 of the
Supplementary Figures
 Supplementary Figures Supplementary Fig. 1. Surface thiol groups and reduction of activated T cells. (a) Activated CD8 + T-cells have high expression levels of free thiol groups on cell surface proteins.
Regulating the Regulators for Cancer Immunotherapy: LAG-3 Finally Catches Up. Drew Pardoll Sidney Kimmel Cancer Center Johns Hopkins
 Regulating the Regulators for Cancer Immunotherapy: LAG-3 Finally Catches Up Drew Pardoll Sidney Kimmel Cancer Center Johns Hopkins The hostile immune microenvironment within a tumor Stat3 Stat3 NK Lytic
Supplementary Information
 Supplementary Information Supplementary Figure 1! a! b! Nfatc1!! Nfatc1"! P1! P2! pa1! pa2! ex1! ex2! exons 3-9! ex1! ex11!!" #" Nfatc1A!!" Nfatc1B! #"!" Nfatc1C! #" DN1! DN2! DN1!!A! #A!!B! #B!!C! #C!!A!
CD80 and PD-L2 define functionally distinct memory B cell subsets that are. Griselda V Zuccarino-Catania, Saheli Sadanand, Florian J Weisel, Mary M
 Supplementary Figures CD8 and PD-L define functionally distinct memory B cell subsets that are independent of antibody isotype Running title: Memory B Cell Subset Function Griselda V Zuccarino-Catania,
Supplementary Figure 1 IL-27 IL
 Tim-3 Supplementary Figure 1 Tc0 49.5 0.6 Tc1 63.5 0.84 Un 49.8 0.16 35.5 0.16 10 4 61.2 5.53 10 3 64.5 5.66 10 2 10 1 10 0 31 2.22 10 0 10 1 10 2 10 3 10 4 IL-10 28.2 1.69 IL-27 Supplementary Figure 1.
Supplementary Figure S1. Flow cytometric analysis of the expression of Thy1 in NH cells. Flow cytometric analysis of the expression of T1/ST2 and
 Supplementary Figure S1. Flow cytometric analysis of the expression of Thy1 in NH cells. Flow cytometric analysis of the expression of T1/ST2 and Thy1 in NH cells derived from the lungs of naïve mice.
D CD8 T cell number (x10 6 )
") IFNγ Supplemental Figure 1. CD T cell number (x1 6 ) 18 15 1 9 6 3 CD CD T cells CD6L C CD5 CD T cells CD6L D CD8 T cell number (x1 6 ) 1 8 6 E CD CD8 T cells CD6L F Log(1)CFU/g Feces 1 8 6 p
IFNγ Supplemental Figure 1. CD T cell number (x1 6 ) 18 15 1 9 6 3 CD CD T cells CD6L C CD5 CD T cells CD6L D CD8 T cell number (x1 6 ) 1 8 6 E CD CD8 T cells CD6L F Log(1)CFU/g Feces 1 8 6 p
Paternal exposure and effects on microrna and mrna expression in developing embryo. Department of Chemical and Radiation Nur Duale
 Paternal exposure and effects on microrna and mrna expression in developing embryo Department of Chemical and Radiation Nur Duale Our research question Can paternal preconceptional exposure to environmental
The T cell receptor for MHC-associated peptide antigens
 1 The T cell receptor for MHC-associated peptide antigens T lymphocytes have a dual specificity: they recognize polymporphic residues of self MHC molecules, and they also recognize residues of peptide
To compare the relative amount of of selected gene expression between sham and
 Supplementary Materials and Methods Gene Expression Analysis To compare the relative amount of of selected gene expression between sham and mice given renal ischemia-reperfusion injury (IRI), ncounter
Table S1. Differentially expressed transcripts between hepatic inkt cells. sorted form WT and plck-hcd1d tg mice. Differentially expressed
 Supplementary Information Table S1. Differentially expressed transcripts between hepatic inkt cells sorted form and plck-hcd1d tg mice. Differentially expressed transcripts identified by gene expression
SUPPLEMENTARY FIGURES
 SUPPLEMENTARY FIGURES Supplementary Figure 1: Chemokine receptor expression profiles of CCR6 + and CCR6 - CD4 + IL-17A +/ex and Treg cells. Quantitative PCR analysis of chemokine receptor transcript abundance
Supplementary Figure 1. H-PGDS deficiency does not affect GI tract functions and anaphylactic reaction. (a) Representative pictures of H&E-stained
 Representative pictures of H&E-stained") 1 2 3 4 5 6 7 8 9 10 11 Supplementary Figure 1. H-PGDS deficiency does not affect GI tract functions and anaphylactic reaction. (a) Representative pictures of H&E-stained jejunum sections ( 200 magnification;
1 2 3 4 5 6 7 8 9 10 11 Supplementary Figure 1. H-PGDS deficiency does not affect GI tract functions and anaphylactic reaction. (a) Representative pictures of H&E-stained jejunum sections ( 200 magnification;
Nature Immunology: doi: /ni Supplementary Figure 1. Transcriptional program of the TE and MP CD8 + T cell subsets.
 Supplementary Figure 1 Transcriptional program of the TE and MP CD8 + T cell subsets. (a) Comparison of gene expression of TE and MP CD8 + T cell subsets by microarray. Genes that are 1.5-fold upregulated
The encephalitogenicity of TH17 cells is dependent on IL-1- and IL-23- induced production of the cytokine GM-CSF
 CORRECTION NOTICE Nat.Immunol. 12, 568 575 (2011) The encephalitogenicity of TH17 cells is dependent on IL-1- and IL-23- induced production of the cytokine GM-CSF Mohamed El-Behi, Bogoljub Ciric, Hong
Supplementary Figure Legends. group) and analyzed for Siglec-G expression utilizing a monoclonal antibody to Siglec-G (clone SH2.1).
 and analyzed for Siglec-G expression utilizing a monoclonal antibody to Siglec-G (clone SH2.1).") Supplementary Figure Legends Supplemental Figure : Naïve T cells express Siglec-G. Splenocytes were isolated from WT B or Siglec-G -/- animals that have not been transplanted (n= per group) and analyzed
Supplementary Figure Legends Supplemental Figure : Naïve T cells express Siglec-G. Splenocytes were isolated from WT B or Siglec-G -/- animals that have not been transplanted (n= per group) and analyzed
T cell maturation. T-cell Maturation. What allows T cell maturation?
 T-cell Maturation What allows T cell maturation? Direct contact with thymic epithelial cells Influence of thymic hormones Growth factors (cytokines, CSF) T cell maturation T cell progenitor DN DP SP 2ry
CELLULAR AND MOLECULAR REQUIREMENTS FOR REJECTION OF B16 MELANOMA IN THE SETTING OF REGULATORY T CELL DEPLETION AND HOMEOSTATIC PROLIFERATION
 CELLULAR AND MOLECULAR REQUIREMENTS FOR REJECTION OF B16 MELANOMA IN THE SETTING OF REGULATORY T CELL DEPLETION AND HOMEOSTATIC PROLIFERATION Justin Kline 1, Long Zhang 1, and Thomas F. Gajewski 1,2 Departments
Extracellular Vesicle RNA isolation Kits
 Extracellular Vesicle RNA isolation Kits Summary Section 4 Introduction 42 Exo-TotalRNA and TumorExo-TotalRNA isolation kits 43 Extracellular Vesicle RNA extraction kits Ordering information Products can
Supplementary Table 1. Genes analysed for expression by angiogenesis gene-array.
 Supplementary Table 1. Genes analysed for expression by angiogenesis gene-array. Gene symbol Gene name TaqMan Assay ID UniGene ID 18S rrna 18S ribosomal RNA Hs99999901_s1 Actb actin, beta Mm00607939_s1
Nature Immunology: doi: /ni Supplementary Figure 1 33,312. Aire rep 1. Aire rep 2 # 44,325 # 44,055. Aire rep 1. Aire rep 2.
 a 33,312 b rep 1 rep 1 # 44,325 rep 2 # 44,055 [0-84] rep 2 [0-84] 1810043G02Rik Pfkl Dnmt3l Icosl rep 1 [0-165] rep 2 [0-165] Rps14 Cd74 Mir5107 Tcof1 rep 1 [0-69] rep 2 [0-68] Id3 E2f2 Asap3 rep 1 [0-141]
HEK293FT cells were transiently transfected with reporters, N3-ICD construct and
 Supplementary Information Luciferase reporter assay HEK293FT cells were transiently transfected with reporters, N3-ICD construct and increased amounts of wild type or kinase inactive EGFR. Transfections
15. Supplementary Figure 9. Predicted gene module expression changes at 24hpi during HIV
 Supplementary Information Table of content 1. Supplementary Table 1. Summary of RNAseq data and mapping statistics 2. Supplementary Table 2. Biological functions enriched in 12 hpi DE genes, derived from
Eukaryotic transcription (III)
") Eukaryotic transcription (III) 1. Chromosome and chromatin structure Chromatin, chromatid, and chromosome chromatin Genomes exist as chromatins before or after cell division (interphase) but as chromatids
Eukaryotic transcription (III) 1. Chromosome and chromatin structure Chromatin, chromatid, and chromosome chromatin Genomes exist as chromatins before or after cell division (interphase) but as chromatids
PBMC from each patient were suspended in AIM V medium (Invitrogen) with 5% human
 with 5% human") Anti-CD19-CAR transduced T-cell preparation PBMC from each patient were suspended in AIM V medium (Invitrogen) with 5% human AB serum (Gemini) and 300 international units/ml IL-2 (Novartis). T cell proliferation
Anti-CD19-CAR transduced T-cell preparation PBMC from each patient were suspended in AIM V medium (Invitrogen) with 5% human AB serum (Gemini) and 300 international units/ml IL-2 (Novartis). T cell proliferation
The toll-like receptor 4 ligands Mrp8 and Mrp14 play a critical role in the development of autoreactive CD8 + T cells
 1 SUPPLEMENTARY INFORMATION The toll-like receptor 4 ligands Mrp8 and Mrp14 play a critical role in the development of autoreactive CD8 + T cells Karin Loser 1,2,6, Thomas Vogl 2,3, Maik Voskort 1, Aloys
Supplemental Information. T Cells Enhance Autoimmunity by Restraining Regulatory T Cell Responses via an Interleukin-23-Dependent Mechanism
 Immunity, Volume 33 Supplemental Information T Cells Enhance Autoimmunity by Restraining Regulatory T Cell Responses via an Interleukin-23-Dependent Mechanism Franziska Petermann, Veit Rothhammer, Malte
Development of B and T lymphocytes
 Development of B and T lymphocytes What will we discuss today? B-cell development T-cell development B- cell development overview Stem cell In periphery Pro-B cell Pre-B cell Immature B cell Mature B cell
October 26, Lecture Readings. Vesicular Trafficking, Secretory Pathway, HIV Assembly and Exit from Cell
 October 26, 2006 Vesicular Trafficking, Secretory Pathway, HIV Assembly and Exit from Cell 1. Secretory pathway a. Formation of coated vesicles b. SNAREs and vesicle targeting 2. Membrane fusion a. SNAREs
Supplementary Figure 1 Role of Raf-1 in TLR2-Dectin-1-mediated cytokine expression
 Supplementary Figure 1 Supplementary Figure 1 Role of Raf-1 in TLR2-Dectin-1-mediated cytokine expression. Quantitative real-time PCR of indicated mrnas in DCs stimulated with TLR2-Dectin-1 agonist zymosan
L-selectin Is Essential for Delivery of Activated CD8 + T Cells to Virus-Infected Organs for Protective Immunity
 Cell Reports Supplemental Information L-selectin Is Essential for Delivery of Activated CD8 + T Cells to Virus-Infected Organs for Protective Immunity Rebar N. Mohammed, H. Angharad Watson, Miriam Vigar,
SUPPLEMENTARY FIG. S2. b-galactosidase staining of
 SUPPLEMENTARY FIG. S1. b-galactosidase staining of senescent cells in 500 mg=dl glucose (10 magnification). SUPPLEMENTARY FIG. S3. Toluidine blue staining of chondrogenic-differentiated adipose-tissue-derived
SUPPLEMENTARY FIGURES
 SUPPLEMENTARY FIGURES Figure S1. Clinical significance of ZNF322A overexpression in Caucasian lung cancer patients. (A) Representative immunohistochemistry images of ZNF322A protein expression in tissue
As outlined under External contributions (see appendix 7.1), the group of Prof. Gröne at the
, the group of Prof. Gröne at the") 3 RESULTS As outlined under External contributions (see appendix 7.1), the group of Prof. Gröne at the DKFZ in Heidelberg (Dept. of Cellular and Molecular pathology) contributed to this work by performing
3 RESULTS As outlined under External contributions (see appendix 7.1), the group of Prof. Gröne at the DKFZ in Heidelberg (Dept. of Cellular and Molecular pathology) contributed to this work by performing
(a) Significant biological processes (upper panel) and disease biomarkers (lower panel)
 Significant biological processes (upper panel) and disease biomarkers (lower panel)") Supplementary Figure 1. Functional enrichment analyses of secretomic proteins. (a) Significant biological processes (upper panel) and disease biomarkers (lower panel) 2 involved by hrab37-mediated secretory
Supplementary Figure 1. Functional enrichment analyses of secretomic proteins. (a) Significant biological processes (upper panel) and disease biomarkers (lower panel) 2 involved by hrab37-mediated secretory
Supplementary Table; Supplementary Figures and legends S1-S21; Supplementary Materials and Methods
 Silva et al. PTEN posttranslational inactivation and hyperactivation of the PI3K/Akt pathway sustain primary T cell leukemia viability Supplementary Table; Supplementary Figures and legends S1-S21; Supplementary
Therapeutic PD L1 and LAG 3 blockade rapidly clears established blood stage Plasmodium infection
 Supplementary Information Therapeutic PD L1 and LAG 3 blockade rapidly clears established blood stage Plasmodium infection Noah S. Butler, Jacqueline Moebius, Lecia L. Pewe, Boubacar Traore, Ogobara K.
Supplementary information. Characterization of c-maf + Foxp3 - Regulatory T Cells Induced by. Repeated Stimulation of Antigen-Presenting B Cells
 Chien 1 Supplementary information Manuscript: SREP-16-42480A Characterization of c-maf + Foxp3 - Regulatory T Cells Induced by Repeated Stimulation of Antigen-Presenting B Cells Chien-Hui Chien 1, Hui-Chieh
Supplementary Materials for
 www.sciencesignaling.org/cgi/content/full/7/310/ra11/dc1 Supplementary Materials for STAT3 Induction of mir-146b Forms a Feedback Loop to Inhibit the NF-κB to IL-6 Signaling Axis and STAT3-Driven Cancer
Supplementary Figure 1.
 Supplementary Figure 1. Increased expression of cell cycle pathway genes in insulin + Glut2 low cells of STZ-induced diabetic islets. A) random blood glucose measuers of STZ and vehicle treated MIP-GFP
regulation of polarized membrane transport by rab GTPases Peter van der Sluijs;
 regulation of polarized membrane transport by rab GTPases Peter van der Sluijs; p.vandersluijs@umcutrecht.nl cytotoxic T cell recognizes complex of viral peptide with MHC class I and kills infected cell
SUPPLEMENTARY METHODS
 SUPPLEMENTARY METHODS Histological analysis. Colonic tissues were collected from 5 parts of the middle colon on day 7 after the start of DSS treatment, and then were cut into segments, fixed with 4% paraformaldehyde,
Supplementary Data Table of Contents:
 Supplementary Data Table of Contents: - Supplementary Methods - Supplementary Figures S1(A-B) - Supplementary Figures S2 (A-B) - Supplementary Figures S3 - Supplementary Figures S4(A-B) - Supplementary
Supplementary Figures. T Cell Factor-1 initiates T helper 2 fate by inducing GATA-3 and repressing Interferon-γ
 Supplementary Figures T Cell Factor-1 initiates T helper 2 fate by inducing GATA-3 and repressing Interferon-γ Qing Yu, Archna Sharma, Sun Young Oh, Hyung-Geun Moon, M. Zulfiquer Hossain, Theresa M. Salay,
Patnaik SK, et al. MicroRNAs to accurately histotype NSCLC biopsies
 Patnaik SK, et al. MicroRNAs to accurately histotype NSCLC biopsies. 2014. Supplemental Digital Content 1. Appendix 1. External data-sets used for associating microrna expression with lung squamous cell
5/1/13. The proportion of thymus that produces T cells decreases with age. The cellular organization of the thymus
 T cell precursors migrate from the bone marrow via the blood to the thymus to mature 1 2 The cellular organization of the thymus The proportion of thymus that produces T cells decreases with age 3 4 1
SUPPLEMENTARY INFORMATION. Divergent TLR7/9 signaling and type I interferon production distinguish
 SUPPLEMENTARY INFOATION Divergent TLR7/9 signaling and type I interferon production distinguish pathogenic and non-pathogenic AIDS-virus infections Judith N. Mandl, Ashley P. Barry, Thomas H. Vanderford,
Supplementary Figure 1. Using DNA barcode-labeled MHC multimers to generate TCR fingerprints
 Supplementary Figure 1 Using DNA barcode-labeled MHC multimers to generate TCR fingerprints (a) Schematic overview of the workflow behind a TCR fingerprint. Each peptide position of the original peptide
Bezzi et al., Supplementary Figure 1 *** Nature Medicine: doi: /nm Pten pc-/- ;Zbtb7a pc-/- Pten pc-/- ;Pml pc-/- Pten pc-/- ;Trp53 pc-/-
 Gr-1 Gr-1 Gr-1 Bezzi et al., Supplementary Figure 1 a Gr1-CD11b 3 months Spleen T cells 3 months Spleen B cells 3 months Spleen Macrophages 3 months Spleen 15 4 8 6 c CD11b+/Gr1+ cells [%] 1 5 b T cells
ACTIVATION AND EFFECTOR FUNCTIONS OF CELL-MEDIATED IMMUNITY AND NK CELLS. Choompone Sakonwasun, MD (Hons), FRCPT
, FRCPT") ACTIVATION AND EFFECTOR FUNCTIONS OF CELL-MEDIATED IMMUNITY AND NK CELLS Choompone Sakonwasun, MD (Hons), FRCPT Types of Adaptive Immunity Types of T Cell-mediated Immune Reactions CTLs = cytotoxic T lymphocytes
ACTIVATION AND EFFECTOR FUNCTIONS OF CELL-MEDIATED IMMUNITY AND NK CELLS Choompone Sakonwasun, MD (Hons), FRCPT Types of Adaptive Immunity Types of T Cell-mediated Immune Reactions CTLs = cytotoxic T lymphocytes
Innate immune regulation of T-helper (Th) cell homeostasis in the intestine
 cell homeostasis in the intestine") Innate immune regulation of T-helper (Th) cell homeostasis in the intestine Masayuki Fukata, MD, Ph.D. Research Scientist II Division of Gastroenterology, Department of Medicine, F. Widjaja Foundation,
Innate immune regulation of T-helper (Th) cell homeostasis in the intestine Masayuki Fukata, MD, Ph.D. Research Scientist II Division of Gastroenterology, Department of Medicine, F. Widjaja Foundation,
A novel and universal method for microrna RT-qPCR data normalization
 A novel and universal method for microrna RT-qPCR data normalization Jo Vandesompele professor, Ghent University co-founder and CEO, Biogazelle 4 th International qpcr Symposium Weihenstephan, March 1,
Supplementary Figure 1
 d f a IL7 b IL GATA RORγt h HDM IL IL7 PBS Ilra R7 PBS HDM Ilra R7 HDM Foxp Foxp Ilra R7 HDM HDM Ilra R7 HDM. 9..79. CD + FOXP + T reg cell CD + FOXP T conv cell PBS Ilra R7 PBS HDM Ilra R7 HDM CD + FOXP
Supporting Information
 Supporting Information lpek et al. 1.173/pnas.1121217 SI Materials and Methods Mice. cell knockout, inos / (Taconic arms), Rag1 /, INγR /, and IL-12p4 / mice (The Jackson Laboratory) were maintained and/or
Supplementary Figure 1:
 Supplementary Figure 1: (A) Whole aortic cross-sections stained with Hematoxylin and Eosin (H&E), 7 days after porcine-pancreatic-elastase (PPE)-induced AAA compared to untreated, healthy control aortas
Suppl Video: Tumor cells (green) and monocytes (white) are seeded on a confluent endothelial
 and monocytes (white) are seeded on a confluent endothelial") Supplementary Information Häuselmann et al. Monocyte induction of E-selectin-mediated endothelial activation releases VE-cadherin junctions to promote tumor cell extravasation in the metastasis cascade
Supplementary Information Häuselmann et al. Monocyte induction of E-selectin-mediated endothelial activation releases VE-cadherin junctions to promote tumor cell extravasation in the metastasis cascade
well for 2 h at rt. Each dot represents an individual mouse and bar is the mean ±
 Supplementary data: Control DC Blimp-1 ko DC 8 6 4 2-2 IL-1β p=.5 medium 8 6 4 2 IL-2 Medium p=.16 8 6 4 2 IL-6 medium p=.3 5 4 3 2 1-1 medium IL-1 n.s. 25 2 15 1 5 IL-12(p7) p=.15 5 IFNγ p=.65 4 3 2 1
Supplementary Data 1. Alanine substitutions and position variants of APNCYGNIPL. Applied in
 Supplementary Data 1. Alanine substitutions and position variants of APNCYGNIPL. Applied in Supplementary Fig. 2 Substitution Sequence Position variant Sequence original APNCYGNIPL original APNCYGNIPL
A Slfn2 mutation causes lymphoid and myeloid immunodeficiency due to loss of immune cell quiescence
 Supplementary Information A Slfn mutation causes lymphoid and myeloid immunodeficiency due to loss of immune cell quiescence Michael Berger, Philippe Kres, Karine Crozat, Xiaohong Li, Ben A. Croker, Owen
Supporting Information
 Supporting Information Valkenburg et al. 10.1073/pnas.1403684111 SI Materials and Methods ELISA and Microneutralization. Sera were treated with Receptor Destroying Enzyme II (RDE II, Accurate) before ELISA
January 25, 2017 Scientific Research Process Name of Journal: ESPS Manuscript NO: Manuscript Type: Title: Authors: Correspondence to
 January 25, 2017 Scientific Research Process Name of Journal: World Journal of Gastroenterology ESPS Manuscript NO: 31928 Manuscript Type: ORIGINAL ARTICLE Title: Thiopurine use associated with reduced
Supplementary. presence of the. (c) mrna expression. Error. in naive or
 mrna expression. Error. in naive or") Figure 1. (a) Naive CD4 + T cells were activated in the presence of the indicated cytokines for 3 days. Enpp2 mrna expression was measured by qrt-pcrhr, infected with (b, c) Naive CD4 + T cells were activated
Figure 1. (a) Naive CD4 + T cells were activated in the presence of the indicated cytokines for 3 days. Enpp2 mrna expression was measured by qrt-pcrhr, infected with (b, c) Naive CD4 + T cells were activated