Nature Medicine doi: /nm.2860
|
|
|
- Maude Townsend
- 5 years ago
- Views:
Transcription
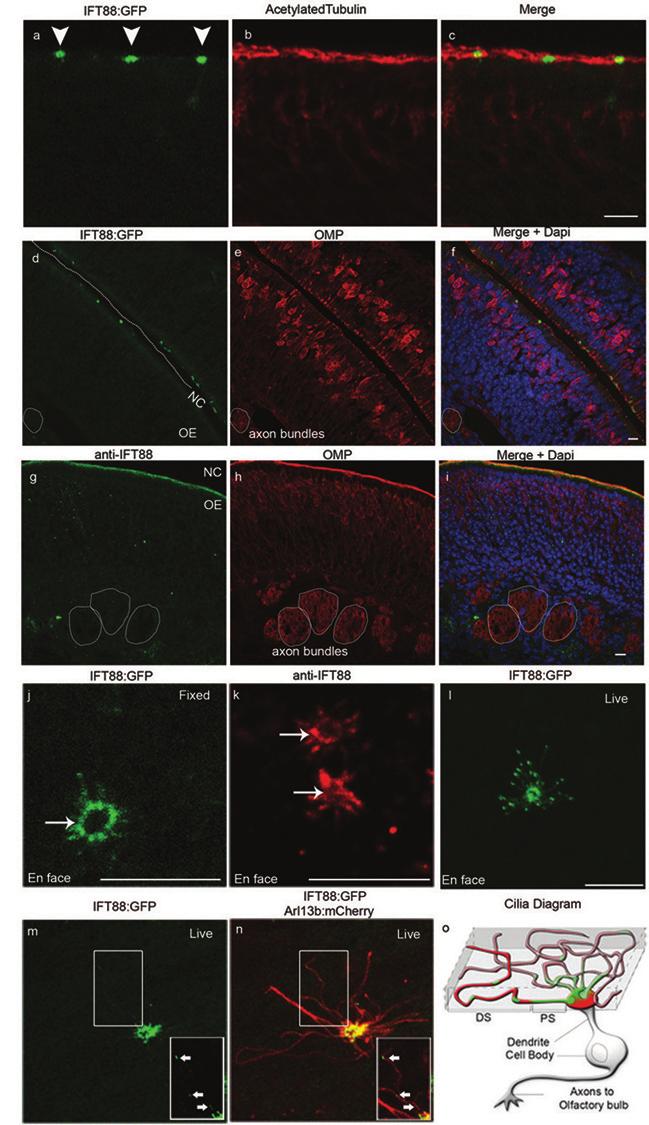
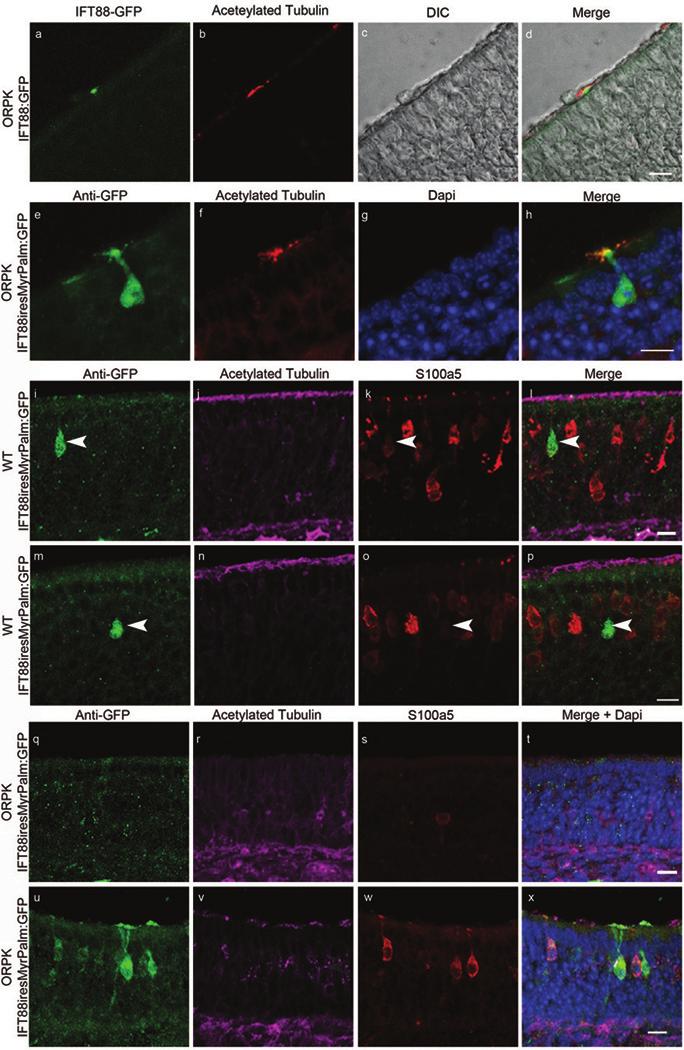
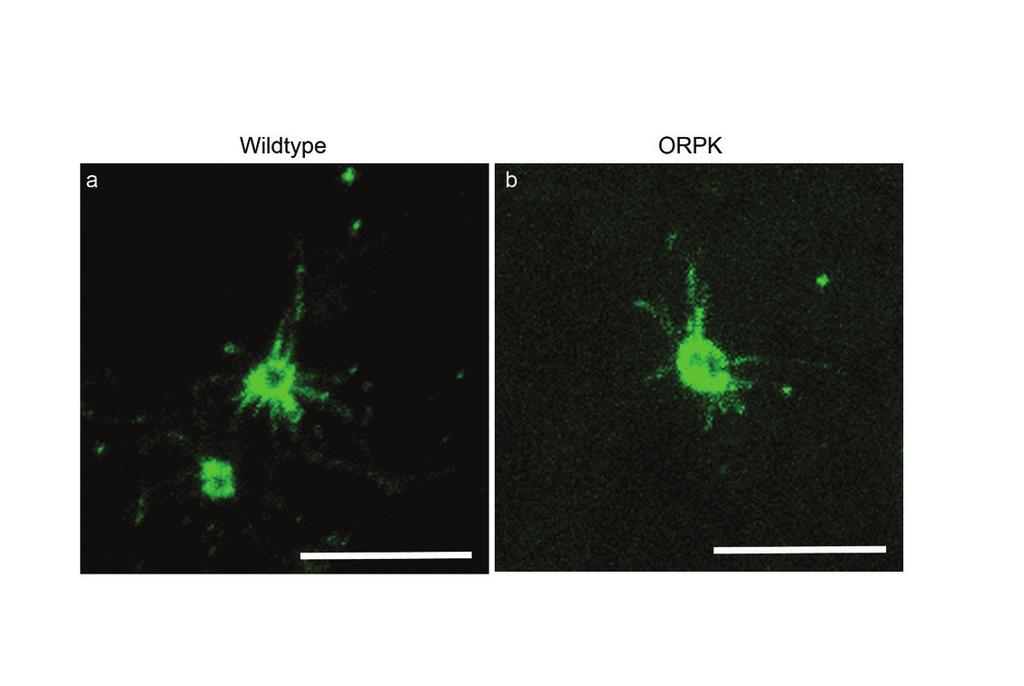
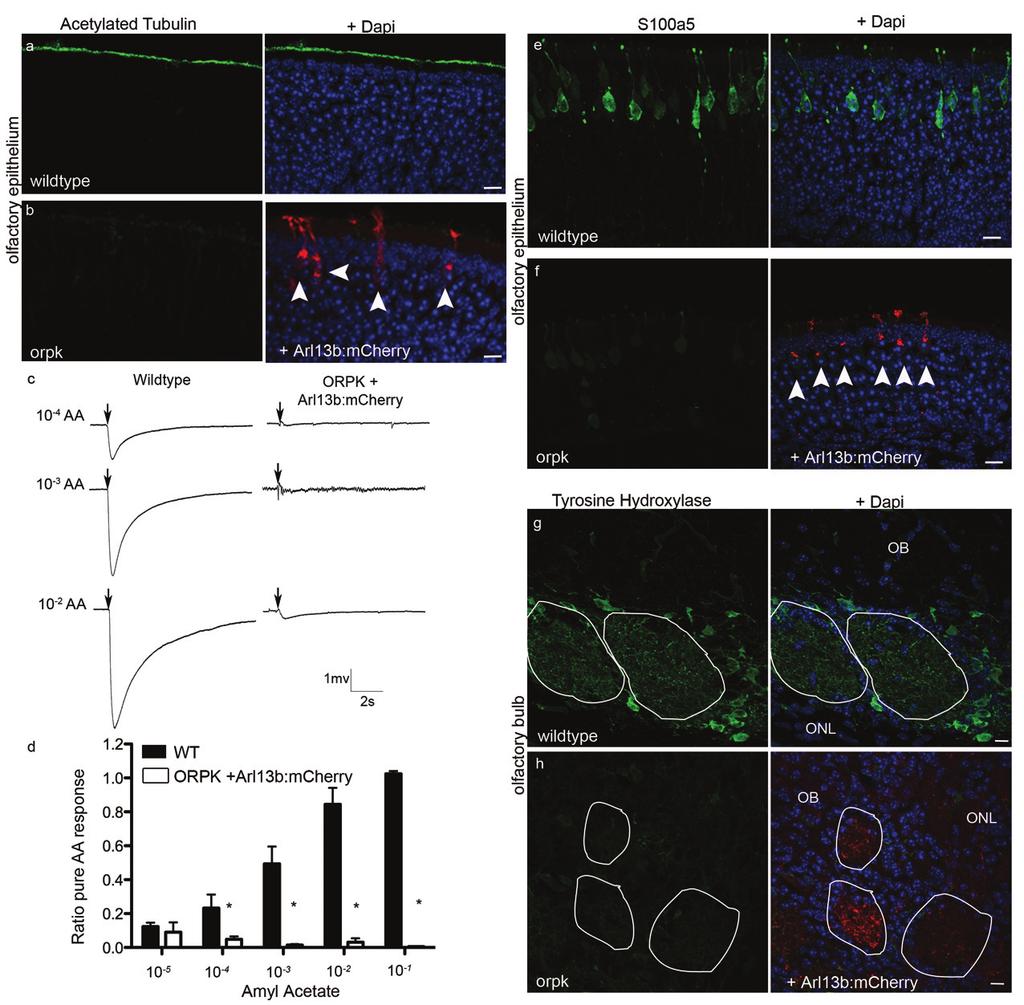
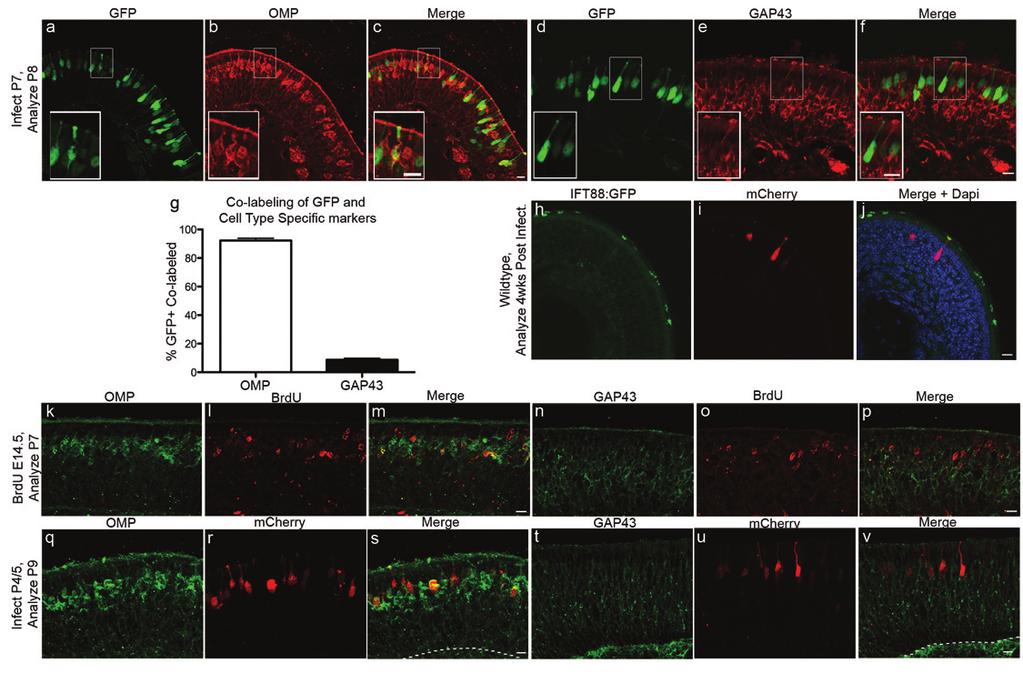
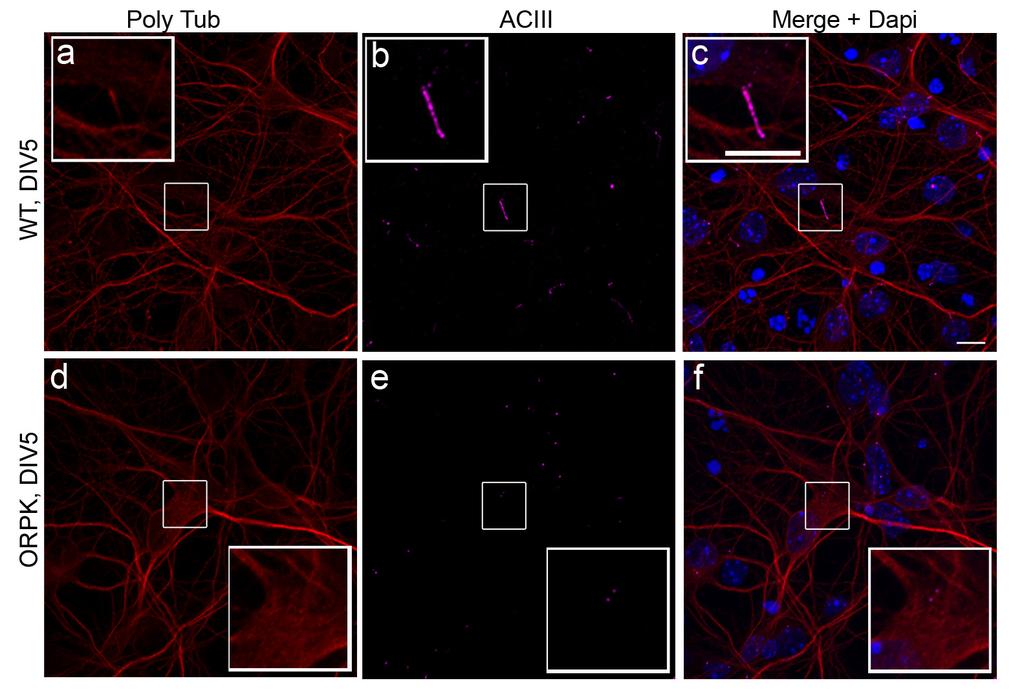
1 Supplemental Figure Legends Supplemental Figure 1: Hypomorphic expression of IFT88 results in olfactory signaling proteins no longer localizing to the ciliary layer. (a) ACIII localizes to the cilia and co-localizes with acetylated α tubulin in WT mice but is absent from the cilia layer of ORPK mice. (b) CNGA2 localizes to the cilia layer where it co-localizes with acetylated α-tubulin, but is also absent from the apical surface of ORPK mice. (c) Gy13 localizes to the cilia in WT mice, and is absent from the apical surface of ORPK mice. (d) Quantification of OE thickness in WT and ORPK mice. The OE of P19-P21 ORPK mice are not significantly thinner than WT mice (n = 3 mice). (e) Representative EOG traces from WT and ORPK mutant littermate mice in response to 3 dilutions of amyl acetate. (f) Quantification of fluorescence intensity of TH staining in WT and ORPK showing the decrease seen in ORPK mice ( n = 19 WT, 17 ORPK glomeruli. p < 0.005, students t-test). Scale Bars, a,b: 5µm, e-g: 10µm. Supplemental Figure 2: Localization of IFT88:GFP recapitulates endogenous IFT88. (a-c) IFT88:GFP localizes to the dendritic knobs (arrowheads) of OSNs co-localizing with acetylated α tubulin. Both IFT88:GFP (d-f) and endogenous IFT88 (g-i) localize to the cilia layer, but are not detected in cell bodies or the axons of OSNs. OSN axon bundles are circled in the lamina propria. (j) En face image of fixed tissue showing IFT88:GFP is detected around the dendritic knob (arrows) and restricted to the proximal region of olfactory cilia. (k) Antibody staining for endogenous IFT88 also shows an enrichment of IFT88 in the proximal regions of olfactory cilia, matching IFT88:GFP. (l) Fixation does not affect IFT88:GFP localization, as IFT88:GFP is still enriched in the proximal regions of olfactory cilia in live tissue. (m-n) En face imaging of live OSNs co-infected with IFT88:GFP and Arl13b:mCherry reveals puncta of IFT88:GFP along Arl13b:mCherry labeled cilia. (o) Schematic of the cilia on a single OSN, highlighting the proximal and distal segments. NC; nasal cavity, OE; olfactory epithelium. Scale bars, 10µm Supplemental Figure 3: Adenoviral mediated expression of IFT88 in ORPK OSNs restores olfactory cilia and function. (a-d) OSNs expressing IFT88:GFP have cilia as seen by acetylated α-tubulin staining around GFP positive knobs. (e-h) Adenoviral delivery of IFT88iresMyrPalm:GFP also restores cilia to infected OSNs. Staining for acetylated α tubulin in the OE of IFT88iresMyrPalm:GFP infected ORPK animals shows cilia only around infected neurons. The acetylated α-tubulin staining overlaps with MyrPalm:GFP found in the cilia. (i-l) In WT mice infected with IFT88iresMyrPalm:GFP, a mosaic expression pattern of S100a5 is present. (m-p) Adenovirus infection does not induce neuronal activity on its own as S100a5 (low) OSNs expressing IFT88iresMyrPalm:GFP are found in the WT OE (q-t) Acetylated α-tubulin and S100a5 labeling is absent in regions of OE from ORPK mice infected with IFT88iresMyrPalm:GFP in which OSNs were not transduced with virus. (u-x) Expression of S100a5 within cells and acetylated α-tubulin in the cilia layer returns to OSNs expressing IFT88iresMyrPalm:GFP. Scale Bars, 10µm Supplemental Figure 4: Localization of ectopic IFT88:GFP in ORPK OSNs is similar to WT OSNs. (a) En face image of WT OSNs expressing IFT88:GFP showing enrichment in the proximal regions of the cilia. (b). En face image of ORPK OSNs showing similar enrichment of IFT88:GFP in proximal regions of the cilia. Scale bars, 10µm Supplemental Figure 5: Expression of IFT88:GFP does not alter EOG responses in WT mice. (a) Quantified responses of WT and WT mice treated with IFT88:GFP to dilutions of Amyl Acetate. (n = 5 mice) (b) Linear regression of correlation between TH staining to GFP fluorescence in ORPK mice treated with IFT88:GFP (closed circles, r = 0.37) and to Cherry fluorescence in ORPK mice treated with Arl13b:mCherry (open circles, r = 0.006). Supplemental Figure 6: Arl13b:mCherry expression does not restore olfactory cilia or olfactory function. (a, b) Acetylated α-tubulin staining in WT littermate and ORPK infected with Arl13b:mCherry. Adenoviral infections of ORPK mice with Arl13b:mCherry fail to show acetylated α-tubulin expression along the apical surface of the OE. (c, d) EOG responses of untreated WT littermates and ORPK mice treated with Arl13b:mCherry, showing that Arl13b:mCherry does not restore EOG response (n = 3 mice, p < 0.05, students t-test). (e, f) Ectopic expression of Arl13b:mCherry fails to return S100a5 staining to ORPK mice (g, h) TH staining is still dramatically reduced in ORPK mice treated with Arl13b:mCherry. Scale Bars; 10µm Supplemental Figure 7: Mature OSNs are preferentially infected by adenovirus. (a-c) Analysis of GFP expression in the OE 24hrs post infection reveals that the majority of infected cells are OMP + mature OSNs (92.3%, n = 3 mice), (d-f) Some GFP expressing neurons are immature OSNs as determined by Gap43 staining (8.7%, n = 3 mice). (g) Quantification of cell counts of co-localization of OMP and Gap43 with Nature Medicine doi: /nm.2860
2 GFP. (h-j) WT mice were infected with both IFT88:GFP and mcherry and analyzed 4 weeks post infection. Expression of both constructs was still detected at this time point allowing us to count hundreds of infected OSNs. (k-p) Timed pregnant mice were injected with BrdU at E14.5 to label dividing cells. Pups were then analyzed at P7 to determine maturation state of BrdU + OSNs. (k-m) By P7 all BrdU + OSNs were also OMP +. (n-p) BrdU + OSNs were negative for Gap43 indicating that by P7 all OSNs that are BrdU + are mature. (q-v) Mice were infected with mcherry adenovirus on days P4 and P5 and analyzed at age P9. (q-s) Analysis of mcherry expression in the OE at P9 reveals all infected OSNs are OMP + mature neurons. (t-v) By age P9, mcherry + OSNs were Gap43 negative. Scale Bars; 10µm Supplemental Figure 8: ORPK cortical neurons lack primary cilia (a-c) Dissociated WT cortical neurons at DIV5 cortical possess primary cilia that are positive for both polyglutamylated α-tubulin and ACIII. (d-f) ORPK neurons do not possess and identifiable primary cilium. Scale bars; 10µm. Supplemental Table 1: Ciliopathy samples with IFT88Met383Lys mutations Phenotype Sample ID IFT88 genotype Ethnicity Additional Ciliopathy mutations MKS-like MKS_542 Met383Lys hom France BBS7: p.y671c het; TTC21B: p.f60y het MKS-like 102 Met383Lys het Pakistani MKS1: c.1448_1451dupcagg hom MKS-like 244 Met383Lys het Pakistani MKS-like 247 Met383Lys het Spanish MKS 324 Met383Lys het Pakistani JATD PB15 Met383Lys het E. European JATD PB34 Met383Lys het N. European Nature Medicine doi: /nm.2860

3
4
5
6
7
8
9
10
SUPPLEMENTARY FIGURE LEGENDS
 SUPPLEMENTARY FIGURE LEGENDS Supplemental FIG. 1. Localization of myosin Vb in cultured neurons varies with maturation stage. A and B, localization of myosin Vb in cultured hippocampal neurons. A, in DIV
Supplementary Figure 1: Validation of labeling specificity of immature OSNs and presynaptic terminals. (A) (B) (C) (D) (E)
 (B) (C) (D) (E)") Supplementary Figure 1: Validation of labeling specificity of immature OSNs and presynaptic terminals. (A) Confocal images of septal olfactory epithelium of an adult Gγ8-sypGFP-tdTom mouse showing colocalization
Supplementary Figure 1: Validation of labeling specificity of immature OSNs and presynaptic terminals. (A) Confocal images of septal olfactory epithelium of an adult Gγ8-sypGFP-tdTom mouse showing colocalization
SUPPLEMENTARY INFORMATION
 DOI: 10.1038/ncb2988 Supplementary Figure 1 Kif7 L130P encodes a stable protein that does not localize to cilia tips. (a) Immunoblot with KIF7 antibody in cell lysates of wild-type, Kif7 L130P and Kif7
Supplemental Materials Molecular Biology of the Cell
 Supplemental Materials Molecular Biology of the Cell Garcia-Alvarez et al. Supplementary Figure Legends Figure S1.Expression and RNAi-mediated silencing of STIM1 in hippocampal neurons (DIV, days in vitro).
Supplementary Figure 1. Gene schematics of hyls-1, gasr-8 and k10g6.4, and TEM analysis of TFs in WT and hyls-1 cilia. (a) Gene structure of hyls-1,
 Gene structure of hyls-1,") Supplementary Figure 1. Gene schematics of hyls-1, gasr-8 and k10g6.4, and TEM analysis of TFs in WT and hyls-1 cilia. (a) Gene structure of hyls-1, gasr-8 and k10g6.4 based on WormBase (http://wormbase.org),
Supplementary Figure 1. Gene schematics of hyls-1, gasr-8 and k10g6.4, and TEM analysis of TFs in WT and hyls-1 cilia. (a) Gene structure of hyls-1, gasr-8 and k10g6.4 based on WormBase (http://wormbase.org),
Zhu et al, page 1. Supplementary Figures
 Zhu et al, page 1 Supplementary Figures Supplementary Figure 1: Visual behavior and avoidance behavioral response in EPM trials. (a) Measures of visual behavior that performed the light avoidance behavior
Supplementary Information
 1 Supplementary Information A role for primary cilia in glutamatergic synaptic integration of adult-orn neurons Natsuko Kumamoto 1,4,5, Yan Gu 1,4, Jia Wang 1,4, Stephen Janoschka 1,2, Ken-Ichi Takemaru
Structural basis for the role of inhibition in facilitating adult brain plasticity
 Structural basis for the role of inhibition in facilitating adult brain plasticity Jerry L. Chen, Walter C. Lin, Jae Won Cha, Peter T. So, Yoshiyuki Kubota & Elly Nedivi SUPPLEMENTARY FIGURES 1-6 a b M
Disrupting GluA2-GAPDH Interaction Affects Axon and Dendrite Development
 Disrupting GluA2-GAPDH Interaction Affects Axon and Dendrite Development 1 Frankie Hang Fung Lee, 1 Ping Su, 1 Yu Feng Xie, 1 Kyle Ethan Wang, 2 Qi Wan and 1,3 Fang Liu 1 Campbell Research Institute, Centre
Supplemental Information. Proprioceptive Opsin Functions. in Drosophila Larval Locomotion
 Neuron, Volume 98 Supplemental Information Proprioceptive Opsin Functions in Drosophila Larval Locomotion Damiano Zanini, Diego Giraldo, Ben Warren, Radoslaw Katana, Marta Andrés, Suneel Reddy, Stephanie
Nature Neuroscience: doi: /nn.2275
 Supplementary Figure S1. The presence of MeCP2 in enriched primary glial cultures from rat or mouse brains is not neuronal. Western blot analysis of protein extracts from (a) rat glial and neuronal cultures.
T H E J O U R N A L O F C E L L B I O L O G Y
 Supplemental material Brooks and Wallingford, http://www.jcb.org/cgi/content/full/jcb.201204072/dc1 T H E J O U R N A L O F C E L L B I O L O G Y Figure S1. Quantification of ciliary compartments in control
Supplementary Figure 1 Expression of Crb3 in mouse sciatic nerve: biochemical analysis (a) Schematic of Crb3 isoforms, ERLI and CLPI, indicating the
 Schematic of Crb3 isoforms, ERLI and CLPI, indicating the") Supplementary Figure 1 Expression of Crb3 in mouse sciatic nerve: biochemical analysis (a) Schematic of Crb3 isoforms, ERLI and CLPI, indicating the location of the transmembrane (TM), FRM binding (FB)
Supplementary Figure 1 Expression of Crb3 in mouse sciatic nerve: biochemical analysis (a) Schematic of Crb3 isoforms, ERLI and CLPI, indicating the location of the transmembrane (TM), FRM binding (FB)
SUPPLEMENTARY INFORMATION
 DOI: 10.1038/ncb2566 Figure S1 CDKL5 protein expression pattern and localization in mouse brain. (a) Multiple-tissue western blot from a postnatal day (P) 21 mouse probed with an antibody against CDKL5.
Wenqin Hu, Cuiping Tian, Tun Li, Mingpo Yang, Han Hou & Yousheng Shu
 Distinct contributions of Na v 1.6 and Na v 1.2 in action potential initiation and backpropagation Wenqin Hu, Cuiping Tian, Tun Li, Mingpo Yang, Han Hou & Yousheng Shu Supplementary figure and legend Supplementary
Department of Cell and Developmental Biology, Vanderbilt University, Nashville, TN
 UNC-6/Netrin mediates dendritic self-avoidance Cody J. Smith 1, Joseph D. Watson 1,4,5, Miri K. VanHoven 2, Daniel A. Colón-Ramos 3 and David M. Miller III 1,4,6 1 Department of Cell and Developmental
Supplemental Information. Otic Mesenchyme Cells Regulate. Spiral Ganglion Axon Fasciculation. through a Pou3f4/EphA4 Signaling Pathway
 Neuron, Volume 73 Supplemental Information Otic Mesenchyme Cells Regulate Spiral Ganglion Axon Fasciculation through a Pou3f4/EphA4 Signaling Pathway Thomas M. Coate, Steven Raft, Xiumei Zhao, Aimee K.
Phosphoinositides Regulate Ciliary Protein Trafficking to Modulate Hedgehog Signaling
 Developmental Cell Supplemental Information Phosphoinositides Regulate Ciliary Protein Trafficking to Modulate Hedgehog Signaling Francesc R. Garcia-Gonzalo, Siew Cheng Phua, Elle C. Roberson, Galo Garcia
GFP/Iba1/GFAP. Brain. Liver. Kidney. Lung. Hoechst/Iba1/TLR9!
 Supplementary information a +KA Relative expression d! Tlr9 5!! 5! NSC Neuron Astrocyte Microglia! 5! Tlr7!!!! NSC Neuron Astrocyte! GFP/Sβ/! Iba/Hoechst Microglia e Hoechst/Iba/TLR9! GFP/Iba/GFAP f Brain
Supplementary Materials for
 www.sciencetranslationalmedicine.org/cgi/content/full/4/117/117ra8/dc1 Supplementary Materials for Notch4 Normalization Reduces Blood Vessel Size in Arteriovenous Malformations Patrick A. Murphy, Tyson
Supplemental Figure 1. Intracranial transduction of a modified ptomo lentiviral vector in the mouse
 Supplemental figure legends Supplemental Figure 1. Intracranial transduction of a modified ptomo lentiviral vector in the mouse hippocampus targets GFAP-positive but not NeuN-positive cells. (A) Stereotaxic
Prss56, a novel marker of adult neurogenesis in the mouse brain. - Supplemental Figures 1 to 5- Brain Structure and Function
 Prss56, a novel marker of adult neurogenesis in the mouse brain - Supplemental Figures 1 to 5- Brain Structure and Function Alexandre Jourdon 1,2, Aurélie Gresset 1, Nathalie Spassky 1, Patrick Charnay
Nature Neuroscience: doi: /nn Supplementary Figure 1. Neuron class-specific arrangements of Khc::nod::lacZ label in dendrites.
 Supplementary Figure 1 Neuron class-specific arrangements of Khc::nod::lacZ label in dendrites. Staining with fluorescence antibodies to detect GFP (Green), β-galactosidase (magenta/white). (a, b) Class
Type of file: PDF Title of file for HTML: Supplementary Information Description: Supplementary Figures
 Type of file: PDF Title of file for HTML: Supplementary Information Description: Supplementary Figures Type of file: MOV Title of file for HTML: Supplementary Movie 1 Description: NLRP3 is moving along
Supplementary figure 1: LII/III GIN-cells show morphological characteristics of MC
 1 2 1 3 Supplementary figure 1: LII/III GIN-cells show morphological characteristics of MC 4 5 6 7 (a) Reconstructions of LII/III GIN-cells with somato-dendritic compartments in orange and axonal arborizations
genome edited transient transfection, CMV promoter
 Supplementary Figure 1. In the absence of new protein translation, overexpressed caveolin-1-gfp is degraded faster than caveolin-1-gfp expressed from the endogenous caveolin 1 locus % loss of total caveolin-1-gfp
McWilliams et al., http :// /cgi /content /full /jcb /DC1
 Supplemental material JCB McWilliams et al., http ://www.jcb.org /cgi /content /full /jcb.201603039 /DC1 THE JOURNAL OF CELL BIOLOGY Figure S1. In vitro characterization of mito-qc. (A and B) Analysis
SUPPLEMENTARY FIGURES
 SUPPLEMENTARY FIGURES 1 Supplementary Figure 1, Adult hippocampal QNPs and TAPs uniformly express REST a-b) Confocal images of adult hippocampal mouse sections showing GFAP (green), Sox2 (red), and REST
SUPPLEMENTARY INFORMATION
 DOI: 1.138/ncb222 / b. WB anti- WB anti- ulin Mitotic index (%) 14 1 6 2 T (h) 32 48-1 1 2 3 4 6-1 4 16 22 28 3 33 e. 6 4 2 Time (min) 1-6- 11-1 > 1 % cells Figure S1 depletion leads to mitotic defects
The Complexity of Simple Genetics
 The Complexity of Simple Genetics? The ciliopathies: a journey into variable penetrance and expressivity Bardet-Biedl Syndrome Allelism at a single locus is insufficient to explain phenotypic variability
SUPPLEMENTARY LEGENDS...
 TABLE OF CONTENTS SUPPLEMENTARY LEGENDS... 2 11 MOVIE S1... 2 FIGURE S1 LEGEND... 3 FIGURE S2 LEGEND... 4 FIGURE S3 LEGEND... 5 FIGURE S4 LEGEND... 6 FIGURE S5 LEGEND... 7 FIGURE S6 LEGEND... 8 FIGURE
effects on organ development. a-f, Eye and wing discs with clones of ε j2b10 show no
 Supplementary Figure 1. Loss of function clones of 14-3-3 or 14-3-3 show no significant effects on organ development. a-f, Eye and wing discs with clones of 14-3-3ε j2b10 show no obvious defects in Elav
SUPPLEMENTARY FIGURES
 SUPPLEMENTARY FIGURES 1 2 3 4 SUPPLEMENTARY TABLES Supplementary Table S1. Brain Tumors used in the study Code Tumor Classification Age Gender HuTuP51 Glioblastoma 57 Male HuTuP52 Glioblastoma 53 Male
TGF-β Signaling Regulates Neuronal C1q Expression and Developmental Synaptic Refinement
 Supplementary Information Title: TGF-β Signaling Regulates Neuronal C1q Expression and Developmental Synaptic Refinement Authors: Allison R. Bialas and Beth Stevens Supplemental Figure 1. In vitro characterization
Supplementary Information
 Supplementary Information CEP41 is mutated in Joubert syndrome and is required for tubulin glutamylation at the cilium Ji Eun Lee, Jennifer L. Silhavy, Maha S. Zaki, Jana Schroth, Stephanie L. Bielas,
SUPPLEMENTARY INFORMATION
 Figure S1. Loss of Ena/VASP proteins inhibits filopodia and neuritogenesis. (a) Bar graph of filopodia number per stage 1 control and mmvvee (Mena/ VASP/EVL-null) neurons at 40hrs in culture. Loss of all
SUPPLEMENTARY INFORMATION
 doi: 10.1038/nature07173 SUPPLEMENTARY INFORMATION Supplementary Figure Legends: Supplementary Figure 1: Model of SSC and CPC divisions a, Somatic stem cells (SSC) reside adjacent to the hub (red), self-renew
Supplementary Information
 Supplementary Information Supplementary Figure 1: Luminal localization of CCM-3. (a) The CCM-3::GFP fusion protein localizes along the apical (luminal) surface of the pharynx (b) as well as the lumen of
Neuronal plasma membrane
 ORGANELLES ORGANELLES Neuronal plasma membrane The neuronal plasma membrane contains several local domains with unique properties Presynaptic terminal Endoplasmic Reticulum In neurons the Nissl bodies
Supplemental Information. Myocardial Polyploidization Creates a Barrier. to Heart Regeneration in Zebrafish
 Developmental Cell, Volume 44 Supplemental Information Myocardial Polyploidization Creates a Barrier to Heart Regeneration in Zebrafish Juan Manuel González-Rosa, Michka Sharpe, Dorothy Field, Mark H.
SUPPLEMENTARY FIG. S2. Representative counting fields used in quantification of the in vitro neural differentiation of pattern of dnscs.
 Supplementary Data SUPPLEMENTARY FIG. S1. Representative counting fields used in quantification of the in vitro neural differentiation of pattern of anpcs. A panel of lineage-specific markers were used
doi: /nature09554
 SUPPLEMENTARY INFORMATION doi:10.1038/nature09554 Supplementary Figure 1: Optical Tracing with New Photoactivatable GFP Variants Reveals Enhanced Labeling of Neuronal Processes We qualitatively compare
SUPPLEMENTARY INFORMATION
 SUPPLEMENTARY INFORMATION Advances in pancreatic islet monolayer culture on glass surfaces enable superresolution microscopy and insights into beta cell ciliogenesis and proliferation Edward A. Phelps,
Supplementary Figure 1. Microglia do not show signs of classical immune activation following MD a-b. Images showing immunoreactivity for MHCII (a)
") 1 Supplementary Figure 1. Microglia do not show signs of classical immune activation following MD a-b. Images showing immunoreactivity for MHCII (a) and CD45 (b) in fixed sections of binocular visual cortex
1 Supplementary Figure 1. Microglia do not show signs of classical immune activation following MD a-b. Images showing immunoreactivity for MHCII (a) and CD45 (b) in fixed sections of binocular visual cortex
Nature Medicine: doi: /nm.4322
 1 2 3 4 5 6 7 8 9 10 11 Supplementary Figure 1. Predicted RNA structure of 3 UTR and sequence alignment of deleted nucleotides. (a) Predicted RNA secondary structure of ZIKV 3 UTR. The stem-loop structure
A. Generation and characterization of Ras-expressing autophagycompetent
 Supplemental Material Supplemental Figure Legends Fig. S1 A. Generation and characterization of Ras-expressing autophagycompetent and -deficient cell lines. HA-tagged H-ras V12 was stably expressed in
Nature Neuroscience: doi: /nn Supplementary Figure 1. Distribution of starter cells for RV-mediated retrograde tracing.
 Supplementary Figure 1 Distribution of starter cells for RV-mediated retrograde tracing. Parcellation of cortical areas is based on Allen Mouse Brain Atlas and drawn to scale. Thick white curves, outlines
Nature Neuroscience: doi: /nn Supplementary Figure 1. ACx plasticity is required for fear conditioning.
 Supplementary Figure 1 ACx plasticity is required for fear conditioning. (a) Freezing time of conditioned and control mice before CS presentation and during CS presentation in a new context. Student s
SUPPLEMENTARY INFORMATION
 SUPPLEMENTARY INFORMATION doi:10.1038/nature11306 Supplementary Figures Supplementary Figure 1. Basic characterization of GFP+ RGLs in the dentate gyrus of adult nestin-gfp mice. a, Sample confocal images
Neuronal plasma membrane
 ORGANELLES ORGANELLES Neuronal plasma membrane The neuronal plasma membrane contains several local domains with unique properties Presynaptic terminal Endoplasmic Reticulum In neurons the Nissl bodies
* * A3027. A4623 e A3507 A3507 A3507
 a c L A327 d e A37 A37 A37 Supplementary Figure 1. Clinical manifestations of individuals with mutations. (a) Renal ultrasound of right kidney in A327 reveals small renal cysts, loss of corticomedullary
SUPPLEMENTARY INFORMATION
 doi:10.1038/nature12652 Supplementary Figure 1. PRDM16 interacts with endogenous EHMT1 in brown adipocytes. Immunoprecipitation of PRDM16 complex by flag antibody (M2) followed by Western blot analysis
Nature Immunology: doi: /ni Supplementary Figure 1. DNA-methylation machinery is essential for silencing of Cd4 in cytotoxic T cells.
 Supplementary Figure 1 DNA-methylation machinery is essential for silencing of Cd4 in cytotoxic T cells. (a) Scheme for the retroviral shrna screen. (b) Histogram showing CD4 expression (MFI) in WT cytotoxic
mir-7a regulation of Pax6 in neural stem cells controls the spatial origin of forebrain dopaminergic neurons
 Supplemental Material mir-7a regulation of Pax6 in neural stem cells controls the spatial origin of forebrain dopaminergic neurons Antoine de Chevigny, Nathalie Coré, Philipp Follert, Marion Gaudin, Pascal
Supplemental Figure 1. Quantification of proliferation in thyroid of WT, Ctns -/- and grafted
 Supplemental Figure 1. Quantification of proliferation in thyroid of WT, Ctns -/- and grafted Ctns -/- mice. Cells immunolabeled for the proliferation marker (Ki-67) were counted in sections (n=3 WT, n=4
SUPPLEMENTARY INFORMATION
 DOI: 10.1038/ncb3443 In the format provided by the authors and unedited. Supplementary Figure 1 TC and SC behaviour during ISV sprouting. (a) Predicted outcome of TC division and competitive Dll4-Notch-mediated
SUPPLEMENTARY INFORMATION
 doi:1.138/nature1554 a TNF-α + in CD4 + cells [%] 1 GF SPF 6 b IL-1 + in CD4 + cells [%] 5 4 3 2 1 Supplementary Figure 1. Effect of microbiota on cytokine profiles of T cells in GALT. Frequencies of TNF-α
sfigure 1: Detection of L-fucose in normal mouse renal cortex using the plant lectin LTL
 sfigure 1: Detection of L-fucose in normal mouse renal cortex using the plant lectin LTL LTL staining Negative control Fluorescence microscopy of normal (CL-11 +/+ ) mouse renal tissue after staining with
marker. DAPI labels nuclei. Flies were 20 days old. Scale bar is 5 µm. Ctrl is
 Supplementary Figure 1. (a) Nos is detected in glial cells in both control and GFAP R79H transgenic flies (arrows), but not in deletion mutant Nos Δ15 animals. Repo is a glial cell marker. DAPI labels
AP VP DLP H&E. p-akt DLP
 A B AP VP DLP H&E AP AP VP DLP p-akt wild-type prostate PTEN-null prostate Supplementary Fig. 1. Targeted deletion of PTEN in prostate epithelium resulted in HG-PIN in all three lobes. (A) The anatomy
Supplementary Materials for
 www.sciencesignaling.org/cgi/content/full/6/283/ra57/dc1 Supplementary Materials for JNK3 Couples the Neuronal Stress Response to Inhibition of Secretory Trafficking Guang Yang,* Xun Zhou, Jingyan Zhu,
Supplemental Information. Ciliary Beating Compartmentalizes. Cerebrospinal Fluid Flow in the Brain. and Regulates Ventricular Development
 Current Biology, Volume Supplemental Information Ciliary Beating Compartmentalizes Cerebrospinal Fluid Flow in the Brain and Regulates Ventricular Development Emilie W. Olstad, Christa Ringers, Jan N.
SUPPLEMENTARY INFORMATION
 DOI: 10.1038/ncb2607 Figure S1 Elf5 loss promotes EMT in mammary epithelium while Elf5 overexpression inhibits TGFβ induced EMT. (a, c) Different confocal slices through the Z stack image. (b, d) 3D rendering
T H E J O U R N A L O F C E L L B I O L O G Y
 Supplemental material Chen et al., http://www.jcb.org/cgi/content/full/jcb.201210119/dc1 T H E J O U R N A L O F C E L L B I O L O G Y Figure S1. Lack of fast reversibility of UVR8 dissociation. (A) HEK293T
(A) Cells grown in monolayer were fixed and stained for surfactant protein-c (SPC,
 Cells grown in monolayer were fixed and stained for surfactant protein-c (SPC,") Supplemental Figure Legends Figure S1. Cell line characterization (A) Cells grown in monolayer were fixed and stained for surfactant protein-c (SPC, green) and co-stained with DAPI to visualize the nuclei.
Supplemental Figure Legends Figure S1. Cell line characterization (A) Cells grown in monolayer were fixed and stained for surfactant protein-c (SPC, green) and co-stained with DAPI to visualize the nuclei.
Supplementary Figure 1. Baf60c and baf180 are induced during cardiac regeneration in zebrafish. RNA in situ hybridization was performed on paraffin
 Supplementary Figure 1. Baf60c and baf180 are induced during cardiac regeneration in zebrafish. RNA in situ hybridization was performed on paraffin sections from sham-operated adult hearts (a and i) and
How Nicotinic Signaling Shapes Neural Networks
 How Nicotinic Signaling Shapes Neural Networks Darwin K. Berg Division of Biological Sciences University of California, San Diego Nicotinic Cholinergic Signaling Uses the transmitter ACh to activate cation-selective
T H E J O U R N A L O F C E L L B I O L O G Y
 T H E J O U R N A L O F C E L L B I O L O G Y Supplemental material Lu et al., http://www.jcb.org/cgi/content/full/jcb.201012063/dc1 Figure S1. Kinetics of nuclear envelope assembly, recruitment of Nup133
Supplemental Figure 1. Western blot analysis indicated that MIF was detected in the fractions of
 Supplemental Figure Legends Supplemental Figure 1. Western blot analysis indicated that was detected in the fractions of plasma membrane and cytosol but not in nuclear fraction isolated from Pkd1 null
Image-Guided Radiotherapy Targets Macromolecules. through Altering the Tumor Microenvironment
 Supporting Information Image-Guided Radiotherapy Targets Macromolecules through ltering the Tumor Microenvironment uthors: Oliver K. ppelbe,, Qingbei Zhang,, harles. Pelizzari, Ralph R. Weichselbaum,,
Supplemental Data. Wu et al. (2010). Plant Cell /tpc
. Plant Cell /tpc") Supplemental Figure 1. FIM5 is preferentially expressed in stamen and mature pollen. The expression data of FIM5 was extracted from Arabidopsis efp browser (http://www.bar.utoronto.ca/efp/development/),
Supplemental Figure 1. FIM5 is preferentially expressed in stamen and mature pollen. The expression data of FIM5 was extracted from Arabidopsis efp browser (http://www.bar.utoronto.ca/efp/development/),
Appendix. Table of Contents
 Appendix Table of Contents Appendix Figures Figure S1: Gp78 is not required for the degradation of mcherry-cl1 in Hela Cells. Figure S2: Indel formation in the MARCH6 sgrna targeted HeLa clones. Figure
Primary Cilia Can Both Mediate and Suppress Hedgehog Pathway- Dependent Tumorigenesis (Supplementary Figures and Materials)
") Primary Cilia Can Both Mediate and Suppress Hedgehog Pathway- Dependent Tumorigenesis (Supplementary Figures and Materials) Sunny Y. Wong, Allen D. Seol, Po-Lin So, Alexandre N. Ermilov, Christopher K.
Primary Cilia Can Both Mediate and Suppress Hedgehog Pathway- Dependent Tumorigenesis (Supplementary Figures and Materials) Sunny Y. Wong, Allen D. Seol, Po-Lin So, Alexandre N. Ermilov, Christopher K.
293T cells were transfected with indicated expression vectors and the whole-cell extracts were subjected
 SUPPLEMENTARY INFORMATION Supplementary Figure 1. Formation of a complex between Slo1 and CRL4A CRBN E3 ligase. (a) HEK 293T cells were transfected with indicated expression vectors and the whole-cell
Supplementary Figure 1
 Supplementary Figure 1 Kif1a RNAi effect on basal progenitor differentiation Related to Figure 2. Representative confocal images of the VZ and SVZ of rat cortices transfected at E16 with scrambled or Kif1a
Supplementary material. VAMP7 controls T cell activation by regulating recruitment and phosphorylation of vesicular
 Supplementary material VAMP7 controls T cell activation by regulating recruitment and phosphorylation of vesicular Lat to the TCR activation sites. Paola Larghi, David J Williamson, Jean-Marie Carpier,
Supplementary Figure S1: Defective heterochromatin repair in HGPS progeroid cells
 Supplementary Figure S1: Defective heterochromatin repair in HGPS progeroid cells Immunofluorescence staining of H3K9me3 and 53BP1 in PH and HGADFN003 (HG003) cells at 24 h after γ-irradiation. Scale bar,
Supporting Online Material for
 www.sciencemag.org/cgi/content/full/1171320/dc1 Supporting Online Material for A Frazzled/DCC-Dependent Transcriptional Switch Regulates Midline Axon Guidance Long Yang, David S. Garbe, Greg J. Bashaw*
Expanded View Figures
 PEX13 functions in selective autophagy Ming Y Lee et al Expanded View Figures Figure EV1. PEX13 is required for Sindbis virophagy. A, B Quantification of mcherry-capsid puncta per cell (A) and GFP-LC3
SUPPLEMENTARY INFORMATION
 Supplementary Figure 1. Behavioural effects of ketamine in non-stressed and stressed mice. Naive C57BL/6 adult male mice (n=10/group) were given a single dose of saline vehicle or ketamine (3.0 mg/kg,
SUPPLEMENTARY INFORMATION
 doi: 10.1038/nature06994 A phosphatase cascade by which rewarding stimuli control nucleosomal response A. Stipanovich*, E. Valjent*, M. Matamales*, A. Nishi, J.H. Ahn, M. Maroteaux, J. Bertran-Gonzalez,
SUPPLEMENTARY FIGURES
 SUPPLEMENTARY FIGURES Supplementary Figure 1. (A) Left, western blot analysis of ISGylated proteins in Jurkat T cells treated with 1000U ml -1 IFN for 16h (IFN) or left untreated (CONT); right, western
Supplemental Information. Supernumerary Centrosomes. Nucleate Extra Cilia and Compromise. Primary Cilium Signaling. Current Biology, Volume 22
 Current Biology, Volume 22 Supplemental Information Supernumerary Centrosomes Nucleate Extra Cilia and Compromise Primary Cilium Signaling Moe R. Mahjoub and Tim Stearns Supplemental Inventory 1. Supplemental
Supplementary Figure 1
 Supplementary Figure 1 Supplementary Figure 1 SNARE Probes for FRET/2pFLIM Analysis Used in the Present Study. mturquoise (mtq) and Venus (Ven) are in blue and yellow, respectively. The soluble N-ethylmaleimide-sensitive
Schwarz et al. Activity-Dependent Ubiquitination of GluA1 Mediates a Distinct AMPAR Endocytosis
 Schwarz et al Activity-Dependent Ubiquitination of GluA1 Mediates a Distinct AMPAR Endocytosis and Sorting Pathway Supplemental Data Supplemental Fie 1: AMPARs undergo activity-mediated ubiquitination
Supplementary Figure S1 (a) (b)
 (b)") Supplementary Figure S1: IC87114 does not affect basal Ca 2+ level nor nicotineinduced Ca 2+ influx. (a) Bovine chromaffin cells were loaded with Fluo-4AM (1 μm) in buffer A containing 0.02% of pluronic
Supplementary Figure S1: IC87114 does not affect basal Ca 2+ level nor nicotineinduced Ca 2+ influx. (a) Bovine chromaffin cells were loaded with Fluo-4AM (1 μm) in buffer A containing 0.02% of pluronic
Lack of cadherins Celsr2 and Celsr3 impairs ependymal ciliogenesis, leading to fatal
 Lack of cadherins Celsr2 and Celsr3 impairs ependymal ciliogenesis, leading to fatal hydrocephalus Fadel TISSIR, Yibo QU, Mireille MONTCOUQUIOL, Libing ZHOU, Kouji KOMATSU, Dongbo SHI, Toshihiko FUJIMORI,
Supplementary information. The Light Intermediate Chain 2 Subpopulation of Dynein Regulates Mitotic. Spindle Orientation
 Supplementary information The Light Intermediate Chain 2 Subpopulation of Dynein Regulates Mitotic Spindle Orientation Running title: Dynein LICs distribute mitotic functions. Sagar Mahale a, d, *, Megha
Paul Michael Jenkins
 Mechanisms of Ciliar y Tar geting of the Olfactor y Cyclic Nucleotide- Gated Channel by Paul Michael Jenkins A dissertation submitted in partial fulfillment of the requirements for the degree of Doctor
Rescue of mutant rhodopsin traffic by metformin-induced AMPK activation accelerates photoreceptor degeneration Athanasiou et al
 Supplementary Material Rescue of mutant rhodopsin traffic by metformin-induced AMPK activation accelerates photoreceptor degeneration Athanasiou et al Supplementary Figure 1. AICAR improves P23H rod opsin
Figure legends Supplemental Fig.1. Glucose-induced insulin secretion and insulin content of islets. Supplemental Fig. 2.
 Figure legends Supplemental Fig.. Glucose-induced insulin secretion and insulin content of islets. Insulin secretory responses to.,., and. mm glucose (A) (n = 7-), and the insulin content in the islets
SUPPLEMENTARY INFORMATION
 doi: 10.1038/nature06310 SUPPLEMENTARY INFORMATION www.nature.com/nature 1 www.nature.com/nature 2 www.nature.com/nature 3 Supplementary Figure S1 Spontaneous duration of wake, SWS and REM sleep (expressed
(a) Schematic diagram of the FS mutation of UVRAG in exon 8 containing the highly instable
 Schematic diagram of the FS mutation of UVRAG in exon 8 containing the highly instable") Supplementary Figure 1. Frameshift (FS) mutation in UVRAG. (a) Schematic diagram of the FS mutation of UVRAG in exon 8 containing the highly instable A 10 DNA repeat, generating a premature stop codon
Supplementary Figure 1. Frameshift (FS) mutation in UVRAG. (a) Schematic diagram of the FS mutation of UVRAG in exon 8 containing the highly instable A 10 DNA repeat, generating a premature stop codon
Supplementary Information. Tissue-wide immunity against Leishmania. through collective production of nitric oxide
 Supplementary Information Tissue-wide immunity against Leishmania through collective production of nitric oxide Romain Olekhnovitch, Bernhard Ryffel, Andreas J. Müller and Philippe Bousso Supplementary
Figure S1. Reduction in glomerular mir-146a levels correlate with progression to higher albuminuria in diabetic patients.
 Supplementary Materials Supplementary Figures Figure S1. Reduction in glomerular mir-146a levels correlate with progression to higher albuminuria in diabetic patients. Figure S2. Expression level of podocyte
Karen L.P. McNally, Amy S. Fabritius, Marina L. Ellefson, Jonathan R. Flynn, Jennifer A. Milan, and Francis J. McNally
 Developmental Cell, Volume 22 Supplemental Information Kinesin-1 Prevents Capture of the Oocyte Meiotic Spindle by the Sperm Aster Karen L.P. McNally, Amy S. Fabritius, Marina L. Ellefson, Jonathan R.
Supplemental Data. Beck et al. (2010). Plant Cell /tpc
. Plant Cell /tpc") Supplemental Figure 1. Phenotypic comparison of the rosette leaves of four-week-old mpk4 and Col-0 plants. A mpk4 vs Col-0 plants grown in soil. Note the extreme dwarfism of the mpk4 plants (white arrows)
Supplemental Figure 1. Phenotypic comparison of the rosette leaves of four-week-old mpk4 and Col-0 plants. A mpk4 vs Col-0 plants grown in soil. Note the extreme dwarfism of the mpk4 plants (white arrows)
Supplementary Material
 Supplementary Material Summary: The supplementary information includes 1 table (Table S1) and 4 figures (Figure S1 to S4). Supplementary Figure Legends Figure S1 RTL-bearing nude mouse model. (A) Tumor
Nature Neuroscience: doi: /nn Supplementary Figure 1. Splenic atrophy and leucopenia caused by T3 SCI.
 Supplementary Figure 1 Splenic atrophy and leucopenia caused by T3 SCI. (a) Gross anatomy of representative spleens from control and T3 SCI mice at 28 days post-injury. (b and c) Hematoxylin and eosin
activation with anti-cd3/cd28 beads and 3d following transduction. Supplemental Figure 2 shows
 Supplemental Data Supplemental Figure 1 compares CXCR4 expression in untreated CD8 + T cells, following activation with anti-cd3/cd28 beads and 3d following transduction. Supplemental Figure 2 shows the