SUPPLEMENTARY LEGENDS...
|
|
|
- Pauline Bruce
- 6 years ago
- Views:
Transcription
1 TABLE OF CONTENTS SUPPLEMENTARY LEGENDS MOVIE S FIGURE S1 LEGEND... 3 FIGURE S2 LEGEND... 4 FIGURE S3 LEGEND... 5 FIGURE S4 LEGEND... 6 FIGURE S5 LEGEND... 7 FIGURE S6 LEGEND... 8 FIGURE S7 LEGEND... 9 FIGURE S8 LEGEND FIGURE S9 LEGEND FIGURES FIGURE S FIGURE S FIGURE S FIGURE S FIGURE S FIGURE S FIGURE S FIGURE S FIGURE S
2 Supplementary legends: Movie S1: Representative time-lapse phase contrast movie of H2B-GFP primary myotubes, recorded from day 1, after agrin addition, until day 10, showing nuclear movement during myofiber maturation. 2
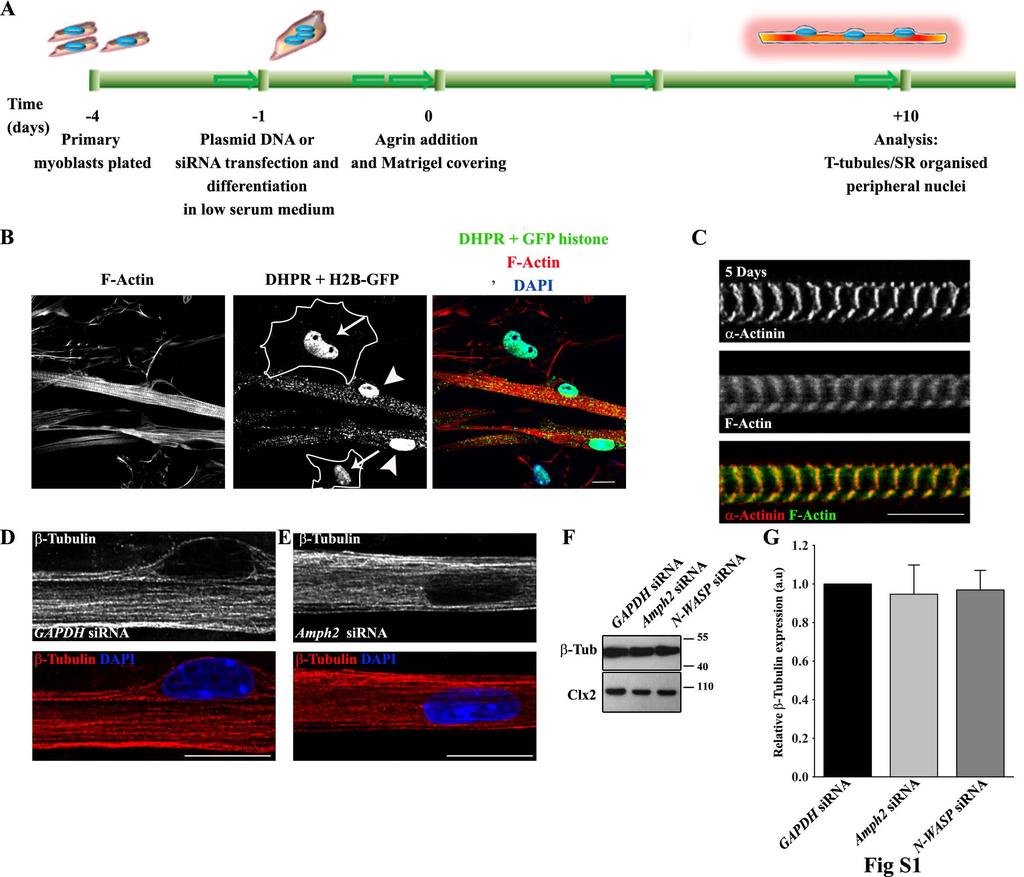
3 Figure S1: In vitro myofiber maturation A) Schematic representation of in vitro model protocol, showing the timeline for plasmid and sirna transfection, differentiation and matrigel embedding and treatments. B) Representative immunofluorescence image of H2B-GFP primary myofibers treated with agrin for 10 days and immunostained for F-actin (red), DHPR (green) and DAPI (Blue). Arrows indicate mononucleated myoblasts and arrowheads indicate peripheral nuclei in myofibers. Bar, 15 μm. C) Representative immunofluorescence image of WT primary myofiber trated with agrin for 5 days and immunostained for -Actinin (red) and F-Actin (green). Bar, 15 μm. D) Representative immunofluorescence image of WT primary myofiber, transfected with GAPDH sirna, treated with agrin for 10 days and immunostained for -tubulin (red), and DAPI (Blue). Bar, 15 μm. E) Representative immunofluorescence image of WT primary myofiber, transfected with Amph2 sirna, treated with agrin for 10 days and immunostained for -Tubulin (red), and DAPI (Blue). Bar, 15 μm. F) Western Blot with Calnexin2 (Clx2) and -Tubulin antibodies of myofibers untransfected or transfected with GAPDH sirna or, Amph2 sirna or N-WASP sirna and treated with agrin for 10 days. G) Histograms of relative expression of -Tubulin showed in F. Error bars, s.e.m. 3
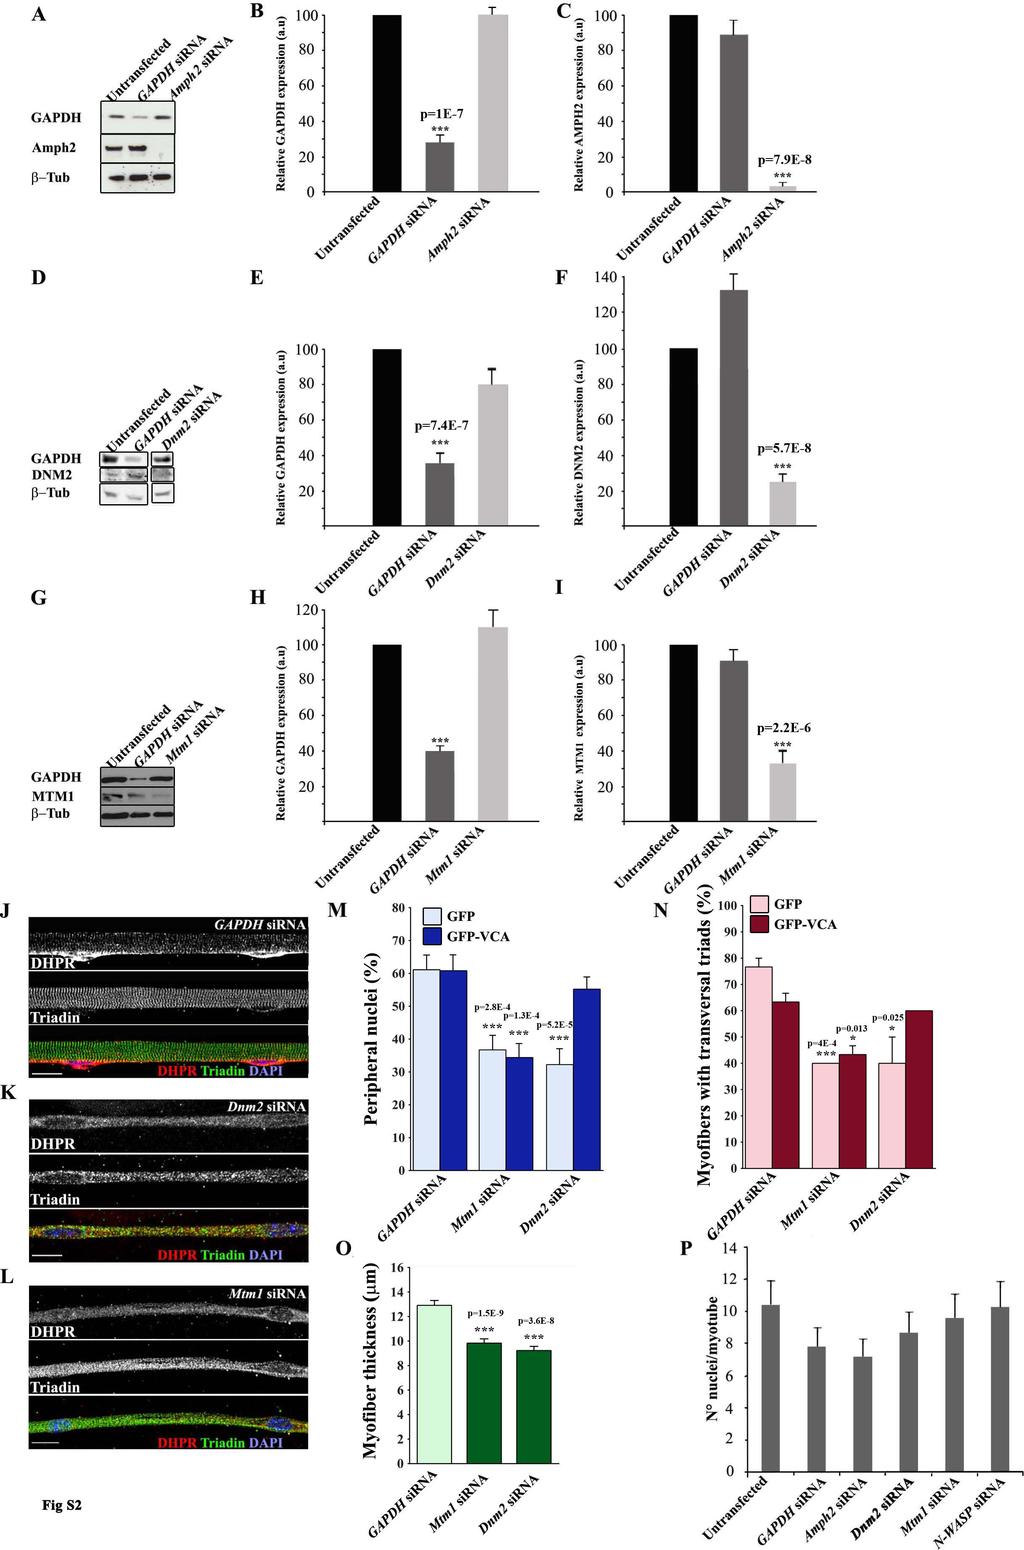
4 Figure S2: Amph2, dynamin-2 and myotubularin depletion in cultured primary myofibers and fusion index. A) Western Blot with GAPDH, Amph2 and -Tubulin antibodies of myofibers untransfected or transfected with GAPDH sirna or Amph2- sirna and treated with agrin for 10 days. B-C) Histograms of relative expression of GAPDH (B) or Amph2 (C) in myofibers untransfected or transfected with and GAPDH sirna or Amph2 sirna. Error bars, s.e.m. p values from t-test. D) Western Blot with GAPDH, DNM2 and -Tubulin antibodies of myofibers untransfected or transfected with GAPDH sirna or Dnm2- sirna and treated with agrin for 10 days. E - F) Histograms of relative expression of GAPDH (E) or Dnm2 (F) in myofibers untransfected or transfected with and GAPDH sirna or Dnm2 sirna. Error bars, s.e.m. p values from t-test. G) Western Blot with GAPDH, Mtm1 and -Tubulin antibodies of myofibers untransfected or transfected with GAPDH sirna or Mtm1 sirna and treated with agrin for 10 days. H- I) Histograms of relative expression of GAPDH (H) or Mtm1 (I) in myofibers untransfected or transfected with and GAPDH sirna or Mtm1 sirna. Error bars, s.e.m. p values from t-test. J) Representative immunofluorescence images of WT primary myofibers transfected with GAPDH sirna, treated with agrin for 10 days, immunostained for DHPR (red), triadin (green) and DAPI (blue).. Bar, 15 μm. K) Representative immunofluorescence images of WT primary myofibers transfected with Dnm2 sirna, treated with agrin for 10 days, immunostained for DHPR (red), triadin (green) and DAPI (blue). Bars, 15 μm. L) Representative immunofluorescence images of WT primary myofibers transfected with Mtm1 sirna, treated with agrin for 10 days, immunostained for DHPR (red), triadin (green) and DAPI (blue). Bars, 15 μm. M) Quantification of peripheral nuclei of myofibers transfected with GAPDH sirna, Mtm1 sirna or Dnm2 sirna and GFP (light blue) or GFP-VCA (blue), and treated with agrin for 10 days. Error bars, s.e.m. p values from t-test (GAPDH sirna vs Mtm1 or Dnm2 sirna). N) Quantification of the percentage of transversal triads in myofibers transfected with GAPDH sirna, Mtm1 sirna or Dnm2 sirna and with GFP(pink fill) or GFP-VCA (red fill) and treated with agrin for 10 days Error bars, s.e.m. p values from t-test (GAPDH sirna vs Mtm1 or Dnm2 sirna). O) Quantification of myofiber thickness in myofibers transfected with GAPDH sirna, Mtm1 sirna or Dnm2 sirna and treated with agrin for 10 days. Error bars, s.e.m. p values from t-test (GAPDH sirna vs Mtm1 or Dnm2 sirna). P) Histogram of the average number of nuclei/myotubes (fusion index) in myofibers untransfected or transfected with GAPDH sirna, Mtm1 sirna or Dnm2 sirna and treated with agrin for 10 days. Error bars, s.e.m. 4
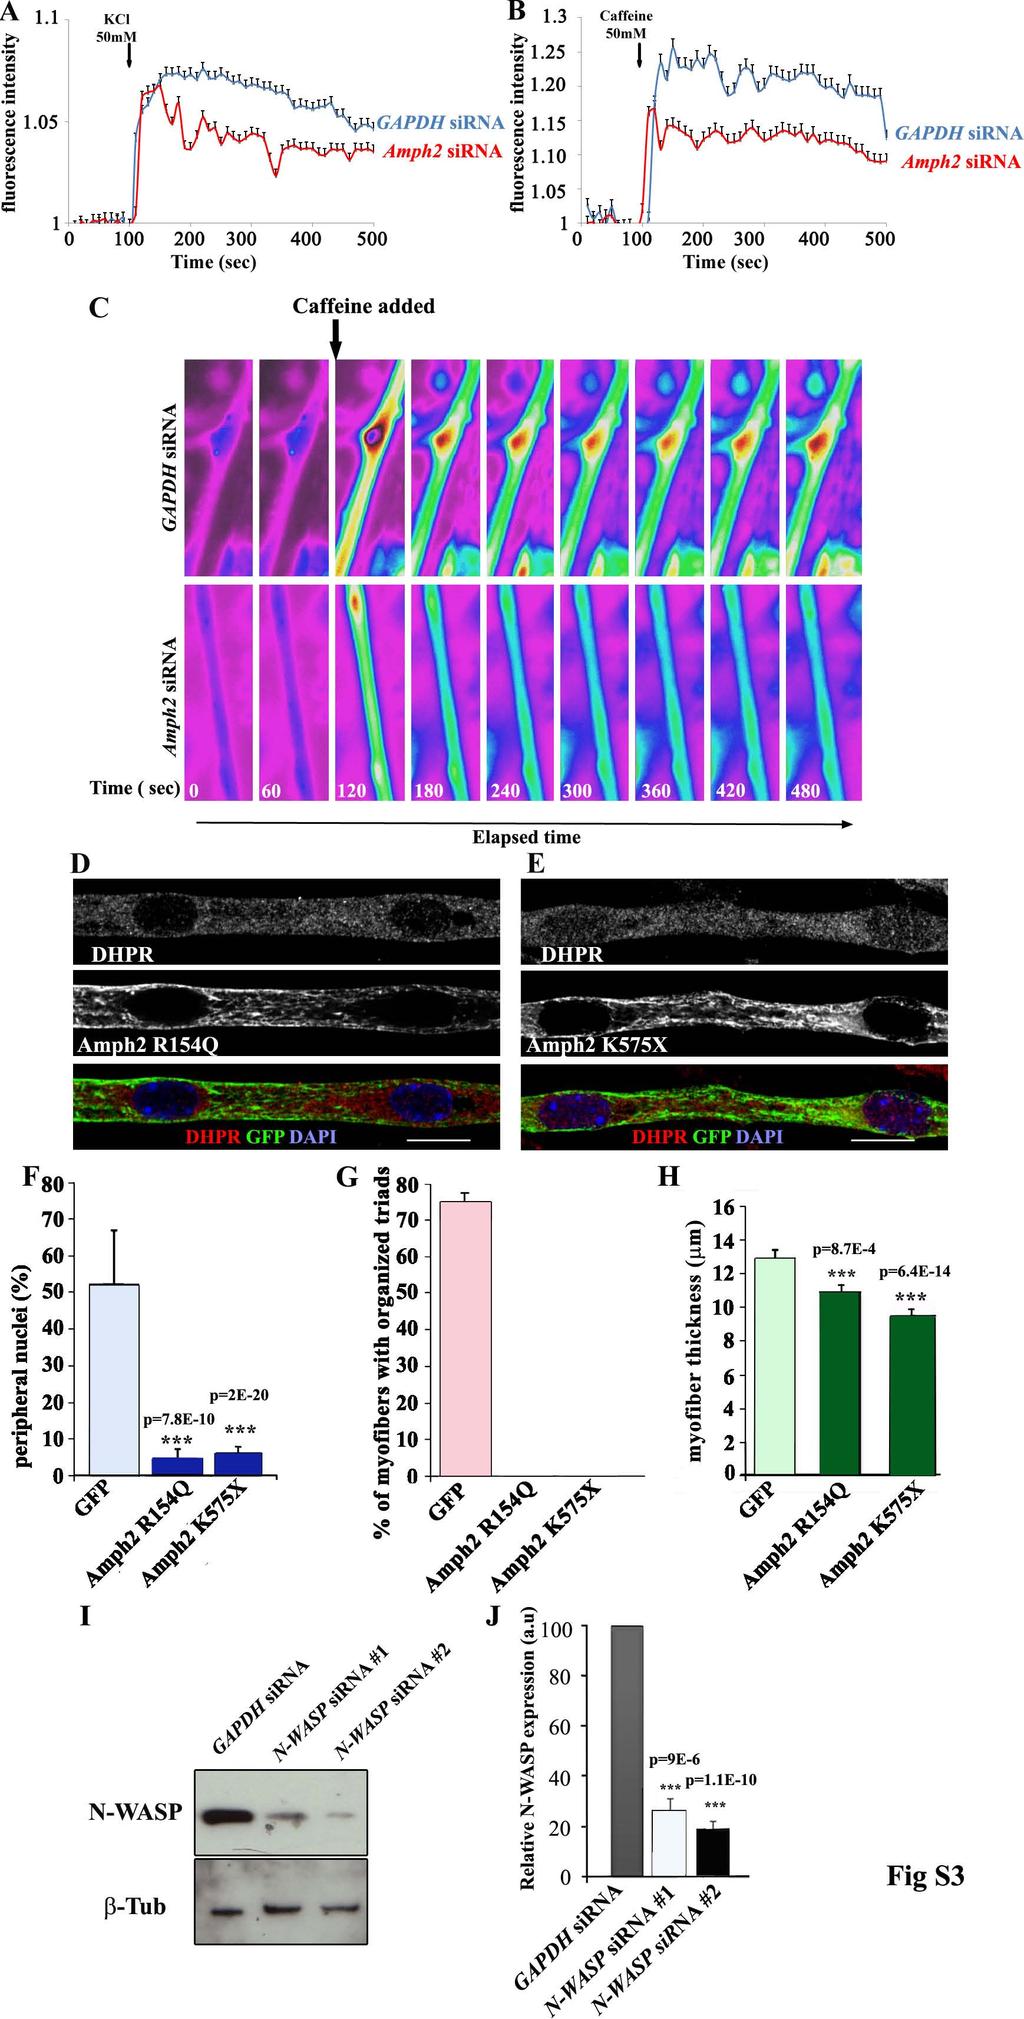
5 Figure S3: Calcium responses in Amph2-depleted myofibers. Effects of N-WASP depletion and Amph2 mutations in cultured primary myofibers A-B) Time course of Fluo-4 fluorescence intensity (F/F0) in steady state and after KCl (A) or Caffeine (B) stimulation of WT primary myofibers transfected with GAPDH sirna (blue line) or Amph2 sirna (red line), treated with agrin for 10 days. C) Images from a representative time-lapse calcium imaging of Fluo-4 fluorescence in steady state (0 and 60 sec) and after Caffeine stimulation (arrow) of WT primary myofibers transfected with GAPDH sirna (top) or Amph2 sirna (bottom), treated with agrin for 10 days. D-E) Representative immunofluorescence images of WT primary myofibers expressing GFP-Amph2 R154Q (D) or GFP-Amph2 K575X (E), treated with agrin for 10 days and immunostained for DHPR (red), triadin (green) and DAPI (blue). Bars, 15 μm. F) Quantification of peripheral nuclei in myofibers expressing GFP, GFP-Amph2 R154Q or GFP-Amph2 K575X and treated with agrin for 10 days. Error bars, s.e.m. p values from t-test (GFP vs GFP-Amph2 R154Q or GFP-Amph2 K575X condition). G) Quantification of transversal triads in myofibers expressing GFP, GFP-Amph2 R154Q or GFP-Amph2 K575X and treated with agrin for 10 days. Error bars, s.e.m. p values from t-test (GFP vs GFP-Amph2 R154Q or GFP-Amph2 K575X condition). H) Quantification of myofiber thickness in myofibers expressing GFP or Amph2 GFP R154Q or Amph2 GFP K575X myofibers and treated with agrin for 10 days. Error bars, s.e.m. p values from t-test (GFP vs GFP-Amph2 R154Q or GFP-Amph2 K575X condition). I) Western blot with N-WASP and -Tubulin antibodies of myofibers transfected with GAPDH-siRNA and N-WASP sirna and treated with agrin for 10 days. J) Histogram of the relative expression of N-WASP in myofibers transfected with GAPDH sirna and N-WASP sirna and treated with agrin for 10 days. Error bars, s.e.m. p values from t-test. 5
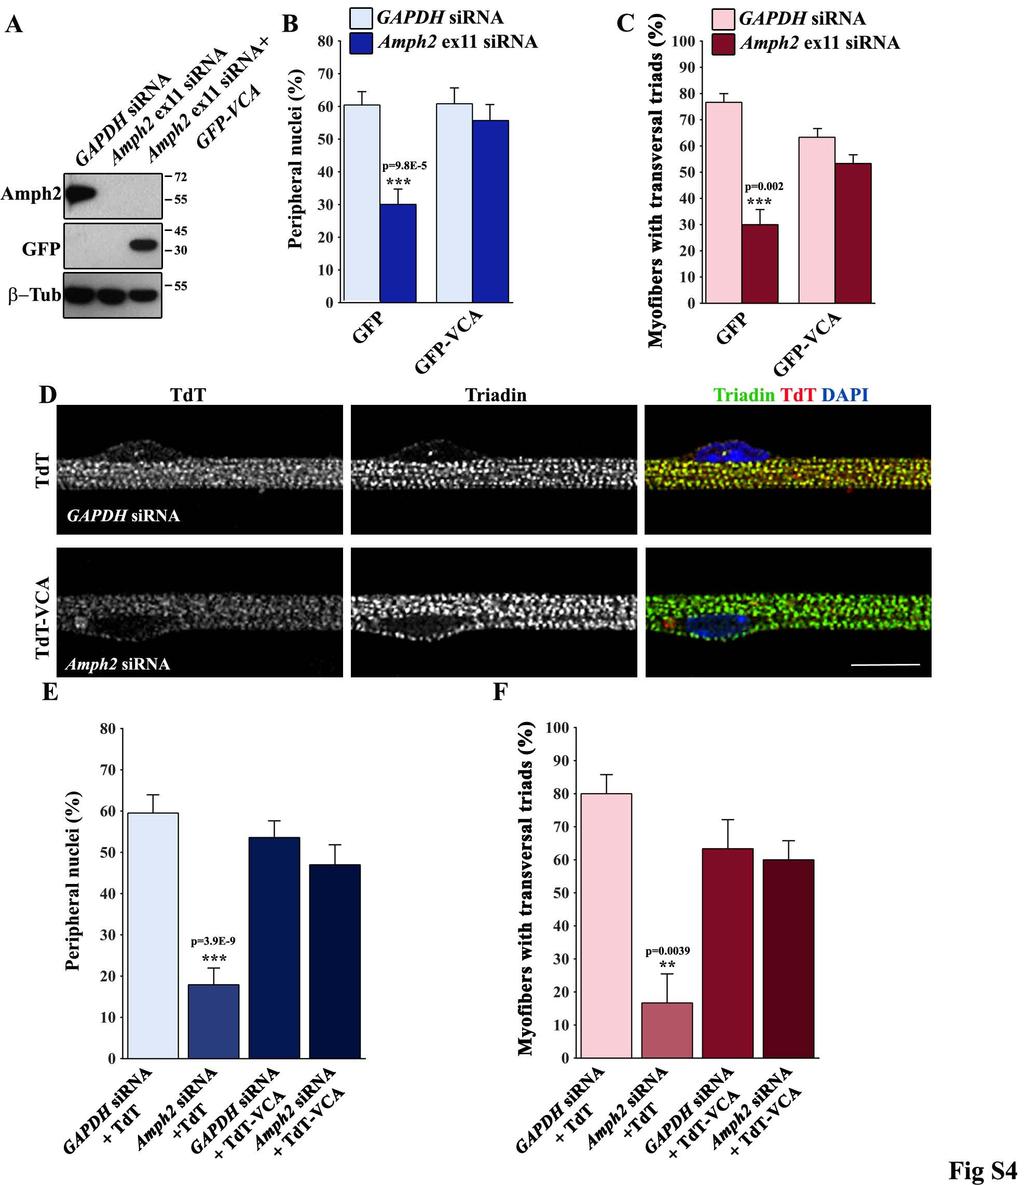
6 Fig S4: Specific role of Amph2 in CNM phenotype and rescue by constitutively active N- WASP A) Western blot with Amph2, GFP and -Tubulin antibodies of myofibers transfected with GAPDH sirna, Amph2 ex11 sirna or Amph2 ex11 sirna and VCA-GFP, treated with agrin for 10 days. B) Quantification of peripheral nuclei in myofibers transfected with GAPDH sirna (light blue fill) or Amph2 ex11 sirna (blue), GFP or GFP-VCA, and treated with agrin for 10 days. Error bars, s.e.m. p values from t-test (GAPDH sirna vs Amph2 ex11 sirna). C) Quantification of transversal triads in myofibers transfected with GAPDH sirna (light blue fill) or Amph2 ex11 sirna (blue), GFP or GFP-VCA, and treated with agrin for 10 days. Error bars, s.e.m. p values from t-test (GAPDH sirna vs Amph2 ex11 sirna). D) Representative immunofluorescence images of myofibers transfected with Amph2 ex3 sirna and TdT (top) or TdT-VCA (bottom), treated with agrin for 10 days and stained for DHPR (red) and DAPI (blue). E) Quantification of peripheral nuclei in myofibers transfected with GAPDH sirna or Amph2 sirna, TdT or TdT-VCA, treated with agrin for 10 days. Error bars, s.e.m. p values from t-test (GAPDH sirna vs Amph2 sirna). F) Quantification of the percentage of transversal triads in myofibers transfected with GAPDH sirna or Amph2 sirna, TdT or TdT-VCA, treated with agrin for 10 days. Error bars, s.e.m. p values from t-test (GAPDH sirna vs Amph2 sirna). 6
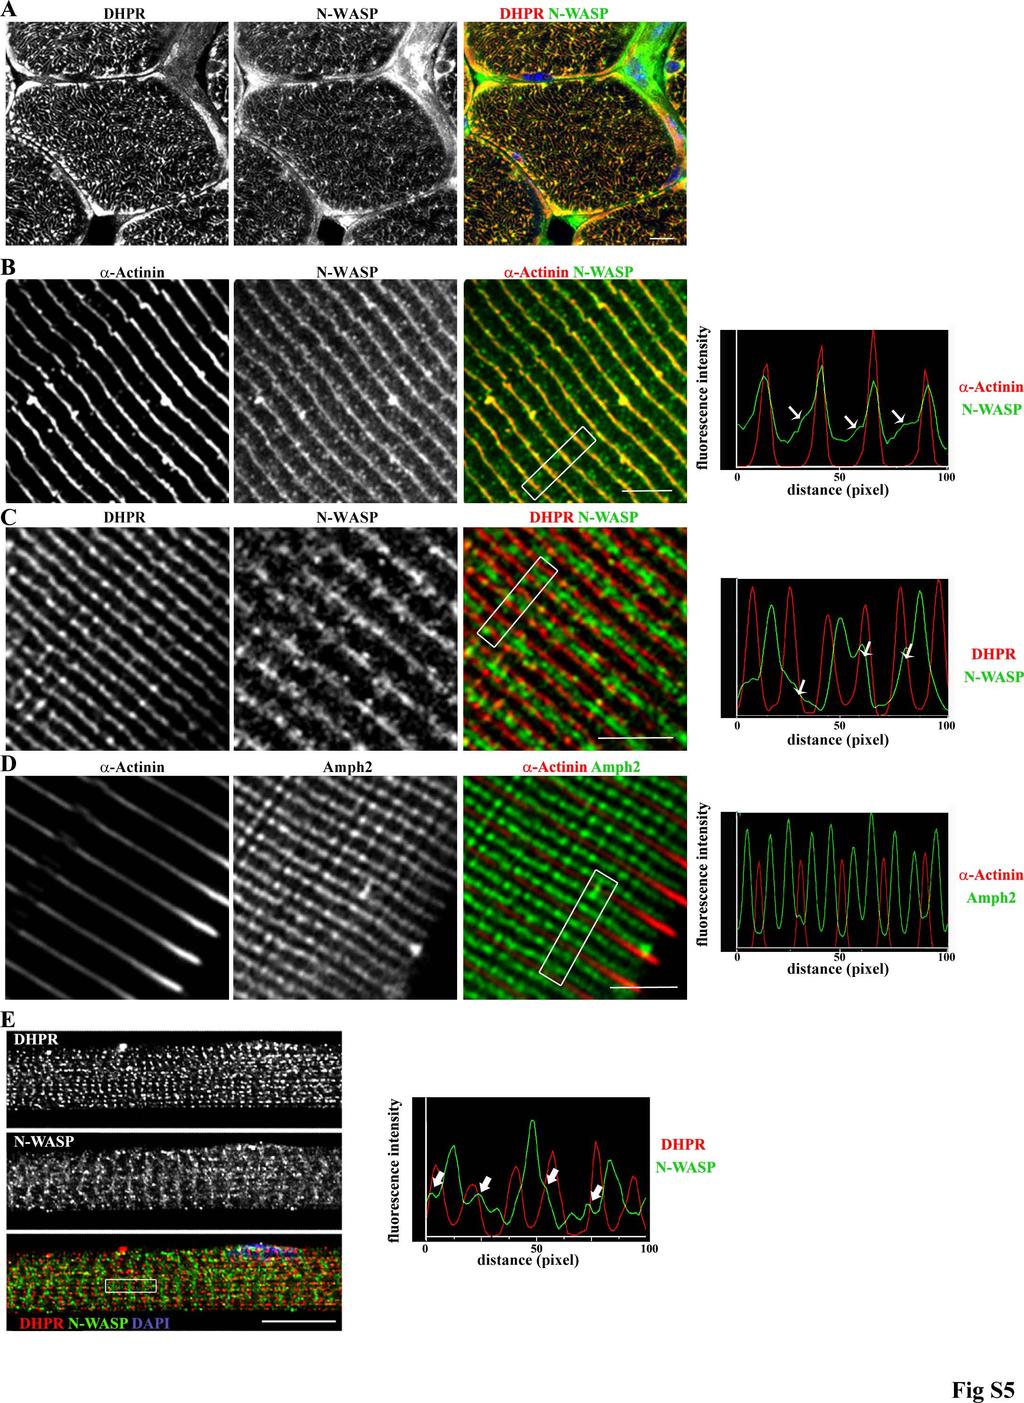
7 Figure S5: Amph2 and N-WASP localization in mouse muscle A) Representative immunofluorescence images of a transversal section of mouse muscle immunostained for DHPR (red) and N-WASP (green). Bar, 10 μm. B) Left panels: representative immunofluorescence images of isolated mouse muscle fibers, immunostained for -actinin (red) and N-WASP (green). Right panel: line-scan of indicated regions in the left panels showing average intensity of N-WASP (green) and - actinin (red). Bar, 1 μm. C) Left panels: representative immunofluorescence images of an isolated mouse muscle fibers, immunostained for DHPR (red) and N-WASP (green). Right panel: line-scan of indicated regions in the left panels showing average intensity of N-WASP (green) and DHPR (red) stainings, respectively. Bar, 1 μm. D) Left panels: representative immunofluorescence images of an isolated mouse muscle fiber, immunostained for -actinin (red) and Amph2 (green). Right panel: line-scan analysis of indicated regions in the left panel showing average intensity of Amph2 staining (green) and -actinin (red) respectively. Bar, 1 μm. E) Left panel: Representative immunofluorescence images of WT primary myofibers treated with agrin for 10 days and immunostained for DHPR (red), N-WASP (green) and DAPI (blue). Bar, 15 μm; Right panel: line-scan of indicated region in the left panel showing average intensity of N-WASP (green) and DHPR (red), respectively. Bar, 1 μm. 7
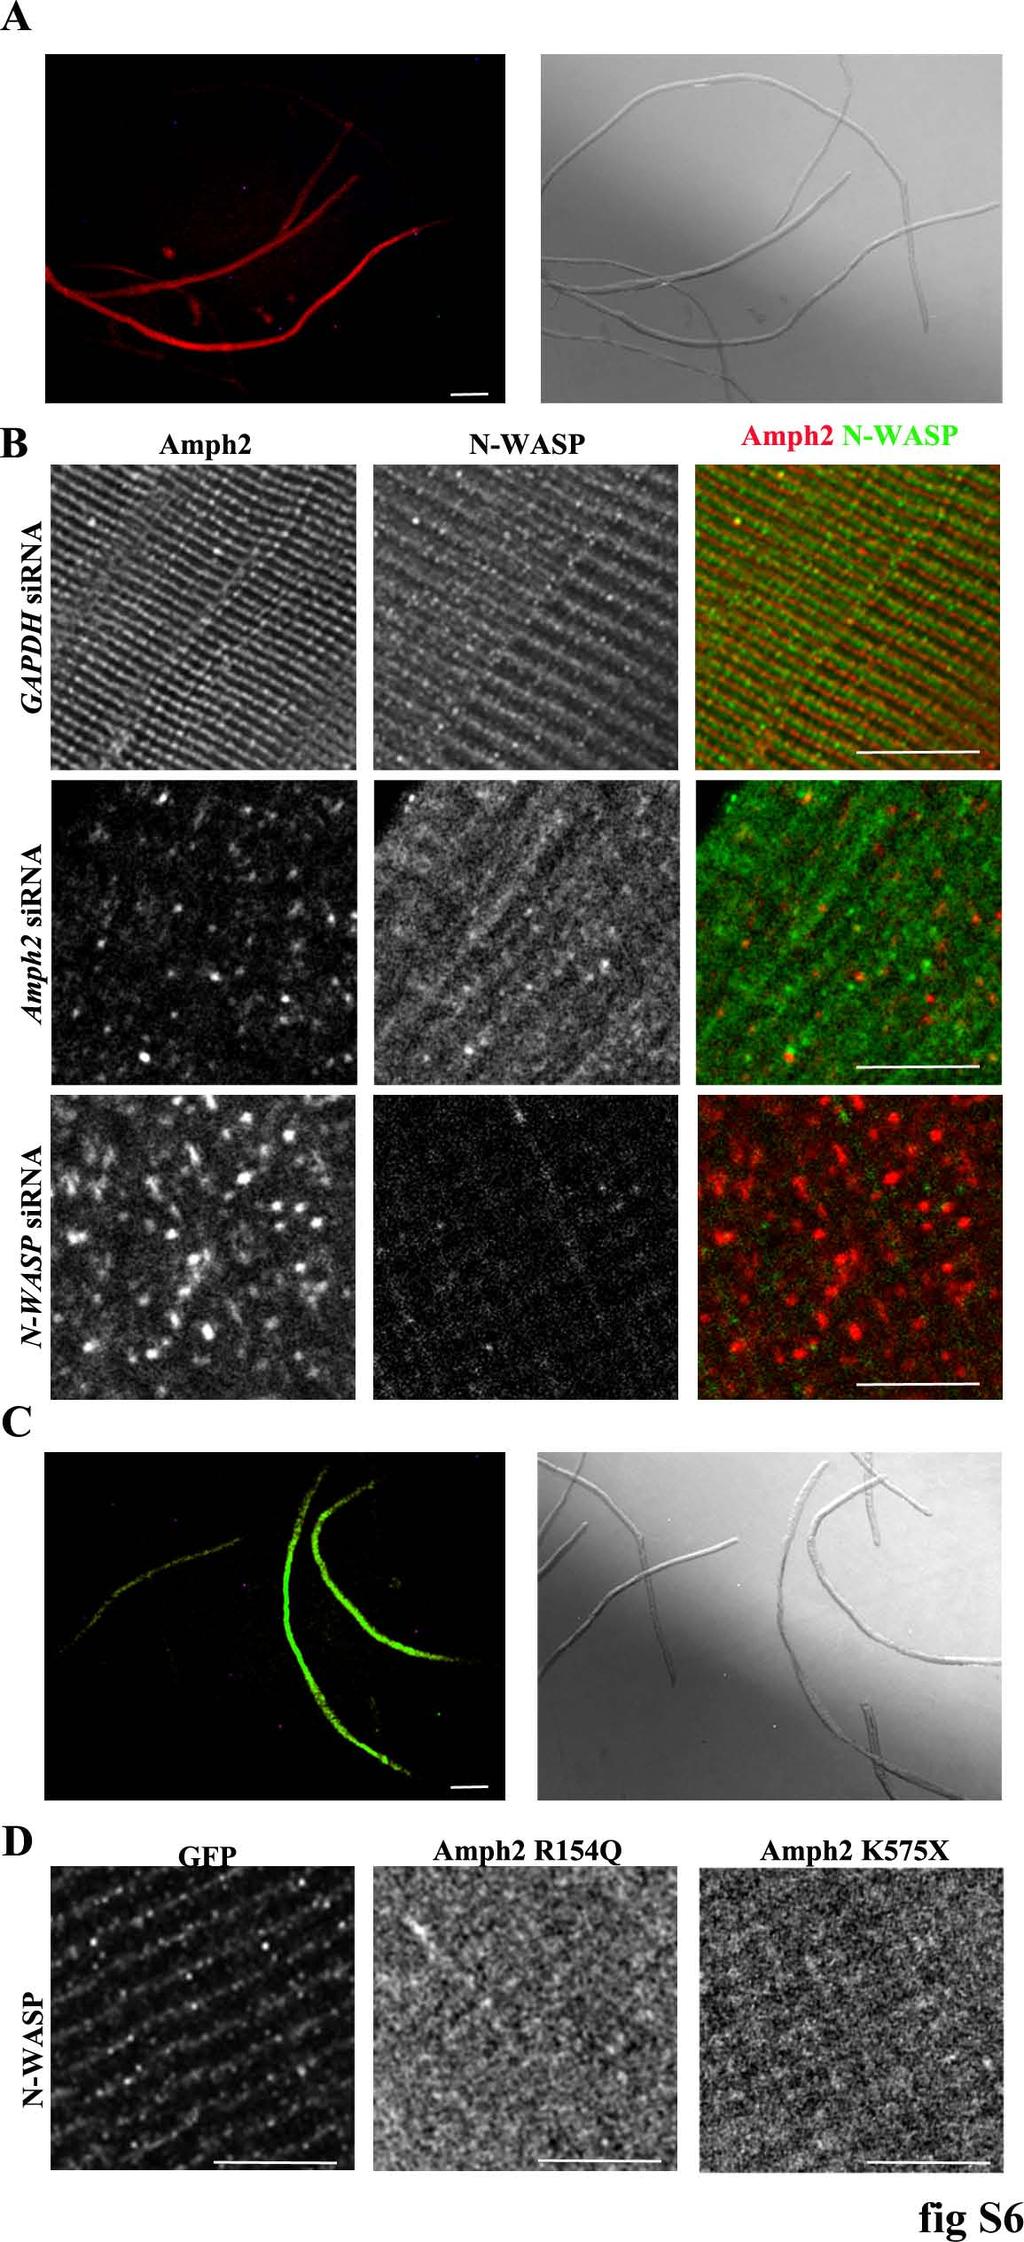
8 Figure S6: in vivo sirna and plasmid DNA electroporation and fiber isolation A) Representative images of isolated muscle fibers 10 days after electroporation of sirna and TdT, showing negative (not expressing TdT) and positive (expressing TdT) myofibers. Left panel: TdT fluorescence. Right panel: Brightfield. Bar, 100 μm. B) Representative immunofluorescence images of an isolated mouse muscle fibers, electroporated with GAPDH sirna, Amph2 sirna or N-WASP sirna, and immunostained for Amph2 (red) and N-WASP (green). Bar, 1 μm. C) Representative image of isolated muscle fibers 10 days after electroporation of GFPtagged vectors, showing negative (not expressing GFP) and positive (expressing GFP) myofibers. Left panel: GFP fluorescence. Right panel: Brightfield. Bar, 100 μm. D) Representative immunofluorescence images of an isolated mouse muscle fibers, electroporated with GFP, GFP-Amph2-R154Q and GFP-Amph2-K573X, and immunostained for N-WASP. Bars, 1 μm. 8
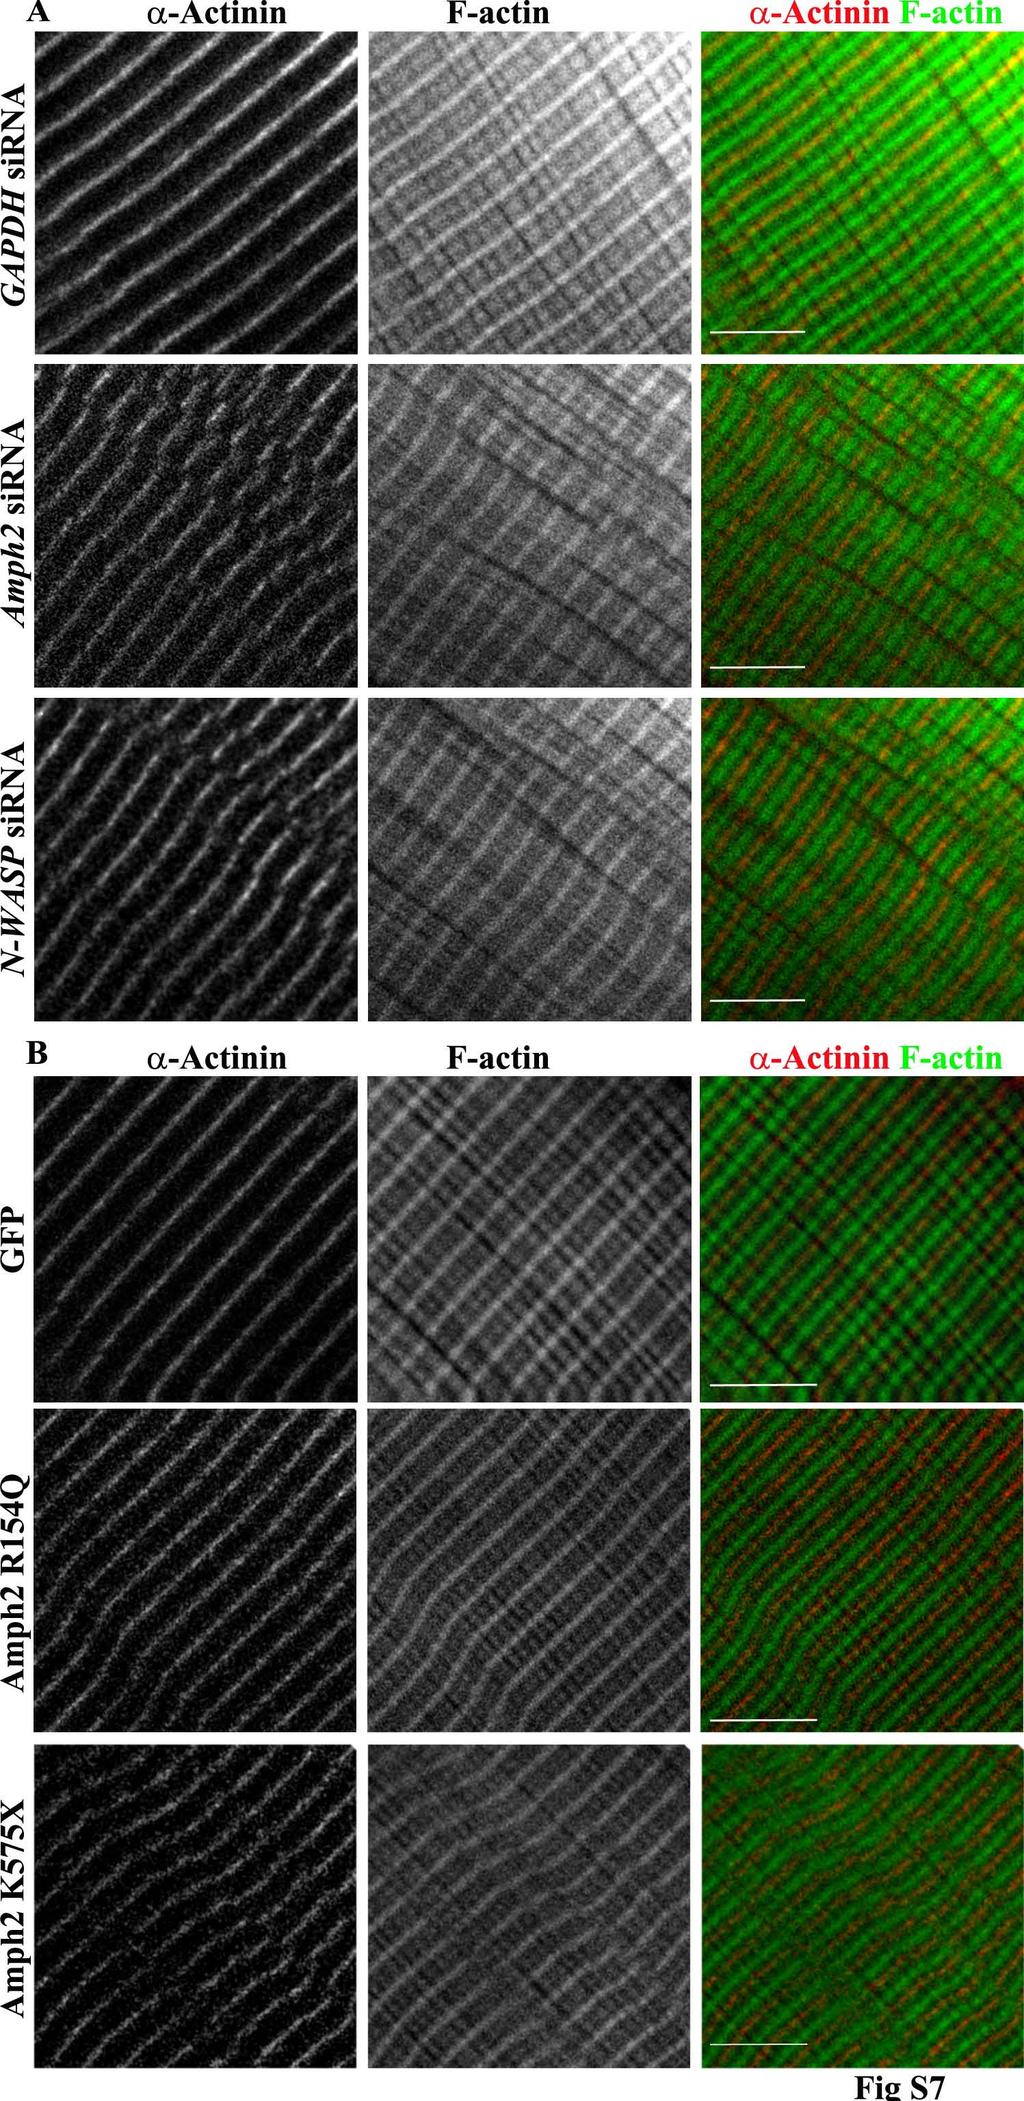
9 Figure S7: -actinin and F-actin organization in myofibers A) Representative immunofluorescence images of an isolated mouse muscle fiber electroporated with GAPDH sirna, Amph2 sirna and N-WASP sirna, immunostained for -actinin (red) and F-Actin (green). Bars, 1 μm. B) Representative immunofluorescence images of isolated mouse muscle fiber electroporated with CTRL GFP, GFP-AMPH2 R154Q and GFP-AMPH2K573X, respectively, and immunostained for -actinin (red) and F-Actin (green). Bars, 1 μm. 9
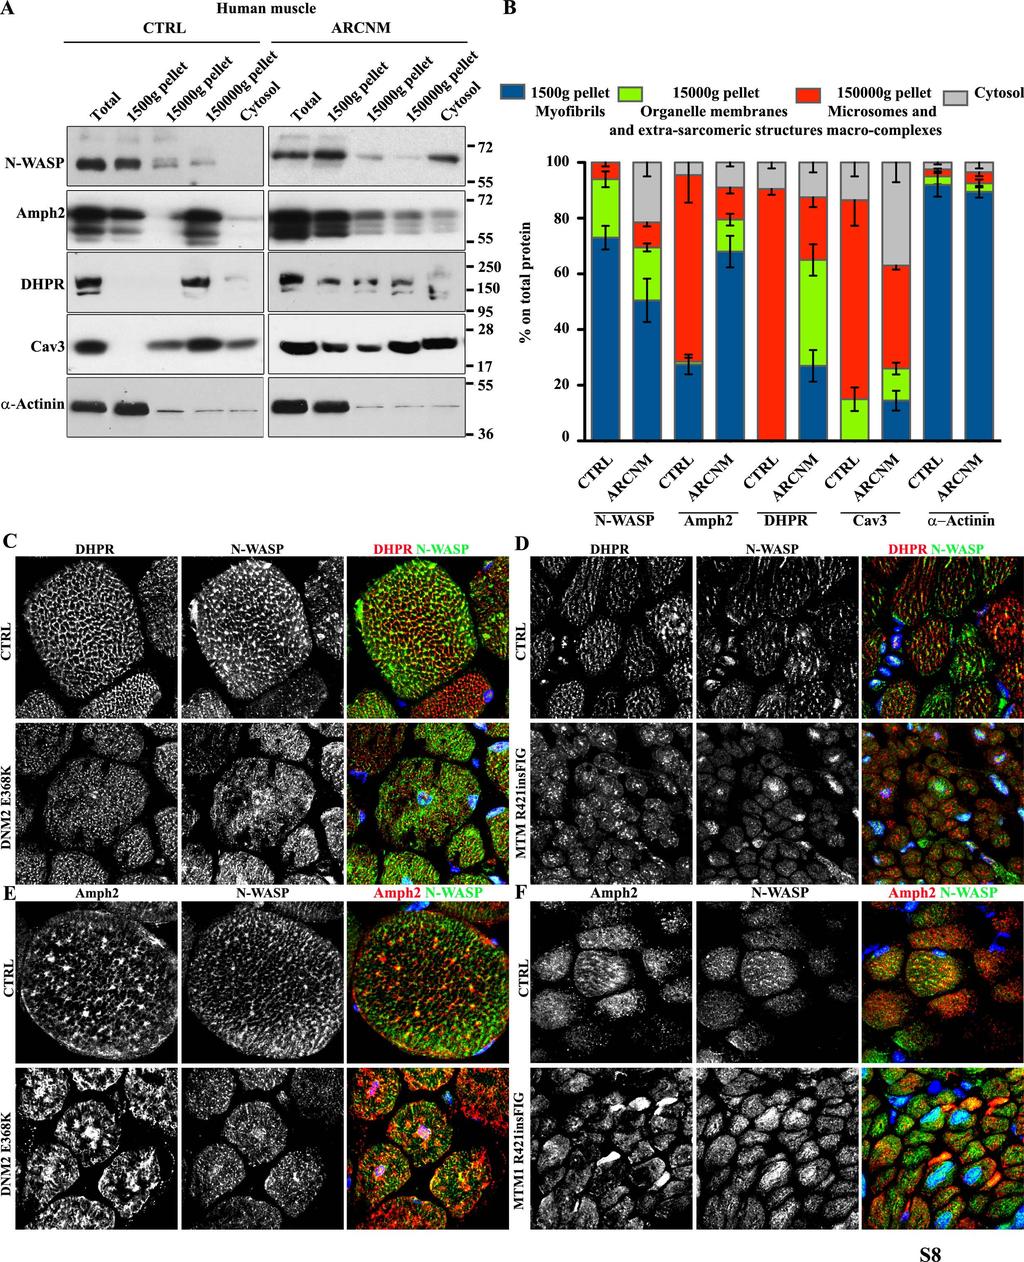
10 Figure S8: N-WASP and Amph2 localization in muscle from healthy, XLCNM and ADCNM patients A) Western blot analysis of control and ARCNM human biopsies homogenates after differential centrifugation, with N-WASP, Amph2, DHPR, Caveolin-3 (cav3) and -Actinin antibodies. B) Histogram with the quantification of (A), corresponding to the distribution (relative percentage of total protein) of N-WASP, Amph2, DHPR, cav3 and Actinin in different cellular fractions (1500g - myofibrils, 15000g -Organelle membranes and extrasarcomeric structures, g - microsomes and macrocomplexes and cytosol). Error bars, s.e.m C) Representative immunofluorescence images of transversal sections of human muscle from healthy donor (top) and ADCNM patient carrying DNM2 Q368K mutation (bottom), immunostained for DHPR (red), N-WASP (green) and DAPI (blue). Bars, 15 μm. D) Representative immunofluorescence images of transversal sections of human muscle from healthy donor (CTRL, top) or XLCNM patient carrying R421insFIG mutation (bottom), immunostained for DHPR (red), N-WASP (green) and DAPI (blue). Bars, 15 μm. E) Representative immunofluorescence images of transversal sections of human muscle from healthy donor (CTRL, top) or ADCNM patient carrying DNM2 Q368K mutation (bottom), immunostained for Amph2 (red), N-WASP (green) and DAPI (blue). Bars, 15 μm. F) Representative immunofluorescence images of transversal sections of human muscle from healthy donor (CTRL, top) or XLCNM patient carrying R421insFIG (bottom), immunostained for Amph2 (red), N-WASP (green) and DAPI (blue). Bars, 15 μm. 10
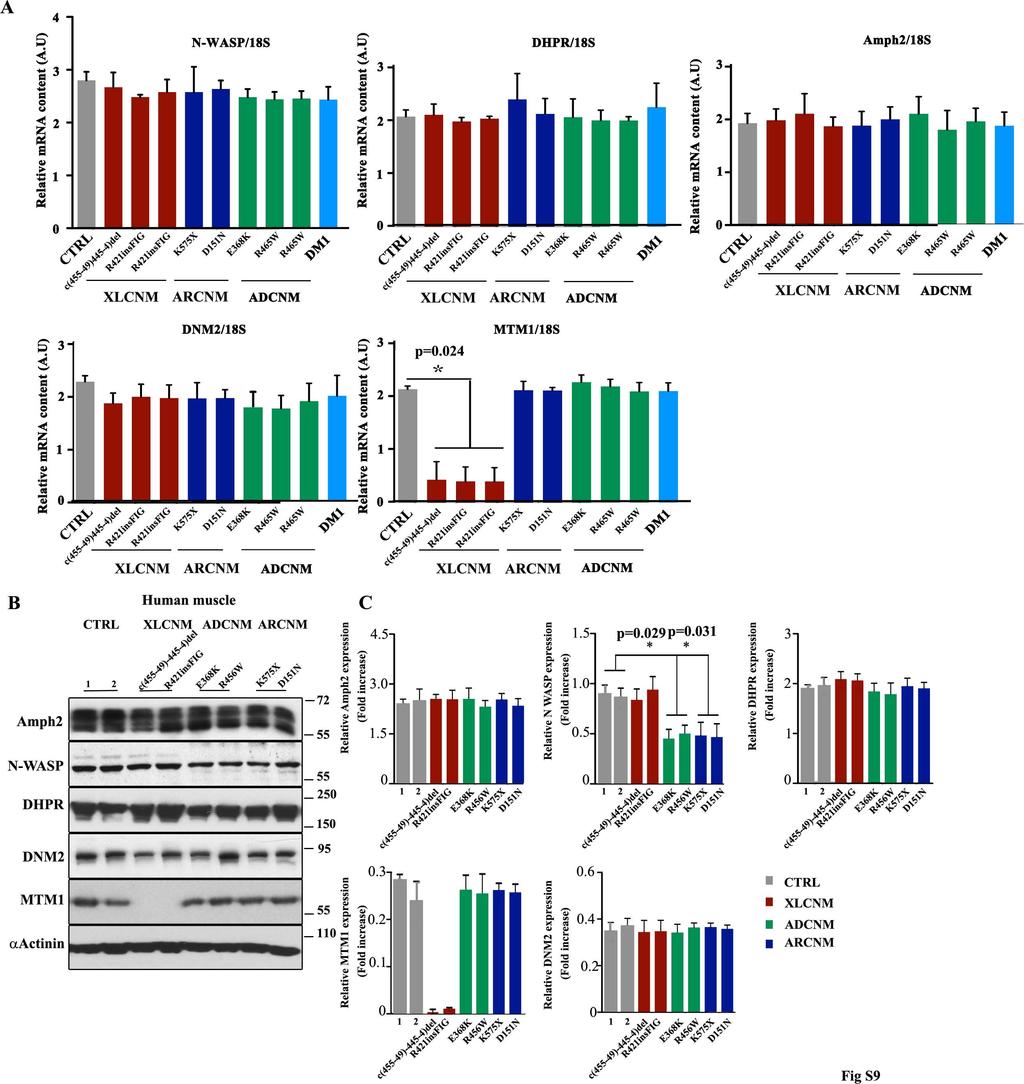
11 Fig S9: mrna and protein expression in muscle from healthy, XLCNM, ARCNM, ADCNM and DM1 patients A) Relative mrna expression of N-WASP, DHPR, Amph2, DNM2 and MTM1 in muscle biopsies from healthy (CTRL), XLCNM, ARCNM, ADCNM and DM1 patients assessed by real time PCR. B) Western blot with Amph2, N-WASP, DHPR, DNM2, MTM1 and -Actinin antibodies in CTRL, XLCNM, ADCNM, ARCNM from healthy or patient muscle biopsies carrying the indicated mutations. Levels may differ depending on patients. C) Histograms of the relative protein expression of Amph2, N-WASP, DHPR, DNM2, MTM1 and DNM2 in CTRL, XLCNM, ADCNM, ARCNM from healthy or patient muscle biopsies showed in (B). Error bars, s.e.m. p values from t-test (patient versus ctrl conditions). 11
12
13
14
15
16
17
18
19
20
Subject Categories Musculoskeletal System DOI /emmm Received 15 July 2014 Revised 19 August 2014 Accepted 26 August 2014
 Research Article N-WASP is required for Amphiphysin-2/BIN1- dependent nuclear positioning and triad organization in skeletal muscle and is involved in the pathophysiology of centronuclear myopathy Sestina
Supplementary Figure 1.TRIM33 binds β-catenin in the nucleus. a & b, Co-IP of endogenous TRIM33 with β-catenin in HT-29 cells (a) and HEK 293T cells
 and HEK 293T cells") Supplementary Figure 1.TRIM33 binds β-catenin in the nucleus. a & b, Co-IP of endogenous TRIM33 with β-catenin in HT-29 cells (a) and HEK 293T cells (b). TRIM33 was immunoprecipitated, and the amount of
Supplementary Figure 1.TRIM33 binds β-catenin in the nucleus. a & b, Co-IP of endogenous TRIM33 with β-catenin in HT-29 cells (a) and HEK 293T cells (b). TRIM33 was immunoprecipitated, and the amount of
Supplementary information. The Light Intermediate Chain 2 Subpopulation of Dynein Regulates Mitotic. Spindle Orientation
 Supplementary information The Light Intermediate Chain 2 Subpopulation of Dynein Regulates Mitotic Spindle Orientation Running title: Dynein LICs distribute mitotic functions. Sagar Mahale a, d, *, Megha
Supplemental Materials. STK16 regulates actin dynamics to control Golgi organization and cell cycle
 Supplemental Materials STK16 regulates actin dynamics to control Golgi organization and cell cycle Juanjuan Liu 1,2,3, Xingxing Yang 1,3, Binhua Li 1, Junjun Wang 1,2, Wenchao Wang 1, Jing Liu 1, Qingsong
Supplementary Figure 1: GFAP positive nerves in patients with adenocarcinoma of
 SUPPLEMENTARY FIGURES AND MOVIE LEGENDS Supplementary Figure 1: GFAP positive nerves in patients with adenocarcinoma of the pancreas. (A) Images of nerves stained for GFAP (green), S100 (red) and DAPI
SUPPLEMENTARY INFORMATION
 doi:10.1038/nature12652 Supplementary Figure 1. PRDM16 interacts with endogenous EHMT1 in brown adipocytes. Immunoprecipitation of PRDM16 complex by flag antibody (M2) followed by Western blot analysis
SUPPLEMENTARY INFORMATION
 DOI: 10.1038/ncb2566 Figure S1 CDKL5 protein expression pattern and localization in mouse brain. (a) Multiple-tissue western blot from a postnatal day (P) 21 mouse probed with an antibody against CDKL5.
SUPPLEMENTARY INFORMATION
 DOI: 1.138/ncb222 / b. WB anti- WB anti- ulin Mitotic index (%) 14 1 6 2 T (h) 32 48-1 1 2 3 4 6-1 4 16 22 28 3 33 e. 6 4 2 Time (min) 1-6- 11-1 > 1 % cells Figure S1 depletion leads to mitotic defects
Supplementary Figure 1. Spatial distribution of LRP5 and β-catenin in intact cardiomyocytes. (a) and (b) Immunofluorescence staining of endogenous
 and (b) Immunofluorescence staining of endogenous") Supplementary Figure 1. Spatial distribution of LRP5 and β-catenin in intact cardiomyocytes. (a) and (b) Immunofluorescence staining of endogenous LRP5 in intact adult mouse ventricular myocytes (AMVMs)
Supplementary Figure 1. Spatial distribution of LRP5 and β-catenin in intact cardiomyocytes. (a) and (b) Immunofluorescence staining of endogenous LRP5 in intact adult mouse ventricular myocytes (AMVMs)
Supplementary Figures
 Supplementary Figures Supplementary Figure 1 Characterization of stable expression of GlucB and sshbira in the CT26 cell line (a) Live cell imaging of stable CT26 cells expressing green fluorescent protein
Cells and reagents. Synaptopodin knockdown (1) and dynamin knockdown (2)
 and dynamin knockdown (2)") Supplemental Methods Cells and reagents. Synaptopodin knockdown (1) and dynamin knockdown (2) podocytes were cultured as described previously. Staurosporine, angiotensin II and actinomycin D were all obtained
Supplemental Methods Cells and reagents. Synaptopodin knockdown (1) and dynamin knockdown (2) podocytes were cultured as described previously. Staurosporine, angiotensin II and actinomycin D were all obtained
Effects of UBL5 knockdown on cell cycle distribution and sister chromatid cohesion
 Supplementary Figure S1. Effects of UBL5 knockdown on cell cycle distribution and sister chromatid cohesion A. Representative examples of flow cytometry profiles of HeLa cells transfected with indicated
Figure S1. Reduction in glomerular mir-146a levels correlate with progression to higher albuminuria in diabetic patients.
 Supplementary Materials Supplementary Figures Figure S1. Reduction in glomerular mir-146a levels correlate with progression to higher albuminuria in diabetic patients. Figure S2. Expression level of podocyte
Supplemental Figure 1. Intracranial transduction of a modified ptomo lentiviral vector in the mouse
 Supplemental figure legends Supplemental Figure 1. Intracranial transduction of a modified ptomo lentiviral vector in the mouse hippocampus targets GFAP-positive but not NeuN-positive cells. (A) Stereotaxic
T H E J O U R N A L O F C E L L B I O L O G Y
 T H E J O U R N A L O F C E L L B I O L O G Y Supplemental material Krenn et al., http://www.jcb.org/cgi/content/full/jcb.201110013/dc1 Figure S1. Levels of expressed proteins and demonstration that C-terminal
c Ischemia (30 min) Reperfusion (8 w) Supplementary Figure bp 300 bp Ischemia (30 min) Reperfusion (4 h) Dox 20 mg/kg i.p.
 Reperfusion (8 w) Supplementary Figure bp 300 bp Ischemia (30 min) Reperfusion (4 h) Dox 20 mg/kg i.p.") a Marker Ripk3 +/ 5 bp 3 bp b Ischemia (3 min) Reperfusion (4 h) d 2 mg/kg i.p. 1 w 5 w Sacrifice for IF size A subset for echocardiography and morphological analysis c Ischemia (3 min) Reperfusion (8
a Marker Ripk3 +/ 5 bp 3 bp b Ischemia (3 min) Reperfusion (4 h) d 2 mg/kg i.p. 1 w 5 w Sacrifice for IF size A subset for echocardiography and morphological analysis c Ischemia (3 min) Reperfusion (8
SUPPLEMENTARY FIGURES
 SUPPLEMENTARY FIGURES Supplementary Figure 1. (A) Left, western blot analysis of ISGylated proteins in Jurkat T cells treated with 1000U ml -1 IFN for 16h (IFN) or left untreated (CONT); right, western
Supplementary Figure 1 Expression of Crb3 in mouse sciatic nerve: biochemical analysis (a) Schematic of Crb3 isoforms, ERLI and CLPI, indicating the
 Schematic of Crb3 isoforms, ERLI and CLPI, indicating the") Supplementary Figure 1 Expression of Crb3 in mouse sciatic nerve: biochemical analysis (a) Schematic of Crb3 isoforms, ERLI and CLPI, indicating the location of the transmembrane (TM), FRM binding (FB)
Supplementary Figure 1 Expression of Crb3 in mouse sciatic nerve: biochemical analysis (a) Schematic of Crb3 isoforms, ERLI and CLPI, indicating the location of the transmembrane (TM), FRM binding (FB)
(a) Significant biological processes (upper panel) and disease biomarkers (lower panel)
 Significant biological processes (upper panel) and disease biomarkers (lower panel)") Supplementary Figure 1. Functional enrichment analyses of secretomic proteins. (a) Significant biological processes (upper panel) and disease biomarkers (lower panel) 2 involved by hrab37-mediated secretory
Supplementary Figure 1. Functional enrichment analyses of secretomic proteins. (a) Significant biological processes (upper panel) and disease biomarkers (lower panel) 2 involved by hrab37-mediated secretory
SUPPLEMENTARY INFORMATION
 DOI:.38/ncb3399 a b c d FSP DAPI 5mm mm 5mm 5mm e Correspond to melanoma in-situ Figure a DCT FSP- f MITF mm mm MlanaA melanoma in-situ DCT 5mm FSP- mm mm mm mm mm g melanoma in-situ MITF MlanaA mm mm
Supplementary Information. Cofilin Regulates Nuclear Architecture through a Myosin-II Dependent Mechanotransduction Module
 Supplementary Information Cofilin Regulates Nuclear Architecture through a Myosin-II Dependent Mechanotransduction Module O Neil Wiggan, Bryce Schroder, Diego Krapf, James R. Bamurg and Jennifer G. DeLuca
Supplementary Figure 1: si-craf but not si-braf sensitizes tumor cells to radiation.
 Supplementary Figure 1: si-craf but not si-braf sensitizes tumor cells to radiation. (a) Embryonic fibroblasts isolated from wildtype (WT), BRAF -/-, or CRAF -/- mice were irradiated (6 Gy) and DNA damage
marker. DAPI labels nuclei. Flies were 20 days old. Scale bar is 5 µm. Ctrl is
 Supplementary Figure 1. (a) Nos is detected in glial cells in both control and GFAP R79H transgenic flies (arrows), but not in deletion mutant Nos Δ15 animals. Repo is a glial cell marker. DAPI labels
SUPPLEMENTARY FIGURE LEGENDS. atypical adenomatous hyperplasias (AAH); Grade II: adenomas; Grade III: adenocarcinomas;
; Grade II: adenomas; Grade III: adenocarcinomas;") SUPPLEMENTARY FIGURE LEGENDS Supplementary Figure S1: Tumor grades in Ras G12D ; p53 / lung tumors. Representative histology (H&E) of K-Ras G12D ; p53 / lung tumors 13 weeks after tumor initiation. Grade
SUPPLEMENTARY FIGURE LEGENDS Supplementary Figure S1: Tumor grades in Ras G12D ; p53 / lung tumors. Representative histology (H&E) of K-Ras G12D ; p53 / lung tumors 13 weeks after tumor initiation. Grade
F-actin VWF Vinculin. F-actin. Vinculin VWF
 a F-actin VWF Vinculin b F-actin VWF Vinculin Supplementary Fig. 1. WPBs in HUVECs are located along stress fibers and at focal adhesions. (a) Immunofluorescence images of f-actin (cyan), VWF (yellow),
Supplementary Figure S1: Defective heterochromatin repair in HGPS progeroid cells
 Supplementary Figure S1: Defective heterochromatin repair in HGPS progeroid cells Immunofluorescence staining of H3K9me3 and 53BP1 in PH and HGADFN003 (HG003) cells at 24 h after γ-irradiation. Scale bar,
Supplemental Figure 1. Western blot analysis indicated that MIF was detected in the fractions of
 Supplemental Figure Legends Supplemental Figure 1. Western blot analysis indicated that was detected in the fractions of plasma membrane and cytosol but not in nuclear fraction isolated from Pkd1 null
supplementary information
 DOI: 10.1038/ncb2133 Figure S1 Actomyosin organisation in human squamous cell carcinoma. (a) Three examples of actomyosin organisation around the edges of squamous cell carcinoma biopsies are shown. Myosin
Supplementary Figure 1 Chemokine and chemokine receptor expression during muscle regeneration (a) Analysis of CR3CR1 mrna expression by real time-pcr
 Analysis of CR3CR1 mrna expression by real time-pcr") Supplementary Figure 1 Chemokine and chemokine receptor expression during muscle regeneration (a) Analysis of CR3CR1 mrna expression by real time-pcr at day 0, 1, 4, 10 and 21 post- muscle injury. (b)
Supplementary Figure 1 Chemokine and chemokine receptor expression during muscle regeneration (a) Analysis of CR3CR1 mrna expression by real time-pcr at day 0, 1, 4, 10 and 21 post- muscle injury. (b)
Nature Structural and Molecular Biology: doi: /nsmb Supplementary Figure 1
 Supplementary Figure 1 Mutational analysis of the SA2-Scc1 interaction in vitro and in human cells. (a) Autoradiograph (top) and Coomassie stained gel (bottom) of 35 S-labeled Myc-SA2 proteins (input)
Fig. S1. Subcellular localization of overexpressed LPP3wt-GFP in COS-7 and HeLa cells. Cos7 (top) and HeLa (bottom) cells expressing for 24 h human
 and HeLa (bottom) cells expressing for 24 h human") Fig. S1. Subcellular localization of overexpressed LPP3wt-GFP in COS-7 and HeLa cells. Cos7 (top) and HeLa (bottom) cells expressing for 24 h human LPP3wt-GFP, fixed and stained for GM130 (A) or Golgi97
Fig. S1. Subcellular localization of overexpressed LPP3wt-GFP in COS-7 and HeLa cells. Cos7 (top) and HeLa (bottom) cells expressing for 24 h human LPP3wt-GFP, fixed and stained for GM130 (A) or Golgi97
Loss of Calreticulin Uncovers a Critical Role for Calcium in Regulating Cellular Lipid Homeostasis
 SUPPLEMENTARY MATERIAL Loss of Calreticulin Uncovers a Critical Role for Calcium in Regulating Cellular Lipid Homeostasis Wen-An Wang 1, Wen-Xin Liu 1, Serpen Durnaoglu 2, Sun-Kyung Lee 2, Jihong Lian
MII. Supplement Figure 1. CapZ β2. Merge. 250ng. 500ng DIC. Merge. Journal of Cell Science Supplementary Material. GFP-CapZ β2 DNA
 A GV GVBD MI DNA CapZ β2 CapZ β2 Merge B DIC GFP-CapZ β2 Merge CapZ β2-gfp 250ng 500ng Supplement Figure 1. MII A early MI late MI Control RNAi CapZαβ DNA Actin Tubulin B Phalloidin Intensity(A.U.) n=10
Supplementary Figure S1
 Supplementary Figure S1 Supplementary Figure S1. PARP localization patterns using GFP-PARP and PARP-specific antibody libraries GFP-PARP localization in non-fixed (A) and formaldehyde fixed (B) GFP-PARPx
Supplementary Materials for
 www.sciencetranslationalmedicine.org/cgi/content/full/4/117/117ra8/dc1 Supplementary Materials for Notch4 Normalization Reduces Blood Vessel Size in Arteriovenous Malformations Patrick A. Murphy, Tyson
SUPPLEMENTARY INFORMATION
 DOI: 10.1038/ncb2607 Figure S1 Elf5 loss promotes EMT in mammary epithelium while Elf5 overexpression inhibits TGFβ induced EMT. (a, c) Different confocal slices through the Z stack image. (b, d) 3D rendering
T H E J O U R N A L O F C E L L B I O L O G Y
 T H E J O U R N A L O F C E L L B I O L O G Y Supplemental material Amelio et al., http://www.jcb.org/cgi/content/full/jcb.201203134/dc1 Figure S1. mir-24 regulates proliferation and by itself induces
Supplementary Information
 Supplementary Information Supplementary Figure 1: cholesterol manipulation alters the positioning of autophagosomes in cells, related to figure 1. (a) HeLa cells were treated for 24h under conditions reducing
SUPPLEMENTARY INFORMATION
 SUPPLEMENTARY INFORMATION Supplementary Figure 1. The expression of ephrin-b2 H2BGFP persists in the post-hearingonset organ of Corti and is specifically restricted to supporting cells. Sox2 immunolabeling
Supplementary Fig. 1. GPRC5A post-transcriptionally down-regulates EGFR expression. (a) Plot of the changes in steady state mrna levels versus
 Plot of the changes in steady state mrna levels versus") Supplementary Fig. 1. GPRC5A post-transcriptionally down-regulates EGFR expression. (a) Plot of the changes in steady state mrna levels versus changes in corresponding proteins between wild type and Gprc5a-/-
Supplementary Fig. 1. GPRC5A post-transcriptionally down-regulates EGFR expression. (a) Plot of the changes in steady state mrna levels versus changes in corresponding proteins between wild type and Gprc5a-/-
Supplementary Figure 1. Electroporation of a stable form of β-catenin causes masses protruding into the IV ventricle. HH12 chicken embryos were
 Supplementary Figure 1. Electroporation of a stable form of β-catenin causes masses protruding into the IV ventricle. HH12 chicken embryos were electroporated with β- Catenin S33Y in PiggyBac expression
(a) Schematic diagram of the FS mutation of UVRAG in exon 8 containing the highly instable
 Schematic diagram of the FS mutation of UVRAG in exon 8 containing the highly instable") Supplementary Figure 1. Frameshift (FS) mutation in UVRAG. (a) Schematic diagram of the FS mutation of UVRAG in exon 8 containing the highly instable A 10 DNA repeat, generating a premature stop codon
Supplementary Figure 1. Frameshift (FS) mutation in UVRAG. (a) Schematic diagram of the FS mutation of UVRAG in exon 8 containing the highly instable A 10 DNA repeat, generating a premature stop codon
Tel: ; Fax: ;
 Tel.: +98 216 696 9291; Fax: +98 216 696 9291; E-mail: mrasadeghi@pasteur.ac.ir Tel: +98 916 113 7679; Fax: +98 613 333 6380; E-mail: abakhshi_e@ajums.ac.ir A Soluble Chromatin-bound MOI 0 1 5 0 1 5 HDAC2
T H E J O U R N A L O F C E L L B I O L O G Y
 Supplemental material Díaz et al., http://www.jcb.org/cgi/content/full/jcb.201209151/dc1 T H E J O U R N A L O F C E L L B I O L O G Y Figure S1. Hypoxia induces invadopodia formation in different epithelial
Supplementary Figure 1. SC35M polymerase activity in the presence of Bat or SC35M NP encoded from the phw2000 rescue plasmid.
 1 2 3 4 5 6 7 8 9 10 11 12 13 14 15 16 17 18 19 20 21 22 23 24 25 26 27 Supplementary Figure 1. SC35M polymerase activity in the presence of Bat or SC35M NP encoded from the phw2000 rescue plasmid. HEK293T
Supplementary Figure 1.
 Supplementary Figure 1. Visualization of endoplasmic reticulum-mitochondria interaction by in situ proximity ligation assay. A) Illustration of targeted proteins in mitochondria (M), endoplasmic reticulum
Cesarini et al., http ://www.jcb.org /cgi /content /full /jcb /DC1
 Supplemental material JCB Cesarini et al., http ://www.jcb.org /cgi /content /full /jcb.201504035 /DC1 THE JOU RNAL OF CELL BIO LOGY Figure S1. Lamin A/C depletion generates two distinct phenotypes in
293T cells were transfected with indicated expression vectors and the whole-cell extracts were subjected
 SUPPLEMENTARY INFORMATION Supplementary Figure 1. Formation of a complex between Slo1 and CRL4A CRBN E3 ligase. (a) HEK 293T cells were transfected with indicated expression vectors and the whole-cell
Downregulation of the small GTPase SAR1A: a key event underlying alcohol-induced Golgi fragmentation in hepatocytes
 Downregulation of the small GTPase SAR1A: a key event underlying alcohol-induced Golgi fragmentation in hepatocytes Armen Petrosyan 1*, Pi-Wan Cheng 1,3, Dahn L. Clemens 2,3 & Carol A. Casey 2,3 1 Department
Supplementary Figure 1: Expression of NFAT proteins in Nfat2-deleted B cells (a+b) Protein expression of NFAT2 (a) and NFAT1 (b) in isolated splenic
 Protein expression of NFAT2 (a) and NFAT1 (b) in isolated splenic") Supplementary Figure 1: Expression of NFAT proteins in Nfat2-deleted B cells (a+b) Protein expression of NFAT2 (a) and NFAT1 (b) in isolated splenic B cells from WT Nfat2 +/+, TCL1 Nfat2 +/+ and TCL1 Nfat2
Supplementary Figure 1: Expression of NFAT proteins in Nfat2-deleted B cells (a+b) Protein expression of NFAT2 (a) and NFAT1 (b) in isolated splenic B cells from WT Nfat2 +/+, TCL1 Nfat2 +/+ and TCL1 Nfat2
Supplementary Figure 1. Deletion of Smad3 prevents B16F10 melanoma invasion and metastasis in a mouse s.c. tumor model.
 A B16F1 s.c. Lung LN Distant lymph nodes Colon B B16F1 s.c. Supplementary Figure 1. Deletion of Smad3 prevents B16F1 melanoma invasion and metastasis in a mouse s.c. tumor model. Highly invasive growth
Supplemental information contains 7 movies and 4 supplemental Figures
 1 2 3 4 5 6 7 8 9 10 11 12 13 14 15 16 17 18 19 20 21 22 23 24 25 26 27 Supplemental information contains 7 movies and 4 supplemental Figures Movies: Movie 1. Single virus tracking of A4-mCherry-WR MV
SUPPLEMENTARY INFORMATION
 Figure S1 Treatment with both Sema6D and Plexin-A1 sirnas induces the phenotype essentially identical to that induced by treatment with Sema6D sirna alone or Plexin-A1 sirna alone. (a,b) The cardiac tube
Supplementary Table 1. List of primers used in this study
 Supplementary Table 1. List of primers used in this study Gene Forward primer Reverse primer Rat Met 5 -aggtcgcttcatgcaggt-3 5 -tccggagacacaggatgg-3 Rat Runx1 5 -cctccttgaaccactccact-3 5 -ctggatctgcctggcatc-3
Phosphoinositides Regulate Ciliary Protein Trafficking to Modulate Hedgehog Signaling
 Developmental Cell Supplemental Information Phosphoinositides Regulate Ciliary Protein Trafficking to Modulate Hedgehog Signaling Francesc R. Garcia-Gonzalo, Siew Cheng Phua, Elle C. Roberson, Galo Garcia
SUPPLEMENTARY INFORMATION
 SUPPLEMENTARY INFORMATION Advances in pancreatic islet monolayer culture on glass surfaces enable superresolution microscopy and insights into beta cell ciliogenesis and proliferation Edward A. Phelps,
Supplementary Figure 1. EC-specific Deletion of Snail1 Does Not Affect EC Apoptosis. (a,b) Cryo-sections of WT (a) and Snail1 LOF (b) embryos at
 Cryo-sections of WT (a) and Snail1 LOF (b) embryos at") Supplementary Figure 1. EC-specific Deletion of Snail1 Does Not Affect EC Apoptosis. (a,b) Cryo-sections of WT (a) and Snail1 LOF (b) embryos at E10.5 were double-stained for TUNEL (red) and PECAM-1 (green).
Supplementary Figure 1. EC-specific Deletion of Snail1 Does Not Affect EC Apoptosis. (a,b) Cryo-sections of WT (a) and Snail1 LOF (b) embryos at E10.5 were double-stained for TUNEL (red) and PECAM-1 (green).
Santulli G. et al. A microrna-based strategy to suppress restenosis while preserving endothelial function
 ONLINE DATA SUPPLEMENTS Santulli G. et al. A microrna-based strategy to suppress restenosis while preserving endothelial function Supplementary Figures Figure S1 Effect of Ad-p27-126TS on the expression
A Normal Exencephaly Craniora- Spina bifida Microcephaly chischisis. Midbrain Forebrain/ Forebrain/ Hindbrain Spinal cord Hindbrain Hindbrain
 A Normal Exencephaly Craniora- Spina bifida Microcephaly chischisis NTD Number of embryos % among NTD Embryos Exencephaly 52 74.3% Craniorachischisis 6 8.6% Spina bifida 5 7.1% Microcephaly 7 1% B Normal
Supplemental Information. Metabolic Maturation during Muscle Stem Cell. Differentiation Is Achieved by mir-1/133a-mediated
 Cell Metabolism, Volume 27 Supplemental Information Metabolic Maturation during Muscle Stem Cell Differentiation Is Achieved by mir-1/133a-mediated Inhibition of the Dlk1-Dio3 Mega Gene Cluster Stas Wüst,
Supplemental Information. Menin Deficiency Leads to Depressive-like. Behaviors in Mice by Modulating. Astrocyte-Mediated Neuroinflammation
 Neuron, Volume 100 Supplemental Information Menin Deficiency Leads to Depressive-like Behaviors in Mice by Modulating Astrocyte-Mediated Neuroinflammation Lige Leng, Kai Zhuang, Zeyue Liu, Changquan Huang,
Rescue of mutant rhodopsin traffic by metformin-induced AMPK activation accelerates photoreceptor degeneration Athanasiou et al
 Supplementary Material Rescue of mutant rhodopsin traffic by metformin-induced AMPK activation accelerates photoreceptor degeneration Athanasiou et al Supplementary Figure 1. AICAR improves P23H rod opsin
Supplementary Figure 1 Induction of cellular senescence and isolation of exosome. a to c, Pre-senescent primary normal human diploid fibroblasts
 Supplementary Figure 1 Induction of cellular senescence and isolation of exosome. a to c, Pre-senescent primary normal human diploid fibroblasts (TIG-3 cells) were rendered senescent by either serial passage
Supplementary Figure S1 (a) (b)
 (b)") Supplementary Figure S1: IC87114 does not affect basal Ca 2+ level nor nicotineinduced Ca 2+ influx. (a) Bovine chromaffin cells were loaded with Fluo-4AM (1 μm) in buffer A containing 0.02% of pluronic
Supplementary Figure S1: IC87114 does not affect basal Ca 2+ level nor nicotineinduced Ca 2+ influx. (a) Bovine chromaffin cells were loaded with Fluo-4AM (1 μm) in buffer A containing 0.02% of pluronic
Supplementary Information
 Supplementary Information Supplementary Figure 1. EBV-gB 23-431 mainly exists as trimer in HEK 293FT cells. (a) Western blotting analysis for DSS crosslinked FLAG-gB 23-431. HEK 293FT cells transfected
Supplementary Fig. S1. Schematic diagram of minigenome segments.
 open reading frame 1565 (segment 5) 47 (-) 3 5 (+) 76 101 125 149 173 197 221 246 287 open reading frame 890 (segment 8) 60 (-) 3 5 (+) 172 Supplementary Fig. S1. Schematic diagram of minigenome segments.
Supplementary Figure 1
 Combination index (CI) Supplementary Figure 1 2. 1.5 1. Ishikawa AN3CA Nou-1 Hec-18.5...2.4.6.8 1. Fraction affected (Fa) Supplementary Figure 1. The synergistic effect of PARP inhibitor and PI3K inhibitor
Adiponectin/T-cadherin system enhances exosome biogenesis and decreases cellular
 Supplemental Data Adiponectin/herin system enhances exosome biogenesis and decreases cellular ceramides by exosomal release 5 Yoshinari Obata, Shunbun Kita, *,, Yoshihisa Koyama, Shiro Fukuda, Hiroaki
Supplementary Table 1. The primers used for quantitative RT-PCR. Gene name Forward (5 > 3 ) Reverse (5 > 3 )
 Reverse (5 > 3 )") 770 771 Supplementary Table 1. The primers used for quantitative RT-PCR. Gene name Forward (5 > 3 ) Reverse (5 > 3 ) Human CXCL1 GCGCCCAAACCGAAGTCATA ATGGGGGATGCAGGATTGAG PF4 CCCCACTGCCCAACTGATAG TTCTTGTACAGCGGGGCTTG
770 771 Supplementary Table 1. The primers used for quantitative RT-PCR. Gene name Forward (5 > 3 ) Reverse (5 > 3 ) Human CXCL1 GCGCCCAAACCGAAGTCATA ATGGGGGATGCAGGATTGAG PF4 CCCCACTGCCCAACTGATAG TTCTTGTACAGCGGGGCTTG
CD3 coated cover slips indicating stimulatory contact site, F-actin polymerization and
 SUPPLEMENTAL FIGURES FIGURE S1. Detection of MCs. A, Schematic representation of T cells stimulated on anti- CD3 coated cover slips indicating stimulatory contact site, F-actin polymerization and microclusters.
Nature Methods: doi: /nmeth.4257
 Supplementary Figure 1 Screen for polypeptides that affect cellular actin filaments. (a) Table summarizing results from all polypeptides tested. Source shows organism, gene, and amino acid numbers used.
GFP-LC3 +/+ CLU -/- kda CLU GFP. Actin. GFP-LC3 +/+ CLU -/- kda CLU GFP. Actin
 Supplementary Fig. 1 a CQ treatment ScrB OGX11 MG132 I II AZD5363 I II b GFP / / GFP / / GFP / / GFP / / GFP GFP Actin Actin ctrl CQ GFP / / GFP / / GFP / / GFP / / GFP GFP Actin Actin rapamycin rapamycincq
(A) SW480, DLD1, RKO and HCT116 cells were treated with DMSO or XAV939 (5 µm)
 SW480, DLD1, RKO and HCT116 cells were treated with DMSO or XAV939 (5 µm)") Supplementary Figure Legends Figure S1. Tankyrase inhibition suppresses cell proliferation in an axin/β-catenin independent manner. (A) SW480, DLD1, RKO and HCT116 cells were treated with DMSO or XAV939
Supplementary Figure Legends Figure S1. Tankyrase inhibition suppresses cell proliferation in an axin/β-catenin independent manner. (A) SW480, DLD1, RKO and HCT116 cells were treated with DMSO or XAV939
T H E J O U R N A L O F C E L L B I O L O G Y
 T H E J O U R N A L O F C E L L B I O L O G Y Supplemental material Dunsch et al., http://www.jcb.org/cgi/content/full/jcb.201202112/dc1 Figure S1. Characterization of HMMR and CHICA antibodies. (A) HeLa
Supporting Information
 Supporting Information ou et al..73/pnas.08791112 dd Thymidine Release & transfection dd Thymidine Release dd MG132 Fix and IF -14 h 0 h 8 h 24 h 34 h 36 h siontrol simps1-1 simps1-1 simps1-1 simps1-2
SHREE ET AL, SUPPLEMENTAL MATERIALS. (A) Workflow for tumor cell line derivation and orthotopic implantation.
 Workflow for tumor cell line derivation and orthotopic implantation.") SHREE ET AL, SUPPLEMENTAL MATERIALS SUPPLEMENTAL FIGURE AND TABLE LEGENDS Supplemental Figure 1. Derivation and characterization of TS1-TGL and TS2-TGL PyMT cell lines and development of an orthotopic
SHREE ET AL, SUPPLEMENTAL MATERIALS SUPPLEMENTAL FIGURE AND TABLE LEGENDS Supplemental Figure 1. Derivation and characterization of TS1-TGL and TS2-TGL PyMT cell lines and development of an orthotopic
Nature Biotechnology: doi: /nbt Supplementary Figure 1. Analysis of hair bundle morphology in Ush1c c.216g>a mice at P18 by SEM.
 Supplementary Figure 1 Analysis of hair bundle morphology in Ush1c c.216g>a mice at P18 by SEM. (a-c) Heterozygous c.216ga mice displayed normal hair bundle morphology at P18. (d-i) Disorganized hair bundles
condition. Left panel, the HCT-116 cells were lysed with RIPA buffer containing 0.1%
 FIGURE LEGENDS Supplementary Fig 1 (A) sumoylation pattern detected under denaturing condition. Left panel, the HCT-116 cells were lysed with RIPA buffer containing 0.1% SDS in the presence and absence
Project report October 2012 March 2013 CRF fellow: Principal Investigator: Project title:
 Project report October 2012 March 2013 CRF fellow: Gennaro Napolitano Principal Investigator: Sergio Daniel Catz Project title: Small molecule regulators of vesicular trafficking to enhance lysosomal exocytosis
SUPPLEMENTARY INFORMATION
 DOI: 10.1038/ncb2988 Supplementary Figure 1 Kif7 L130P encodes a stable protein that does not localize to cilia tips. (a) Immunoblot with KIF7 antibody in cell lysates of wild-type, Kif7 L130P and Kif7
SUPPLEMENTARY INFORMATION
 DOI: 10.1038/ncb2535 Figure S1 SOX10 is expressed in human giant congenital nevi and its expression in human melanoma samples suggests that SOX10 functions in a MITF-independent manner. a, b, Representative
Figure S1A. Blood glucose levels in mice after glucose injection
 ## Figure S1A. Blood glucose levels in mice after glucose injection Blood glucose (mm/l) 25 2 15 1 5 # 15 3 6 3+3 Time after glucose injection (min) # Figure S1B. α-kg levels in mouse livers after glucose
a 10 4 Link et al. Supplementary Figure 1 Nature Immunology: doi: /ni.1842 Cells per mouse ( 10 5 ) TRPV2KO anti-gr1 anti-gr anti-f4/80
 TRPV2KO anti-gr1 anti-gr anti-f4/80") a 10 4 WT 10 4 TRPV2KO 10 3 10 3 anti-gr1 10 2 10 1 anti-gr1 10 2 10 1 10 0 10 0 10 1 10 2 10 3 10 4 anti-f4/80 42.3 45.2 10 0 10 0 10 1 10 2 10 3 10 4 anti-f4/80 10 4 10 4 40 42.5 anti-cd11b 10 3 10 2
a 10 4 WT 10 4 TRPV2KO 10 3 10 3 anti-gr1 10 2 10 1 anti-gr1 10 2 10 1 10 0 10 0 10 1 10 2 10 3 10 4 anti-f4/80 42.3 45.2 10 0 10 0 10 1 10 2 10 3 10 4 anti-f4/80 10 4 10 4 40 42.5 anti-cd11b 10 3 10 2
Supplementary Figure 1
 Supplementary Figure 1 Kif1a RNAi effect on basal progenitor differentiation Related to Figure 2. Representative confocal images of the VZ and SVZ of rat cortices transfected at E16 with scrambled or Kif1a
Supplementary Figure S1. Venn diagram analysis of mrna microarray data and mirna target analysis. (a) Western blot analysis of T lymphoblasts (CLS)
 Western blot analysis of T lymphoblasts (CLS)") Supplementary Figure S1. Venn diagram analysis of mrna microarray data and mirna target analysis. (a) Western blot analysis of T lymphoblasts (CLS) and their exosomes (EXO) in resting (REST) and activated
Supplementary Figure S1. Venn diagram analysis of mrna microarray data and mirna target analysis. (a) Western blot analysis of T lymphoblasts (CLS) and their exosomes (EXO) in resting (REST) and activated
SUPPLEMENTARY INFORMATION
 SUPPLEENTRY INFORTION DOI: 1.138/ncb2577 Early Telophase Late Telophase B icrotubules within the ICB (percent of total cells in telophase) D G ultinucleate cells (% total) 8 6 4 2 2 15 1 5 T without gaps
Supplemental Materials Molecular Biology of the Cell
 Supplemental Materials Molecular Biology of the Cell Gilberti et al. SUPPLEMENTAL FIGURE LEGENDS: Figure S1: The effect of pharmacological inhibitors on particle uptake. The data presented in Figure 1
Prolonged mitotic arrest induces a caspase-dependent DNA damage
 SUPPLEMENTARY INFORMATION Prolonged mitotic arrest induces a caspase-dependent DNA damage response at telomeres that determines cell survival Karolina O. Hain, Didier J. Colin, Shubhra Rastogi, Lindsey
TFEB-mediated increase in peripheral lysosomes regulates. Store Operated Calcium Entry
 TFEB-mediated increase in peripheral lysosomes regulates Store Operated Calcium Entry Luigi Sbano, Massimo Bonora, Saverio Marchi, Federica Baldassari, Diego L. Medina, Andrea Ballabio, Carlotta Giorgi
Supplementary Figure 1 IMQ-Induced Mouse Model of Psoriasis. IMQ cream was
 Supplementary Figure 1 IMQ-Induced Mouse Model of Psoriasis. IMQ cream was painted on the shaved back skin of CBL/J and BALB/c mice for consecutive days. (a, b) Phenotypic presentation of mouse back skin
Zhu et al, page 1. Supplementary Figures
 Zhu et al, page 1 Supplementary Figures Supplementary Figure 1: Visual behavior and avoidance behavioral response in EPM trials. (a) Measures of visual behavior that performed the light avoidance behavior
T H E J O U R N A L O F C E L L B I O L O G Y
 Supplemental material Edens and Levy, http://www.jcb.org/cgi/content/full/jcb.201406004/dc1 T H E J O U R N A L O F C E L L B I O L O G Y Figure S1. Nuclear shrinking does not depend on the cytoskeleton
Supplemental Materials Molecular Biology of the Cell
 Supplemental Materials Molecular Biology of the Cell Garcia-Alvarez et al. Supplementary Figure Legends Figure S1.Expression and RNAi-mediated silencing of STIM1 in hippocampal neurons (DIV, days in vitro).
Supplemental Figures:
 Supplemental Figures: Figure 1: Intracellular distribution of VWF by electron microscopy in human endothelial cells. a) Immunogold labeling of LC3 demonstrating an LC3-positive autophagosome (white arrow)
p = formed with HCI-001 p = Relative # of blood vessels that formed with HCI-002 Control Bevacizumab + 17AAG Bevacizumab 17AAG
 A.. Relative # of ECs associated with HCI-001 1.4 1.2 1.0 0.8 0.6 0.4 0.2 0.0 ol b p < 0.001 Relative # of blood vessels that formed with HCI-001 1.4 1.2 1.0 0.8 0.6 0.4 0.2 0.0 l b p = 0.002 Control IHC:
A. List of selected proteins with high SILAC (H/L) ratios identified in mass
 ratios identified in mass") Supplementary material Figure S1. Interaction between UBL5 and FANCI A. List of selected proteins with high SILAC (H/L) ratios identified in mass spectrometry (MS)-based analysis of UBL5-interacting proteins,
Supplementary material Figure S1. Interaction between UBL5 and FANCI A. List of selected proteins with high SILAC (H/L) ratios identified in mass spectrometry (MS)-based analysis of UBL5-interacting proteins,
SUPPLEMENTARY INFORMATION
 DOI:.38/ncb2822 a MTC02 FAO cells EEA1 b +/+ MEFs /DAPI -/- MEFs /DAPI -/- MEFs //DAPI c HEK 293 cells WCE N M C P AKT TBC1D7 Lamin A/C EEA1 VDAC d HeLa cells WCE N M C P AKT Lamin A/C EEA1 VDAC Figure
Supplementary Information
 Supplementary Information Title Degeneration and impaired regeneration of gray matter oligodendrocytes in amyotrophic lateral sclerosis Authors Shin H. Kang, Ying Li, Masahiro Fukaya, Ileana Lorenzini,
Supplementary Figure S I: Effects of D4F on body weight and serum lipids in apoe -/- mice.
 Supplementary Figures: Supplementary Figure S I: Effects of D4F on body weight and serum lipids in apoe -/- mice. Male apoe -/- mice were fed a high-fat diet for 8 weeks, and given PBS (model group) or
SUPPLEMENTARY FIGURES
 SUPPLEMENTARY FIGURES 1 Supplementary Figure 1, Adult hippocampal QNPs and TAPs uniformly express REST a-b) Confocal images of adult hippocampal mouse sections showing GFAP (green), Sox2 (red), and REST