Phosphoinositides Regulate Ciliary Protein Trafficking to Modulate Hedgehog Signaling
|
|
|
- Damian Shelton
- 5 years ago
- Views:
Transcription
1 Developmental Cell Supplemental Information Phosphoinositides Regulate Ciliary Protein Trafficking to Modulate Hedgehog Signaling Francesc R. Garcia-Gonzalo, Siew Cheng Phua, Elle C. Roberson, Galo Garcia III, Monika Abedin, Stéphane Schurmans, Takanari Inoue, and Jeremy F. Reiter
2 SUPPLEMENTAL FIGURES Figure S1 (related to Fig.1). PI(4)P and PI(4,5)P2 localize to distinct ciliary compartments. (A) Ciliated IMCD3 cells were stained with anti-pi(4)p (green) and anti-arl13b (red) antibodies and their nuclei marked with DAPI (blue). Scale bar, 5µm. (B) Purified cilia from sea urchin gastrulae were stained with anti-pi(4)p (red) and anti-detyrosinated tubulin (Glu-Tub, green) antibodies. Scale bar, 5µm. (C) Live IMCD3 cells were imaged for the ciliary marker 5HT6-CFP (red) and the PI(4,5)P 2 sensor EYFP-PH PLCδ1 (green). Scale bar, 5µm. (D) XZ optical section of live IMCD3 cells expressing 5HT6-CFP (red) and EYFP-PH PLCδ1 (green). Scale bar, 5µm. (E) Live imaging of NIH-3T3 cells cotransfected with plasmids expressing the PI(4,5)P2 sensor mcerulean3-ph PLCδ1 (green) and the indicated ciliary fusion proteins (red) containing the catalytically active and inactive forms of Inp54p, a yeast PI(4,5)P 2 5-phosphatase, and PIPK, a mouse PI(4)P 5-kinase. Scale bars, 5µm. (F) Quantitation of the extension of the mcerulean3- PH PLCδ1 flurorescence relative to ciliary length. The catalytically active phosphatase and kinase decreased and increased, respectively, the extent of ciliary mcerulean3-ph PLCδ1 flurorescence. Data are means ± standard error of the mean (SEM). Asterisks indicate p<0.05 in unpaired t-tests. Figure S2 (related to Fig.2). and Tctn1 affect ciliary PI(4,5)P 2 levels. (A) MEFs derived from littermate +/ and / embryos were stained for Tub Ac (red), (green), γ-tub (cyan) and (blue). Scale bar, 5µm. (B) +/ and / MEFs were starved for 48 hours and stained for Tub Ac (green), Arl13b (red), and (blue). Scale bar, 5µm. (C) Quantitation
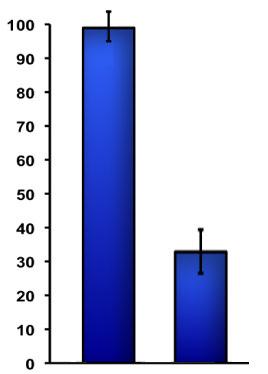
3 of the proportion of +/ and / MEFs that possessed cilia. Error bars depict standard deviations (SDs). (D) Live imaging of / MEFs cotransfected with plasmids expressing the PI(4,5)P 2 sensor mcerulean3-ph PLCδ1 (green) and the indicated ciliary fusion proteins (red) of catalytically inactive (D281A) or wild type Inp54p, a yeast PI(4,5)P 2 5- phosphatase. Scale bars, 5µm. Quantitation of the extent of ciliary mcerulean3-ph PLCδ1 fluorescence (PI(4,5)P 2 length) relative to the cilium length in / MEFs. Data are means ± SEM. Asterisks indicate p<0.01 in unpaired t-tests. (E) Live Tctn1 +/+ and Tctn1 / MEFs were imaged for the ciliary marker 5HT6-CFP (red) and the PI(4,5)P 2 sensor EYFP- PH PLCδ1 (green). Scale bars, 5µm. (F) Quantitation of the extent of ciliary EYFP-PH PLCδ1 fluorescence (PI(4,5)P 2 length) relative to the extent of 5HT 6 -CFP fluorescence (Cilium length) in Tctn1 +/+ and Tctn1 / MEFs. Data are means ± SEM. Asterisks indicate p<0.01 in unpaired t-tests. Figure S3 (related to Fig.3). regulates Hh signaling. (A) qrt-pcr quantitation of Gli1 expression by +/ and / MEFs treated with vehicle (DMSO), SAG or ShhN. Data are means ± SDs from triplicates of one experiment. (B) qrt-pcr quantitation of Ptch1 expression by +/ and / MEFs treated with vehicle (DMSO), SAG or ShhN. Data are means ± SDs from triplicates of one experiment. (C) Fold induction of Ptch1 and Gli1 expression by SAG relative to vehicle (DMSO) in +/ and / MEFs. Asterisks indicate p<0.01 in unpaired t-tests. (D) +/ and / MEFs were stained for Tub Ac (red), Ptch1 (green) and (blue). Arrows indicate ciliary Ptch1. Insets depict magnified view of a single cilium. Scale bar, 5µm. (E) +/ and / MEFs were stained for Tub Ac (red),
4 Polycystin-2 (green) and (blue). Arrows indicate ciliary Polycystin-2. Insets depict magnified view of a single cilium. Scale bar, 5µm. (F) Fold increase in ciliary Smo by SAG relative to vehicle in +/ and / MEFs. (G) Fold increase in Gli3 at the ciliary tip by SAG relative to vehicle in +/ and / MEFs. Asterisk indicates p<0.05 in unpaired t-test. (H) Fold reduction in ciliary Gpr161 levels by SAG relative to vehicle in +/ and / MEFs. Figure S4 (related to Fig.4). regulates IFT-A but not IFT-B ciliary localization. (A) +/ and / MEF lysates were blotted for (top) and α-tubulin (bottom). Molecular weight markers are shown in the left. (B) +/ and / MEFs were stained for Tub Ac (green), Ift139 (red), γ-tub (cyan), and (blue). Scale bar, 5µm. Insets depict magnified view of a single cilium. (C) Ventral neural tube sections of E9.5 +/ and / mouse embryos were stained for Arl13b (red), γ-tub (cyan), Ift88 (green), and (blue). Ventral is down. Insets depict magnified view of cilia. Scale bar, 5µm. (D) Tctn1 +/+ and Tctn1 / MEFs were stained for Tub Ac (green), (red), γ-tub (cyan), and (blue). Scale bar, 5µm. (E) Tctn1 +/+ and Tctn1 / MEFs were stained for Tub Ac (green), Gpr161 (red), γ-tub (cyan), and (blue). Scale bar, 5µm. Figure S5 (related to Fig.5). Ciliary PI(4,5)P 2 synthesis increases ciliary Gpr161 levels. (A) IMCD3 cells expressing wild type or catalytically inactive (D253A) 5-HT 6 -EYFP-PIPK were stained for Tub Ac (cyan), EYFP (green) and Gpr161 (red). Arrowheads indicate 5-HT 6 -EYFP-PIPK-containing
5 cilia. Scale bar, 5µm. (B) Quantification of the fluorescence intensity of Gpr161 in cilia expressing 5-HT 6 -EYFP-PIPK WT or D253A. Data are means ± SEM. Asterisk indicates p<0.05 in unpaired t-test. Figure S6 (related to Fig.6). Inhibiting or Gpr161 increases Hh signaling in / cells. (A) / MEFs transfected with sirna (si), Gpr161 sirna (sigpr161) or scrambled control sirna (sictrl) were stained for or Gpr161 (green), Tub Ac (red), (cyan) and nuclei (blue). Scale bars, 5µm. (B) Lysates of / MEFs transfected with either a scrambled control (sicontrol) or (si) sirnas were blotted for (top) and α-tubulin (bottom). Molecular weight markers are shown in the left. (C) Quantification of the fluorescence intensity of and Gpr161 in cilia of si or sigpr161-transfected / MEFs relative to sictrl-transfected / MEFs. Data are means ± SEM. One asterisk indicates p<0.05 and two indicates p<0.01 in unpaired t-tests. (D) +/ and / MEFs transfected with si, sigpr161 or sictrl were treated with SAG or vehicle and expression of Ptch1 was measured by qrt-pcr. Error bars represent SDs of three independent experiments. One asterisk indicates p<0.05 and two represents p<0.01 in unpaired t-tests. (E) Fold induction of Ptch1 expression by SAG relative to vehicle in +/ and / MEFs. Data are means ± SEM. One asterisk indicates p<0.05 and two indicates p<0.01 in unpaired t-tests.

P PI(4)P")
P₂ D Cilium")

")
P₂ length /")

6 Figure S1. Garcia-Gonzalo et al A PI(4)P PI(4)P Arl13b B PI(4)P PI(4)P GluTub C Cilium PI(4,5)P₂ D Cilium PI(4,5)P₂ E 5HT₆-EYFP-Inp54p (D281A) PI(4,5)P₂ 5HT₆-EYFP-Inp54p 5HT₆-EYFP-PIPK (D253A) 5HT₆-EYFP-PIPK F PI(4,5)P₂ length / Cilia length PI(4,5)P₂ length / Cilia length * * Inp54p (D281A) Inp54p PIPK (D253A) PIPK


P₂")
 * *")


7 Figure S2. Garcia-Gonzalo et al A +/ Tub Ac B +/ TubAc Arl13b C Ciliation (%) D 5HT₆-EYFP-Inp54p (D281A) 5HT₆-EYFP-Inp54p PI(4,5)P₂ PI(4,5)P₂ length / Cilium length (%) * * +/ / Inp54p (D281A) Inp54p E Tctn1 / Tctn1 +/+ Cilium PI(4,5)P₂ F PI(4,5)P₂ length / Cilium length (%) * * +/+ / Tctn1

 DMSO SAG ShhN B Ptch1")
 DMSO SAG ShhN C ** **")


8 Figure S3. Garcia-Gonzalo et al A Gli1 mrna level (A.U.) DMSO SAG ShhN B Ptch1 mrna level (A.U.) DMSO SAG ShhN C ** ** Ptch1 Gli1 +/ +/ D TubAc Ptch1 E Tub Ac Polycystin-2 +/ / +/ +/ Fold Induction by SAG F G * H Fold Smo Increase by SAG Fold Gli3 Increase by SAG +/ / +/ / Fold Gpr161 Reduction by SAG +/ /


9 Figure S4. Garcia-Gonzalo et al A kda /- -/- 50 α-tubulin B 35 +/ Tub Ac Ift139 Tub Ac Ift139 C +/+ Arl13b Ift88 Tctn1 +/+ Tctn1 / D E Tub Ac Tub Ac Gpr161 Tctn1 +/+ Tctn1 /


10 Figure S5. Garcia-Gonzalo et al * A B Tub Ac 5HT₆-EYFP- PIPK-D253A Gpr161 5HT₆-EYFP- PIPK-WT Gpr161 Ciliary Intensity (A.U.) PIPK- D253A PIPK


11 Figure S6. Garcia-Gonzalo et al A sictrl si sigpr161 B sicontrol si 55 α-tubulin Ac Tub C Gpr161 Gpr161 Ac Tub Gpr161 Ciliary Intensity (%) sictrl si sigpr161 D ** E ** Ptch1 mrna level (A.U.) SAG: sictrl sictrl si sigpr161 +/ * + Fold Ptch1 Induction by SAG sictrl sictrl si sigpr161 +/ *
SUPPLEMENTARY INFORMATION
 DOI: 10.1038/ncb2988 Supplementary Figure 1 Kif7 L130P encodes a stable protein that does not localize to cilia tips. (a) Immunoblot with KIF7 antibody in cell lysates of wild-type, Kif7 L130P and Kif7
SUPPLEMENTARY INFORMATION
 DOI: 1.138/ncb222 / b. WB anti- WB anti- ulin Mitotic index (%) 14 1 6 2 T (h) 32 48-1 1 2 3 4 6-1 4 16 22 28 3 33 e. 6 4 2 Time (min) 1-6- 11-1 > 1 % cells Figure S1 depletion leads to mitotic defects
Supplementary Information
 Supplementary Information CEP41 is mutated in Joubert syndrome and is required for tubulin glutamylation at the cilium Ji Eun Lee, Jennifer L. Silhavy, Maha S. Zaki, Jana Schroth, Stephanie L. Bielas,
INPP5E regulates phosphoinositide-dependent cilia transition zone function
 Published Online: 20 December, 2016 Supp Info: http://doi.org/10.1083/jcb.201511055 Downloaded from jcb.rupress.org on March 22, 2018 JCB: Article INPP5E regulates phosphoinositide-dependent cilia transition
Primary Cilia Can Both Mediate and Suppress Hedgehog Pathway- Dependent Tumorigenesis (Supplementary Figures and Materials)
") Primary Cilia Can Both Mediate and Suppress Hedgehog Pathway- Dependent Tumorigenesis (Supplementary Figures and Materials) Sunny Y. Wong, Allen D. Seol, Po-Lin So, Alexandre N. Ermilov, Christopher K.
Primary Cilia Can Both Mediate and Suppress Hedgehog Pathway- Dependent Tumorigenesis (Supplementary Figures and Materials) Sunny Y. Wong, Allen D. Seol, Po-Lin So, Alexandre N. Ermilov, Christopher K.
Supplementary Figure 1.TRIM33 binds β-catenin in the nucleus. a & b, Co-IP of endogenous TRIM33 with β-catenin in HT-29 cells (a) and HEK 293T cells
 and HEK 293T cells") Supplementary Figure 1.TRIM33 binds β-catenin in the nucleus. a & b, Co-IP of endogenous TRIM33 with β-catenin in HT-29 cells (a) and HEK 293T cells (b). TRIM33 was immunoprecipitated, and the amount of
Supplementary Figure 1.TRIM33 binds β-catenin in the nucleus. a & b, Co-IP of endogenous TRIM33 with β-catenin in HT-29 cells (a) and HEK 293T cells (b). TRIM33 was immunoprecipitated, and the amount of
Supplemental Figure 1. Western blot analysis indicated that MIF was detected in the fractions of
 Supplemental Figure Legends Supplemental Figure 1. Western blot analysis indicated that was detected in the fractions of plasma membrane and cytosol but not in nuclear fraction isolated from Pkd1 null
SUPPLEMENTARY LEGENDS...
 TABLE OF CONTENTS SUPPLEMENTARY LEGENDS... 2 11 MOVIE S1... 2 FIGURE S1 LEGEND... 3 FIGURE S2 LEGEND... 4 FIGURE S3 LEGEND... 5 FIGURE S4 LEGEND... 6 FIGURE S5 LEGEND... 7 FIGURE S6 LEGEND... 8 FIGURE
Nature Structural and Molecular Biology: doi: /nsmb Supplementary Figure 1
 Supplementary Figure 1 Mutational analysis of the SA2-Scc1 interaction in vitro and in human cells. (a) Autoradiograph (top) and Coomassie stained gel (bottom) of 35 S-labeled Myc-SA2 proteins (input)
Expanded View Figures
 PEX13 functions in selective autophagy Ming Y Lee et al Expanded View Figures Figure EV1. PEX13 is required for Sindbis virophagy. A, B Quantification of mcherry-capsid puncta per cell (A) and GFP-LC3
Supplementary Fig. S1. Schematic diagram of minigenome segments.
 open reading frame 1565 (segment 5) 47 (-) 3 5 (+) 76 101 125 149 173 197 221 246 287 open reading frame 890 (segment 8) 60 (-) 3 5 (+) 172 Supplementary Fig. S1. Schematic diagram of minigenome segments.
Supplemental Figure 1. Intracranial transduction of a modified ptomo lentiviral vector in the mouse
 Supplemental figure legends Supplemental Figure 1. Intracranial transduction of a modified ptomo lentiviral vector in the mouse hippocampus targets GFAP-positive but not NeuN-positive cells. (A) Stereotaxic
Supplementary Figure S1: Defective heterochromatin repair in HGPS progeroid cells
 Supplementary Figure S1: Defective heterochromatin repair in HGPS progeroid cells Immunofluorescence staining of H3K9me3 and 53BP1 in PH and HGADFN003 (HG003) cells at 24 h after γ-irradiation. Scale bar,
hexahistidine tagged GRP78 devoid of the KDEL motif (GRP78-His) on SDS-PAGE. This
 on SDS-PAGE. This") SUPPLEMENTAL FIGURE LEGEND Fig. S1. Generation and characterization of. (A) Coomassie staining of soluble hexahistidine tagged GRP78 devoid of the KDEL motif (GRP78-His) on SDS-PAGE. This protein was expressed
SUPPLEMENTAL FIGURE LEGEND Fig. S1. Generation and characterization of. (A) Coomassie staining of soluble hexahistidine tagged GRP78 devoid of the KDEL motif (GRP78-His) on SDS-PAGE. This protein was expressed
Supplemental Materials. STK16 regulates actin dynamics to control Golgi organization and cell cycle
 Supplemental Materials STK16 regulates actin dynamics to control Golgi organization and cell cycle Juanjuan Liu 1,2,3, Xingxing Yang 1,3, Binhua Li 1, Junjun Wang 1,2, Wenchao Wang 1, Jing Liu 1, Qingsong
Supplementary Figure S1 (a) (b)
 (b)") Supplementary Figure S1: IC87114 does not affect basal Ca 2+ level nor nicotineinduced Ca 2+ influx. (a) Bovine chromaffin cells were loaded with Fluo-4AM (1 μm) in buffer A containing 0.02% of pluronic
Supplementary Figure S1: IC87114 does not affect basal Ca 2+ level nor nicotineinduced Ca 2+ influx. (a) Bovine chromaffin cells were loaded with Fluo-4AM (1 μm) in buffer A containing 0.02% of pluronic
SUPPLEMENTARY FIGURES
 SUPPLEMENTARY FIGURES Supplementary Figure 1. (A) Left, western blot analysis of ISGylated proteins in Jurkat T cells treated with 1000U ml -1 IFN for 16h (IFN) or left untreated (CONT); right, western
T H E J O U R N A L O F C E L L B I O L O G Y
 T H E J O U R N A L O F C E L L B I O L O G Y Supplemental material Krenn et al., http://www.jcb.org/cgi/content/full/jcb.201110013/dc1 Figure S1. Levels of expressed proteins and demonstration that C-terminal
Supplemental Information. Supernumerary Centrosomes. Nucleate Extra Cilia and Compromise. Primary Cilium Signaling. Current Biology, Volume 22
 Current Biology, Volume 22 Supplemental Information Supernumerary Centrosomes Nucleate Extra Cilia and Compromise Primary Cilium Signaling Moe R. Mahjoub and Tim Stearns Supplemental Inventory 1. Supplemental
McWilliams et al., http :// /cgi /content /full /jcb /DC1
 Supplemental material JCB McWilliams et al., http ://www.jcb.org /cgi /content /full /jcb.201603039 /DC1 THE JOURNAL OF CELL BIOLOGY Figure S1. In vitro characterization of mito-qc. (A and B) Analysis
Supporting Information
 Supporting Information Kim et al. 10.1073/pnas.0912180106 SI Materials and Methods DNA Constructs. The N-terminally-tagged mouse Gli2 expression construct, pcefl/3 HA-Gli2, was constructed by ligating
Additional methods appearing in the supplement are described in the Experimental Procedures section of the manuscript.
 Supplemental Materials: I. Supplemental Methods II. Supplemental Figure Legends III. Supplemental Figures Supplemental Methods Cell Culture and Transfections for Wild Type and JNK1-/-,JNK2-/- MEFs: The
GPR120 *** * * Liver BAT iwat ewat mwat Ileum Colon. UCP1 mrna ***
 a GPR120 GPR120 mrna/ppia mrna Arbitrary Units 150 100 50 Liver BAT iwat ewat mwat Ileum Colon b UCP1 mrna Fold induction 20 15 10 5 - camp camp SB202190 - - - H89 - - - - - GW7647 Supplementary Figure
Supplementary Table 1. The primers used for quantitative RT-PCR. Gene name Forward (5 > 3 ) Reverse (5 > 3 )
 Reverse (5 > 3 )") 770 771 Supplementary Table 1. The primers used for quantitative RT-PCR. Gene name Forward (5 > 3 ) Reverse (5 > 3 ) Human CXCL1 GCGCCCAAACCGAAGTCATA ATGGGGGATGCAGGATTGAG PF4 CCCCACTGCCCAACTGATAG TTCTTGTACAGCGGGGCTTG
770 771 Supplementary Table 1. The primers used for quantitative RT-PCR. Gene name Forward (5 > 3 ) Reverse (5 > 3 ) Human CXCL1 GCGCCCAAACCGAAGTCATA ATGGGGGATGCAGGATTGAG PF4 CCCCACTGCCCAACTGATAG TTCTTGTACAGCGGGGCTTG
Supplementary Figure 1: si-craf but not si-braf sensitizes tumor cells to radiation.
 Supplementary Figure 1: si-craf but not si-braf sensitizes tumor cells to radiation. (a) Embryonic fibroblasts isolated from wildtype (WT), BRAF -/-, or CRAF -/- mice were irradiated (6 Gy) and DNA damage
Figure S1. Reduction in glomerular mir-146a levels correlate with progression to higher albuminuria in diabetic patients.
 Supplementary Materials Supplementary Figures Figure S1. Reduction in glomerular mir-146a levels correlate with progression to higher albuminuria in diabetic patients. Figure S2. Expression level of podocyte
T H E J O U R N A L O F C E L L B I O L O G Y
 Supplemental material Díaz et al., http://www.jcb.org/cgi/content/full/jcb.201209151/dc1 T H E J O U R N A L O F C E L L B I O L O G Y Figure S1. Hypoxia induces invadopodia formation in different epithelial
p = formed with HCI-001 p = Relative # of blood vessels that formed with HCI-002 Control Bevacizumab + 17AAG Bevacizumab 17AAG
 A.. Relative # of ECs associated with HCI-001 1.4 1.2 1.0 0.8 0.6 0.4 0.2 0.0 ol b p < 0.001 Relative # of blood vessels that formed with HCI-001 1.4 1.2 1.0 0.8 0.6 0.4 0.2 0.0 l b p = 0.002 Control IHC:
SUPPLEMENTARY INFORMATION. Supplementary Figures S1-S9. Supplementary Methods
 SUPPLEMENTARY INFORMATION SUMO1 modification of PTEN regulates tumorigenesis by controlling its association with the plasma membrane Jian Huang 1,2#, Jie Yan 1,2#, Jian Zhang 3#, Shiguo Zhu 1, Yanli Wang
nature methods Organelle-specific, rapid induction of molecular activities and membrane tethering
 nature methods Organelle-specific, rapid induction of molecular activities and membrane tethering Toru Komatsu, Igor Kukelyansky, J Michael McCaffery, Tasuku Ueno, Lidenys C Varela & Takanari Inoue Supplementary
Supplemental Information. The Hedgehog Pathway Effector Smoothened. Exhibits Signaling Competency in the Absence. of Ciliary Accumulation
 Chemistry & Biology, Volume 21 Supplemental Information The edgehog Pathway Effector Exhibits Signaling Competency in the Absence of Ciliary Accumulation Chih-Wei Fan, Baozhi Chen, Irene Franco, Jianming
marker. DAPI labels nuclei. Flies were 20 days old. Scale bar is 5 µm. Ctrl is
 Supplementary Figure 1. (a) Nos is detected in glial cells in both control and GFAP R79H transgenic flies (arrows), but not in deletion mutant Nos Δ15 animals. Repo is a glial cell marker. DAPI labels
Supplementary Figure 1 ITGB1 and ITGA11 increase with evidence for heterodimers following HSC activation. (a) Time course of rat HSC activation
 Time course of rat HSC activation") Supplementary Figure 1 ITGB1 and ITGA11 increase with evidence for heterodimers following HSC activation. (a) Time course of rat HSC activation indicated by the detection of -SMA and COL1 (log scale).
Supplementary Figure 1 ITGB1 and ITGA11 increase with evidence for heterodimers following HSC activation. (a) Time course of rat HSC activation indicated by the detection of -SMA and COL1 (log scale).
(A) RT-PCR for components of the Shh/Gli pathway in normal fetus cell (MRC-5) and a
 RT-PCR for components of the Shh/Gli pathway in normal fetus cell (MRC-5) and a") Supplementary figure legends Supplementary Figure 1. Expression of Shh signaling components in a panel of gastric cancer. (A) RT-PCR for components of the Shh/Gli pathway in normal fetus cell (MRC-5) and
Supplementary figure legends Supplementary Figure 1. Expression of Shh signaling components in a panel of gastric cancer. (A) RT-PCR for components of the Shh/Gli pathway in normal fetus cell (MRC-5) and
Fig. S1. Subcellular localization of overexpressed LPP3wt-GFP in COS-7 and HeLa cells. Cos7 (top) and HeLa (bottom) cells expressing for 24 h human
 and HeLa (bottom) cells expressing for 24 h human") Fig. S1. Subcellular localization of overexpressed LPP3wt-GFP in COS-7 and HeLa cells. Cos7 (top) and HeLa (bottom) cells expressing for 24 h human LPP3wt-GFP, fixed and stained for GM130 (A) or Golgi97
Fig. S1. Subcellular localization of overexpressed LPP3wt-GFP in COS-7 and HeLa cells. Cos7 (top) and HeLa (bottom) cells expressing for 24 h human LPP3wt-GFP, fixed and stained for GM130 (A) or Golgi97
* * A3027. A4623 e A3507 A3507 A3507
 a c L A327 d e A37 A37 A37 Supplementary Figure 1. Clinical manifestations of individuals with mutations. (a) Renal ultrasound of right kidney in A327 reveals small renal cysts, loss of corticomedullary
Nature Medicine doi: /nm.2860
 Supplemental Figure Legends Supplemental Figure 1: Hypomorphic expression of IFT88 results in olfactory signaling proteins no longer localizing to the ciliary layer. (a) ACIII localizes to the cilia and
Inhibition of DYRK1A stimulates human beta-cell proliferation
 Inhibition of DYRK1A stimulates human beta-cell proliferation Ercument Dirice 1,, Deepika Walpita 2,, Amedeo Vetere 2, Bennett C. Meier 2,5, Sevim Kahraman 1, Jiang Hu 1, Vlado Dančík 2, Sean M. Burns
c Ischemia (30 min) Reperfusion (8 w) Supplementary Figure bp 300 bp Ischemia (30 min) Reperfusion (4 h) Dox 20 mg/kg i.p.
 Reperfusion (8 w) Supplementary Figure bp 300 bp Ischemia (30 min) Reperfusion (4 h) Dox 20 mg/kg i.p.") a Marker Ripk3 +/ 5 bp 3 bp b Ischemia (3 min) Reperfusion (4 h) d 2 mg/kg i.p. 1 w 5 w Sacrifice for IF size A subset for echocardiography and morphological analysis c Ischemia (3 min) Reperfusion (8
a Marker Ripk3 +/ 5 bp 3 bp b Ischemia (3 min) Reperfusion (4 h) d 2 mg/kg i.p. 1 w 5 w Sacrifice for IF size A subset for echocardiography and morphological analysis c Ischemia (3 min) Reperfusion (8
Nature Neuroscience: doi: /nn Supplementary Figure 1. PICALM expression in brain capillary endothelium in human brain and in mouse brain.
 Supplementary Figure 1 PICALM expression in brain capillary endothelium in human brain and in mouse brain. a, Double immunostaining for PICALM (red, left) and lectin positive endothelial profiles (blue,
Supplemental information contains 7 movies and 4 supplemental Figures
 1 2 3 4 5 6 7 8 9 10 11 12 13 14 15 16 17 18 19 20 21 22 23 24 25 26 27 Supplemental information contains 7 movies and 4 supplemental Figures Movies: Movie 1. Single virus tracking of A4-mCherry-WR MV
Supplementary Material
 Supplementary Material accompanying the manuscript Interleukin 37 is a fundamental inhibitor of innate immunity Marcel F Nold, Claudia A Nold-Petry, Jarod A Zepp, Brent E Palmer, Philip Bufler & Charles
T H E J O U R N A L O F C E L L B I O L O G Y
 Supplemental material Brooks and Wallingford, http://www.jcb.org/cgi/content/full/jcb.201204072/dc1 T H E J O U R N A L O F C E L L B I O L O G Y Figure S1. Quantification of ciliary compartments in control
2.5. AMPK activity
 Supplement Fig. A 3 B phos-ampk 2.5 * Control AICAR AMPK AMPK activity (Absorbance at 45 nm) 2.5.5 Control AICAR Supplement Fig. Effects of AICAR on AMPK activation in macrophages. J774. macrophages were
SUPPLEMENTARY INFORMATION
 DOI: 10.1038/ncb2638 Figure S1 Morphological characteristics of fetal testes and ovaries from 6.5-20 developmental weeks. Representative images of Hematoxylin and Eosin staining of testes and ovaries over
Rescue of mutant rhodopsin traffic by metformin-induced AMPK activation accelerates photoreceptor degeneration Athanasiou et al
 Supplementary Material Rescue of mutant rhodopsin traffic by metformin-induced AMPK activation accelerates photoreceptor degeneration Athanasiou et al Supplementary Figure 1. AICAR improves P23H rod opsin
Supplementary Figure 1. Properties of various IZUMO1 monoclonal antibodies and behavior of SPACA6. (a) (b) (c) (d) (e) (f) (g) .
 (b) (c) (d) (e) (f) (g) .") Supplementary Figure 1. Properties of various IZUMO1 monoclonal antibodies and behavior of SPACA6. (a) The inhibitory effects of new antibodies (Mab17 and Mab18). They were investigated in in vitro fertilization
Supplementary Figure 1. Properties of various IZUMO1 monoclonal antibodies and behavior of SPACA6. (a) The inhibitory effects of new antibodies (Mab17 and Mab18). They were investigated in in vitro fertilization
Supplemental Information. Ciliary Beating Compartmentalizes. Cerebrospinal Fluid Flow in the Brain. and Regulates Ventricular Development
 Current Biology, Volume Supplemental Information Ciliary Beating Compartmentalizes Cerebrospinal Fluid Flow in the Brain and Regulates Ventricular Development Emilie W. Olstad, Christa Ringers, Jan N.
Supplementary Figure 1. Characterization of NMuMG-ErbB2 and NIC breast cancer cells expressing shrnas targeting LPP. NMuMG-ErbB2 cells (a) and NIC
 and NIC") Supplementary Figure 1. Characterization of NMuMG-ErbB2 and NIC breast cancer cells expressing shrnas targeting LPP. NMuMG-ErbB2 cells (a) and NIC cells (b) were engineered to stably express either a LucA-shRNA
Supplementary Figure 1. Characterization of NMuMG-ErbB2 and NIC breast cancer cells expressing shrnas targeting LPP. NMuMG-ErbB2 cells (a) and NIC cells (b) were engineered to stably express either a LucA-shRNA
SUPPLEMENTARY INFORMATION
 doi:10.1038/nature12652 Supplementary Figure 1. PRDM16 interacts with endogenous EHMT1 in brown adipocytes. Immunoprecipitation of PRDM16 complex by flag antibody (M2) followed by Western blot analysis
SUPPLEMENTARY INFORMATION
 DOI:.38/ncb3399 a b c d FSP DAPI 5mm mm 5mm 5mm e Correspond to melanoma in-situ Figure a DCT FSP- f MITF mm mm MlanaA melanoma in-situ DCT 5mm FSP- mm mm mm mm mm g melanoma in-situ MITF MlanaA mm mm
Supplemental Table I
 Supplemental Table I Cortex Hippocampus Age (weeks) Genotype STE 61 pste 61 STE 61 pste 61 8 100.0 ± 4.4 96.2 ± 6.0 99.8 ± 8.7 167.5 ± 7.8* 100.0 ± 7.0 90.5 ± 13.8 100.0 ± 12.8 260.4 ± 33.9** 12 100.0
HEK293FT cells were transiently transfected with reporters, N3-ICD construct and
 Supplementary Information Luciferase reporter assay HEK293FT cells were transiently transfected with reporters, N3-ICD construct and increased amounts of wild type or kinase inactive EGFR. Transfections
Supplementary Figure S1
 Supplementary Figure S1 Supplementary Figure S1. PARP localization patterns using GFP-PARP and PARP-specific antibody libraries GFP-PARP localization in non-fixed (A) and formaldehyde fixed (B) GFP-PARPx
Supplementary Figure 1 IMQ-Induced Mouse Model of Psoriasis. IMQ cream was
 Supplementary Figure 1 IMQ-Induced Mouse Model of Psoriasis. IMQ cream was painted on the shaved back skin of CBL/J and BALB/c mice for consecutive days. (a, b) Phenotypic presentation of mouse back skin
Supporting Information
 Supporting Information ou et al..73/pnas.08791112 dd Thymidine Release & transfection dd Thymidine Release dd MG132 Fix and IF -14 h 0 h 8 h 24 h 34 h 36 h siontrol simps1-1 simps1-1 simps1-1 simps1-2
Coordinated Translocation of Mammalian Gli Proteins and Suppressor of Fused to the Primary Cilium
 Coordinated Translocation of Mammalian Gli Proteins and Suppressor of Fused to the Primary Cilium Huiqing Zeng 1, Jinping Jia 1, Aimin Liu 1,2 * 1 Department of Biology, Eberly College of Science, The
293T cells were transfected with indicated expression vectors and the whole-cell extracts were subjected
 SUPPLEMENTARY INFORMATION Supplementary Figure 1. Formation of a complex between Slo1 and CRL4A CRBN E3 ligase. (a) HEK 293T cells were transfected with indicated expression vectors and the whole-cell
A Normal Exencephaly Craniora- Spina bifida Microcephaly chischisis. Midbrain Forebrain/ Forebrain/ Hindbrain Spinal cord Hindbrain Hindbrain
 A Normal Exencephaly Craniora- Spina bifida Microcephaly chischisis NTD Number of embryos % among NTD Embryos Exencephaly 52 74.3% Craniorachischisis 6 8.6% Spina bifida 5 7.1% Microcephaly 7 1% B Normal
Adiponectin/T-cadherin system enhances exosome biogenesis and decreases cellular
 Supplemental Data Adiponectin/herin system enhances exosome biogenesis and decreases cellular ceramides by exosomal release 5 Yoshinari Obata, Shunbun Kita, *,, Yoshihisa Koyama, Shiro Fukuda, Hiroaki
Supplementary fig. 1. Crystals induce necroptosis does not involve caspases, TNF receptor or NLRP3. A. Mouse tubular epithelial cells were pretreated
 Supplementary fig. 1. Crystals induce necroptosis does not involve caspases, TNF receptor or NLRP3. A. Mouse tubular epithelial cells were pretreated with zvad-fmk (10µM) and exposed to calcium oxalate
Supplementary Figure S1. Monolayer differentiation of mouse ESCs into telencephalic neural precursors. (a) Schematic representation of the protocols
 Schematic representation of the protocols") Supplementary Figure S1. Monolayer differentiation of mouse ESCs into telencephalic neural precursors. (a) Schematic representation of the protocols used to differentiate mouse ESCs. (b) Representative
Supplementary Figure S1. Monolayer differentiation of mouse ESCs into telencephalic neural precursors. (a) Schematic representation of the protocols used to differentiate mouse ESCs. (b) Representative
SUPPLEMENTARY INFORMATION
 Figure S1 Treatment with both Sema6D and Plexin-A1 sirnas induces the phenotype essentially identical to that induced by treatment with Sema6D sirna alone or Plexin-A1 sirna alone. (a,b) The cardiac tube
Supplemental Table S1. Primers used in qrt-pcr analyses. Supplemental Figure S1, related to Figure 4. Extracellular matrix proteins
 Supplemental Material PDGFRb regulates craniofacial development through homodimers and functional heterodimers with PDGFRa Katherine A. Fantauzzo and Philippe Soriano Supplemental materials provided: Supplemental
Figure S1. HP1α localizes to centromeres in mitosis and interacts with INCENP. (A&B) HeLa
 HeLa") SUPPLEMENTARY FIGURES Figure S1. HP1α localizes to centromeres in mitosis and interacts with INCENP. (A&B) HeLa tet-on cells that stably express HP1α-CFP, HP1β-CFP, or HP1γ-CFP were monitored with livecell
SUPPLEMENTARY FIGURES Figure S1. HP1α localizes to centromeres in mitosis and interacts with INCENP. (A&B) HeLa tet-on cells that stably express HP1α-CFP, HP1β-CFP, or HP1γ-CFP were monitored with livecell
(a) Schematic diagram of the FS mutation of UVRAG in exon 8 containing the highly instable
 Schematic diagram of the FS mutation of UVRAG in exon 8 containing the highly instable") Supplementary Figure 1. Frameshift (FS) mutation in UVRAG. (a) Schematic diagram of the FS mutation of UVRAG in exon 8 containing the highly instable A 10 DNA repeat, generating a premature stop codon
Supplementary Figure 1. Frameshift (FS) mutation in UVRAG. (a) Schematic diagram of the FS mutation of UVRAG in exon 8 containing the highly instable A 10 DNA repeat, generating a premature stop codon
Cilia-Associated Oxysterols Activate Smoothened
 Article Cilia-Associated Oxysterols Activate Smoothened Graphical Abstract Authors David R. Raleigh, Navdar Sever, Pervinder K. Choksi,..., Libin Xu, Philip A. Beachy, Jeremy F. Reiter Correspondence jeremy.reiter@ucsf.edu
Supplementary Information
 Supplementary Information Title Degeneration and impaired regeneration of gray matter oligodendrocytes in amyotrophic lateral sclerosis Authors Shin H. Kang, Ying Li, Masahiro Fukaya, Ileana Lorenzini,
F-actin VWF Vinculin. F-actin. Vinculin VWF
 a F-actin VWF Vinculin b F-actin VWF Vinculin Supplementary Fig. 1. WPBs in HUVECs are located along stress fibers and at focal adhesions. (a) Immunofluorescence images of f-actin (cyan), VWF (yellow),
EPIGENETIC RE-EXPRESSION OF HIF-2α SUPPRESSES SOFT TISSUE SARCOMA GROWTH
 EPIGENETIC RE-EXPRESSION OF HIF-2α SUPPRESSES SOFT TISSUE SARCOMA GROWTH Supplementary Figure 1. Supplementary Figure 1. Characterization of KP and KPH2 autochthonous UPS tumors. a) Genotyping of KPH2
Nature Biotechnology: doi: /nbt.3828
 Supplementary Figure 1 Development of a FRET-based MCS. (a) Linker and MA2 modification are indicated by single letter amino acid code. indicates deletion of amino acids and N or C indicate the terminus
Supplementary Figure 1. Normal T lymphocyte populations in Dapk -/- mice. (a) Normal thymic development in Dapk -/- mice. Thymocytes from WT and Dapk
 Normal thymic development in Dapk -/- mice. Thymocytes from WT and Dapk") Supplementary Figure 1. Normal T lymphocyte populations in Dapk -/- mice. (a) Normal thymic development in Dapk -/- mice. Thymocytes from WT and Dapk -/- mice were stained for expression of CD4 and CD8.
Supplementary Figure 1. Normal T lymphocyte populations in Dapk -/- mice. (a) Normal thymic development in Dapk -/- mice. Thymocytes from WT and Dapk -/- mice were stained for expression of CD4 and CD8.
Supplementary Information. Induction of human pancreatic beta cell replication by inhibitors of dual specificity tyrosine regulated kinase
 Journal: Nature Medicine Supplementary Information Induction of human pancreatic beta cell replication by inhibitors of dual specificity tyrosine regulated kinase 1,2 Peng Wang PhD, 1,2 Juan-Carlos Alvarez-Perez
Supplementary Figure 1
 Supplementary Figure 1 6 HE-50 HE-116 E-1 HE-108 Supplementary Figure 1. Targeted drug response curves of endometrial cancer cells. Endometrial cancer cell lines were incubated with serial dilutions of
Supplementary Figures
 Supplementary Figures Supplementary Figure 1 DOT1L regulates the expression of epithelial and mesenchymal markers. (a) The expression levels and cellular localizations of EMT markers were confirmed by
Supplementary. presence of the. (c) mrna expression. Error. in naive or
 mrna expression. Error. in naive or") Figure 1. (a) Naive CD4 + T cells were activated in the presence of the indicated cytokines for 3 days. Enpp2 mrna expression was measured by qrt-pcrhr, infected with (b, c) Naive CD4 + T cells were activated
Figure 1. (a) Naive CD4 + T cells were activated in the presence of the indicated cytokines for 3 days. Enpp2 mrna expression was measured by qrt-pcrhr, infected with (b, c) Naive CD4 + T cells were activated
Supplemental Figures:
 Supplemental Figures: Figure 1: Intracellular distribution of VWF by electron microscopy in human endothelial cells. a) Immunogold labeling of LC3 demonstrating an LC3-positive autophagosome (white arrow)
TGF-β Signaling Regulates Neuronal C1q Expression and Developmental Synaptic Refinement
 Supplementary Information Title: TGF-β Signaling Regulates Neuronal C1q Expression and Developmental Synaptic Refinement Authors: Allison R. Bialas and Beth Stevens Supplemental Figure 1. In vitro characterization
SUPPLEMENTARY INFORMATION
 Supplementary Discussion The cell cycle machinery and the DNA damage response network are highly interconnected and co-regulated in assuring faithful duplication and partition of genetic materials into
Supplementary Figure 1 Chemokine and chemokine receptor expression during muscle regeneration (a) Analysis of CR3CR1 mrna expression by real time-pcr
 Analysis of CR3CR1 mrna expression by real time-pcr") Supplementary Figure 1 Chemokine and chemokine receptor expression during muscle regeneration (a) Analysis of CR3CR1 mrna expression by real time-pcr at day 0, 1, 4, 10 and 21 post- muscle injury. (b)
Supplementary Figure 1 Chemokine and chemokine receptor expression during muscle regeneration (a) Analysis of CR3CR1 mrna expression by real time-pcr at day 0, 1, 4, 10 and 21 post- muscle injury. (b)
SUPPLEMENTARY INFORMATION
 Supplementary Table 1. Cell sphingolipids and S1P bound to endogenous TRAF2. Sphingolipid Cell pmol/mg TRAF2 immunoprecipitate pmol/mg Sphingomyelin 4200 ± 250 Not detected Monohexosylceramide 311 ± 18
Figures S1-S5, Figure Legends, Table S1 List of primers used in the study
 Insulin receptor alternative splicing is regulated by insulin signaling and modulates beta cell survival Pushkar Malakar,4, Lital Chartarifsky,4, Ayat Hija, Gil Leibowitz 3, Benjamin Glaser 3, Yuval Dor,
IP: anti-gfp VPS29-GFP. IP: anti-vps26. IP: anti-gfp - + +
 FAM21 Strump. WASH1 IP: anti- 1 2 3 4 5 6 FAM21 Strump. FKBP IP: anti-gfp VPS29- GFP GFP-FAM21 tail H H/P P H H/P P c FAM21 FKBP Strump. VPS29-GFP IP: anti-gfp 1 2 3 FKBP VPS VPS VPS VPS29 1 = VPS29-GFP
Supplementary Information
 Supplementary Information Supplementary Figure 1. EBV-gB 23-431 mainly exists as trimer in HEK 293FT cells. (a) Western blotting analysis for DSS crosslinked FLAG-gB 23-431. HEK 293FT cells transfected
Supplementary Table 1.
 Supplementary Table 1. Expression of genes involved in brown fat differentiation in WAT of db/db mice treated with HDAC inhibitors. Data are expressed as fold change (FC) versus control. symbol FC SAHA
Downregulation of the small GTPase SAR1A: a key event underlying alcohol-induced Golgi fragmentation in hepatocytes
 Downregulation of the small GTPase SAR1A: a key event underlying alcohol-induced Golgi fragmentation in hepatocytes Armen Petrosyan 1*, Pi-Wan Cheng 1,3, Dahn L. Clemens 2,3 & Carol A. Casey 2,3 1 Department
Type of file: PDF Title of file for HTML: Supplementary Information Description: Supplementary Figures
 Type of file: PDF Title of file for HTML: Supplementary Information Description: Supplementary Figures Type of file: MOV Title of file for HTML: Supplementary Movie 1 Description: NLRP3 is moving along
Supplementary Figure 1. Expression of phospho-sik3 in normal and osteoarthritic articular cartilage in the knee. (a) Semiserial histological sections
 Semiserial histological sections") Supplementary Figure 1. Expression of phospho-sik3 in normal and osteoarthritic articular cartilage in the knee. (a) Semiserial histological sections of normal cartilage were stained with safranin O-fast
Supplementary Figure 1. Expression of phospho-sik3 in normal and osteoarthritic articular cartilage in the knee. (a) Semiserial histological sections of normal cartilage were stained with safranin O-fast
Postn MCM Smad2 fl/fl Postn MCM Smad3 fl/fl Postn MCM Smad2/3 fl/fl. Postn MCM. Tgfbr1/2 fl/fl TAC
 A Smad2 fl/fl Smad3 fl/fl Smad2/3 fl/fl Tgfbr1/2 fl/fl 1. mm B Tcf21 MCM Tcf21 MCM Smad3 fl/fl Tcf21 MCM Smad2/3 fl/fl Tcf21 MCM Tgfbr1/2 fl/fl αmhc MCM C 1. mm 1. mm D Smad2 fl/fl Smad3 fl/fl Smad2/3
SUPPLEMENTARY INFORMATION
 Supplementary Figure 1. Formation of the AA5x. a, Camera lucida drawing of embryo at 48 hours post fertilization (hpf, modified from Kimmel et al. Dev Dyn. 1995 203:253-310). b, Confocal microangiogram
SUPPLEMENTARY INFORMATION
 Supplementary Figure 1. Behavioural effects of ketamine in non-stressed and stressed mice. Naive C57BL/6 adult male mice (n=10/group) were given a single dose of saline vehicle or ketamine (3.0 mg/kg,
Supplementary Materials for
 www.sciencesignaling.org/cgi/content/full/6/283/ra57/dc1 Supplementary Materials for JNK3 Couples the Neuronal Stress Response to Inhibition of Secretory Trafficking Guang Yang,* Xun Zhou, Jingyan Zhu,
Supplemental Information. Menin Deficiency Leads to Depressive-like. Behaviors in Mice by Modulating. Astrocyte-Mediated Neuroinflammation
 Neuron, Volume 100 Supplemental Information Menin Deficiency Leads to Depressive-like Behaviors in Mice by Modulating Astrocyte-Mediated Neuroinflammation Lige Leng, Kai Zhuang, Zeyue Liu, Changquan Huang,
Supplementary information
 Supplementary information 1 Supplementary Figure 1. CALM regulates autophagy. (a). Quantification of LC3 levels in the experiment described in Figure 1A. Data are mean +/- SD (n > 3 experiments for each
SUPPLEMENTARY INFORMATION
 DOI: 10.1038/ncb2566 Figure S1 CDKL5 protein expression pattern and localization in mouse brain. (a) Multiple-tissue western blot from a postnatal day (P) 21 mouse probed with an antibody against CDKL5.
Base of Primary Cilia Using Superresolution STED Microscopy
 Revealing the Molecular Structure and the Transport Mechanism at the Base of Primary Cilia Using Superresolution STED Microscopy Tung-Lin Yang A dissertation submitted in partial fulfillment of the requirements
SUPPLEMENTARY INFORMATION
 doi:1.138/nature1554 a TNF-α + in CD4 + cells [%] 1 GF SPF 6 b IL-1 + in CD4 + cells [%] 5 4 3 2 1 Supplementary Figure 1. Effect of microbiota on cytokine profiles of T cells in GALT. Frequencies of TNF-α
Supplementary Figure 1 Induction of cellular senescence and isolation of exosome. a to c, Pre-senescent primary normal human diploid fibroblasts
 Supplementary Figure 1 Induction of cellular senescence and isolation of exosome. a to c, Pre-senescent primary normal human diploid fibroblasts (TIG-3 cells) were rendered senescent by either serial passage
Supplementary Figure 1. Nature Neuroscience: doi: /nn.4547
 Supplementary Figure 1 Characterization of the Microfetti mouse model. (a) Gating strategy for 8-color flow analysis of peripheral Ly-6C + monocytes from Microfetti mice 5-7 days after TAM treatment. Living
Control. csarnt -/- Cre, f/f
 ody weight (g) A re,f/f re x f/f f/+ re, f/+ re,f/+ f/f x f/f f/+ cs -/- re, f/f re f/f re, f/f Normal chow Tamoxifen Tamoxifen Tamoxifen W 4W re f/f re, re/ff f/f re f/f re, re/ff f/f Normal chow Tamoxifen