SUPPLEMENTARY FIGURES
|
|
|
- Sydney Foster
- 5 years ago
- Views:
Transcription
1 SUPPLEMENTARY FIGURES 1
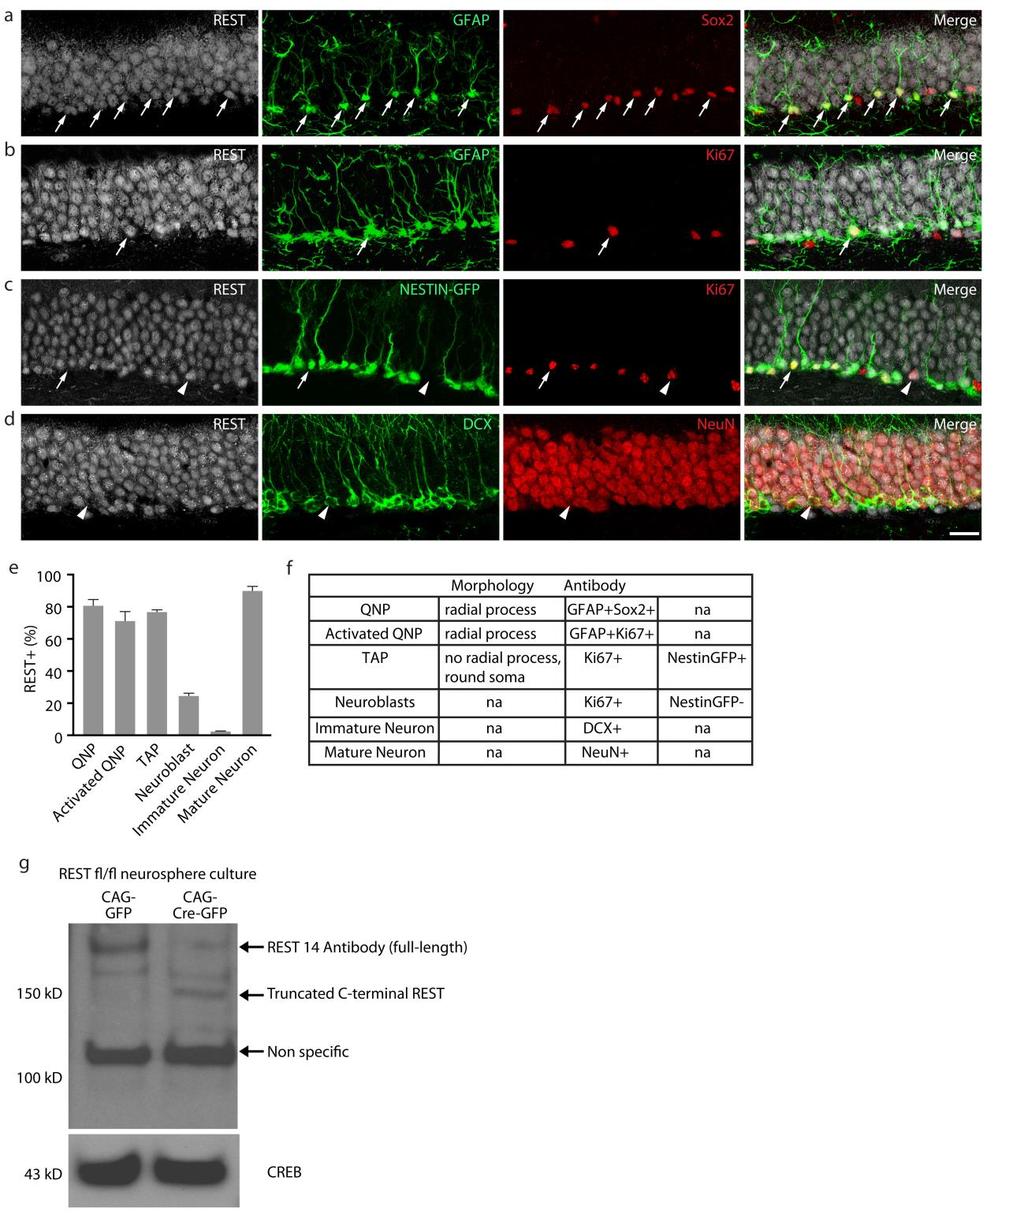
2 Supplementary Figure 1, Adult hippocampal QNPs and TAPs uniformly express REST a-b) Confocal images of adult hippocampal mouse sections showing GFAP (green), Sox2 (red), and REST (grey) triple-labeled QNP cells (arrows) (a) or GFAP (green), Ki67 (red), and REST (grey) triple-labeled activated QNP cells (arrows) (b). c) A representative section of an adult Nestin-GFP+ hippocampus. Arrow indicates a Nestin-GFP without radial process (green), Ki67 (red), and REST (grey) triple-labeled TAP cell. Arrowhead indicates a Nestin-GFP-, Ki67 (red), and REST (grey) triple-labeled neuroblast. d) REST (grey) staining was detected in NeuN (red) granule neurons but was almost absent from DCX (green) immature neurons. e) Quantification as percentage of REST co-labeled cells out of total QNPs, activated QNPs, TAPs, neuroblasts, immature neurons, and mature neurons. f) Table of morphology criteria and antibody combination of markers or transgenic reporter mice used to identify subtypes of neural stem cells and granule neurons in adult hippocampus. g) Western blot result from in vitro REST fl/fl neurospheres infected with Adenovirus CAG-GFP or CAG-Cre-GFP showing full length REST and truncated C-terminal REST peptide, respectively. For all quantifications, data are plotted as the mean ± SEM (*p 0.05 and ns = not significant). Scale bar in d: 20 m. One representative image from three independent WT control and Nestin-GFP transgenic mice are shown. NA = not applicable. 2

3 Supplementary Figure 2, Related to Figure 1: Specificity of lentivirus hgfap-cremcherry and confirmation of REST knockout efficiency Lentivirus hgfap-cre-p2a-mch injections were performed in hippocampal dentate gyrus of 6-8-week old WT mice. The resulting infected cells at 2dpi are shown. a-b) Confocal images of adult hippocampal mouse sections showing mch (red), GFAP (grey), and DAPI (blue) labeled cells co-expressing a) Sox2 (green) or b) Ki67 (green). Quadruple-labeled a) QNP cells (arrow) or astrocyte cell (arrowhead) (inset d) or b) activated QNP cells (arrow). b) mch (red) staining was almost absent from GFAP-Ki67+ (green) TAP cells. c) mch (red) staining was almost absent from DCX+ (grey) cells and NeuN+ (green) granule neurons. e) Quantification of the total number of mch+ QNP cells (inset a: mch (red), Sox2 (green)), activated QNP cells (inset c: mch (red), Ki67 (green)), astrocyte cells (inset b: mch (red), Sox2 (green)), TAP cells, immature neurons and mature neurons per dentate gyrus. f) Quantification of the percentage of 3
4 mch+ co-labeled cells out of the total mch+ cells. g) Genotyping PCR result from FACS sorted REST fl/fl tail, mch-ve and mch+ve cells to show in vivo deletion of REST by lenti-hgfap- Cre-p2A-mCh resulting in 1.2 kb band for the targeted allele and 2.8 kb band for the intact REST fl/fl allele. For all quantifications, data are plotted as the mean ± SEM (*p 0.05 and ns = not significant). Scale bar in c: 20 m. One representative image from three independent WT genotype mice is shown. 4
 or iqnps can be reactivated (TAP ) with FGF-2 treatment. b) Brightfield images of TAP, iqnp and TAP HCN cells.")
5 Supplementary Figure 3, In vitro model of quiescence a) HCN cells treated with FGF-2 and BMP4 become quiescent (iqnp). HCN cells can be maintained in a proliferative state (TAP) or iqnps can be reactivated (TAP ) with FGF-2 treatment. b) Brightfield images of TAP, iqnp and TAP HCN cells. c-d) Immunofluorescent analysis of TAP, iqnp and TAP HCN cells fixed at 3 days (iqnp and TAP) or 6 days (TAP only) in vitro and stained with proliferation markers, c) Ki67 (red) and d) BrdU (red). e) Immunofluorescent analysis of TAP and TAP HCN cells fixed after growing in differentiation conditions in vitro and stained with differentiation markers, Tuj1 (neuronal marker, red), GFAP (astrocyte marker, green) and RIP1 (oligodendrocyte marker, green). Quantification of f) Ki67 and h) BrdU as percent of all cells (DAPI+). g) Cell cycle analysis by PI flow cytometry of TAP, iqnp and TAP HCN cells. i) Quantification of Tuj1, GFAP and RIP1 as percent of all cells (DAPI+). For all 5
6 quantifications, data are plotted as the mean ± SEM (*p 0.05 and ns = not significant). Scale bars in b, c, d and e: 20 m. All experiments were performed at least three times independently. Experiments were analyzed for statistical significance using an unpaired, two-tailed Student s t- test. 6

7 Supplementary Figure 4, Related to Figure 3: REST is required for maintenance of iqnp and TAPs in vitro 7
8 To confirm efficiency of REST knockdown in vitro, HCN cells in iqnp and TAP conditions were electroporated with a control EGFP or REST shrna-egfp vector. a,d) qpcr validation of REST mrna knockdown in REST shrna electroporated compared to control electroporated cells in iqnps (a) and TAPs (d). Immunofluorescent analysis and quantification of electroporated cells fixed at 2.5 days in vitro and stained with proliferation markers, b) BrdU (red) in iqnp condition, e) BrdU (red) in TAP condition or neuronal differentiation marker g) Tuj1 in TAP condition. Quantification of electroporated c) BrdU in iqnp conditions, f) BrdU in TAP conditions and h) Tuj1 in TAP condition as percent of all electroporated cells (EGFP+). For all quantifications, data are plotted as the mean ± SEM (*p 0.05 and ns = not significant). Scale bars in b, e and g: 20 m. All experiments were performed at least three times independently. Experiments were analyzed for statistical significance using an unpaired, two-tailed Student s t- test. 8

9 Supplementary Figure 5, Related to Figure 5: Validation of REST antibodies used in ChIPseq studies a) Western blot result from in vitro REST shrna and control vector transduced and FACS sorted iqnp HCN cells probed with the commercial REST antibody showing full length REST and non-specific band or probed with REST14 and 17 antibodies. Beta-actin and GAPDH served 9
10 as loading controls. b-d) Venn-diagram overlap of REST bound peaks obtained with either REST14 and 17 antibodies or the REST commercial antibody in iqnp ChIP-seq (b) and TAP ChIP-seq (c). d,e) ChIP-qPCR validation of select REST target genes using the commercial REST (d) or REST14 and 17 (e) antibodies from in vitro REST shrna and control vector transduced and FACS sorted iqnp HCN cells. For all quantifications, data are plotted as the mean ± SEM (*p 0.05 and ns = not significant). All experiments were performed at least two times independently. Experiments were analyzed for statistical significance using an unpaired, two-tailed Student s t-test. 10
11 Supplementary Figure 6, Related to Figure 5: REST binding sites on unique and common iqnp and TAP targets 11
12 a-c) Enrichment of REST (normalized to 5% Input) at a) common targets, b) unique iqnp targets and c) unique TAP targets. d-f) De novo identified motifs by HOMER in common targets (d), unique iqnp targets (e) and unique TAP targets (f). 12
13 13
14 Supplementary Figure 7, Related to Figure 5: REST represses ribosome biogenesis and cell cycle genes in iqnp conditions a-g) UCSC genome browser snapshot of REST target ribosome biogenesis and cell cycle genes: Rps6 (a), Npm1 (b), Rpl4 (c), Cdc20 (d), Mms22l (e), Rad51 (f), and Tipin (g) loci showing REST ChIP-seq and RNA-seq results. 14
 qpcr validation of overexpression of Cdc20, Tipin, Mms22l, Rad51, Npm1, Rpl4 and Rps6 mrna in iqnp conditions electroporated with a control lenti-hgfap-ires-mch or overexpression")
15 Supplementary Figure 8, Related to Figure 6: Confirmation of REST target gene overexpression and control BrUTP experiments. a) qpcr validation of overexpression of Cdc20, Tipin, Mms22l, Rad51, Npm1, Rpl4 and Rps6 mrna in iqnp conditions electroporated with a control lenti-hgfap-ires-mch or overexpression lenti-hgfap-cdna-ires-mch vector. b,e) Immunofluorescent analysis of 15
16 BrUTP+(red)DAPI+(blue) in iqnp and TAP conditions without any inhibitor (b) or in presence of actinomycin D inhibitor (e). c,d) Quantification of area occupied by the whole cell DAPI+ (c) and number of labeled BrUTP puncta (d) in iqnp and TAP conditions. For all quantifications, data are plotted as the mean ± SEM (*p 0.05 and ns = not significant). Scale bar in e: 20 m. All experiments were performed at least three times independently. ns = not significant. Experiments were analyzed for statistical significance using an unpaired, two-tailed Student s t- test. 16
17 SUPPLEMENTARY TABLE Supplementary Table 1: Gene Ontology showing candidate REST targets upregulated in REST knockdown only in iqnps (unique iqnp targets), only in TAPs (unique TAP targets) and in both (common targets). Highlighted genes indicate selected iqnp targets for subsequent validation and functional studies. 17
18 Antibody Name Company (Catalogue Number) Dilution Technique used Anti-REST, REST14 Inhouse, Cocalico Biologicals, Inc. 1:500 IHC, WB Anti-REST, two antibodies REST14, REST17 mixed 1:1 for all uses Inhouse, Cocalico Biologicals, Inc. 1:40 of each ChIP Anti-REST commercial Millipore (17-641) 10ug ChIP Anti-GFAP Millipore (MAB360) 1:500 IHC Anti-Sox2 Santa cruz (sc-17320) 1:500 IHC Anti-Ki67 Neomarkers (RM-9106) 1:250 IHC, ICC Anti-DCX Millipore (AB2253) 1:500 IHC Anti-NeuN Chemicon (MAB377) 1:1000 IHC Anti-mCh Novus (NBP ) 1:500 IHC, ICC Anti-mCh Life Technologies (M11217) 1:500 IHC, ICC Anti-DsRed (also detect mch) Clontech (632496) 1:500 IHC, ICC Anti-GFP Aveslabs (GFP-1020) 1:1000 IHC, ICC Anti-IdU Sigma (SAB ) 1:250 ICC Anti-BrdU Accurate (OBT0030) 1:250 ICC Anti-TUJ1 Covance (E10344JF) 1:7500 ICC Anti-RIP1 Hybridoma Bank 1:500 ICC Anti-RIP2 Hybridoma Bank 1:500 ICC Anti-CREB Cell Signaling (9197) 1:1000 WB Supplementary Table 2: Antibody List. Abbreviations used, IHC=Immunohistochemistry, ICC=Immunocytochemistry, WB=Western Blot, ChIP=Chromatin immunoprecipitation. 18
Comparison of open chromatin regions between dentate granule cells and other tissues and neural cell types.
 Supplementary Figure 1 Comparison of open chromatin regions between dentate granule cells and other tissues and neural cell types. (a) Pearson correlation heatmap among open chromatin profiles of different
Supplementary Figure 1. Efficiency of Mll4 deletion and its effect on T cell populations in the periphery. Nature Immunology: doi: /ni.
 Supplementary Figure 1 Efficiency of Mll4 deletion and its effect on T cell populations in the periphery. Expression of Mll4 floxed alleles (16-19) in naive CD4 + T cells isolated from lymph nodes and
Supplemental Figure 1. Intracranial transduction of a modified ptomo lentiviral vector in the mouse
 Supplemental figure legends Supplemental Figure 1. Intracranial transduction of a modified ptomo lentiviral vector in the mouse hippocampus targets GFAP-positive but not NeuN-positive cells. (A) Stereotaxic
Supplementary Figures
 Supplementary Figures Supplementary Figure 1. Confirmation of Dnmt1 conditional knockout out mice. a, Representative images of sorted stem (Lin - CD49f high CD24 + ), luminal (Lin - CD49f low CD24 + )
Supplementary Information
 Supplementary Information Astrocytes regulate adult hippocampal neurogenesis through ephrin-b signaling Randolph S. Ashton, Anthony Conway, Chinmay Pangarkar, Jamie Bergen, Kwang-Il Lim, Priya Shah, Mina
Neocortex Zbtb20 / NFIA / Sox9
 Neocortex / NFIA / Sox9 Supplementary Figure 1. Expression of, NFIA, and Sox9 in the mouse neocortex at. The lower panels are higher magnification views of the oxed area. Arrowheads indicate triple-positive
marker. DAPI labels nuclei. Flies were 20 days old. Scale bar is 5 µm. Ctrl is
 Supplementary Figure 1. (a) Nos is detected in glial cells in both control and GFAP R79H transgenic flies (arrows), but not in deletion mutant Nos Δ15 animals. Repo is a glial cell marker. DAPI labels
Supplemental Information. Induction of Expansion and Folding. in Human Cerebral Organoids
 Cell Stem Cell, Volume 20 Supplemental Information Induction of Expansion and Folding in Human Cerebral Organoids Yun Li, Julien Muffat, Attya Omer, Irene Bosch, Madeline A. Lancaster, Mriganka Sur, Lee
(a) Significant biological processes (upper panel) and disease biomarkers (lower panel)
 Significant biological processes (upper panel) and disease biomarkers (lower panel)") Supplementary Figure 1. Functional enrichment analyses of secretomic proteins. (a) Significant biological processes (upper panel) and disease biomarkers (lower panel) 2 involved by hrab37-mediated secretory
Supplementary Figure 1. Functional enrichment analyses of secretomic proteins. (a) Significant biological processes (upper panel) and disease biomarkers (lower panel) 2 involved by hrab37-mediated secretory
Genesis of cerebellar interneurons and the prevention of neural DNA damage require XRCC1.
 Genesis of cerebellar interneurons and the prevention of neural DNA damage require XRCC1. Youngsoo Lee, Sachin Katyal, Yang Li, Sherif F. El-Khamisy, Helen R. Russell, Keith W. Caldecott and Peter J. McKinnon.
Supplementary Materials for
 www.sciencesignaling.org/cgi/content/full/8/375/ra41/dc1 Supplementary Materials for Actin cytoskeletal remodeling with protrusion formation is essential for heart regeneration in Hippo-deficient mice
Supplemental Information. Otic Mesenchyme Cells Regulate. Spiral Ganglion Axon Fasciculation. through a Pou3f4/EphA4 Signaling Pathway
 Neuron, Volume 73 Supplemental Information Otic Mesenchyme Cells Regulate Spiral Ganglion Axon Fasciculation through a Pou3f4/EphA4 Signaling Pathway Thomas M. Coate, Steven Raft, Xiumei Zhao, Aimee K.
EPIGENETIC RE-EXPRESSION OF HIF-2α SUPPRESSES SOFT TISSUE SARCOMA GROWTH
 EPIGENETIC RE-EXPRESSION OF HIF-2α SUPPRESSES SOFT TISSUE SARCOMA GROWTH Supplementary Figure 1. Supplementary Figure 1. Characterization of KP and KPH2 autochthonous UPS tumors. a) Genotyping of KPH2
SUPPLEMENTARY INFORMATION
 SUPPLEMENTARY INFORMATION doi:10.1038/nature11306 Supplementary Figures Supplementary Figure 1. Basic characterization of GFP+ RGLs in the dentate gyrus of adult nestin-gfp mice. a, Sample confocal images
SUPPLEMENTARY INFORMATION
 DOI: 10.1038/ncb2566 Figure S1 CDKL5 protein expression pattern and localization in mouse brain. (a) Multiple-tissue western blot from a postnatal day (P) 21 mouse probed with an antibody against CDKL5.
TEB. Id4 p63 DAPI Merge. Id4 CK8 DAPI Merge
 a Duct TEB b Id4 p63 DAPI Merge Id4 CK8 DAPI Merge c d e Supplementary Figure 1. Identification of Id4-positive MECs and characterization of the Comma-D model. (a) IHC analysis of ID4 expression in the
Nature Immunology: doi: /ni Supplementary Figure 1. Transcriptional program of the TE and MP CD8 + T cell subsets.
 Supplementary Figure 1 Transcriptional program of the TE and MP CD8 + T cell subsets. (a) Comparison of gene expression of TE and MP CD8 + T cell subsets by microarray. Genes that are 1.5-fold upregulated
Supplementary Figure 1 IL-27 IL
 Tim-3 Supplementary Figure 1 Tc0 49.5 0.6 Tc1 63.5 0.84 Un 49.8 0.16 35.5 0.16 10 4 61.2 5.53 10 3 64.5 5.66 10 2 10 1 10 0 31 2.22 10 0 10 1 10 2 10 3 10 4 IL-10 28.2 1.69 IL-27 Supplementary Figure 1.
Zhu et al, page 1. Supplementary Figures
 Zhu et al, page 1 Supplementary Figures Supplementary Figure 1: Visual behavior and avoidance behavioral response in EPM trials. (a) Measures of visual behavior that performed the light avoidance behavior
Nature Structural & Molecular Biology: doi: /nsmb Supplementary Figure 1
 Supplementary Figure 1 Effect of HSP90 inhibition on expression of endogenous retroviruses. (a) Inducible shrna-mediated Hsp90 silencing in mouse ESCs. Immunoblots of total cell extract expressing the
Supplementary Figure 1. Validation of astrocytes. Primary astrocytes were
 Supplementary Figure 1. Validation of astrocytes. Primary astrocytes were separated from the glial cultures using a mild trypsinization protocol. Anti-glial fibrillary acidic protein (GFAP) immunofluorescent
Supplementary Figure S1: Tanycytes are restricted to the central/posterior hypothalamus
 Supplementary Figure S1: Tanycytes are restricted to the central/posterior hypothalamus a: Expression of Vimentin, GFAP, Sox2 and Nestin in anterior, central and posterior hypothalamus. In the anterior
Supplementary Figure 1. A. Bar graph representing the expression levels of the 19 indicated genes in the microarrays analyses comparing human lung
 Supplementary Figure 1. A. Bar graph representing the expression levels of the 19 indicated genes in the microarrays analyses comparing human lung immortalized broncho-epithelial cells (AALE cells) expressing
SUPPLEMENTARY INFORMATION
 DOI: 10.1038/ncb2535 Figure S1 SOX10 is expressed in human giant congenital nevi and its expression in human melanoma samples suggests that SOX10 functions in a MITF-independent manner. a, b, Representative
Supplemental Information. Menin Deficiency Leads to Depressive-like. Behaviors in Mice by Modulating. Astrocyte-Mediated Neuroinflammation
 Neuron, Volume 100 Supplemental Information Menin Deficiency Leads to Depressive-like Behaviors in Mice by Modulating Astrocyte-Mediated Neuroinflammation Lige Leng, Kai Zhuang, Zeyue Liu, Changquan Huang,
Nature Immunology: doi: /ni Supplementary Figure 1. Id2 and Id3 define polyclonal T H 1 and T FH cell subsets.
 Supplementary Figure 1 Id2 and Id3 define polyclonal T H 1 and T FH cell subsets. Id2 YFP/+ (a) or Id3 GFP/+ (b) mice were analyzed 7 days after LCMV infection. T H 1 (SLAM + CXCR5 or CXCR5 PD-1 ), T FH
TISSUE-SPECIFIC STEM CELLS
 TISSUE-SPECIFIC STEM CELLS Running Rescues Defective Adult Neurogenesis by Shortening the Length of the Cell Cycle of Neural Stem and Progenitor Cells STEFANO FARIOLI VECCHIOLI, a ANDREA MATTERA, a LAURA
Supplementary Figure 1 IMQ-Induced Mouse Model of Psoriasis. IMQ cream was
 Supplementary Figure 1 IMQ-Induced Mouse Model of Psoriasis. IMQ cream was painted on the shaved back skin of CBL/J and BALB/c mice for consecutive days. (a, b) Phenotypic presentation of mouse back skin
SUPPLEMENTARY INFORMATION
 SUPPLEMENTARY INFORMATION Supplementary Figure 1. The expression of ephrin-b2 H2BGFP persists in the post-hearingonset organ of Corti and is specifically restricted to supporting cells. Sox2 immunolabeling
7SK ChIRP-seq is specifically RNA dependent and conserved between mice and humans.
 Supplementary Figure 1 7SK ChIRP-seq is specifically RNA dependent and conserved between mice and humans. Regions targeted by the Even and Odd ChIRP probes mapped to a secondary structure model 56 of the
Nature Immunology: doi: /ni Supplementary Figure 1. Characteristics of SEs in T reg and T conv cells.
 Supplementary Figure 1 Characteristics of SEs in T reg and T conv cells. (a) Patterns of indicated transcription factor-binding at SEs and surrounding regions in T reg and T conv cells. Average normalized
Supplementary Figure 1: Hsp60 / IEC mice are embryonically lethal (A) Light microscopic pictures show mouse embryos at developmental stage E12.
 Light microscopic pictures show mouse embryos at developmental stage E12.") Supplementary Figure 1: Hsp60 / IEC mice are embryonically lethal (A) Light microscopic pictures show mouse embryos at developmental stage E12.5 and E13.5 prepared from uteri of dams and subsequently genotyped.
Supplementary Figure 1: Hsp60 / IEC mice are embryonically lethal (A) Light microscopic pictures show mouse embryos at developmental stage E12.5 and E13.5 prepared from uteri of dams and subsequently genotyped.
Supplementary Figure 1. Blood glucose and insulin levels in mice during 4-day infusion.
 Supplementary Figure 1. Blood glucose and insulin levels in mice during 4-day infusion. (A-B) WT and HT mice infused with saline or glucose had overlapping achieved blood glucose and insulin levels, necessitating
SUPPLEMENTARY FIGURES
 SUPPLEMENTARY FIGURES 1 2 3 4 SUPPLEMENTARY TABLES Supplementary Table S1. Brain Tumors used in the study Code Tumor Classification Age Gender HuTuP51 Glioblastoma 57 Male HuTuP52 Glioblastoma 53 Male
Supplemental Figure 1
 Supplemental Figure 1 1a 1c PD-1 MFI fold change 6 5 4 3 2 1 IL-1α IL-2 IL-4 IL-6 IL-1 IL-12 IL-13 IL-15 IL-17 IL-18 IL-21 IL-23 IFN-α Mut Human PD-1 promoter SBE-D 5 -GTCTG- -1.2kb SBE-P -CAGAC- -1.kb
Nature Neuroscience: doi: /nn.2275
 Supplementary Figure S1. The presence of MeCP2 in enriched primary glial cultures from rat or mouse brains is not neuronal. Western blot analysis of protein extracts from (a) rat glial and neuronal cultures.
mir-7a regulation of Pax6 in neural stem cells controls the spatial origin of forebrain dopaminergic neurons
 Supplemental Material mir-7a regulation of Pax6 in neural stem cells controls the spatial origin of forebrain dopaminergic neurons Antoine de Chevigny, Nathalie Coré, Philipp Follert, Marion Gaudin, Pascal
well for 2 h at rt. Each dot represents an individual mouse and bar is the mean ±
 Supplementary data: Control DC Blimp-1 ko DC 8 6 4 2-2 IL-1β p=.5 medium 8 6 4 2 IL-2 Medium p=.16 8 6 4 2 IL-6 medium p=.3 5 4 3 2 1-1 medium IL-1 n.s. 25 2 15 1 5 IL-12(p7) p=.15 5 IFNγ p=.65 4 3 2 1
SUPPLEMENTARY INFORMATION
 doi:10.1038/nature12652 Supplementary Figure 1. PRDM16 interacts with endogenous EHMT1 in brown adipocytes. Immunoprecipitation of PRDM16 complex by flag antibody (M2) followed by Western blot analysis
Primary Mouse Cerebral Cortex Neurons V: 80% TE: 70%
 Primary Mouse Cerebral Cortex Neurons V: 80% TE: 70% Pictures: 9 days after electroporation Red: MAP2 Blue: GFAP Green: GFP The cells were from Embryonic Day 14 Mouse Cerebral Cortex Primary Mouse Hippocampal
Supplementary Materials for
 www.sciencesignaling.org/cgi/content/full/7/308/ra4/dc1 Supplementary Materials for Antipsychotics Activate mtorc1-dependent Translation to Enhance Neuronal Morphological Complexity Heather Bowling, Guoan
Nature Genetics: doi: /ng Supplementary Figure 1
 Supplementary Figure 1 MSI2 interactors are associated with the riboproteome and are functionally relevant. (a) Coomassie blue staining of FLAG-MSI2 immunoprecipitated complexes. (b) GO analysis of MSI2-interacting
Electron micrograph of phosphotungstanic acid-stained exosomes derived from murine
 1 SUPPLEMENTARY INFORMATION SUPPLEMENTARY FIGURES Supplementary Figure 1. Physical properties of murine DC-derived exosomes. a, Electron micrograph of phosphotungstanic acid-stained exosomes derived from
Supplemental Figure S1. RANK expression on human lung cancer cells.
 Supplemental Figure S1. RANK expression on human lung cancer cells. (A) Incidence and H-Scores of RANK expression determined from IHC in the indicated primary lung cancer subgroups. The overall expression
Supplementary Figure 1: si-craf but not si-braf sensitizes tumor cells to radiation.
 Supplementary Figure 1: si-craf but not si-braf sensitizes tumor cells to radiation. (a) Embryonic fibroblasts isolated from wildtype (WT), BRAF -/-, or CRAF -/- mice were irradiated (6 Gy) and DNA damage
SOPten flox/flox (KO) Pten flox/flox (WT) flox allele 6.0 kb. Pten. Actin. ! allele 2.3 kb. Supplementary Figure S1. Yanagi, et al.
 Pten flox/flox (WT) flox allele 6.0 kb. Pten. Actin. ! allele 2.3 kb. Supplementary Figure S1. Yanagi, et al.") s1 A Pten flox/flox () SOPten flox/flox () flox allele 6. kb B Pten flox/flox () SOPten flox/flox () Pten Actin! allele 2.3 kb Supplementary Figure S1. Yanagi, et al. A B BrdU BrdU positive cells ( ) 3
s1 A Pten flox/flox () SOPten flox/flox () flox allele 6. kb B Pten flox/flox () SOPten flox/flox () Pten Actin! allele 2.3 kb Supplementary Figure S1. Yanagi, et al. A B BrdU BrdU positive cells ( ) 3
T H E J O U R N A L O F C E L L B I O L O G Y
 T H E J O U R N A L O F C E L L B I O L O G Y Supplemental material Amelio et al., http://www.jcb.org/cgi/content/full/jcb.201203134/dc1 Figure S1. mir-24 regulates proliferation and by itself induces
Supplementary Figure 1
 VO (ml kg - min - ) VCO (ml kg - min - ) Respiratory exchange ratio Energy expenditure (cal kg - min - ) Locomotor activity (x count) Body temperature ( C) Relative mrna expression TA Sol EDL PT Heart
PKCζ Promotes Breast Cancer Invasion by Regulating Expression of E-cadherin and Zonula Occludens-1 (ZO-1) via NFκB-p65
 via NFκB-p65") SUPPLEMENTARY INFORMATION TITLE: PKCζ Promotes Breast Cancer Invasion by Regulating Expression of E-cadherin and Zonula Occludens-1 (ZO-1) via NFκB-p65 RUNNING TITLE: PKCζ-NFκB Signaling in Breast Cancer
SUPPLEMENTARY INFORMATION TITLE: PKCζ Promotes Breast Cancer Invasion by Regulating Expression of E-cadherin and Zonula Occludens-1 (ZO-1) via NFκB-p65 RUNNING TITLE: PKCζ-NFκB Signaling in Breast Cancer
Supplementary Figure 1. Baf60c and baf180 are induced during cardiac regeneration in zebrafish. RNA in situ hybridization was performed on paraffin
 Supplementary Figure 1. Baf60c and baf180 are induced during cardiac regeneration in zebrafish. RNA in situ hybridization was performed on paraffin sections from sham-operated adult hearts (a and i) and
SUPPLEMENTARY INFORMATION
 doi:10.1038/nature12215 Supplementary Figure 1. The effects of full and dissociated GR agonists in supporting BFU-E self-renewal divisions. BFU-Es were cultured in self-renewal medium with indicated GR
AAV-TBGp-Cre treatment resulted in hepatocyte-specific GH receptor gene recombination
 AAV-TBGp-Cre treatment resulted in hepatocyte-specific GH receptor gene recombination Supplementary Figure 1. Generation of the adult-onset, liver-specific GH receptor knock-down (alivghrkd, Kd) mouse
Kaul 1. Kaul et al _Inventory of Supplemental Materials. Supplemental Figures and Figure Legends. Figure S1, related to Figure 1
 Kaul 1 Kaul et al _Inventory of Supplemental Materials Supplemental Figures and Figure Legends Figure S1, related to Figure 1 Figure S2, related to Figure 2 Figure S3, related to Figure 3 Figure S4, related
Supplemental Information
 Supplemental Information Tobacco-specific Carcinogen Induces DNA Methyltransferases 1 Accumulation through AKT/GSK3β/βTrCP/hnRNP-U in Mice and Lung Cancer patients Ruo-Kai Lin, 1 Yi-Shuan Hsieh, 2 Pinpin
Supplementary Information
 Supplementary Information Title Degeneration and impaired regeneration of gray matter oligodendrocytes in amyotrophic lateral sclerosis Authors Shin H. Kang, Ying Li, Masahiro Fukaya, Ileana Lorenzini,
Nature Immunology: doi: /ni Supplementary Figure 1. Huwe1 has high expression in HSCs and is necessary for quiescence.
 Supplementary Figure 1 Huwe1 has high expression in HSCs and is necessary for quiescence. (a) Heat map visualizing expression of genes with a known function in ubiquitin-mediated proteolysis (KEGG: Ubiquitin
Title: Epigenetic mechanisms underlying maternal diabetes-associated risk of congenital heart disease
 1 Supplemental Materials 2 3 Title: Epigenetic mechanisms underlying maternal diabetes-associated risk of congenital heart disease 4 5 6 Authors: Madhumita Basu, 1 Jun-Yi Zhu, 2 Stephanie LaHaye 1,3, Uddalak
Supplementary Figure 1
 Supplementary Figure 1 AAV-GFP injection in the MEC of the mouse brain C57Bl/6 mice at 4 months of age were injected with AAV-GFP into the MEC and sacrificed at 7 days post injection (dpi). (a) Brains
fl/+ KRas;Atg5 fl/+ KRas;Atg5 fl/fl KRas;Atg5 fl/fl KRas;Atg5 Supplementary Figure 1. Gene set enrichment analyses. (a) (b)
 (b)") KRas;At KRas;At KRas;At KRas;At a b Supplementary Figure 1. Gene set enrichment analyses. (a) GO gene sets (MSigDB v3. c5) enriched in KRas;Atg5 fl/+ as compared to KRas;Atg5 fl/fl tumors using gene set
KRas;At KRas;At KRas;At KRas;At a b Supplementary Figure 1. Gene set enrichment analyses. (a) GO gene sets (MSigDB v3. c5) enriched in KRas;Atg5 fl/+ as compared to KRas;Atg5 fl/fl tumors using gene set
293T cells were transfected with indicated expression vectors and the whole-cell extracts were subjected
 SUPPLEMENTARY INFORMATION Supplementary Figure 1. Formation of a complex between Slo1 and CRL4A CRBN E3 ligase. (a) HEK 293T cells were transfected with indicated expression vectors and the whole-cell
Supplementary Figure 1 ITGB1 and ITGA11 increase with evidence for heterodimers following HSC activation. (a) Time course of rat HSC activation
 Time course of rat HSC activation") Supplementary Figure 1 ITGB1 and ITGA11 increase with evidence for heterodimers following HSC activation. (a) Time course of rat HSC activation indicated by the detection of -SMA and COL1 (log scale).
Supplementary Figure 1 ITGB1 and ITGA11 increase with evidence for heterodimers following HSC activation. (a) Time course of rat HSC activation indicated by the detection of -SMA and COL1 (log scale).
SHREE ET AL, SUPPLEMENTAL MATERIALS. (A) Workflow for tumor cell line derivation and orthotopic implantation.
 Workflow for tumor cell line derivation and orthotopic implantation.") SHREE ET AL, SUPPLEMENTAL MATERIALS SUPPLEMENTAL FIGURE AND TABLE LEGENDS Supplemental Figure 1. Derivation and characterization of TS1-TGL and TS2-TGL PyMT cell lines and development of an orthotopic
SHREE ET AL, SUPPLEMENTAL MATERIALS SUPPLEMENTAL FIGURE AND TABLE LEGENDS Supplemental Figure 1. Derivation and characterization of TS1-TGL and TS2-TGL PyMT cell lines and development of an orthotopic
Supplementary Figures
 Supplementary Figures Supplementary Figure 1 Characterization of stable expression of GlucB and sshbira in the CT26 cell line (a) Live cell imaging of stable CT26 cells expressing green fluorescent protein
Supplementary Figure 1: Expression of NFAT proteins in Nfat2-deleted B cells (a+b) Protein expression of NFAT2 (a) and NFAT1 (b) in isolated splenic
 Protein expression of NFAT2 (a) and NFAT1 (b) in isolated splenic") Supplementary Figure 1: Expression of NFAT proteins in Nfat2-deleted B cells (a+b) Protein expression of NFAT2 (a) and NFAT1 (b) in isolated splenic B cells from WT Nfat2 +/+, TCL1 Nfat2 +/+ and TCL1 Nfat2
Supplementary Figure 1: Expression of NFAT proteins in Nfat2-deleted B cells (a+b) Protein expression of NFAT2 (a) and NFAT1 (b) in isolated splenic B cells from WT Nfat2 +/+, TCL1 Nfat2 +/+ and TCL1 Nfat2
Figure S1. (A) Schematic diagram of dnrar transgene allele. (B) X-Gal staining of testis from
 Schematic diagram of dnrar transgene allele. (B) X-Gal staining of testis from") Figure S1. (A) Schematic diagram of dnrar transgene allele. (B) X-Gal staining of testis from germ cell mutants (dnrar flox/flox, Stra8-Cre +, RARElacZ) (A ), controls (dnrar flox/flox, RARElacZ) (B ),
Figure S1. (A) Schematic diagram of dnrar transgene allele. (B) X-Gal staining of testis from germ cell mutants (dnrar flox/flox, Stra8-Cre +, RARElacZ) (A ), controls (dnrar flox/flox, RARElacZ) (B ),
GFP/Iba1/GFAP. Brain. Liver. Kidney. Lung. Hoechst/Iba1/TLR9!
 Supplementary information a +KA Relative expression d! Tlr9 5!! 5! NSC Neuron Astrocyte Microglia! 5! Tlr7!!!! NSC Neuron Astrocyte! GFP/Sβ/! Iba/Hoechst Microglia e Hoechst/Iba/TLR9! GFP/Iba/GFAP f Brain
Nature Structural & Molecular Biology: doi: /nsmb Supplementary Figure 1. Differential expression of mirnas from the pri-mir-17-92a locus.
 Supplementary Figure 1 Differential expression of mirnas from the pri-mir-17-92a locus. (a) The mir-17-92a expression unit in the third intron of the host mir-17hg transcript. (b,c) Impact of knockdown
Supplementary methods:
 Supplementary methods: Primers sequences used in real-time PCR analyses: β-actin F: GACCTCTATGCCAACACAGT β-actin [11] R: AGTACTTGCGCTCAGGAGGA MMP13 F: TTCTGGTCTTCTGGCACACGCTTT MMP13 R: CCAAGCTCATGGGCAGCAACAATA
SUPPLEMENTARY INFORMATION
 SUPPLEMENTARY INFORMATION Supplementary Figure 1. Generation of a conditional allele of the Kindlin-2 gene. (A) A restriction map of the relevant genomic region of Kindlin-2 (top), the targeting construct
SUPPLEMENTARY FIGURE LEGENDS. atypical adenomatous hyperplasias (AAH); Grade II: adenomas; Grade III: adenocarcinomas;
; Grade II: adenomas; Grade III: adenocarcinomas;") SUPPLEMENTARY FIGURE LEGENDS Supplementary Figure S1: Tumor grades in Ras G12D ; p53 / lung tumors. Representative histology (H&E) of K-Ras G12D ; p53 / lung tumors 13 weeks after tumor initiation. Grade
SUPPLEMENTARY FIGURE LEGENDS Supplementary Figure S1: Tumor grades in Ras G12D ; p53 / lung tumors. Representative histology (H&E) of K-Ras G12D ; p53 / lung tumors 13 weeks after tumor initiation. Grade
SUPPLEMENTARY INFORMATION
 DOI: 10.1038/ncb2607 Figure S1 Elf5 loss promotes EMT in mammary epithelium while Elf5 overexpression inhibits TGFβ induced EMT. (a, c) Different confocal slices through the Z stack image. (b, d) 3D rendering
SUPPLEMENTARY LEGENDS...
 TABLE OF CONTENTS SUPPLEMENTARY LEGENDS... 2 11 MOVIE S1... 2 FIGURE S1 LEGEND... 3 FIGURE S2 LEGEND... 4 FIGURE S3 LEGEND... 5 FIGURE S4 LEGEND... 6 FIGURE S5 LEGEND... 7 FIGURE S6 LEGEND... 8 FIGURE
SUPPLEMENTARY INFORMATION
 DOI: 1.138/ncb3355 a S1A8 + cells/ total.1.8.6.4.2 b S1A8/?-Actin c % T-cell proliferation 3 25 2 15 1 5 T cells Supplementary Figure 1 Inter-tumoral heterogeneity of MDSC accumulation in mammary tumor
Name Animal source Vendor Cat # Dilutions
 Supplementary data Table S1. Primary and Secondary antibody sources Devi et al, TXNIP in mitophagy A. Primary Antibodies Name Animal source Vendor Cat # Dilutions 1. TXNIP mouse MBL KO205-2 1:2000 (WB)
Prss56, a novel marker of adult neurogenesis in the mouse brain. - Supplemental Figures 1 to 5- Brain Structure and Function
 Prss56, a novel marker of adult neurogenesis in the mouse brain - Supplemental Figures 1 to 5- Brain Structure and Function Alexandre Jourdon 1,2, Aurélie Gresset 1, Nathalie Spassky 1, Patrick Charnay
Nature Immunology: doi: /ni Supplementary Figure 1. DNA-methylation machinery is essential for silencing of Cd4 in cytotoxic T cells.
 Supplementary Figure 1 DNA-methylation machinery is essential for silencing of Cd4 in cytotoxic T cells. (a) Scheme for the retroviral shrna screen. (b) Histogram showing CD4 expression (MFI) in WT cytotoxic
Soft Agar Assay. For each cell pool, 100,000 cells were resuspended in 0.35% (w/v)
") SUPPLEMENTARY MATERIAL AND METHODS Soft Agar Assay. For each cell pool, 100,000 cells were resuspended in 0.35% (w/v) top agar (LONZA, SeaKem LE Agarose cat.5004) and plated onto 0.5% (w/v) basal agar.
SUPPLEMENTARY MATERIAL AND METHODS Soft Agar Assay. For each cell pool, 100,000 cells were resuspended in 0.35% (w/v) top agar (LONZA, SeaKem LE Agarose cat.5004) and plated onto 0.5% (w/v) basal agar.
SUPPLEMENTARY INFORMATION
 Supplementary Figure 1. Behavioural effects of ketamine in non-stressed and stressed mice. Naive C57BL/6 adult male mice (n=10/group) were given a single dose of saline vehicle or ketamine (3.0 mg/kg,
Supplemental Figures Supplemental Figure 1:
 Supplemental Figures Supplemental Figure 1: Representative FACS data showing Concurrent Brain cell type Acquisition using either Percoll PLUS (top row) or myelin removal beads (bottom two rows). Debris
Supplementary Figure 1
 Supplementary Figure 1 The average sigmoid parametric curves of capillary dilation time courses and average time to 50% peak capillary diameter dilation computed from individual capillary responses averaged
Nature Neuroscience: doi: /nn Supplementary Figure 1
 Supplementary Figure 1 Quantification of myelin fragments in the aging brain (a) Electron microscopy on corpus callosum is shown for a 18-month-old wild type mice. Myelin fragments (arrows) were detected
supplementary information
 DOI: 10.1038/ncb2153 Figure S1 Ectopic expression of HAUSP up-regulates REST protein. (a) Immunoblotting showed that ectopic expression of HAUSP increased REST protein levels in ENStemA NPCs. (b) Immunofluorescent
Expanded View Figures
 PEX13 functions in selective autophagy Ming Y Lee et al Expanded View Figures Figure EV1. PEX13 is required for Sindbis virophagy. A, B Quantification of mcherry-capsid puncta per cell (A) and GFP-LC3
SUPPLEMENTARY DATA. Supplementary Table 2. Antibodies used for Immunofluoresence. Supplementary Table 3. Real-time PCR primer sequences.
 Supplementary Table 2. Antibodies used for Immunofluoresence. Antibody Dilution Source Goat anti-pdx1 1:100 R&D Systems Rabbit anti-hnf6 1:100 Santa Cruz Biotechnology Mouse anti-nkx6.1 1:200 Developmental
Supplementary Figure 1
 Supplementary Figure 1 Kif1a RNAi effect on basal progenitor differentiation Related to Figure 2. Representative confocal images of the VZ and SVZ of rat cortices transfected at E16 with scrambled or Kif1a
hexahistidine tagged GRP78 devoid of the KDEL motif (GRP78-His) on SDS-PAGE. This
 on SDS-PAGE. This") SUPPLEMENTAL FIGURE LEGEND Fig. S1. Generation and characterization of. (A) Coomassie staining of soluble hexahistidine tagged GRP78 devoid of the KDEL motif (GRP78-His) on SDS-PAGE. This protein was expressed
SUPPLEMENTAL FIGURE LEGEND Fig. S1. Generation and characterization of. (A) Coomassie staining of soluble hexahistidine tagged GRP78 devoid of the KDEL motif (GRP78-His) on SDS-PAGE. This protein was expressed
TGF-β Signaling Regulates Neuronal C1q Expression and Developmental Synaptic Refinement
 Supplementary Information Title: TGF-β Signaling Regulates Neuronal C1q Expression and Developmental Synaptic Refinement Authors: Allison R. Bialas and Beth Stevens Supplemental Figure 1. In vitro characterization
Nature Neuroscience: doi: /nn Supplementary Figure 1. MADM labeling of thalamic clones.
 Supplementary Figure 1 MADM labeling of thalamic clones. (a) Confocal images of an E12 Nestin-CreERT2;Ai9-tdTomato brain treated with TM at E10 and stained for BLBP (green), a radial glial progenitor-specific
Supplemental Information. Metabolic Maturation during Muscle Stem Cell. Differentiation Is Achieved by mir-1/133a-mediated
 Cell Metabolism, Volume 27 Supplemental Information Metabolic Maturation during Muscle Stem Cell Differentiation Is Achieved by mir-1/133a-mediated Inhibition of the Dlk1-Dio3 Mega Gene Cluster Stas Wüst,
TISSUE-SPECIFIC STEM CELLS
 TISSUE-SPECIFIC STEM CELLS Brain Insulin-Like Growth Factor-I Directs the Transition from Stem Cells to Mature Neurons During Postnatal/Adult Hippocampal Neurogenesis VANESA NIETO-ESTÉVEZ, a,b CARLOS O.
Loss of RhoA promotes skin tumor formation. Supplementary Figure 1. Loss of RhoA does not impair F-actin organization.
 Supplementary Figure Legends Supplementary Figure 1. Loss of RhoA does not impair F-actin organization. a. Representative IF images of F-actin staining of big and small control (left) and RhoA ko tumors
Erzsebet Kokovay, Susan Goderie, Yue Wang, Steve Lotz, Gang Lin, Yu Sun, Badrinath Roysam, Qin Shen,
 Cell Stem Cell, Volume 7 Supplemental Information Adult SVZ Lineage Cells Home to and Leave the Vascular Niche via Differential Responses to SDF1/CXCR4 Signaling Erzsebet Kokovay, Susan Goderie, Yue Wang,
Supplementary Figure 1: STAT3 suppresses Kras-induced lung tumorigenesis
 Supplementary Figure 1: STAT3 suppresses Kras-induced lung tumorigenesis (a) Immunohistochemical (IHC) analysis of tyrosine 705 phosphorylation status of STAT3 (P- STAT3) in tumors and stroma (all-time
SUPPLEMENTARY INFORMATION. Supplementary Figures S1-S9. Supplementary Methods
 SUPPLEMENTARY INFORMATION SUMO1 modification of PTEN regulates tumorigenesis by controlling its association with the plasma membrane Jian Huang 1,2#, Jie Yan 1,2#, Jian Zhang 3#, Shiguo Zhu 1, Yanli Wang
Nature Neuroscience: doi: /nn Supplementary Figure 1
 Supplementary Figure 1 Subcellular segregation of VGluT2-IR and TH-IR within the same VGluT2-TH axon (wild type rats). (a-e) Serial sections of a dual VGluT2-TH labeled axon. This axon (blue outline) has
Sirt1 Hmg20b Gm (0.17) 24 (17.3) 877 (857)
 24 (17.3) 877 (857)") 3 (0.17) 24 (17.3) Sirt1 Hmg20 Gm4763 877 (857) c d Suppl. Figure 1. Screen validation for top candidate antagonists of Dot1L (a) Numer of genes with one (gray), two (cyan) or three (red) shrna scored
3 (0.17) 24 (17.3) Sirt1 Hmg20 Gm4763 877 (857) c d Suppl. Figure 1. Screen validation for top candidate antagonists of Dot1L (a) Numer of genes with one (gray), two (cyan) or three (red) shrna scored
SUPPLEMENTARY INFORMATION
 doi:10.1038/nature10188 Supplementary Figure 1. Embryonic epicardial genes are down-regulated from midgestation stages and barely detectable post-natally. Real time qrt-pcr revealed a significant down-regulation
Supporting Information
 Supporting Information Franco et al. 10.1073/pnas.1015557108 SI Materials and Methods Drug Administration. PD352901 was dissolved in 0.5% (wt/vol) hydroxyl-propyl-methylcellulose, 0.2% (vol/vol) Tween
Supplementary Figure 1.
 Supplementary Figure 1. Increased β cell mass and islet diameter in βtsc2 -/- mice up to 35 weeks A: Reconstruction of multiple anti-insulin immunofluorescence images showing differences in β cell mass
Supplementary Figure 1 Expression of Crb3 in mouse sciatic nerve: biochemical analysis (a) Schematic of Crb3 isoforms, ERLI and CLPI, indicating the
 Schematic of Crb3 isoforms, ERLI and CLPI, indicating the") Supplementary Figure 1 Expression of Crb3 in mouse sciatic nerve: biochemical analysis (a) Schematic of Crb3 isoforms, ERLI and CLPI, indicating the location of the transmembrane (TM), FRM binding (FB)
Supplementary Figure 1 Expression of Crb3 in mouse sciatic nerve: biochemical analysis (a) Schematic of Crb3 isoforms, ERLI and CLPI, indicating the location of the transmembrane (TM), FRM binding (FB)