Supplementary Information
|
|
|
- Amber Grant
- 5 years ago
- Views:
Transcription
1 Supplementary Information Antibody validation and scoring guidelines for ABCG2 immunohistochemical staining in formalin-fixed paraffin embedded colon cancer tissue Camilla Natasha Cederbye 1, Jesper Andreas Palshof 2, Tine Plato Hansen 3, Anne Katrine Duun-Henriksen 4, Dorte Linnemann 5, Jan Stenvang 1, Dorte Lisbet Nielsen 2, Nils Brünner 1, and Birgitte Martine Viuff 1 Affiliations 1. Faculty of Health and Medical Sciences, Department of Veterinary Disease Biology, Section for Molecular Disease Biology, University of Copenhagen, Strandboulevarden 49, DK Copenhagen Ø, Denmark 2. Department of Oncology, Herlev and Gentofte Hospital, University of Copenhagen, Herlev Ringvej 75, DK-2730 Herlev, Denmark 3. Department of Pathology, Hvidovre Hospital, Kettegaard Alle 30, DK Hvidovre, Denmark 4. Danish Cancer Society, Strandboulevarden 49, DK Copenhagen Ø, Denmark 5. Department of Pathology, Herlev and Gentofte Hospital, University of Copenhagen, Herlev Ringvej 75, DK-2730 Herlev, Denmark Correspondence: Birgitte Martine Viuff Faculty of Health and Medical Sciences, Department of Veterinary Disease Biology, Section for Molecular Disease Biology, University of Copenhagen, Strandboulevarden 49, DK Copenhagen Ø, Denmark bmv@sund.ku.dk

2 Supplementary figure S1 Flowchart illustrating the validation process of six commercially available anti-abcg2 antibodies. Three antibodies were excluded based on western blot results. Three antibodies were examined by ICC and IHC. The mouse mab anti-abcg2 antibody BXP-21 was used in the subsequent IHC analyses of clinical samples.


.")


 MDA DMSO (d) MDA")
3 a b c d e f Supplementary figure S2 Immunostaining of ABCG2 in LoVo, MDA-MB-231, and MCF7 parental and ABCG2 up-regulated cell lines using mab 6D171 (1:3000 dilution). ABCG2 was visualized with DAB, and sections were counterstained with Mayer s hematoxylin, 40x magnification. (a) LoVo parental (b) LoVo SN-38RES (c) MDA DMSO (d) MDA SN-38RES (e) MCF7 DMSO and (f) MCF7 SN-38RES.


 and sections were")

 MDA DMSO (d) MDA")
4 a b c d e f Supplementary figure S3 Immunostaining of ABCG2 using pab B7185 (1:500 dilution) on LoVo, MDA-MB-231, and MCF7 parental and ABCG2 up-regulated cell lines. ABCG2 was visualized with DAB (brown) and sections were counterstained with Mayer s hematoxylin, 40x magnification. (a) LoVo parental (b) LoVo SN-38RES (c) MDA DMSO (d) MDA SN-38RES (e) MCF7 DMSO and (f) MCF7 SN-38RES.


5 a b c d e f Supplementary figure S4
6 Supplementary figure S4 a-b: Western blot evaluation of mab 6D171 specificity by sirna-mediated down-regulation of ABCG2 (72 kda). Two parental cell lines (LoVo parental and MDA DMSO ) were analyzed alongside their SN38 resistant counterparts (LoVo SN-38RES and MDA SN-38RES ) with upregulated levels of ABCG2 as indicated above the membranes. (a) LoVo parental and LoVo SN-38RES and (b) MDA DMSO and MDA SN-38RES. The cells were untreated, transfected with a universal negative control sirna (universal) or transfected with a mixture of three different ABCG2-targeting sirnas as indicated above the membranes. β-actin (42 kda) was used as a loading control. The molecular weight marker is indicated. c-f: Immunostaining of ABCG2 in sirna down-regulated LoVo SN-38RES and MDA SN-38RES with mab 6D171 (1:3000 dilution). ABCG2 was detected using the HiDef Detection TM HRP Polymer system and counterstained with Mayer s hematoxylin, 40x magnification. (c) LoVo SN-38RES transfected with universal sirna. (d) LoVo SN-38RES transfected with ABCG2-specific sirna. (e) MDA SN-38RES transfected with universal sirna. (f) MDA SN-38RES transfected with ABCG2-specific sirna. The results are similar to the results seen for BXP-21 with a partial ABCG2 down-regulation in LoVo SN-38RES and an almost complete ABCG2 down-regulation in MDA SN-38.

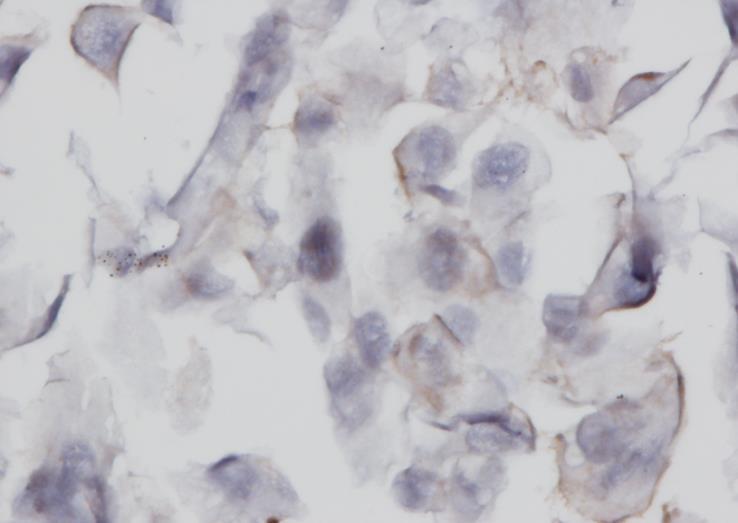
 Normal colon tissue with distinct staining of the apical")

7 a b c Supplementary figure S5 Immunostaining of ABCG2 in normal tissue using BXP-21. ABCG2 was visualized with DAB+ and counterstained with Mayer s hematoxylin, 20x magnification (a) Normal colon tissue with distinct staining of the apical membrane of epithelial cells, exemplified by the arrow (b) Normal colon tissue with distinct staining of endothelial cells in the lamina propria, exemplified by the arrow (c) Liver tissue with distinct staining of bile canaliculi, exemplified by arrows.
 with up-regulated levels of ABCG2 were analyzed alongside their parental counterparts (LoVo parental, MDA DMSO, and")
8 kda ABCB1 144 kda β-actin 42 kda 37 Supplementary figure S6 Western blot evaluation of ABCB1 expression in ABCG2 up-regulated cell lines. The three SN38 resistant cell lines (LoVo SN-38RES, MDA SN-38RES, and MCF7 SN38RES) with up-regulated levels of ABCG2 were analyzed alongside their parental counterparts (LoVo parental, MDA DMSO, and MCF7 DMSO) as indicated above the membranes. The anti-abcb1 mab (clone EPR , Abcam) was used to demonstrate ABCB1. β-actin (42 kda) was used as a loading control. The molecular weight marker is indicated. Only the SN38 resistant cell line, LoVo SN-38RES expressed detectable levels of ABCB1.


9 a ABCB1 144 kda ABCG2 72 kda kda β-actin 42 kda b c d Supplementary figure S7 e
10 Supplementary figure S7 a: Western blot evaluation of mab BXP-21 potential cross-reactivity toward ABCB1 (predicted molecular weight of 144 kda). Two parental cell lines (MDA parental and MCF7 parental) were analyzed alongside their docetaxel-resistant counterparts (MDA DTXRES and MCF7 DTXRES ) with upregulated levels of ABCB1 as indicated above the membrane. Firstly, mab BXP- 21 was evaluated and for this purpose the full membrane is displayed to reveal the presence of all reactive bands upon antibody incubation. Secondly, the membrane was stripped and the upper part of the membrane was re-probed with anti-abcb1 (144 kda) whereas the lower part of the membrane was re-probed with anti-βactin (42 kda) which was used as a loading control. The molecular weight marker is indicated. b-e: Immunostaining of ABCG2 in parental MDA and MCF7 cell lines and their docetaxel-resistant counterparts with BXP-21 (1:3000 dilution). ABCG2 was detected using the HiDef Detection TM HRP Polymer system and counterstained with Mayer s hematoxylin, 40x magnification. (b) MDA parental (c) MDA DTXRES (d) MCF7 parental and (e) MCF7 DTXRES. No membrane staining was observed in the ABCB1 up-regulated cell line MDA DTXRES. The membrane staining detected in MCF7 DTXRES probably represents ABCG2 as the intensity of the immunoreaction was the same for MCF7 parental and MCF7 DTXRES.

 using the HiDef")

 Fixation in NBF for 5 minutes.")
 Fixation in NBF for 6 hours.")
11 a b c e d Supplementary figure S8 Immunostaining of ABCG2 in differently fixed LoVo SN-38RES cells with BXP-21 (1:3000 dilution) using the HiDef Detection TM HRP Polymer system. Sections were counterstained with Mayer s hematoxylin, 40x magnification. (a) Fixation in NBF for 5 minutes. (b) Fixation in NBF for 30 minutes. (c) Fixation in NBF for 6 hours. (d) Fixation in NBF for 1 week. (e) Fixation in NBF for 1 month.

12 Supplementary figure S9 Concordance between whole sections (X-axis) and the max TMA scores (Y-axis). ABCG2 immunostaining in whole sections and TMAs was assessed, and the basolateral membranes were scored from 0 to 3 using the described scoring guidelines. For cases in which the duplicate TMA scores were not identical, the maximum score was chosen (max TMA). The bar diagram shows a high degree of concordance between whole sections and TMAs (n = 57).
PKCζ Promotes Breast Cancer Invasion by Regulating Expression of E-cadherin and Zonula Occludens-1 (ZO-1) via NFκB-p65
 via NFκB-p65") SUPPLEMENTARY INFORMATION TITLE: PKCζ Promotes Breast Cancer Invasion by Regulating Expression of E-cadherin and Zonula Occludens-1 (ZO-1) via NFκB-p65 RUNNING TITLE: PKCζ-NFκB Signaling in Breast Cancer
SUPPLEMENTARY INFORMATION TITLE: PKCζ Promotes Breast Cancer Invasion by Regulating Expression of E-cadherin and Zonula Occludens-1 (ZO-1) via NFκB-p65 RUNNING TITLE: PKCζ-NFκB Signaling in Breast Cancer
(A) RT-PCR for components of the Shh/Gli pathway in normal fetus cell (MRC-5) and a
 RT-PCR for components of the Shh/Gli pathway in normal fetus cell (MRC-5) and a") Supplementary figure legends Supplementary Figure 1. Expression of Shh signaling components in a panel of gastric cancer. (A) RT-PCR for components of the Shh/Gli pathway in normal fetus cell (MRC-5) and
Supplementary figure legends Supplementary Figure 1. Expression of Shh signaling components in a panel of gastric cancer. (A) RT-PCR for components of the Shh/Gli pathway in normal fetus cell (MRC-5) and
Supplementary Table 1. The primers used for quantitative RT-PCR. Gene name Forward (5 > 3 ) Reverse (5 > 3 )
 Reverse (5 > 3 )") 770 771 Supplementary Table 1. The primers used for quantitative RT-PCR. Gene name Forward (5 > 3 ) Reverse (5 > 3 ) Human CXCL1 GCGCCCAAACCGAAGTCATA ATGGGGGATGCAGGATTGAG PF4 CCCCACTGCCCAACTGATAG TTCTTGTACAGCGGGGCTTG
770 771 Supplementary Table 1. The primers used for quantitative RT-PCR. Gene name Forward (5 > 3 ) Reverse (5 > 3 ) Human CXCL1 GCGCCCAAACCGAAGTCATA ATGGGGGATGCAGGATTGAG PF4 CCCCACTGCCCAACTGATAG TTCTTGTACAGCGGGGCTTG
Downregulation of the small GTPase SAR1A: a key event underlying alcohol-induced Golgi fragmentation in hepatocytes
 Downregulation of the small GTPase SAR1A: a key event underlying alcohol-induced Golgi fragmentation in hepatocytes Armen Petrosyan 1*, Pi-Wan Cheng 1,3, Dahn L. Clemens 2,3 & Carol A. Casey 2,3 1 Department
(A) PCR primers (arrows) designed to distinguish wild type (P1+P2), targeted (P1+P2) and excised (P1+P3)14-
 PCR primers (arrows) designed to distinguish wild type (P1+P2), targeted (P1+P2) and excised (P1+P3)14-") 1 Supplemental Figure Legends Figure S1. Mammary tumors of ErbB2 KI mice with 14-3-3σ ablation have elevated ErbB2 transcript levels and cell proliferation (A) PCR primers (arrows) designed to distinguish
1 Supplemental Figure Legends Figure S1. Mammary tumors of ErbB2 KI mice with 14-3-3σ ablation have elevated ErbB2 transcript levels and cell proliferation (A) PCR primers (arrows) designed to distinguish
Supplementary Material
 Electronic Supplementary Material (ESI) for Integrative Biology. This journal is The Royal Society of Chemistry 2018 Supplementary Material 1 Supplemental Figures Supplemental Figure S1. Mechanical properties
Supplementary Figures
 Supplementary Figures Supplementary Figure 1 Characterization of stable expression of GlucB and sshbira in the CT26 cell line (a) Live cell imaging of stable CT26 cells expressing green fluorescent protein
Identification and clinical validation of biomarkers for drug resistance.
 01/02/2017 1 Identification and clinical validation of biomarkers for drug resistance. Jan Stenvang & Nils Brünner, Institute of Drug Design and Pharmacology University of Copenhagen & Danish Cancer Society
Fang et al. NMuMG. PyVmT unstained Anti-CCR2-PE MDA-MB MCF MCF10A
 A NMuMG PyVmT 16.5+.5 47.+7.2 Fang et al. unstained Anti-CCR2-PE 4T1 Control 37.6+6.3 56.1+.65 MCF1A 16.1+3. MCF-7 3.1+5.4 MDA-M-231 42.1+5.5 unstained Secondary antibody only Anti-CCR2 SUPPLEMENTAL FIGURE
To determine the effect of over-expression and/or ligand activation of. PPAR / on cell cycle, cell lines were cultured as described above until ~80%
 Supplementary Materials and Methods Cell cycle analysis To determine the effect of over-expression and/or ligand activation of PPAR / on cell cycle, cell lines were cultured as described above until ~80%
hexahistidine tagged GRP78 devoid of the KDEL motif (GRP78-His) on SDS-PAGE. This
 on SDS-PAGE. This") SUPPLEMENTAL FIGURE LEGEND Fig. S1. Generation and characterization of. (A) Coomassie staining of soluble hexahistidine tagged GRP78 devoid of the KDEL motif (GRP78-His) on SDS-PAGE. This protein was expressed
SUPPLEMENTAL FIGURE LEGEND Fig. S1. Generation and characterization of. (A) Coomassie staining of soluble hexahistidine tagged GRP78 devoid of the KDEL motif (GRP78-His) on SDS-PAGE. This protein was expressed
Supplemental figure 1. PDGFRα is expressed dominantly by stromal cells surrounding mammary ducts and alveoli. A) IHC staining of PDGFRα in
 IHC staining of PDGFRα in") Supplemental figure 1. PDGFRα is expressed dominantly by stromal cells surrounding mammary ducts and alveoli. A) IHC staining of PDGFRα in nulliparous (left panel) and InvD6 mouse mammary glands (right
Supplemental figure 1. PDGFRα is expressed dominantly by stromal cells surrounding mammary ducts and alveoli. A) IHC staining of PDGFRα in nulliparous (left panel) and InvD6 mouse mammary glands (right
Supplemental Material:
 Supplemental Material: MATERIALS AND METHODS RNA interference Mouse CHOP sirna (ON-TARGETplus SMARTpool Cat# L-062068-00) and control sirna (ON-TARGETplus Control) were purchased from Dharmacon. Transfection
Argininosuccinate synthetase 1 suppression and arginine restriction inhibit cell
 Argininosuccinate synthetase 1 suppression and arginine restriction inhibit cell migration in gastric cancer cell lines Yan-Shen Shan 1, Hui-Ping Hsu 1, Ming-Derg Lai 2,3, Meng-Chi Yen 2,4, Wei-Ching Chen
Next-Generation Immunohistochemistry: Multiplex tissue imaging with mass cytometry
 Nat Met, April 2014 Nat Med, April 2014 Next-Generation Immunohistochemistry: Multiplex tissue imaging with mass cytometry Journal Club Timo Böge Overview Introduction Conventional Immunohistochemistry
Anti-PD-L1 antibody [28-8] ab205921
![Anti-PD-L1 antibody [28-8] ab205921](/thumbs/84/91196262.jpg "Anti-PD-L1 antibody [28-8] ab205921") Anti-PD-L1 antibody [28-8] ab205921 2 Abreviews 16 References 15 Images Overview Product name Anti-PD-L1 antibody [28-8] Description Tested applications Species reactivity Immunogen Rabbit monoclonal [28-8]
Anti-PD-L1 antibody [28-8] ab205921 2 Abreviews 16 References 15 Images Overview Product name Anti-PD-L1 antibody [28-8] Description Tested applications Species reactivity Immunogen Rabbit monoclonal [28-8]
Supplementary Figure S I: Effects of D4F on body weight and serum lipids in apoe -/- mice.
 Supplementary Figures: Supplementary Figure S I: Effects of D4F on body weight and serum lipids in apoe -/- mice. Male apoe -/- mice were fed a high-fat diet for 8 weeks, and given PBS (model group) or
Anti-Lamin B1/LMNB1 Picoband Antibody
 Anti-Lamin B1/LMNB1 Picoband Antibody Catalog Number:PB9611 About LMNB1 Lamin-B1 is a protein that in humans is encoded by the LMNB1 gene. The nuclear lamina consists of a two-dimensional matrix of proteins
Supplementary Figures
 Supplementary Figures Supplementary Figure 1. Confirmation of Dnmt1 conditional knockout out mice. a, Representative images of sorted stem (Lin - CD49f high CD24 + ), luminal (Lin - CD49f low CD24 + )
Supplementary Materials. for Garmy-Susini, et al, Integrin 4 1 signaling is required for lymphangiogenesis and tumor metastasis
 Supplementary Materials for Garmy-Susini, et al, Integrin 4 1 signaling is required for lymphangiogenesis and tumor metastasis 1 Supplementary Figure Legends Supplementary Figure 1: Integrin expression
Assessment performed on Friday, September 18, 2015, at Vancouver General Hospital
 Assessors report for ciqc Run 49: ATRX (June 2015) Assessors: S Yip and J Won (recorder) Assessment performed on Friday, September 18, 2015, at Vancouver General Hospital Background The combined application
SUPPLEMENTARY INFORMATION. Supplementary Figures S1-S9. Supplementary Methods
 SUPPLEMENTARY INFORMATION SUMO1 modification of PTEN regulates tumorigenesis by controlling its association with the plasma membrane Jian Huang 1,2#, Jie Yan 1,2#, Jian Zhang 3#, Shiguo Zhu 1, Yanli Wang
Immunostaining was performed on tumor biopsy samples arranged in a tissue-microarray format or on
 Supplemental Methods Immunohistochemical Analyses Immunostaining was performed on tumor biopsy samples arranged in a tissue-microarray format or on prostatectomy sections obtained post-study. Briefly,
Supplementary Figure 1. PD-L1 is glycosylated in cancer cells. (a) Western blot analysis of PD-L1 in breast cancer cells. (b) Western blot analysis
 Western blot analysis of PD-L1 in breast cancer cells. (b) Western blot analysis") Supplementary Figure 1. PD-L1 is glycosylated in cancer cells. (a) Western blot analysis of PD-L1 in breast cancer cells. (b) Western blot analysis of PD-L1 in ovarian cancer cells. (c) Western blot analysis
Supplementary Figure 1. PD-L1 is glycosylated in cancer cells. (a) Western blot analysis of PD-L1 in breast cancer cells. (b) Western blot analysis of PD-L1 in ovarian cancer cells. (c) Western blot analysis
Supplementary Figures
 Supplementary Figures Supplementary Figure 1 DOT1L regulates the expression of epithelial and mesenchymal markers. (a) The expression levels and cellular localizations of EMT markers were confirmed by
Assessment Run GATA3
 Assessment Run 44 2015 GATA3 Material The slide to be stained for GATA3 comprised: 1. Tonsil 2. Kidney, 3. Urothelial carcinoma, 4. Breast ductal carcinoma, 5. Colon adenocarcinoma All tissues were fixed
Carcinoembryonic antigen (CEA)
") Assessment Run 37 2013 Carcinoembryonic antigen (CEA) Material The slide to be stained for CEA comprised: 1. Appendix, 2. Liver, 3-4. Colon adenocarcinoma, 5. Urothelial carcinoma All tissues were fixed
Assessment Run 37 2013 Carcinoembryonic antigen (CEA) Material The slide to be stained for CEA comprised: 1. Appendix, 2. Liver, 3-4. Colon adenocarcinoma, 5. Urothelial carcinoma All tissues were fixed
Assessment Run NKX3.1 (NKX3.1)
") Assessment Run 49 2017 NKX3.1 (NKX3.1) Material The slide to be stained for NKX3.1 comprised: 1. Testis 2. Appendix 3-4. Prostate adenocarcinoma 5. Prostate hyperplasia All tissues were fixed in 10% neutral
Assessment Run 49 2017 NKX3.1 (NKX3.1) Material The slide to be stained for NKX3.1 comprised: 1. Testis 2. Appendix 3-4. Prostate adenocarcinoma 5. Prostate hyperplasia All tissues were fixed in 10% neutral
Supplementary Fig. 1. GPRC5A post-transcriptionally down-regulates EGFR expression. (a) Plot of the changes in steady state mrna levels versus
 Plot of the changes in steady state mrna levels versus") Supplementary Fig. 1. GPRC5A post-transcriptionally down-regulates EGFR expression. (a) Plot of the changes in steady state mrna levels versus changes in corresponding proteins between wild type and Gprc5a-/-
Supplementary Fig. 1. GPRC5A post-transcriptionally down-regulates EGFR expression. (a) Plot of the changes in steady state mrna levels versus changes in corresponding proteins between wild type and Gprc5a-/-
Supplementary Figure 1: Neuregulin 1 increases the growth of mammary organoids compared to EGF. (a) Mammary epithelial cells were freshly isolated,
 Mammary epithelial cells were freshly isolated,") 1 2 3 4 5 6 7 8 9 10 Supplementary Figure 1: Neuregulin 1 increases the growth of mammary organoids compared to EGF. (a) Mammary epithelial cells were freshly isolated, embedded in matrigel and exposed
1 2 3 4 5 6 7 8 9 10 Supplementary Figure 1: Neuregulin 1 increases the growth of mammary organoids compared to EGF. (a) Mammary epithelial cells were freshly isolated, embedded in matrigel and exposed
Supplementary Materials for
 www.sciencesignaling.org/cgi/content/full/7/308/ra4/dc1 Supplementary Materials for Antipsychotics Activate mtorc1-dependent Translation to Enhance Neuronal Morphological Complexity Heather Bowling, Guoan
Int J Clin Exp Pathol 2017;10(3): /ISSN: /IJCEP
: /ISSN: /IJCEP") Int J Clin Exp Pathol 2017;10(3):3671-3676 www.ijcep.com /ISSN:1936-2625/IJCEP0046381 Original Article Comparison of immunofluorescence and immunohistochemical staining with anti-insulin antibodies on
Int J Clin Exp Pathol 2017;10(3):3671-3676 www.ijcep.com /ISSN:1936-2625/IJCEP0046381 Original Article Comparison of immunofluorescence and immunohistochemical staining with anti-insulin antibodies on
ONLINE SUPPLEMENT Title: CFTR dysfunction induces vascular endothelial growth factor synthesis in airway epithelium
 ONLINE SUPPLEMENT Title: CFTR dysfunction induces vascular endothelial growth factor synthesis in airway epithelium Martin C, Coolen N, Wu YZ, Thévenot G, Touqui L, PrulièreEscabasse V, Papon JF, Coste
Supplementary materials and methods.
 Supplementary materials and methods. Microarray printing and data analysis. The LNA-modified oligonucleotide probe set for all annotated mirnas from mouse (Mus musculus) and human (Homo sapiens) in the
Prolonged mitotic arrest induces a caspase-dependent DNA damage
 SUPPLEMENTARY INFORMATION Prolonged mitotic arrest induces a caspase-dependent DNA damage response at telomeres that determines cell survival Karolina O. Hain, Didier J. Colin, Shubhra Rastogi, Lindsey
Boucher et al NCOMMS B
 1 Supplementary Figure 1 (linked to Figure 1). mvegfr1 constitutively internalizes in endothelial cells. (a) Immunoblot of mflt1 from undifferentiated mouse embryonic stem (ES) cells with indicated genotypes;
SUPPLEMENTARY INFORMATION
 DOI: 10.1038/ncb2607 Figure S1 Elf5 loss promotes EMT in mammary epithelium while Elf5 overexpression inhibits TGFβ induced EMT. (a, c) Different confocal slices through the Z stack image. (b, d) 3D rendering
Assessment Run
 Assessment Run 50 2017 S100 Material The slide to be stained for S100 comprised: 1. Appendix, 2. Tonsil, 3. Schwannoma, 4-5. Malignant melanoma, 6. Colon adenocarcinoma. All tissues were fixed in 10% neutral
A. List of selected proteins with high SILAC (H/L) ratios identified in mass
 ratios identified in mass") Supplementary material Figure S1. Interaction between UBL5 and FANCI A. List of selected proteins with high SILAC (H/L) ratios identified in mass spectrometry (MS)-based analysis of UBL5-interacting proteins,
Supplementary material Figure S1. Interaction between UBL5 and FANCI A. List of selected proteins with high SILAC (H/L) ratios identified in mass spectrometry (MS)-based analysis of UBL5-interacting proteins,
Product Datasheet. EMMPRIN/CD147 Antibody (MEM-M6/1) NB Unit Size: 0.1 mg. Store at 4C. Do not freeze. Publications: 2
 NB Unit Size: 0.1 mg. Store at 4C. Do not freeze. Publications: 2") Product Datasheet EMMPRIN/CD147 Antibody (MEM-M6/1) NB500-430 Unit Size: 0.1 mg Store at 4C. Do not freeze. Publications: 2 Protocols, Publications, Related Products, Reviews, Research Tools and Images
Product Datasheet EMMPRIN/CD147 Antibody (MEM-M6/1) NB500-430 Unit Size: 0.1 mg Store at 4C. Do not freeze. Publications: 2 Protocols, Publications, Related Products, Reviews, Research Tools and Images
Supplementary Figure 1. EC-specific Deletion of Snail1 Does Not Affect EC Apoptosis. (a,b) Cryo-sections of WT (a) and Snail1 LOF (b) embryos at
 Cryo-sections of WT (a) and Snail1 LOF (b) embryos at") Supplementary Figure 1. EC-specific Deletion of Snail1 Does Not Affect EC Apoptosis. (a,b) Cryo-sections of WT (a) and Snail1 LOF (b) embryos at E10.5 were double-stained for TUNEL (red) and PECAM-1 (green).
Supplementary Figure 1. EC-specific Deletion of Snail1 Does Not Affect EC Apoptosis. (a,b) Cryo-sections of WT (a) and Snail1 LOF (b) embryos at E10.5 were double-stained for TUNEL (red) and PECAM-1 (green).
Supplementary Fig. S1. Schematic diagram of minigenome segments.
 open reading frame 1565 (segment 5) 47 (-) 3 5 (+) 76 101 125 149 173 197 221 246 287 open reading frame 890 (segment 8) 60 (-) 3 5 (+) 172 Supplementary Fig. S1. Schematic diagram of minigenome segments.
Interpretation Manual - Gastric or Gastroesophageal Junction Adenocarcinoma. PD-L1 IHC 22C3 pharmdx is FDA-approved for in vitro diagnostic use
 Interpretation Manual - Gastric or Gastroesophageal Junction Adenocarcinoma PD-L1 IHC 22C3 pharmdx is FDA-approved for in vitro diagnostic use For countries outside of the United States, see the local
Abstract. Background. Objective
 Molecular epidemiology of clinical tissues with multi-parameter IHC Poster 237 J Ruan 1, T Hope 1, J Rheinhardt 2, D Wang 2, R Levenson 1, T Nielsen 3, H Gardner 2, C Hoyt 1 1 CRi, Woburn, Massachusetts,
Supplementary Table S1. Tumor samples used for analysis Tumor size (cm) BNG (grade) ERα PR. pn-
 BNG (grade) ERα PR. pn-") Supplementary Table S1. Tumor samples used for analysis Sample# Age Tumor size (cm) pn- Stage Stage BNG (grade) ERα PR HER2 (FISH) Triple negative T1 46 3 N1a III 2 Pos Neg N T2 58 1 N(i-) I 3 Pos Neg
Supplementary Table S1. Tumor samples used for analysis Sample# Age Tumor size (cm) pn- Stage Stage BNG (grade) ERα PR HER2 (FISH) Triple negative T1 46 3 N1a III 2 Pos Neg N T2 58 1 N(i-) I 3 Pos Neg
Supporting Information. FADD regulates NF-кB activation and promotes ubiquitination of cflip L to induce. apoptosis
 1 2 Supporting Information 3 4 5 FADD regulates NF-кB activation and promotes ubiquitination of cflip L to induce apoptosis 6 7 Kishu Ranjan and Chandramani Pathak* 8 9 Department of Cell Biology, School
General Laboratory methods Plasma analysis: Gene Expression Analysis: Immunoblot analysis: Immunohistochemistry:
 General Laboratory methods Plasma analysis: Plasma insulin (Mercodia, Sweden), leptin (duoset, R&D Systems Europe, Abingdon, United Kingdom), IL-6, TNFα and adiponectin levels (Quantikine kits, R&D Systems
Figure S1. Western blot analysis of clathrin RNA interference in human DCs Human immature DCs were transfected with 100 nm Clathrin SMARTpool or
 Figure S1. Western blot analysis of clathrin RNA interference in human DCs Human immature DCs were transfected with 100 nm Clathrin SMARTpool or control nontargeting sirnas. At 90 hr after transfection,
(a) Significant biological processes (upper panel) and disease biomarkers (lower panel)
 Significant biological processes (upper panel) and disease biomarkers (lower panel)") Supplementary Figure 1. Functional enrichment analyses of secretomic proteins. (a) Significant biological processes (upper panel) and disease biomarkers (lower panel) 2 involved by hrab37-mediated secretory
Supplementary Figure 1. Functional enrichment analyses of secretomic proteins. (a) Significant biological processes (upper panel) and disease biomarkers (lower panel) 2 involved by hrab37-mediated secretory
Results you can trust
 PRODUCT I NF OR MAT ION pharmdx Results you can trust The first and only FDA-approved PD-L1 test to assess the magnitude of treatment effect on progression-free survival in melanoma patients from OPDIVO
Reviewers' comments: Reviewer #1 (Remarks to the Author):
:") Reviewers' comments: Reviewer #1 (Remarks to the Author): This is a well written and well executed study describing a novel mechanism of pro-angiogenic signalling which may, potentially, help to explain
Reviewers' comments: Reviewer #1 (Remarks to the Author): This is a well written and well executed study describing a novel mechanism of pro-angiogenic signalling which may, potentially, help to explain
Supplemental Materials. STK16 regulates actin dynamics to control Golgi organization and cell cycle
 Supplemental Materials STK16 regulates actin dynamics to control Golgi organization and cell cycle Juanjuan Liu 1,2,3, Xingxing Yang 1,3, Binhua Li 1, Junjun Wang 1,2, Wenchao Wang 1, Jing Liu 1, Qingsong
Nature Neuroscience: doi: /nn Supplementary Figure 1. PICALM expression in brain capillary endothelium in human brain and in mouse brain.
 Supplementary Figure 1 PICALM expression in brain capillary endothelium in human brain and in mouse brain. a, Double immunostaining for PICALM (red, left) and lectin positive endothelial profiles (blue,
Anti-DC-SIGN/CD209 murine monoclonal antibodies
 Anti-DC-SIGN/CD209 murine monoclonal antibodies DC-SIGN (DC Specific, ICAM-3 Grabbing, Nonintegrin) / CD209 and L-SIGN (liver/lymph node-specific ICAM-3-grabbing nonintegrin CD299/ DC-SIGNR (DC-SIGN-related
Assessment Run B HER2 IHC
 Assessment Run B24 2017 HER2 IHC Material The slide to be stained for HER2 comprised the following 5 materials: IHC: HER2 Score* (0, 1+, 2+, 3+) FISH: HER2 gene/chr 17 ratio** 1. Breast carcinoma, no.
ImageStream cytometer analysis. Cells were cultured as described above in vented-cap
 ImageStream cytometer analysis. Cells were cultured as described above in vented-cap polypropylene tubes, stained with αcd66b-fitc, αm-dc8-pe and αcd56-pe-cy5.5 mabs, washed and fixed with 4 % (w/v) paraformaldehyde.
Use of tissue micro array (TMA) in routine clinical analysis
 in routine clinical analysis") 2nd European Workshop on Tissue Imaging and Analysis June 25-26, 2010 Use of tissue micro array (TMA) in routine clinical analysis Tim Svenstrup Poulsen Molecular unit Dept. pathology Herlev Hospital Denmark
2nd European Workshop on Tissue Imaging and Analysis June 25-26, 2010 Use of tissue micro array (TMA) in routine clinical analysis Tim Svenstrup Poulsen Molecular unit Dept. pathology Herlev Hospital Denmark
Nature Neuroscience: doi: /nn Supplementary Figure 1
 Supplementary Figure 1 Subcellular segregation of VGluT2-IR and TH-IR within the same VGluT2-TH axon (wild type rats). (a-e) Serial sections of a dual VGluT2-TH labeled axon. This axon (blue outline) has
Name Animal source Vendor Cat # Dilutions
 Supplementary data Table S1. Primary and Secondary antibody sources Devi et al, TXNIP in mitophagy A. Primary Antibodies Name Animal source Vendor Cat # Dilutions 1. TXNIP mouse MBL KO205-2 1:2000 (WB)
Supplementary Figure 1. Establishment of prostacyclin-secreting hmscs. (a) PCR showed the integration of the COX-1-10aa-PGIS transgene into the
 PCR showed the integration of the COX-1-10aa-PGIS transgene into the") Supplementary Figure 1. Establishment of prostacyclin-secreting hmscs. (a) PCR showed the integration of the COX-1-10aa-PGIS transgene into the genomic DNA of hmscs (PGI2- hmscs). Native hmscs and plasmid
Supplementary Figure 1. Establishment of prostacyclin-secreting hmscs. (a) PCR showed the integration of the COX-1-10aa-PGIS transgene into the genomic DNA of hmscs (PGI2- hmscs). Native hmscs and plasmid
Supplementary Figure 1. Characterization of NMuMG-ErbB2 and NIC breast cancer cells expressing shrnas targeting LPP. NMuMG-ErbB2 cells (a) and NIC
 and NIC") Supplementary Figure 1. Characterization of NMuMG-ErbB2 and NIC breast cancer cells expressing shrnas targeting LPP. NMuMG-ErbB2 cells (a) and NIC cells (b) were engineered to stably express either a LucA-shRNA
Supplementary Figure 1. Characterization of NMuMG-ErbB2 and NIC breast cancer cells expressing shrnas targeting LPP. NMuMG-ErbB2 cells (a) and NIC cells (b) were engineered to stably express either a LucA-shRNA
TSH Receptor Monoclonal Antibody (49) Catalog Number MA3-218 Product data sheet
 Catalog Number MA3-218 Product data sheet") Website: thermofisher.com Customer Service (US): 1 800 955 6288 ext. 1 Technical Support (US): 1 800 955 6288 ext. 441 TSH Receptor Monoclonal Antibody (49) Catalog Number MA3-218 Product data sheet Details
Website: thermofisher.com Customer Service (US): 1 800 955 6288 ext. 1 Technical Support (US): 1 800 955 6288 ext. 441 TSH Receptor Monoclonal Antibody (49) Catalog Number MA3-218 Product data sheet Details
SUPPLEMENTARY FIGURES
 SUPPLEMENTARY FIGURES 1 Supplementary Figure 1, Adult hippocampal QNPs and TAPs uniformly express REST a-b) Confocal images of adult hippocampal mouse sections showing GFAP (green), Sox2 (red), and REST
Supplementary Figure S1 Supplementary Figure S2
 Supplementary Figure S A) The blots shown in Figure B were qualified by using Gel-Pro analyzer software (Rockville, MD, USA). The ratio of LC3II/LC3I to actin was then calculated. The data are represented
Supplementary Figure 1. Validation of astrocytes. Primary astrocytes were
 Supplementary Figure 1. Validation of astrocytes. Primary astrocytes were separated from the glial cultures using a mild trypsinization protocol. Anti-glial fibrillary acidic protein (GFAP) immunofluorescent
Product Datasheet. beta Amyloid Antibody (MOAB-2) NBP Unit Size: 0.1 ml
 NBP Unit Size: 0.1 ml") Product Datasheet beta Amyloid Antibody (MOAB-2) NBP2-13075 Unit Size: 0.1 ml Store at 4C short term. Aliquot and store at -20C long term. Avoid freeze-thaw cycles. Publications: 11 Protocols, Publications,
Product Datasheet beta Amyloid Antibody (MOAB-2) NBP2-13075 Unit Size: 0.1 ml Store at 4C short term. Aliquot and store at -20C long term. Avoid freeze-thaw cycles. Publications: 11 Protocols, Publications,
Estrogen receptor (ER)
") Material The slide to be stained for ER comprised: Assessment Run B26 2018 Estrogen receptor (ER) No. Tissue ER-positivity* ER-intensity* 1. Uterine cervix 80-90% Moderate to strong 2. Tonsil 1-5% Weak
Material The slide to be stained for ER comprised: Assessment Run B26 2018 Estrogen receptor (ER) No. Tissue ER-positivity* ER-intensity* 1. Uterine cervix 80-90% Moderate to strong 2. Tonsil 1-5% Weak
Supplementary Materials for. c-abl Activation Plays a Role in α-synucleinopathy Induced Neurodegeneration
 Supplementary Materials for c-abl Activation Plays a Role in α-synucleinopathy Induced Neurodegeneration Saurav Brahmachari, Preston Ge, Su Hyun Lee, Donghoon Kim, Senthilkumar S. Karuppagounder, Manoj
Relative SOD1 activity. Relative SOD2 activity. Relative SOD activity (Infected:Mock) + CP + DDC
 + CP + DDC") Supplementary Figure 1. SOD1 activity is significantly increased relative to SOD1 levels. SOD1 and SOD2 activities in the infected mork13 cells are shown normalised to their corresponding levels and relative
Supplementary Figure 1. SOD1 activity is significantly increased relative to SOD1 levels. SOD1 and SOD2 activities in the infected mork13 cells are shown normalised to their corresponding levels and relative
A263 A352 A204. Pan CK. pstat STAT3 pstat3 STAT3 pstat3. Columns Columns 1-6 Positive control. Omentum. Rectosigmoid A195.
 pstat3 75 Pan CK A A263 A352 A24 B Columns 1-6 Positive control A195 A22 A24 A183 Rectal Nodule STAT3 pstat3 STAT3 pstat3 Columns 7-12 Omentum Rectosigmoid Left Ovary Right Ovary Omentum Uterus Uterus
Supplementary Materials
 Supplementary Materials Figure S1. MTT Cell viability assay. To measure the cytotoxic potential of the oxidative treatment, the MTT [3-(4,5-dimethylthiazol- 2-yl)-2,5-diphenyl tetrazolium bromide] assay
Supplementary Fig. 1: ATM is phosphorylated in HER2 breast cancer cell lines. (A) ATM is phosphorylated in SKBR3 cells depending on ATM and HER2
 ATM is phosphorylated in SKBR3 cells depending on ATM and HER2") Supplementary Fig. 1: ATM is phosphorylated in HER2 breast cancer cell lines. (A) ATM is phosphorylated in SKBR3 cells depending on ATM and HER2 activity. Upper panel: Representative histograms for FACS
Supplementary Fig. 1: ATM is phosphorylated in HER2 breast cancer cell lines. (A) ATM is phosphorylated in SKBR3 cells depending on ATM and HER2 activity. Upper panel: Representative histograms for FACS
Supplementary Information. Detection and delineation of oral cancer with a PARP1 targeted optical imaging agent
 Supplementary Information Detection and delineation of oral cancer with a PARP1 targeted optical imaging agent Authors: Susanne Kossatz a, Christian Brand a, Stanley Gutiontov b, Jonathan T.C. Liu c, Nancy
") Supplementary Figure 1 (Mu) SBP (mmhg) 2 18 16 p
Supplementary Figure 1 (Mu) SBP (mmhg) 2 18 16 p Supplementary Figure 1.TRIM33 binds β-catenin in the nucleus. a & b, Co-IP of endogenous TRIM33 with β-catenin in HT-29 cells (a) and HEK 293T cells
 and HEK 293T cells") Supplementary Figure 1.TRIM33 binds β-catenin in the nucleus. a & b, Co-IP of endogenous TRIM33 with β-catenin in HT-29 cells (a) and HEK 293T cells (b). TRIM33 was immunoprecipitated, and the amount of
Supplementary Figure 1.TRIM33 binds β-catenin in the nucleus. a & b, Co-IP of endogenous TRIM33 with β-catenin in HT-29 cells (a) and HEK 293T cells (b). TRIM33 was immunoprecipitated, and the amount of
p = formed with HCI-001 p = Relative # of blood vessels that formed with HCI-002 Control Bevacizumab + 17AAG Bevacizumab 17AAG
 A.. Relative # of ECs associated with HCI-001 1.4 1.2 1.0 0.8 0.6 0.4 0.2 0.0 ol b p < 0.001 Relative # of blood vessels that formed with HCI-001 1.4 1.2 1.0 0.8 0.6 0.4 0.2 0.0 l b p = 0.002 Control IHC:
Supplementary Figure 1: si-craf but not si-braf sensitizes tumor cells to radiation.
 Supplementary Figure 1: si-craf but not si-braf sensitizes tumor cells to radiation. (a) Embryonic fibroblasts isolated from wildtype (WT), BRAF -/-, or CRAF -/- mice were irradiated (6 Gy) and DNA damage
Thyroid transcription factor-1 (TTF1) Assessment run
 Assessment run") Thyroid transcription factor- (TTF) Assessment run 39 203 The slide to be stained for TTF comprised:. Thyroid gland, 2. Liver, 3. Normal lung, 4. Lung adenocarcinoma 5. Colon adenocarcinoma, 6 & 7. Lung
Thyroid transcription factor- (TTF) Assessment run 39 203 The slide to be stained for TTF comprised:. Thyroid gland, 2. Liver, 3. Normal lung, 4. Lung adenocarcinoma 5. Colon adenocarcinoma, 6 & 7. Lung
Atg5 flox/flox ; CAG-Cre, 19M brain heart lung. spleen stomach colon. Takamura_Fig. S1
 Takamura_Fig. S1 brain heart lung spleen stomach colon kidney SM Supplemental Figure 1 Histological findings of tg5 flox/flox ;CG-Cre mouse tissues. H&E staining of the brain, heart, lung, spleen, stomach,
Supplementary Table 1 Clinicopathological characteristics of 35 patients with CRCs
 Supplementary Table Clinicopathological characteristics of 35 patients with CRCs Characteristics Type-A CRC Type-B CRC P value Sex Male / Female 9 / / 8.5 Age (years) Median (range) 6. (9 86) 6.5 (9 76).95
(A) Dose response curves of HMLE_shGFP (blue circle), HMLE_shEcad (red square),
 Dose response curves of HMLE_shGFP (blue circle), HMLE_shEcad (red square),") Supplementary Figures and Tables Figure S1. Validation of EMT-selective small molecules (A) Dose response curves of HMLE_shGFP (blue circle), HMLE_shEcad (red square), and HMLE_Twist (black diamond) cells
Supplementary Figures and Tables Figure S1. Validation of EMT-selective small molecules (A) Dose response curves of HMLE_shGFP (blue circle), HMLE_shEcad (red square), and HMLE_Twist (black diamond) cells
Estrogen receptor (ER)
") Assessment Run B7 204 Estrogen receptor (ER) Material The slide to be stained for ER comprised: No. Tissue ER-positivity* ER-intensity*. Uterine cervix 80-90% Moderate to strong 2. Breast carcinoma 0%
Assessment Run B7 204 Estrogen receptor (ER) Material The slide to be stained for ER comprised: No. Tissue ER-positivity* ER-intensity*. Uterine cervix 80-90% Moderate to strong 2. Breast carcinoma 0%
Supplementary Materials for
 advances.sciencemag.org/cgi/content/full/1/9/e1500781/dc1 Supplementary Materials for pnaktide inhibits Na/K-ATPase reactive oxygen species amplification and attenuates adipogenesis Komal Sodhi, Kyle Maxwell,
SUPPLEMENTARY DATA. Supplementary Table 1. Characteristics of Subjects.
 Supplementary Table 1. Characteristics of Subjects. a includes one patient who had an aqueous sample taken from the same eye twice b includes one patients who had an aqueous sample taken from the same
Cesarini et al., http ://www.jcb.org /cgi /content /full /jcb /DC1
 Supplemental material JCB Cesarini et al., http ://www.jcb.org /cgi /content /full /jcb.201504035 /DC1 THE JOU RNAL OF CELL BIO LOGY Figure S1. Lamin A/C depletion generates two distinct phenotypes in
Assessment Run B HER-2 IHC. HER-2/chr17 ratio**
 Assessment Run B2 20 HER-2 IHC Material The slide to be stained for HER-2 comprised the following 5 tissues: IHC HER-2 Score* (0, +, 2+,3+) FISH HER-2/chr7 ratio**. Breast ductal carcinoma 0..3 2. Breast
Epithelial cell-cell adhesion molecule (Ep-CAM)
") Assessment Run 3 011 Epithelial cell-cell adhesion molecule (Ep-CAM) Material The slide to be stained for Ep-CAM comprised: 1. Appendix,. Kidney, 3. Adrenal gland, 4. Lung carcinoid, 5 & 6. Renal clear
Assessment Run 3 011 Epithelial cell-cell adhesion molecule (Ep-CAM) Material The slide to be stained for Ep-CAM comprised: 1. Appendix,. Kidney, 3. Adrenal gland, 4. Lung carcinoid, 5 & 6. Renal clear
High expression of fibroblast activation protein is an adverse prognosticator in gastric cancer.
 Biomedical Research 2017; 28 (18): 7779-7783 ISSN 0970-938X www.biomedres.info High expression of fibroblast activation protein is an adverse prognosticator in gastric cancer. Hu Song 1, Qi-yu Liu 2, Zhi-wei
(A) SW480, DLD1, RKO and HCT116 cells were treated with DMSO or XAV939 (5 µm)
 SW480, DLD1, RKO and HCT116 cells were treated with DMSO or XAV939 (5 µm)") Supplementary Figure Legends Figure S1. Tankyrase inhibition suppresses cell proliferation in an axin/β-catenin independent manner. (A) SW480, DLD1, RKO and HCT116 cells were treated with DMSO or XAV939
Supplementary Figure Legends Figure S1. Tankyrase inhibition suppresses cell proliferation in an axin/β-catenin independent manner. (A) SW480, DLD1, RKO and HCT116 cells were treated with DMSO or XAV939
Role of Tyk-2 in Th9 and Th17 cells in allergic asthma
 Supplementary File Role of Tyk-2 in Th9 and Th17 cells in allergic asthma Caroline Übel 1*, Anna Graser 1*, Sonja Koch 1, Ralf J. Rieker 2, Hans A. Lehr 3, Mathias Müller 4 and Susetta Finotto 1** 1 Laboratory
Supplementary fig. 1. Crystals induce necroptosis does not involve caspases, TNF receptor or NLRP3. A. Mouse tubular epithelial cells were pretreated
 Supplementary fig. 1. Crystals induce necroptosis does not involve caspases, TNF receptor or NLRP3. A. Mouse tubular epithelial cells were pretreated with zvad-fmk (10µM) and exposed to calcium oxalate
condition. Left panel, the HCT-116 cells were lysed with RIPA buffer containing 0.1%
 FIGURE LEGENDS Supplementary Fig 1 (A) sumoylation pattern detected under denaturing condition. Left panel, the HCT-116 cells were lysed with RIPA buffer containing 0.1% SDS in the presence and absence
Supplementary Figure (OH) 22 nanoparticles did not affect cell viability and apoposis. MDA-MB-231, MCF-7, MCF-10A and BT549 cells were
 22 nanoparticles did not affect cell viability and apoposis. MDA-MB-231, MCF-7, MCF-10A and BT549 cells were") Supplementary Figure 1. Gd@C 82 (OH) 22 nanoparticles did not affect cell viability and apoposis. MDA-MB-231, MCF-7, MCF-10A and BT549 cells were treated with PBS, Gd@C 82 (OH) 22, C 60 (OH) 22 or GdCl
Supplementary Figure 1. Gd@C 82 (OH) 22 nanoparticles did not affect cell viability and apoposis. MDA-MB-231, MCF-7, MCF-10A and BT549 cells were treated with PBS, Gd@C 82 (OH) 22, C 60 (OH) 22 or GdCl
genome edited transient transfection, CMV promoter
 Supplementary Figure 1. In the absence of new protein translation, overexpressed caveolin-1-gfp is degraded faster than caveolin-1-gfp expressed from the endogenous caveolin 1 locus % loss of total caveolin-1-gfp
Rescue of mutant rhodopsin traffic by metformin-induced AMPK activation accelerates photoreceptor degeneration Athanasiou et al
 Supplementary Material Rescue of mutant rhodopsin traffic by metformin-induced AMPK activation accelerates photoreceptor degeneration Athanasiou et al Supplementary Figure 1. AICAR improves P23H rod opsin
Supporting Information
 Supporting Information Pang et al. 10.1073/pnas.1322009111 SI Materials and Methods ELISAs. These assays were performed as previously described (1). ELISA plates (MaxiSorp Nunc; Thermo Fisher Scientific)
Supplementary Table 1. List of primers used in this study
 Supplementary Table 1. List of primers used in this study Gene Forward primer Reverse primer Rat Met 5 -aggtcgcttcatgcaggt-3 5 -tccggagacacaggatgg-3 Rat Runx1 5 -cctccttgaaccactccact-3 5 -ctggatctgcctggcatc-3
Supplementary Figure 1. PAQR3 knockdown inhibits SREBP-2 processing in CHO-7 cells CHO-7 cells were transfected with control sirna or a sirna
 Supplementary Figure 1. PAQR3 knockdown inhibits SREBP-2 processing in CHO-7 cells CHO-7 cells were transfected with control sirna or a sirna targeted for hamster PAQR3. At 24 h after the transfection,
Sestrin2 and BNIP3 (Bcl-2/adenovirus E1B 19kDa-interacting. protein3) regulate autophagy and mitophagy in renal tubular cells in. acute kidney injury
 regulate autophagy and mitophagy in renal tubular cells in. acute kidney injury") Sestrin2 and BNIP3 (Bcl-2/adenovirus E1B 19kDa-interacting protein3) regulate autophagy and mitophagy in renal tubular cells in acute kidney injury by Masayuki Ishihara 1, Madoka Urushido 2, Kazu Hamada
Sestrin2 and BNIP3 (Bcl-2/adenovirus E1B 19kDa-interacting protein3) regulate autophagy and mitophagy in renal tubular cells in acute kidney injury by Masayuki Ishihara 1, Madoka Urushido 2, Kazu Hamada