Supplementary Figure 1 (Mu)
|
|
|
- Clifton Garrison
- 5 years ago
- Views:
Transcription
1 Supplementary Figure 1 (Mu) SBP (mmhg) p< SBP (mmhg) p<.1 p<.1 p< n.s Sham DOCA DR/NS DR/HS DS/NS DS/HS Supplementary Figure 1 Systolic blood pressure (BP) in DOCA mice or Dahl rats was measured directly using telemetry/catheter via the left carotid artery at the end of the treatment (DOCA mice 3 weeks; Dahl rats 4 weeks). n=4-6 animals for each group. Data are means ± s.e. p<.1 (t-test for DOCA groups; ANOVA for Dahl groups).

 on kidney sections of Dahl salt")
 or normal salt (NS) diet for")
.")
2 Supplementary Figure 2 (Mu) DR/NS DR/HS DS/NS DS/HS Supplementary Figure 2 Immunostaining of pan T cell marker CD3 (brown) on kidney sections of Dahl salt resistant (DR) / sensitive (DS) rats with high salt (HS) or normal salt (NS) diet for 4 weeks. Nuclei were stained by Hematoxyline (blue). Data are representative of n=8 images in each group. scale µm.
3 Supplementary Figure 3 (Mu) Negative Control Sham mouse T cells DOCA mouse T cells CD3 SSC Supplementary Figure 3 Splenic pan T cells isolated from Sham mice or DOCA mice were stained with CD3 antibody. A mixture of cells without CD3 staining from both groups of mice was used as negative control. Flow cytometry confirmed all cells isolated from spleen from either set of mice are CD3 + T cells. Red numbers indicate the proportion (%) of CD3 + (upper) and CD3 - (lower) cells in each group. Data are representative of three independent experiments.
4 Supplementary Figure 4 (Mu) CD8 + T cell negative selection noab APC noab PE CD3 APC CD8 APC CD4 PE CD4 + T cell negative selection noab APC noab PE CD3 APC CD8 APC CD4 PE Supplementary Figure 4 Mouse CD8 + (upper panels) and CD4 + (lower panels) positive T cells isolated from mouse spleens using negative selection were stained with CD3, CD4 and CD8 antibodies. Flow cytometry confirmed the purity of both isolated cells was higher than 8%. Neither contamination of CD4 + T cells in isolated CD8 + T cells, nor CD8 + T cells in isolated CD4 + T cells, were detected. Red numbers indicate the proportion (%) of cells in indicated area. Data are representative of three to four independent experiments.
 before adoptive transfer to mice.")
 after the adoptive transfer of fluorescent labeled CD8 + T cells.")

5 Supplementary Figure 5 (Mu) Cell tracker labeled CD8Ts & auto fluorescence & DAPI Kidney Spleen Heart Supplementary Figure 5 Fresh isolated CD8 + T cells were pre-loaded with fluorescent Cell Tracker (red) before adoptive transfer to mice. Due to the limit of fluorescent dye bleaching, mice receiving cells were sacrificed in 72 hours (fed on regular diet for hours followed by HS diet for 32 hours) after the adoptive transfer of fluorescent labeled CD8 + T cells. The kidneys, spleens and heart were fixed, embedded in OCT and sliced on a cryostat. Exogenous CD8 + T cells were found in the kidneys, the spleens but not the hearts in the adoptive transfer-receiving mice. Red color is fluorescent cell tracker representing exogenous CD8 + T cells; Green color is tissue auto-fluorescence due to PFA fixation indicating tissue morphology; Blue color is DAPI staining. Data are representative of n=9-13 images in each group. scale µm.
 and (green) in the kidneys of DOCA mice (left")
.")
6 Supplementary Figure 6 (Mu) DOCA kidney + CD8 + DAPI + CD8 T cell kidney Supplementary Figure 6 Double staining of CD8 (red) and (green) in the kidneys of DOCA mice (left panel) and mice receiving adoptive transfer of CD8 + T cells (right panel). Nuclei were stained by DAPI (blue). Data are representative of n=12 images in each group. scale 2µm.
7 Supplementary Figure 7 (Mu) CD3 TKs CD8 Supplementary Figure 7 Flow cytometry confirmed that TK-1 cells are CD3 + and CD8 +. Cells without staining are labeled with gray color (negative control); Cells stained with both CD3 and CD8 antibodies are labeled with red color. Data are representative of four independent tests.

 only stained on the surface of TKs but not mdcts.")
8 Supplementary Figure 8 (Mu) Na-K-ATPase CD8 Merge Supplementary Figure 8 Channel split images of Fig. 5b, demonstrating direct contact of TK and mdct cells in individual cell level. As expected, the staining of Na-K-ATPase (green) on mdct membrane was much stronger compered to TK membrane. And CD8 (red) only stained on the surface of TKs but not mdcts. Yellow area (merge) at the cross of both cells indicates the direct contact of TK and DCT cells. Data are representative of n>15 images. Scale 2mm.
 ~13 ~13 ~12 Supplementary Figure 9 Effects of co-culture on expression in mdcts. (a) CD8 specific magnetic dynabeads completely removed TKs from the mdct-tk co-culture.")
9 Supplementary Figure 9 (Mu) count a CD3 mdcts TKs b / (mrna) p= Con +TK c membrane protein Na-K- ATPase Fold change p Con * 2.2 +TK * 1.9 p- (kda) ~13 ~13 ~12 Supplementary Figure 9 Effects of co-culture on expression in mdcts. (a) CD8 specific magnetic dynabeads completely removed TKs from the mdct-tk co-culture. PBS washed co-cultured cells before (red area) or after (blue dashed lined area) removal of TKs using magnetic beads were stained by CD3 antibody. Data are representative of three independent tests. (b) Realtime-PCR using specific TaqMan primers illustrated mrna expression level in mdcts with or without prior TK-treatment. n=1 in each group. Data are means ± s.e. p=.1 (t-test) (c) Membrane protein expression of and p- in mdcts with or without TK co-culture. Na-K-ATPase was used as loading control. n=4-6 in each group. Data are means ± s.e. *p<.1 vs. Control (t-test).
10 Supplementary Figure 1 (Mu) a b Transwell TK cell number (%) TKs Supplementary Figure 1 Size of TKs and ytanswell ability. (a) TK cell size was measured by Scepter 2 cell counter. Most TK cells are about 7-9 mm in diameter. Data are representative of >1 independent tests. (b) Proportion of TK cells passing through transwell co-culture inserts with different pore size (.4 mm, 8 mm). TK cell number with no transwell chamber (+TK) set as %. n=6 in each group. Data are means ± s.e.

. After co-culture, mdcts were analyzed by western blot for expression of SPAK and.")
11 Supplementary Figure 11 (Mu) SPAK Con ~ +TK Neut IL17a Neut IFNγ (kda) ~ ~13 Fold change Con +TK +TK+neut IL17a +TK+neut IFNg n.s. n.s. * * n.s. n.s ~38.5 SPAK Supplementary Figure 11 Neutralizing antibodies for IL17a (1 mg/ml) and IFNg (1 mg/ml) were added to mdct-tk co-culture (15 mins prior to adding TKs). After co-culture, mdcts were analyzed by western blot for expression of SPAK and. Neither neutralizing antibody has blocking effect on TK-induced up-regulation. was used as a loading control. n=4 in each group. Data are means ± s.e. *p<.1 vs. Control (ANOVA).

 (b) knockdown by sirna (si) decreased proportion of high sodium-containing mdcts in both TKtreated and untreated groups.")
12 Supplementary Figure 12 (Mu) a b Con +TK / (mrna) p<.1 Sham-si Sham-si.23 si CoroNa Green (linear) SSC si Supplementary Figure 12 Effects of knockdown with sirna. (a) Realtime-PCR using specific TaqMan primers detected mrna in the mdcts with (si) or without (sham-si) knockdown by sirna. n=4 in each group. Data are means ± s.e. p<.1 (t-test) (b) knockdown by sirna (si) decreased proportion of high sodium-containing mdcts in both TKtreated and untreated groups. Moreover, si abolished the effect of TK-mediated increase of sodium retention in mdcts. Red numbers indicate the proportion (%) of cells with high sodium content. Data are representative of four independent experiments.

13 Supplementary Figure 13 (Mu) a SPAK/ (mrna) p<.1 b 11 MQAE Fluorescence unit / mg Protein (intracellular chloride ratio) (%) PBS +Bume +HCTZ +HCTZ+Bume c NKCC2 Con +TK Con +TK (kda) ~125 ~ p= Sham-si.29 sispak 8 6 Con * * +TK * Fold change Con TK Supplementary Figure 13 Effects of co-culture on intracellular chloride and NKCC2 expression in mdcts. (a) Realtime-PCR using specific TaqMan primers detected SPAK mrna in the mdcts with (sispak) or without (sham-si) SPAK knockdown by sirna. n=4 in each group. Data are means ± s.e. p<.1 (t-test) (b) Effect of blocking chloride influx with HCTZ (2mM) and/or Bume (mm) on intracellular chloride concentration (ratio) in TK-treated (right, +TK) or untreated (left, Con) mdcts. Blocking both pathways of chloride entry led to a larger decrease in intracellular chloride than blocking either pathway alone. Intracellular chloride concentration was measured with the chloride indicator MQAE and normalized per milligram protein. n=8-1 in each group. Data are means ± s.e. p<.1(shown in figure, t-test); *p<.1 vs. PBS+TK; p<.1 vs. PBS+TK+Bume; p<.1 vs. PBS+TK+HCTZ (ANOVA). (c) Western blot of NKCC2 (SLC12A1) abundance in mdcts with or without TK co-culture. was used as a loading control. n=4 in each group. Data are means ± s.e. p=.57 (ttest)


14 Supplementary Figure-14 (Mu) a membrane protein Con +TK (kda) b 1.2 Clc-k1 / (mrna) p< Clc-k2 / (mrna) p<.1 IP Clc-k IB Barttin Na-K- ATPase 25 ~12.3 Sham-si.19 siclc-k1.3 Sham-si.13 siclc-k2 c Clc-k Sham Si Clc-k1 Si Clc-k2 siclc-k1 siclc-k2 (kda) ~68 d Mem Clc-k Con Sham-si +TK Con siclc-k +TK (kda) ~68 ~38 Na-K- ATPase ~12 Supplementary Figure 14 Effects of Clc-K knockdown using sirnas against both Clc-K1 and Clc-K2. (a) The binding of membrane Clc-k to its subunit barttin was detected by immunoprecipitation (IP) of Clc-k and immunoblot (IB) of barttin (reverse from Figure 7b). Membrane protein loading for both western blot and IP/IB were normalized by Na-K-ATPase. Data are representative of n=4 in each group. (b) Knockdown efficiency of siclc-ka or siclc-kb was evaluated by realtime-pcr using specific TaqMan primers (ABI) against Clc-ka or Clc-kb. n=4 in each group. Data are means ± s.e. p<.1 (t-test) (c) In western blot, Clc-k antibody from Alomone detects both isoforms of Clc-k. Image analyzed by Image Lab software. Saturated pixels were highlighted in red. was used as loading control. Data are representative of two independent tests. (d) Clc-k knockdown using both sirnas inhibited TK-induced up-regulation of membrane expression of Clc-k. Na-K-ATPase was used as membrane protein loading control. Data are representative of n=4-6 in each group.
 Realtime-PCR using specific TaqMan primers detected Kir4.1 mrna in the mdcts with (sikir4.1) or without (sham-si) Kir4.1 knockdown by sirna. n=4 in each group.")
15 Supplementary Figure 15 (Mu) a Kir4.1/ (mrna) p<.1 b Mem Kir4.1 sikir4.1 Con +TK Con +TK (kda) ~ Na-K- ATPase ~12 Sham-si sikir4.1 Supplementary Figure 15 Effects of Kir4.1 knockdown using sirna. (a) Realtime-PCR using specific TaqMan primers detected Kir4.1 mrna in the mdcts with (sikir4.1) or without (sham-si) Kir4.1 knockdown by sirna. n=4 in each group. Data are means ± s.e. p<.1 (ttest). (b) Knockdown of Kir4.1 prevented TK-induced up-regulation of membrane expression of Kir4.1. Na-K-ATPase was used as membrane protein loading control. Data are representative of n=4 in each group.

16 Supplementary Figure 16 (Mu) a K + (mm) Plasma n.s Culture media n.s b +2 mm KCl Con +TK Con +TK +4 mm KCl Con +TK (kda) ~ ~38 Sham + CD8 Ts Con +TK Supplementary Figure 16 Role of potassium in CD8 T cell-mdct cell interaction (a) left, plasma potassium level in mice with or without receiving adoptive transfer of CD8 + T cells (measured at day 3 after adoptive CD8 + T cell transfer); right, potassium concentration in mdct culture media with or without co-culture with TKs. n=4-5 in each group. Data are means ± s.e. no significance observed (t-test). (b) expression in control or TK-co-cultured mdcts with or without additional KCl at concentrations of 2 mm or 4 mm. was used as a loading control. Data are representative of n=3-5 in each group.
17 Supplementary Figure 17 (Mu) Sham-si si-src Con +TK Con +TK (kda) 2.5 Sham Con Sham +TK sisrc Con sisrc +TK t-src p-src Y419 ~6 ~6 ~38 Fold change * # * # 1.2 t-src p-src Supplementary Figure 17. Effects of sisrc on Src expression and activation in mdcts with or without TK treatment. Although knockdown of Src did not dramatically decrease the active form of Src p-srcy419 in control cells, it greatly prevented TK-induced increase of Src activation. was used as a loading control. n=4 in each group. Data are means ± s.e. *p<.1 vs. Control; #p<.1 vs. sham+tk (ANOVA).
18 Supplementary Figure 18 (Mu) total pro Mem pro P-Src Y419 t-src Mem Kir4.1 Na-K- ATPase +PP1 nm Con +TK Con +TK (kda) ~6 ~6 ~13 ~38 ~1 ~12 Fold change * Con +TK Con+PP1 +TK+PP # # n.s p-src t-src Kir4.1 (membrane) * * # Supplementary Figure 18. Effects of Src inhibitor PP1 on TK-induced activation of Src, increase of membrane Kir4.1 and up-regulation of in mdcts. Na-K-ATPase or were used as loading controls for membrane protein or total protein, respectively. n=3-4 in each group. Data are means ± s.e. *p<.1 vs. Control; #p<.1 vs. +TK (ANOVA).
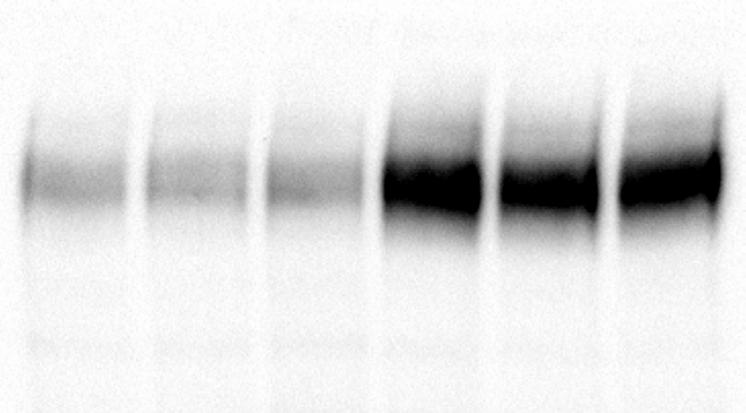
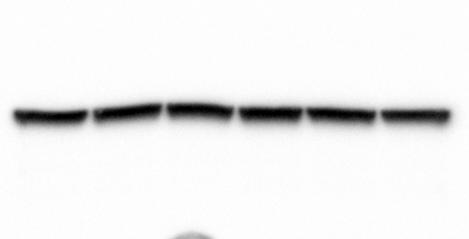
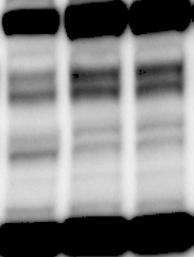
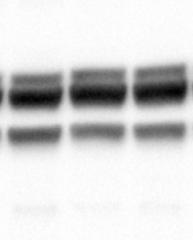
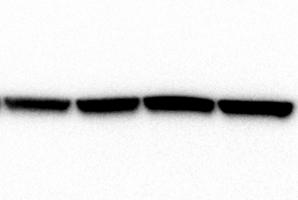
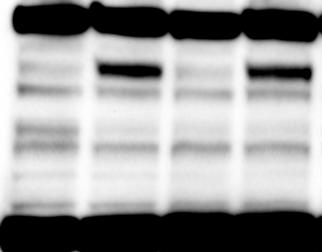
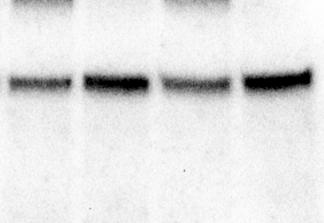
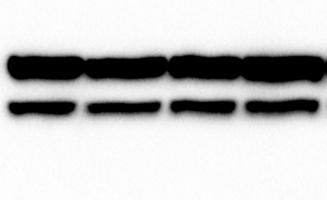
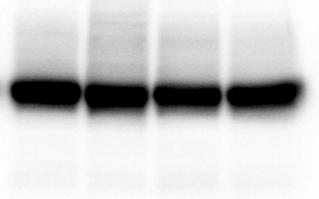
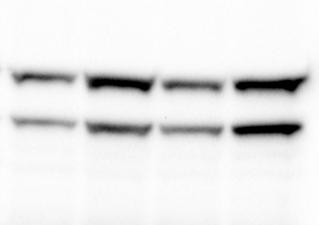
19 Supplementary Figure 19 (Mu) Fig 1c Fig 2a Fig 2d 1 Fig 3b p- Fig 5c Fig 5d upper Fig 5d lower Fig 7a Fig 7b Clc-k p- p- SPAK p- IP barttin / IB Clc-k Na-K-ATPase Na-K-ATPase

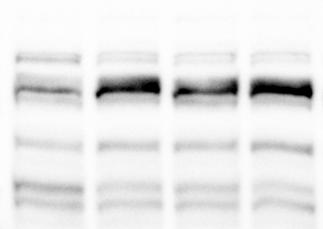
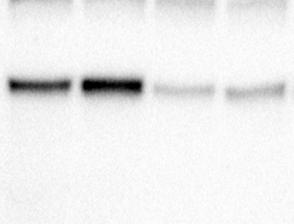
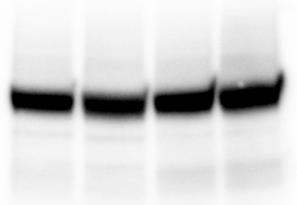
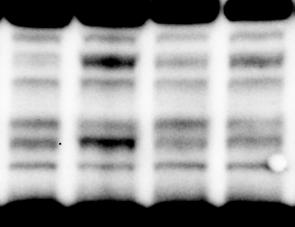
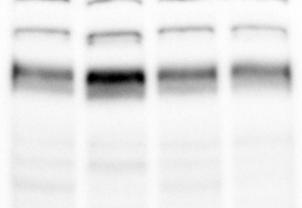
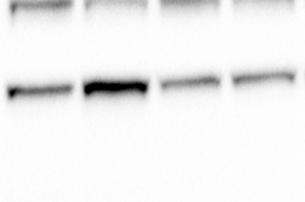
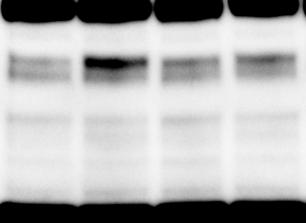
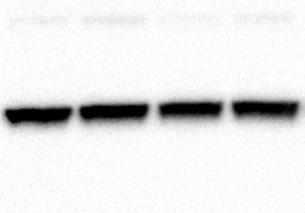
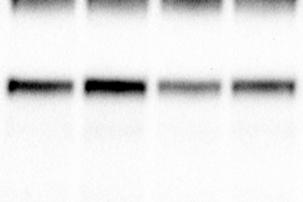
20 Fig 8a upper Na-K-ATPase p- Kir SPAK Fig 8a lower Fig 8b Clc-K p- Na-K-ATPase Fig 9a 1 26 Kir4.1 1 p- Na-K-ATPase SPAK Fig 9c p-srcy419 t-src SPAK


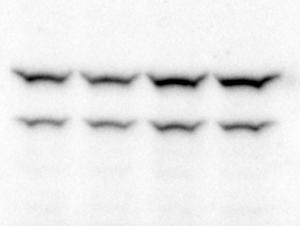
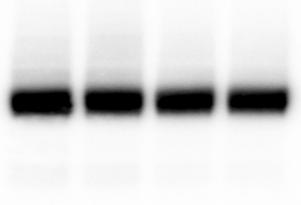
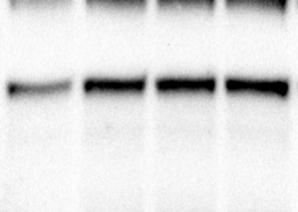
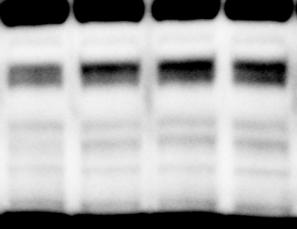
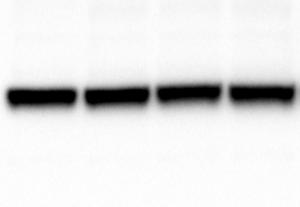
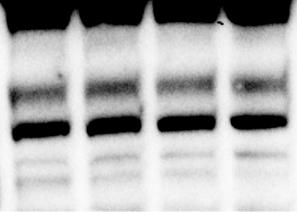
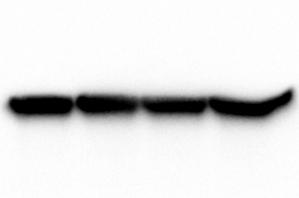
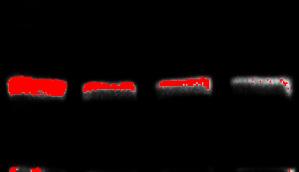
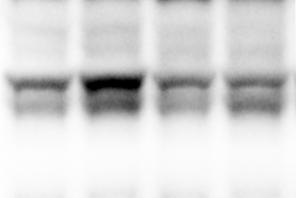
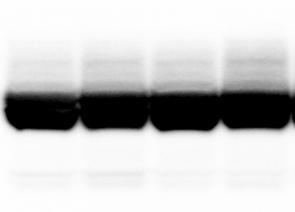
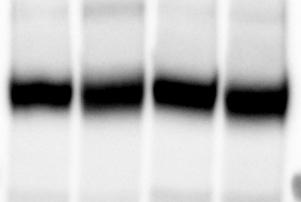
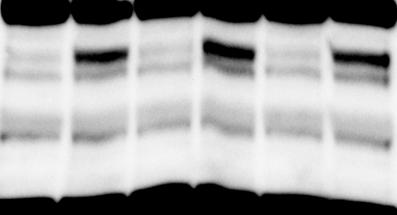
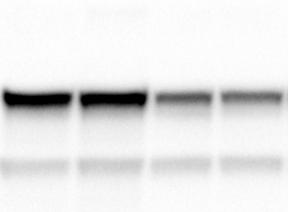
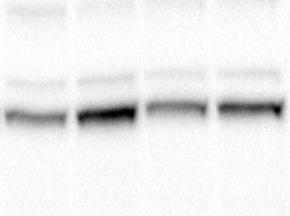

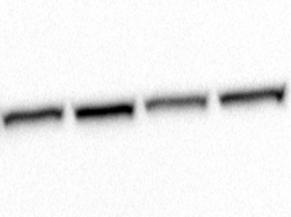
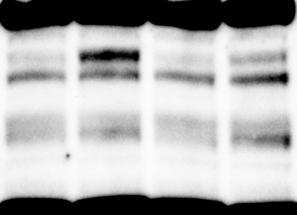
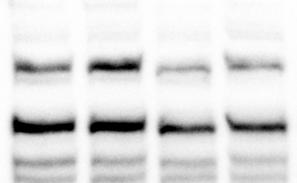
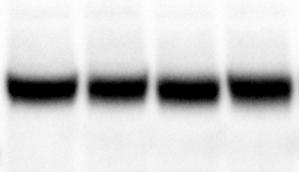
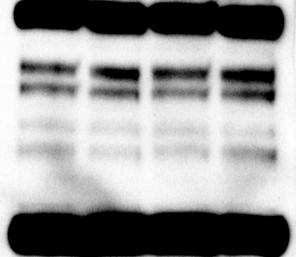
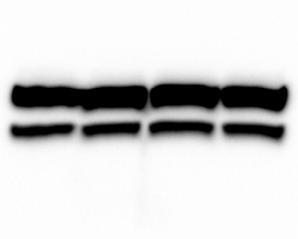
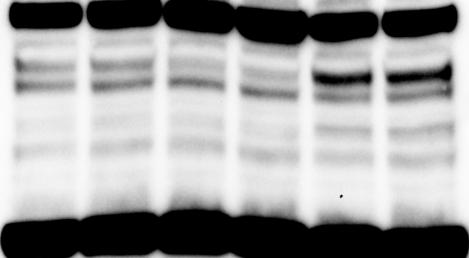
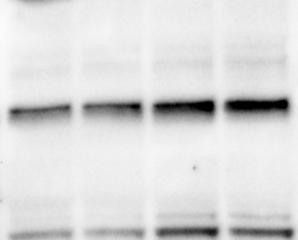
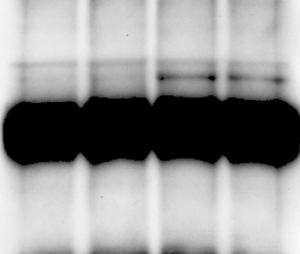
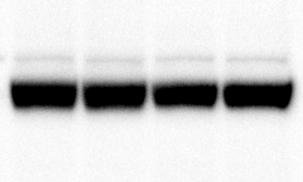
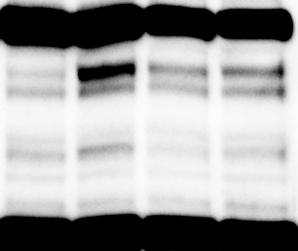
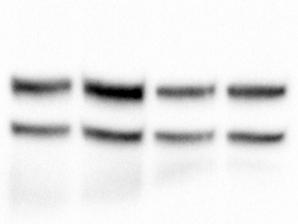
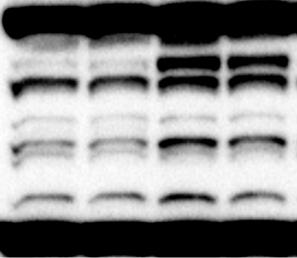
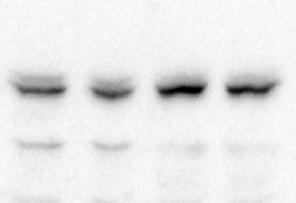
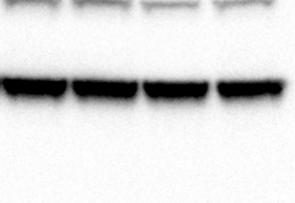
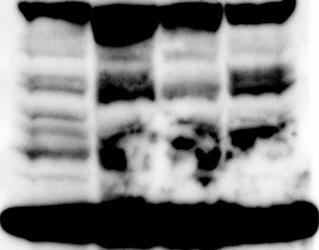
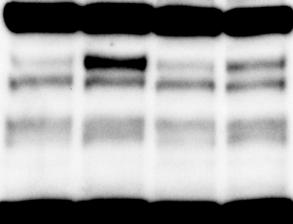
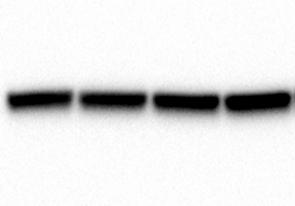
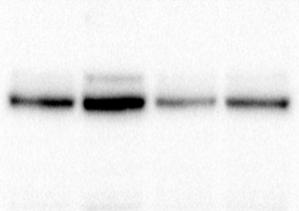
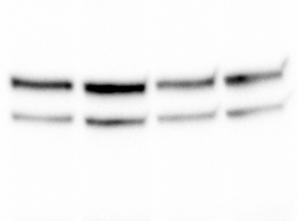
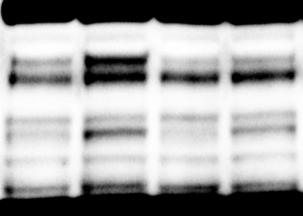
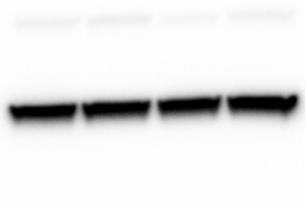
21 26 1 S. Fig 9c S. Fig 15b p- Na-K-ATPase Kir4.1 Na-K-ATPase S. Fig 11 S. Fig 16b SPAK 1 S. Fig 13 S. Fig 17 NKCC2 t-src p-srcy419 kda S. Fig 14a Batrrin Na-K-ATPase S. Fig 14c S. Fig 18 Clc-K p-srcy419 t-src 26 1 S. Fig 14d Clc-K Na-K-ATPase S. Fig 18 Kir4.1 Supplementary Figure 19 Uncropped images of all representative western blots. Na-K-ATPase
22 Supplementary Table 1 (Mu) Western Blot Immunostaining Antibody Target Apparent position ~13/11 Antibody supplier Abcam Antibody Cat# /lot# ab9532/ GR899 Antibody host Antibody dilution Incubation time Antibody host/target Rb (P) 1:1 O/N GaRb ~38 Millipore MAB374 Ms (M) 1: O/N GaMs p- ~13 Ellison (OHSU) #39,# Rb (P) 1:2 O/N GaRb Na-K-ATPase ~12 Abcam ab762 Rb (M) 1: O/N GaRb SPAK ~ CST #2281 Rb (P) 1: O/N GaRb Clc-K ~68 Alomone ACL-4 Rb (P) 1: O/N GaRb Kir4.1 ~1 (tetramer) Alomone APC-35 Rb (P) 1:6 O/N GaRb p-src Y419 ~6 Abcam ab Rb (M) 1: O/N GaRb t-src ~6 Abcam ab19381 Rb (M) 1:1 O/N GaRb NKCC2 125 Abcam ab Rb (M) 1:2 O/N GaRb Barttin 37 SantaCruz sc Ms (M) 1: O/N GaMs Antibody supplier Jackson immuno Jackson immuno Jackson immuno Jackson immuno Jackson immuno Jackson immuno Jackson immuno Jackson immuno Jackson immuno Jackson immuno Jackson immuno Antibody dilution incubation time 1: 2h 1: 2h 1: 2h 1: 2h 1: 2h 1: 2h 1: 2h 1: 2h 1: 2h 1: 2h 1: 2h CD3 staining Abcam ab16669 Rb (M) 1: O/N GaRb Vector kit 1:2 2h staining Abcam ab9532 Rb (P) 1: O/N GaRb CD8 staining Novus Primary Antibodies NBP Rt (M) 1: O/N GaRt CD8 staining Biolegend 758 Rt (M) 1: O/N Na-K-ATPase Staining Abcam ab Rb (M) 1: O/N Secondary Antibodies Abcam 177 Abcam :2 2h 1:2 2h N/A (primary labeled with Alexa 594) N/A (primary labeled with Alexa 647) Rb=rabbit; Ms=mouse; Rt=Rat; (P)=polyclonal; (M)=monoclonal; GaRb=goat anti rabbit; GaMs=goat anti-mouse; GaRt=goat antirat; NFM=non-fatty milk; O/N=overnight Supplementary Table 1 Information of all antibodies for western blot or immuno-staining experiments.
Supplementary Figure 1. Deletion of Smad3 prevents B16F10 melanoma invasion and metastasis in a mouse s.c. tumor model.
 A B16F1 s.c. Lung LN Distant lymph nodes Colon B B16F1 s.c. Supplementary Figure 1. Deletion of Smad3 prevents B16F1 melanoma invasion and metastasis in a mouse s.c. tumor model. Highly invasive growth
(a) Significant biological processes (upper panel) and disease biomarkers (lower panel)
 Significant biological processes (upper panel) and disease biomarkers (lower panel)") Supplementary Figure 1. Functional enrichment analyses of secretomic proteins. (a) Significant biological processes (upper panel) and disease biomarkers (lower panel) 2 involved by hrab37-mediated secretory
Supplementary Figure 1. Functional enrichment analyses of secretomic proteins. (a) Significant biological processes (upper panel) and disease biomarkers (lower panel) 2 involved by hrab37-mediated secretory
Supplementary Figure 1: si-craf but not si-braf sensitizes tumor cells to radiation.
 Supplementary Figure 1: si-craf but not si-braf sensitizes tumor cells to radiation. (a) Embryonic fibroblasts isolated from wildtype (WT), BRAF -/-, or CRAF -/- mice were irradiated (6 Gy) and DNA damage
(A) RT-PCR for components of the Shh/Gli pathway in normal fetus cell (MRC-5) and a
 RT-PCR for components of the Shh/Gli pathway in normal fetus cell (MRC-5) and a") Supplementary figure legends Supplementary Figure 1. Expression of Shh signaling components in a panel of gastric cancer. (A) RT-PCR for components of the Shh/Gli pathway in normal fetus cell (MRC-5) and
Supplementary figure legends Supplementary Figure 1. Expression of Shh signaling components in a panel of gastric cancer. (A) RT-PCR for components of the Shh/Gli pathway in normal fetus cell (MRC-5) and
Supplementary Figure 1.TRIM33 binds β-catenin in the nucleus. a & b, Co-IP of endogenous TRIM33 with β-catenin in HT-29 cells (a) and HEK 293T cells
 and HEK 293T cells") Supplementary Figure 1.TRIM33 binds β-catenin in the nucleus. a & b, Co-IP of endogenous TRIM33 with β-catenin in HT-29 cells (a) and HEK 293T cells (b). TRIM33 was immunoprecipitated, and the amount of
Supplementary Figure 1.TRIM33 binds β-catenin in the nucleus. a & b, Co-IP of endogenous TRIM33 with β-catenin in HT-29 cells (a) and HEK 293T cells (b). TRIM33 was immunoprecipitated, and the amount of
Supplementary Figure 1
 Supplementary Figure 1 AAV-GFP injection in the MEC of the mouse brain C57Bl/6 mice at 4 months of age were injected with AAV-GFP into the MEC and sacrificed at 7 days post injection (dpi). (a) Brains
Supplemental Information
 Supplemental Information Essential role of Kir5.1 channels in renal salt handling and blood pressure control Oleg Palygin, Vladislav Levchenko, Daria V. Ilatovskaya, Tengis S. Pavlov, Oleh M. Pochynyuk,
p = formed with HCI-001 p = Relative # of blood vessels that formed with HCI-002 Control Bevacizumab + 17AAG Bevacizumab 17AAG
 A.. Relative # of ECs associated with HCI-001 1.4 1.2 1.0 0.8 0.6 0.4 0.2 0.0 ol b p < 0.001 Relative # of blood vessels that formed with HCI-001 1.4 1.2 1.0 0.8 0.6 0.4 0.2 0.0 l b p = 0.002 Control IHC:
SUPPLEMENTARY INFORMATION
 DOI:.38/ncb3399 a b c d FSP DAPI 5mm mm 5mm 5mm e Correspond to melanoma in-situ Figure a DCT FSP- f MITF mm mm MlanaA melanoma in-situ DCT 5mm FSP- mm mm mm mm mm g melanoma in-situ MITF MlanaA mm mm
c Ischemia (30 min) Reperfusion (8 w) Supplementary Figure bp 300 bp Ischemia (30 min) Reperfusion (4 h) Dox 20 mg/kg i.p.
 Reperfusion (8 w) Supplementary Figure bp 300 bp Ischemia (30 min) Reperfusion (4 h) Dox 20 mg/kg i.p.") a Marker Ripk3 +/ 5 bp 3 bp b Ischemia (3 min) Reperfusion (4 h) d 2 mg/kg i.p. 1 w 5 w Sacrifice for IF size A subset for echocardiography and morphological analysis c Ischemia (3 min) Reperfusion (8
a Marker Ripk3 +/ 5 bp 3 bp b Ischemia (3 min) Reperfusion (4 h) d 2 mg/kg i.p. 1 w 5 w Sacrifice for IF size A subset for echocardiography and morphological analysis c Ischemia (3 min) Reperfusion (8
VEGFR2-Mediated Vascular Dilation as a Mechanism of VEGF-Induced Anemia and Bone Marrow Cell Mobilization
 Cell Reports, Volume 9 Supplemental Information VEGFR2-Mediated Vascular Dilation as a Mechanism of VEGF-Induced Anemia and Bone Marrow Cell Mobilization Sharon Lim, Yin Zhang, Danfang Zhang, Fang Chen,
Supplementary Figure 1. Validation of astrocytes. Primary astrocytes were
 Supplementary Figure 1. Validation of astrocytes. Primary astrocytes were separated from the glial cultures using a mild trypsinization protocol. Anti-glial fibrillary acidic protein (GFAP) immunofluorescent
Supplementary fig. 1. Crystals induce necroptosis does not involve caspases, TNF receptor or NLRP3. A. Mouse tubular epithelial cells were pretreated
 Supplementary fig. 1. Crystals induce necroptosis does not involve caspases, TNF receptor or NLRP3. A. Mouse tubular epithelial cells were pretreated with zvad-fmk (10µM) and exposed to calcium oxalate
Cell isolation. Spleen and lymph nodes (axillary, inguinal) were removed from mice
 were removed from mice") Supplementary Methods: Cell isolation. Spleen and lymph nodes (axillary, inguinal) were removed from mice and gently meshed in DMEM containing 10% FBS to prepare for single cell suspensions. CD4 + CD25
Supplementary Methods: Cell isolation. Spleen and lymph nodes (axillary, inguinal) were removed from mice and gently meshed in DMEM containing 10% FBS to prepare for single cell suspensions. CD4 + CD25
Supplementary Figure S I: Effects of D4F on body weight and serum lipids in apoe -/- mice.
 Supplementary Figures: Supplementary Figure S I: Effects of D4F on body weight and serum lipids in apoe -/- mice. Male apoe -/- mice were fed a high-fat diet for 8 weeks, and given PBS (model group) or
Islet viability assay and Glucose Stimulated Insulin Secretion assay RT-PCR and Western Blot
 Islet viability assay and Glucose Stimulated Insulin Secretion assay Islet cell viability was determined by colorimetric (3-(4,5-dimethylthiazol-2-yl)-2,5- diphenyltetrazolium bromide assay using CellTiter
X P. Supplementary Figure 1. Nature Medicine: doi: /nm Nilotinib LSK LT-HSC. Cytoplasm. Cytoplasm. Nucleus. Nucleus
 a b c Supplementary Figure 1 c-kit-apc-eflu780 Lin-FITC Flt3-Linc-Kit-APC-eflu780 LSK Sca-1-PE-Cy7 d e f CD48-APC LT-HSC CD150-PerCP-cy5.5 g h i j Cytoplasm RCC1 X Exp 5 mir 126 SPRED1 SPRED1 RAN P SPRED1
Supplementary Figure 1. Expression of CUGBP1 in non-parenchymal liver cells treated with TGF-β
 Supplementary Figures Supplementary Figure 1. Expression of CUGBP1 in non-parenchymal liver cells treated with TGF-β and LPS. Non-parenchymal liver cells were isolated and treated with or without TGF-β
Supplementary Figure 1. mrna expression of chitinase and chitinase-like protein in splenic immune cells. Each splenic immune cell population was
 Supplementary Figure 1. mrna expression of chitinase and chitinase-like protein in splenic immune cells. Each splenic immune cell population was sorted by FACS. Surface markers for sorting were CD11c +
Supplementary Table 1. The primers used for quantitative RT-PCR. Gene name Forward (5 > 3 ) Reverse (5 > 3 )
 Reverse (5 > 3 )") 770 771 Supplementary Table 1. The primers used for quantitative RT-PCR. Gene name Forward (5 > 3 ) Reverse (5 > 3 ) Human CXCL1 GCGCCCAAACCGAAGTCATA ATGGGGGATGCAGGATTGAG PF4 CCCCACTGCCCAACTGATAG TTCTTGTACAGCGGGGCTTG
770 771 Supplementary Table 1. The primers used for quantitative RT-PCR. Gene name Forward (5 > 3 ) Reverse (5 > 3 ) Human CXCL1 GCGCCCAAACCGAAGTCATA ATGGGGGATGCAGGATTGAG PF4 CCCCACTGCCCAACTGATAG TTCTTGTACAGCGGGGCTTG
W/T Itgam -/- F4/80 CD115. F4/80 hi CD115 + F4/80 + CD115 +
 F4/8 % in the peritoneal lavage 6 4 2 p=.15 n.s p=.76 CD115 F4/8 hi CD115 + F4/8 + CD115 + F4/8 hi CD115 + F4/8 + CD115 + MHCII MHCII Supplementary Figure S1. CD11b deficiency affects the cellular responses
SUPPLEMENTARY INFORMATION
 doi:10.1038/nature12652 Supplementary Figure 1. PRDM16 interacts with endogenous EHMT1 in brown adipocytes. Immunoprecipitation of PRDM16 complex by flag antibody (M2) followed by Western blot analysis
Supplementary Figure 1. Confocal immunofluorescence showing mitochondrial translocation of Drp1. Cardiomyocytes treated with H 2 O 2 were prestained
 Supplementary Figure 1. Confocal immunofluorescence showing mitochondrial translocation of Drp1. Cardiomyocytes treated with H 2 O 2 were prestained with MitoTracker (red), then were immunostained with
Eosinophils are required. for the maintenance of plasma cells in the bone marrow
 Eosinophils are required for the maintenance of plasma cells in the bone marrow Van Trung Chu, Anja Fröhlich, Gudrun Steinhauser, Tobias Scheel, Toralf Roch, Simon Fillatreau, James J. Lee, Max Löhning
Supplementary Figure 1: Expression of NFAT proteins in Nfat2-deleted B cells (a+b) Protein expression of NFAT2 (a) and NFAT1 (b) in isolated splenic
 Protein expression of NFAT2 (a) and NFAT1 (b) in isolated splenic") Supplementary Figure 1: Expression of NFAT proteins in Nfat2-deleted B cells (a+b) Protein expression of NFAT2 (a) and NFAT1 (b) in isolated splenic B cells from WT Nfat2 +/+, TCL1 Nfat2 +/+ and TCL1 Nfat2
Supplementary Figure 1: Expression of NFAT proteins in Nfat2-deleted B cells (a+b) Protein expression of NFAT2 (a) and NFAT1 (b) in isolated splenic B cells from WT Nfat2 +/+, TCL1 Nfat2 +/+ and TCL1 Nfat2
General Laboratory methods Plasma analysis: Gene Expression Analysis: Immunoblot analysis: Immunohistochemistry:
 General Laboratory methods Plasma analysis: Plasma insulin (Mercodia, Sweden), leptin (duoset, R&D Systems Europe, Abingdon, United Kingdom), IL-6, TNFα and adiponectin levels (Quantikine kits, R&D Systems
SUPPLEMENTARY FIGURES
 SUPPLEMENTARY FIGURES Supplementary Figure 1: Chemokine receptor expression profiles of CCR6 + and CCR6 - CD4 + IL-17A +/ex and Treg cells. Quantitative PCR analysis of chemokine receptor transcript abundance
well for 2 h at rt. Each dot represents an individual mouse and bar is the mean ±
 Supplementary data: Control DC Blimp-1 ko DC 8 6 4 2-2 IL-1β p=.5 medium 8 6 4 2 IL-2 Medium p=.16 8 6 4 2 IL-6 medium p=.3 5 4 3 2 1-1 medium IL-1 n.s. 25 2 15 1 5 IL-12(p7) p=.15 5 IFNγ p=.65 4 3 2 1
Figure S1. Western blot analysis of clathrin RNA interference in human DCs Human immature DCs were transfected with 100 nm Clathrin SMARTpool or
 Figure S1. Western blot analysis of clathrin RNA interference in human DCs Human immature DCs were transfected with 100 nm Clathrin SMARTpool or control nontargeting sirnas. At 90 hr after transfection,
CHAPTER 5 RESULTS Previous study: cell culture and organotypical slices
 45 CHAPTER 5 RESULTS 5.1. Previous study: cell culture and organotypical slices Initial experiments have been conducted to ensure that the tet-on system works. A neuronal cell culture from mice expressing
Supplementary Fig. 1. Identification of acetylation of K68 of SOD2
 Supplementary Fig. 1. Identification of acetylation of K68 of SOD2 A B H. sapiens 54 KHHAAYVNNLNVTEEKYQEALAK 75 M. musculus 54 KHHAAYVNNLNATEEKYHEALAK 75 X. laevis 55 KHHATYVNNLNITEEKYAEALAK 77 D. rerio
Supplementary data Supplementary Figure 1 Supplementary Figure 2
 Supplementary data Supplementary Figure 1 SPHK1 sirna increases RANKL-induced osteoclastogenesis in RAW264.7 cell culture. (A) RAW264.7 cells were transfected with oligocassettes containing SPHK1 sirna
Relative SOD1 activity. Relative SOD2 activity. Relative SOD activity (Infected:Mock) + CP + DDC
 + CP + DDC") Supplementary Figure 1. SOD1 activity is significantly increased relative to SOD1 levels. SOD1 and SOD2 activities in the infected mork13 cells are shown normalised to their corresponding levels and relative
Supplementary Figure 1. SOD1 activity is significantly increased relative to SOD1 levels. SOD1 and SOD2 activities in the infected mork13 cells are shown normalised to their corresponding levels and relative
Supplementary Figure 1. AdipoR1 silencing and overexpression controls. (a) Representative blots (upper and lower panels) showing the AdipoR1 protein
 Representative blots (upper and lower panels) showing the AdipoR1 protein") Supplementary Figure 1. AdipoR1 silencing and overexpression controls. (a) Representative blots (upper and lower panels) showing the AdipoR1 protein content relative to GAPDH in two independent experiments.
Supplementary Figure 1. AdipoR1 silencing and overexpression controls. (a) Representative blots (upper and lower panels) showing the AdipoR1 protein content relative to GAPDH in two independent experiments.
D CD8 T cell number (x10 6 )
") IFNγ Supplemental Figure 1. CD T cell number (x1 6 ) 18 15 1 9 6 3 CD CD T cells CD6L C CD5 CD T cells CD6L D CD8 T cell number (x1 6 ) 1 8 6 E CD CD8 T cells CD6L F Log(1)CFU/g Feces 1 8 6 p
IFNγ Supplemental Figure 1. CD T cell number (x1 6 ) 18 15 1 9 6 3 CD CD T cells CD6L C CD5 CD T cells CD6L D CD8 T cell number (x1 6 ) 1 8 6 E CD CD8 T cells CD6L F Log(1)CFU/g Feces 1 8 6 p
Pair-fed % inkt cells 0.5. EtOH 0.0
 MATERIALS AND METHODS Histopathological analysis Liver tissue was collected 9 h post-gavage, and the tissue samples were fixed in 1% formalin and paraffin-embedded following a standard procedure. The embedded
Influenza virus exploits tunneling nanotubes for cell-to-cell spread
 Supplementary Information Influenza virus exploits tunneling nanotubes for cell-to-cell spread Amrita Kumar 1, Jin Hyang Kim 1, Priya Ranjan 1, Maureen G. Metcalfe 2, Weiping Cao 1, Margarita Mishina 1,
Supplementary Information
 Supplementary Information Supplementary Figure 1. Short-term coreceptor and costimulation blockade induces tolerance to pluripotent human ESCs. (A) Schematic diagram showing experimental approaches and
Supplementary Figure 1. Prevalence of U539C and G540A nucleotide and E172K amino acid substitutions among H9N2 viruses. Full-length H9N2 NS
 Supplementary Figure 1. Prevalence of U539C and G540A nucleotide and E172K amino acid substitutions among H9N2 viruses. Full-length H9N2 NS nucleotide sequences (a, b) or amino acid sequences (c) from
Supplementary Figure 1. Normal T lymphocyte populations in Dapk -/- mice. (a) Normal thymic development in Dapk -/- mice. Thymocytes from WT and Dapk
 Normal thymic development in Dapk -/- mice. Thymocytes from WT and Dapk") Supplementary Figure 1. Normal T lymphocyte populations in Dapk -/- mice. (a) Normal thymic development in Dapk -/- mice. Thymocytes from WT and Dapk -/- mice were stained for expression of CD4 and CD8.
Supplementary Figure 1. Normal T lymphocyte populations in Dapk -/- mice. (a) Normal thymic development in Dapk -/- mice. Thymocytes from WT and Dapk -/- mice were stained for expression of CD4 and CD8.
Title of file for HTML: Supplementary Information Description: Supplementary Figures and Supplementary Table
 Title of file for HTML: Supplementary Information Description: Supplementary Figures and Supplementary Table Title of file for HTML: Peer Review File Description: Innate Scavenger Receptor-A regulates
Kidney. Heart. Lung. Sirt1. Gapdh. Mouse IgG DAPI. Rabbit IgG DAPI
 a e Na V 1.5 Ad-LacZ Ad- 110KD b Scn5a/ (relative to Ad-LacZ) f 150 100 50 0 p = 0.65 Ad-LacZ Ad- c Heart Lung Kidney Spleen 110KD d fl/fl c -/- DAPI 20 µm Na v 1.5 250KD fl/fl Rabbit IgG DAPI fl/fl Mouse
Supplementary Table 1. Characterization of HNSCC PDX models established at MSKCC
 Supplementary Table 1. Characterization of HNSCC PDX models established at MSKCC Supplementary Table 2. Drug content and loading efficiency estimated with F-NMR and UV- Vis Supplementary Table 3. Complete
Effective Targeting of Quiescent Chronic Myelogenous
 Cancer Cell, Volume 7 Supplemental Information Effective Targeting of Quiescent Chronic Myelogenous Leukemia Stem Cells by Histone Deacetylase Inhibitors in Combination with Imatinib Mesylate Bin Zhang,
Stewart et al. CD36 ligands promote sterile inflammation through assembly of a TLR 4 and 6 heterodimer
 NFκB (fold induction) Stewart et al. ligands promote sterile inflammation through assembly of a TLR 4 and 6 heterodimer a. mrna (fold induction) 5 4 3 2 1 LDL oxldl Gro1a MIP-2 RANTES mrna (fold induction)
<10. IL-1β IL-6 TNF + _ TGF-β + IL-23
 3 ns 25 ns 2 IL-17 (pg/ml) 15 1 ns ns 5 IL-1β IL-6 TNF
Supplementary Figure S1. Flow cytometric analysis of the expression of Thy1 in NH cells. Flow cytometric analysis of the expression of T1/ST2 and
 Supplementary Figure S1. Flow cytometric analysis of the expression of Thy1 in NH cells. Flow cytometric analysis of the expression of T1/ST2 and Thy1 in NH cells derived from the lungs of naïve mice.
Supplemental Materials for. Effects of sphingosine-1-phosphate receptor 1 phosphorylation in response to. FTY720 during neuroinflammation
 Supplemental Materials for Effects of sphingosine-1-phosphate receptor 1 phosphorylation in response to FTY7 during neuroinflammation This file includes: Supplemental Table 1. EAE clinical parameters of
TRAF6 ubiquitinates TGFβ type I receptor to promote its cleavage and nuclear translocation in cancer
 Supplementary Information TRAF6 ubiquitinates TGFβ type I receptor to promote its cleavage and nuclear translocation in cancer Yabing Mu, Reshma Sundar, Noopur Thakur, Maria Ekman, Shyam Kumar Gudey, Mariya
Boucher et al NCOMMS B
 1 Supplementary Figure 1 (linked to Figure 1). mvegfr1 constitutively internalizes in endothelial cells. (a) Immunoblot of mflt1 from undifferentiated mouse embryonic stem (ES) cells with indicated genotypes;
Electron micrograph of phosphotungstanic acid-stained exosomes derived from murine
 1 SUPPLEMENTARY INFORMATION SUPPLEMENTARY FIGURES Supplementary Figure 1. Physical properties of murine DC-derived exosomes. a, Electron micrograph of phosphotungstanic acid-stained exosomes derived from
SUPPLEMENTARY FIGURES AND TABLE
 SUPPLEMENTARY FIGURES AND TABLE Supplementary Figure S1: Characterization of IRE1α mutants. A. U87-LUC cells were transduced with the lentiviral vector containing the GFP sequence (U87-LUC Tet-ON GFP).
Supplemental Information
 Supplemental Information Tobacco-specific Carcinogen Induces DNA Methyltransferases 1 Accumulation through AKT/GSK3β/βTrCP/hnRNP-U in Mice and Lung Cancer patients Ruo-Kai Lin, 1 Yi-Shuan Hsieh, 2 Pinpin
Supplementary Materials for
 immunology.sciencemag.org/cgi/content/full/2/16/eaan6049/dc1 Supplementary Materials for Enzymatic synthesis of core 2 O-glycans governs the tissue-trafficking potential of memory CD8 + T cells Jossef
Supplemental Figure 1. Western blot analysis indicated that MIF was detected in the fractions of
 Supplemental Figure Legends Supplemental Figure 1. Western blot analysis indicated that was detected in the fractions of plasma membrane and cytosol but not in nuclear fraction isolated from Pkd1 null
BMP6 treatment compensates for the molecular defect and ameliorates hemochromatosis in Hfe knockout mice
 SUPPLEMENTARY MATERIALS BMP6 treatment compensates for the molecular defect and ameliorates hemochromatosis in Hfe knockout mice Elena Corradini, Paul J. Schmidt, Delphine Meynard, Cinzia Garuti, Giuliana
Extracellular vesicles are transferred from melanocytes to keratinocytes after UVA irradiation
 Supplementary material; Title; Extracellular vesicles are transferred from melanocytes to keratinocytes after UVA irradiation Authors; Petra Wäster 1, Ida Eriksson 1, Linda Vainikka 1, Inger Rosdahl 2,
Supplemental figure 1. PDGFRα is expressed dominantly by stromal cells surrounding mammary ducts and alveoli. A) IHC staining of PDGFRα in
 IHC staining of PDGFRα in") Supplemental figure 1. PDGFRα is expressed dominantly by stromal cells surrounding mammary ducts and alveoli. A) IHC staining of PDGFRα in nulliparous (left panel) and InvD6 mouse mammary glands (right
Supplemental figure 1. PDGFRα is expressed dominantly by stromal cells surrounding mammary ducts and alveoli. A) IHC staining of PDGFRα in nulliparous (left panel) and InvD6 mouse mammary glands (right
Table S1. Primer sequences used for qrt-pcr. CACCATTGGCAATGAGCGGTTC AGGTCTTTGCGGATGTCCACGT ACTB AAGTCCATGTGCTGGCAGCACT ATCACCACTCCGAAGTCCGTCT LCOR
 Table S1. Primer sequences used for qrt-pcr. ACTB LCOR KLF6 CTBP1 CDKN1A CDH1 ATF3 PLAU MMP9 TFPI2 CACCATTGGCAATGAGCGGTTC AGGTCTTTGCGGATGTCCACGT AAGTCCATGTGCTGGCAGCACT ATCACCACTCCGAAGTCCGTCT CGGCTGCAGGAAAGTTTACA
Supplementary Figure 1
 Supplementary Figure 1 The average sigmoid parametric curves of capillary dilation time courses and average time to 50% peak capillary diameter dilation computed from individual capillary responses averaged
Supplementary Figure 1 IMQ-Induced Mouse Model of Psoriasis. IMQ cream was
 Supplementary Figure 1 IMQ-Induced Mouse Model of Psoriasis. IMQ cream was painted on the shaved back skin of CBL/J and BALB/c mice for consecutive days. (a, b) Phenotypic presentation of mouse back skin
Live cell imaging of trafficking of the chaperone complex vaccine to the ER. BMDCs were incubated with ER-Tracker Red (1 M) in staining solution for
 in staining solution for") Live cell imaging of trafficking of the chaperone complex vaccine to the ER. BMDCs were incubated with ER-Tracker Red (1 M) in staining solution for 15 min at 37 C and replaced with fresh complete medium.
Live cell imaging of trafficking of the chaperone complex vaccine to the ER. BMDCs were incubated with ER-Tracker Red (1 M) in staining solution for 15 min at 37 C and replaced with fresh complete medium.
Product Datasheet. EMMPRIN/CD147 Antibody (MEM-M6/1) NB Unit Size: 0.1 mg. Store at 4C. Do not freeze. Publications: 2
 NB Unit Size: 0.1 mg. Store at 4C. Do not freeze. Publications: 2") Product Datasheet EMMPRIN/CD147 Antibody (MEM-M6/1) NB500-430 Unit Size: 0.1 mg Store at 4C. Do not freeze. Publications: 2 Protocols, Publications, Related Products, Reviews, Research Tools and Images
Product Datasheet EMMPRIN/CD147 Antibody (MEM-M6/1) NB500-430 Unit Size: 0.1 mg Store at 4C. Do not freeze. Publications: 2 Protocols, Publications, Related Products, Reviews, Research Tools and Images
SHREE ET AL, SUPPLEMENTAL MATERIALS. (A) Workflow for tumor cell line derivation and orthotopic implantation.
 Workflow for tumor cell line derivation and orthotopic implantation.") SHREE ET AL, SUPPLEMENTAL MATERIALS SUPPLEMENTAL FIGURE AND TABLE LEGENDS Supplemental Figure 1. Derivation and characterization of TS1-TGL and TS2-TGL PyMT cell lines and development of an orthotopic
SHREE ET AL, SUPPLEMENTAL MATERIALS SUPPLEMENTAL FIGURE AND TABLE LEGENDS Supplemental Figure 1. Derivation and characterization of TS1-TGL and TS2-TGL PyMT cell lines and development of an orthotopic
Supporting Information
 Supporting Information Pang et al. 10.1073/pnas.1322009111 SI Materials and Methods ELISAs. These assays were performed as previously described (1). ELISA plates (MaxiSorp Nunc; Thermo Fisher Scientific)
Supplementary Materials and Methods
 Supplementary Materials and Methods Hepatocyte toxicity assay. Freshly isolated hepatocytes were incubated for overnight with varying concentrations (-25 µm) of sodium glycochenodeoxycholate (GCDC) or
TEB. Id4 p63 DAPI Merge. Id4 CK8 DAPI Merge
 a Duct TEB b Id4 p63 DAPI Merge Id4 CK8 DAPI Merge c d e Supplementary Figure 1. Identification of Id4-positive MECs and characterization of the Comma-D model. (a) IHC analysis of ID4 expression in the
F-actin VWF Vinculin. F-actin. Vinculin VWF
 a F-actin VWF Vinculin b F-actin VWF Vinculin Supplementary Fig. 1. WPBs in HUVECs are located along stress fibers and at focal adhesions. (a) Immunofluorescence images of f-actin (cyan), VWF (yellow),
Evaluation of directed and random motility in microslides Assessment of leukocyte adhesion in flow chambers
 Evaluation of directed and random motility in microslides Motility experiments in IBIDI microslides, image acquisition and processing were performed as described. PMN, which ended up in an angle < 180
Supplementary Figure 1. HOPX is hypermethylated in NPC. (a) Methylation levels of HOPX in Normal (n = 24) and NPC (n = 24) tissues from the
 Methylation levels of HOPX in Normal (n = 24) and NPC (n = 24) tissues from the") Supplementary Figure 1. HOPX is hypermethylated in NPC. (a) Methylation levels of HOPX in Normal (n = 24) and NPC (n = 24) tissues from the genome-wide methylation microarray data. Mean ± s.d.; Student
Supplementary Figure 1. HOPX is hypermethylated in NPC. (a) Methylation levels of HOPX in Normal (n = 24) and NPC (n = 24) tissues from the genome-wide methylation microarray data. Mean ± s.d.; Student
Supplementary Information and Figure legends
 Supplementary Information and Figure legends Table S1. Primers for quantitative RT-PCR Target Sequence (5 -> 3 ) Target Sequence (5 -> 3 ) DAB2IP F:TGGACGATGTGCTCTATGCC R:GGATGGTGATGGTTTGGTAG Snail F:CCTCCCTGTCAGATGAGGAC
Figure S1. Generation of inducible PTEN deficient mice and the BMMCs (A) B6.129 Pten loxp/loxp mice were mated with B6.
 B6.129 Pten loxp/loxp mice were mated with B6.") Figure S1. Generation of inducible PTEN deficient mice and the BMMCs (A) B6.129 Pten loxp/loxp mice were mated with B6.129-Gt(ROSA)26Sor tm1(cre/ert2)tyj /J mice. To induce deletion of the Pten locus,
Figure S1. Generation of inducible PTEN deficient mice and the BMMCs (A) B6.129 Pten loxp/loxp mice were mated with B6.129-Gt(ROSA)26Sor tm1(cre/ert2)tyj /J mice. To induce deletion of the Pten locus,
Supplementary Data Table of Contents:
 Supplementary Data Table of Contents: - Supplementary Methods - Supplementary Figures S1(A-B) - Supplementary Figures S2 (A-B) - Supplementary Figures S3 - Supplementary Figures S4(A-B) - Supplementary
Assay Name: Transwell migration using DAPI
 Assay Name: Transwell migration using DAPI Assay ID: Celigo_04_0001 Table of Contents Experiment: Identification of cells which have migrated through the membrane of a transwell insert....2 Celigo Setup...2
Nature Structural & Molecular Biology: doi: /nsmb Supplementary Figure 1. Differential expression of mirnas from the pri-mir-17-92a locus.
 Supplementary Figure 1 Differential expression of mirnas from the pri-mir-17-92a locus. (a) The mir-17-92a expression unit in the third intron of the host mir-17hg transcript. (b,c) Impact of knockdown
Supplementary Fig. 1. GPRC5A post-transcriptionally down-regulates EGFR expression. (a) Plot of the changes in steady state mrna levels versus
 Plot of the changes in steady state mrna levels versus") Supplementary Fig. 1. GPRC5A post-transcriptionally down-regulates EGFR expression. (a) Plot of the changes in steady state mrna levels versus changes in corresponding proteins between wild type and Gprc5a-/-
Supplementary Fig. 1. GPRC5A post-transcriptionally down-regulates EGFR expression. (a) Plot of the changes in steady state mrna levels versus changes in corresponding proteins between wild type and Gprc5a-/-
Supplementary Figure 1. Efficient DC depletion in CD11c.DOG transgenic mice
 Supplementary Figure 1. Efficient DC depletion in CD11c.DOG transgenic mice (a) CD11c.DOG transgenic mice (tg) were treated with 8 ng/g body weight (b.w.) diphtheria toxin (DT) i.p. on day -1 and every
Title. CitationCancer science, 109(4): Issue Date Doc URL. Rights(URL)
: Issue Date Doc URL. Rights(URL)") Title Toll-like receptor 3 signal augments radiation-induc Yoshida, Sumito; Shime, Hiroaki; Takeda, Yohei; Nam, Author(s) Hiroki; Kasahara, Masanori; Seya, Tsukasa CitationCancer science, 19(): 956-965
Title Toll-like receptor 3 signal augments radiation-induc Yoshida, Sumito; Shime, Hiroaki; Takeda, Yohei; Nam, Author(s) Hiroki; Kasahara, Masanori; Seya, Tsukasa CitationCancer science, 19(): 956-965
Supplementary information
 Supplementary information Exosomes mediate the cell-to-cell transmission of interferon alpha-induced antiviral activity Jianhua Li, Kuancheng Liu, Yang Liu, Yan Xu, Fei Zhang, Huijuan Yang, Jiangxia Liu,
Erzsebet Kokovay, Susan Goderie, Yue Wang, Steve Lotz, Gang Lin, Yu Sun, Badrinath Roysam, Qin Shen,
 Cell Stem Cell, Volume 7 Supplemental Information Adult SVZ Lineage Cells Home to and Leave the Vascular Niche via Differential Responses to SDF1/CXCR4 Signaling Erzsebet Kokovay, Susan Goderie, Yue Wang,
marker. DAPI labels nuclei. Flies were 20 days old. Scale bar is 5 µm. Ctrl is
 Supplementary Figure 1. (a) Nos is detected in glial cells in both control and GFAP R79H transgenic flies (arrows), but not in deletion mutant Nos Δ15 animals. Repo is a glial cell marker. DAPI labels
hemodynamic stress. A. Echocardiographic quantification of cardiac dimensions and function in
 SUPPLEMENTAL FIGURE LEGENDS Supplemental Figure 1. Fbn1 C1039G/+ hearts display normal cardiac function in the absence of hemodynamic stress. A. Echocardiographic quantification of cardiac dimensions and
activation with anti-cd3/cd28 beads and 3d following transduction. Supplemental Figure 2 shows
 Supplemental Data Supplemental Figure 1 compares CXCR4 expression in untreated CD8 + T cells, following activation with anti-cd3/cd28 beads and 3d following transduction. Supplemental Figure 2 shows the
Endocannabinoid-activated Nlrp3 inflammasome in infiltrating macrophages mediates β- cell loss in type 2 diabetes
 Endocannabinoid-activated Nlrp3 inflammasome in infiltrating macrophages mediates β- cell loss in type 2 diabetes T Jourdan, G Godlewski, R Cinar, A Bertola, G Szanda, J Liu, J Tam, T Han, B Mukhopadhyay,
Supplemental Data Figure S1 Effect of TS2/4 and R6.5 antibodies on the kinetics of CD16.NK-92-mediated specific lysis of SKBR-3 target cells.
 Supplemental Data Figure S1. Effect of TS2/4 and R6.5 antibodies on the kinetics of CD16.NK-92-mediated specific lysis of SKBR-3 target cells. (A) Specific lysis of IFN-γ-treated SKBR-3 cells in the absence
Supplementary Figure 1. Establishment of prostacyclin-secreting hmscs. (a) PCR showed the integration of the COX-1-10aa-PGIS transgene into the
 PCR showed the integration of the COX-1-10aa-PGIS transgene into the") Supplementary Figure 1. Establishment of prostacyclin-secreting hmscs. (a) PCR showed the integration of the COX-1-10aa-PGIS transgene into the genomic DNA of hmscs (PGI2- hmscs). Native hmscs and plasmid
Supplementary Figure 1. Establishment of prostacyclin-secreting hmscs. (a) PCR showed the integration of the COX-1-10aa-PGIS transgene into the genomic DNA of hmscs (PGI2- hmscs). Native hmscs and plasmid
Supplementary Figure 1 Role of Raf-1 in TLR2-Dectin-1-mediated cytokine expression
 Supplementary Figure 1 Supplementary Figure 1 Role of Raf-1 in TLR2-Dectin-1-mediated cytokine expression. Quantitative real-time PCR of indicated mrnas in DCs stimulated with TLR2-Dectin-1 agonist zymosan
Supplemental Figure 1. (A) Western blot for the expression of RIPK1 in HK-2 cells treated with or without LPS (1 µg/ml) for indicated times.
 Western blot for the expression of RIPK1 in HK-2 cells treated with or without LPS (1 µg/ml) for indicated times.") Supplemental Figure 1. (A) Western blot for the expression of RIPK1 in HK-2 cells treated with or without LPS (1 µg/ml) for indicated times. Western blots shown are representative results from 3 independent
Supplemental Figure 1. (A) Western blot for the expression of RIPK1 in HK-2 cells treated with or without LPS (1 µg/ml) for indicated times. Western blots shown are representative results from 3 independent
Supporting Information Table of Contents
 Supporting Information Table of Contents Supporting Information Figure 1 Page 2 Supporting Information Figure 2 Page 4 Supporting Information Figure 3 Page 5 Supporting Information Figure 4 Page 6 Supporting
Supplemental Information. CD4 + CD25 + Foxp3 + Regulatory T Cells Promote. Th17 Cells In Vitro and Enhance Host Resistance
 Immunity, Volume 34 Supplemental Information D4 + D25 + + Regulatory T ells Promote Th17 ells In Vitro and Enhance Host Resistance in Mouse andida albicans Th17 ell Infection Model Pushpa Pandiyan, Heather
Supplementary Figure 1 Lymphocytes can be tracked for at least 4 weeks after
 Supplementary Figure 1 Lymphocytes can be tracked for at least 4 weeks after photoconversion by using H2B-Dendra2. 4-5 PPs of H2B-Dendra2 BM chimeras were photoconverted and analyzed 7 days (upper panel)
Figure S1. Sorting nexin 9 (SNX9) specifically binds psmad3 and not psmad 1/5/8. Lysates from AKR-2B cells untreated (-) or stimulated (+) for 45 min
 specifically binds psmad3 and not psmad 1/5/8. Lysates from AKR-2B cells untreated (-) or stimulated (+) for 45 min") Figure S1. Sorting nexin 9 (SNX9) specifically binds psmad3 and not psmad 1/5/8. Lysates from AKR2B cells untreated () or stimulated () for 45 min with 5 ng/ml TGFβ or 10 ng/ml BMP4 were incubated with
Figure S1. Sorting nexin 9 (SNX9) specifically binds psmad3 and not psmad 1/5/8. Lysates from AKR2B cells untreated () or stimulated () for 45 min with 5 ng/ml TGFβ or 10 ng/ml BMP4 were incubated with
Prolonged mitotic arrest induces a caspase-dependent DNA damage
 SUPPLEMENTARY INFORMATION Prolonged mitotic arrest induces a caspase-dependent DNA damage response at telomeres that determines cell survival Karolina O. Hain, Didier J. Colin, Shubhra Rastogi, Lindsey
IL-6Rα IL-6RαT-KO KO. IL-6Rα f/f bp. f/f 628 bp deleted 368 bp. 500 bp
 STD H 2 O WT KO IL-6Rα f/f IL-6Rα IL-6RαT-KO KO 1000 bp 500 bp f/f 628 bp deleted 368 bp Supplementary Figure 1 Confirmation of T-cell IL-6Rα deficiency. (a) Representative histograms and (b) quantification
Supplementary Figure 1
 Supplementary Figure 1 3 3 3 1 1 Bregma -1.6mm 3 : Bregma Ref) Http://www.mbl.org/atlas165/atlas165_start.html Bregma -.18mm Supplementary Figure 1 Schematic representation of the utilized brain slice
Supplementary Figure 1. Repression of hepcidin expression in the liver of mice treated with
 Supplementary Figure 1. Repression of hepcidin expression in the liver of mice treated with DMN Immunohistochemistry for hepcidin and H&E staining (left). qrt-pcr assays for hepcidin in the liver (right).
Pathologic Stage. Lymph node Stage
 ASC ASC a c Patient ID BMI Age Gleason score Non-obese PBMC 1 22.1 81 6 (3+3) PBMC 2 21.9 6 6 (3+3) PBMC 3 22 84 8 (4+4) PBMC 4 24.6 68 7 (3+4) PBMC 24. 6 (3+3) PBMC 6 24.7 73 7 (3+4) PBMC 7 23. 67 7 (3+4)
Supplementary Table; Supplementary Figures and legends S1-S21; Supplementary Materials and Methods
 Silva et al. PTEN posttranslational inactivation and hyperactivation of the PI3K/Akt pathway sustain primary T cell leukemia viability Supplementary Table; Supplementary Figures and legends S1-S21; Supplementary
Supplemental Figure 1
 Supplemental Figure 1 1a 1c PD-1 MFI fold change 6 5 4 3 2 1 IL-1α IL-2 IL-4 IL-6 IL-1 IL-12 IL-13 IL-15 IL-17 IL-18 IL-21 IL-23 IFN-α Mut Human PD-1 promoter SBE-D 5 -GTCTG- -1.2kb SBE-P -CAGAC- -1.kb
(A) PCR primers (arrows) designed to distinguish wild type (P1+P2), targeted (P1+P2) and excised (P1+P3)14-
 PCR primers (arrows) designed to distinguish wild type (P1+P2), targeted (P1+P2) and excised (P1+P3)14-") 1 Supplemental Figure Legends Figure S1. Mammary tumors of ErbB2 KI mice with 14-3-3σ ablation have elevated ErbB2 transcript levels and cell proliferation (A) PCR primers (arrows) designed to distinguish
1 Supplemental Figure Legends Figure S1. Mammary tumors of ErbB2 KI mice with 14-3-3σ ablation have elevated ErbB2 transcript levels and cell proliferation (A) PCR primers (arrows) designed to distinguish