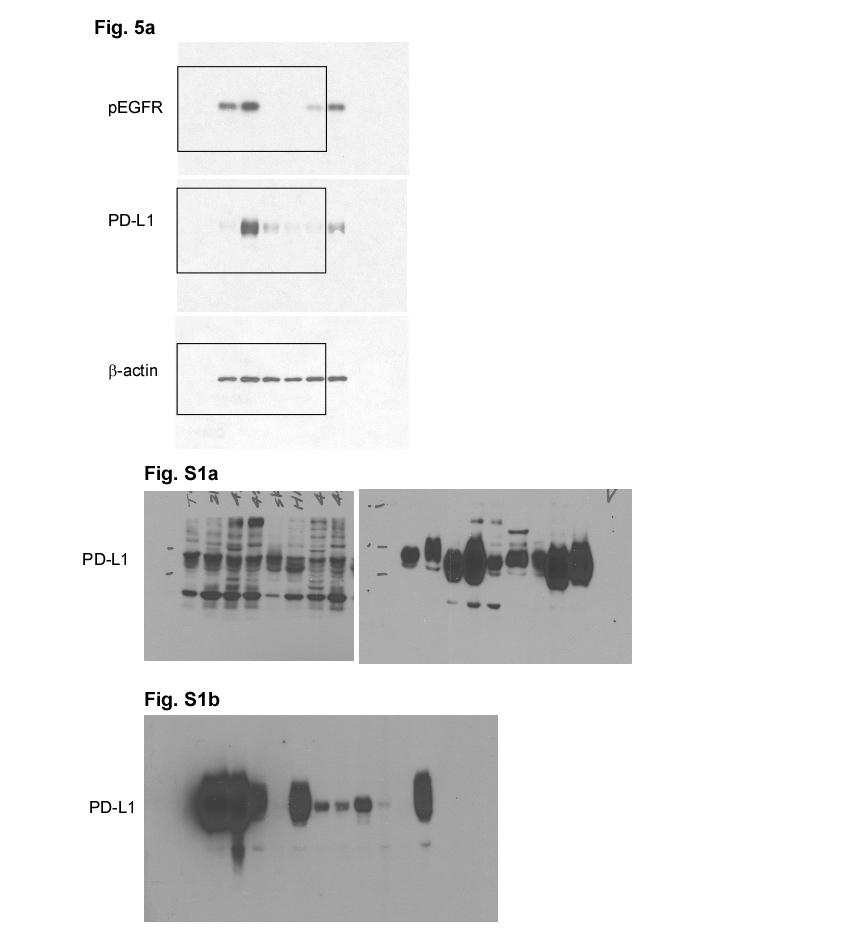
Supplementary Figure 1. PD-L1 is glycosylated in cancer cells. (a) Western blot analysis of PD-L1 in breast cancer cells. (b) Western blot analysis
|
|
|
- Brittney Jones
- 5 years ago
- Views:
Transcription
 Western blot analysis of PD-L1 in shctrl and two independent shpd-l1 stable clones of MDA-MB-231 and A431 cells. shctrl, control shrna.")
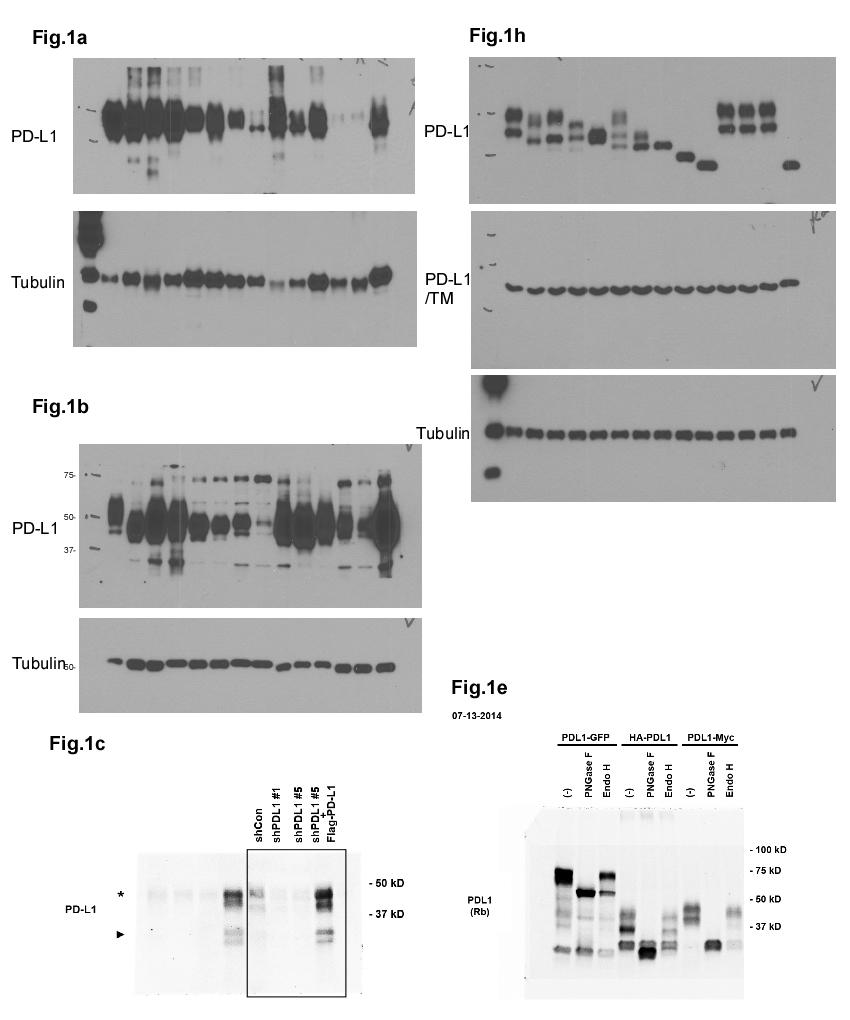
1 Supplementary Figure 1. PD-L1 is glycosylated in cancer cells. (a) Western blot analysis of PD-L1 in breast cancer cells. (b) Western blot analysis of PD-L1 in ovarian cancer cells. (c) Western blot analysis of PD-L1 in shctrl and two independent shpd-l1 stable clones of MDA-MB-231 and A431 cells. shctrl, control shrna. (d) Dual-expression construct for Flag-PD-L1 and shrna of PD-L1. (e) Glycoprotein staining of purified PD-L1 protein with or without PNGase F treatment. Coomassie blue staining panel represents total amount of PD-L1 protein. The upper bands appear in lane 4 and 5 are from the loading of PNGase F. ( ) Ctrl, a control for non-glycoprotein; (+) Ctrl, a control for glycoprotein.
 Western blot analysis of PD-L1-Myc, PD-L1-Flag, HA-PD-L1 and PD-L1-GFP proteins in Tunicamycin (TM) treated cells.")
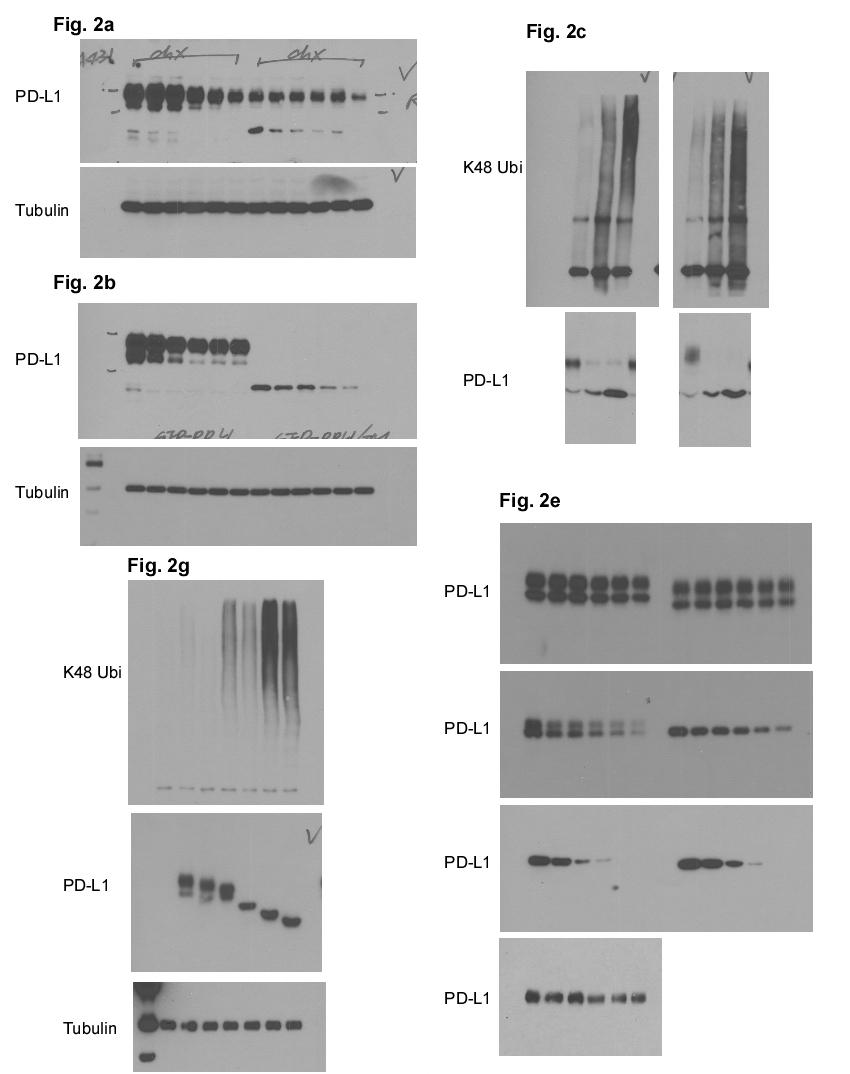
2 Supplementary Figure 2. Expression of glycosylated and non-glycosylated PD-L1 protein. (a) Western blot analysis of PD-L1-Myc, PD-L1-Flag, HA-PD-L1 and PD-L1-GFP proteins in Tunicamycin (TM) treated cells. (b) Western blot analysis of PD-L1-Myc, PD-L1-Flag, HA-PD- L1, PD-L1-GFP WT, ECD, and ICD proteins in TM treated cells. (c) The mean of the intensity of glycosylated (black bar) or non-glycosylated PD-L1 (red bar) protein obtained from the bottom of (b). (d) Glycosylation pattern of PD-L1 protein in PD-L1 expressing cells. Cell lysates were treated with PNGase F or O-glycosidase and analyzed by Western blot. ECD, extracellular domain; ICD, intracellular domain; Black circle, glycosylated PD-L1; arrowhead, nonglycosylated PD-L1; *P < 0.05 by Student s t test. All error bars are expressed as mean ±SD of 3 independent experiments.

3 Supplementary Figure 3. N-glycosylation sites of PD-L1 protein. Sequence alignment of the PD-L1 amino acid sequences from different species. Four NXT motifs, N35, N192, N200, and N219 are highlighted in red and two non-nxt motifs, N63 and N204, in green. Red box, conserved NXT motif.
4 Supplementary Figure 4. N-glycosylation sites of PD-L1 protein. (a)-(f) LC-MS/MS-based identification of N-glycopeptides corresponding to each of the four N-glycosylation sites, N35, N192, N200, and N219 of PD-L1 (from BT549 cells). The LC-MS profiles (a, c, and e) are shown as spectra averaged over a period of elution time (as labeled in figures) when a representative subset of glycoforms were detected. For each N-glycosylation site, one representive HCD MS 2 spectrum (b, d, and f) is shown to exemplify its identification based on detection of y1 ion (tryptic peptide backbone carrying the GlcNAc attached to the N- glycosylated Asn), along with the b and y ions defining its peptide sequence. The cartoon symbols used for the glycans (see inset) conform to the standard representation recommended by the Consortium for Functional Glycomics: Additional Hex and HexNAc were tentatively assigned as either lacnac (Gal-GlcNAc) or lacdinac (GalNAc-GlcNAc) extension from the trimannosyl core (Man 3 -GlcNAc 2 ), which can be core fucosylated.
 Sequence alignment of the PD-L1 amino acid sequences from different species.")
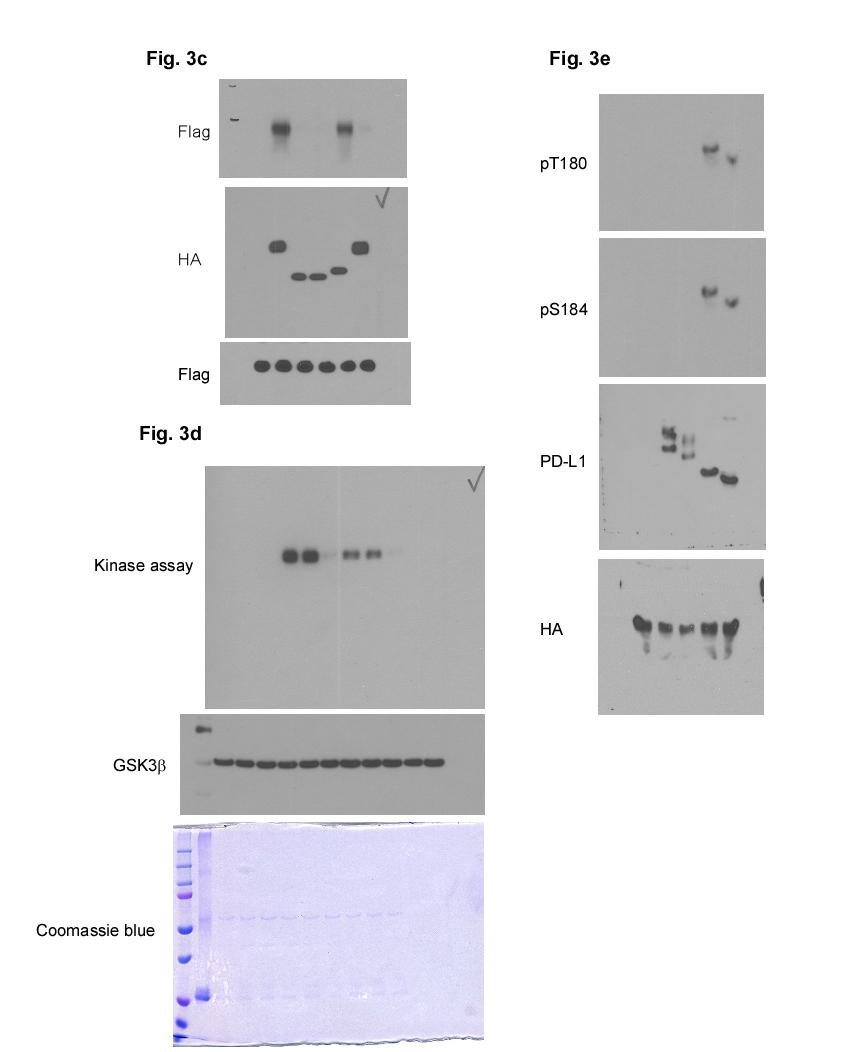
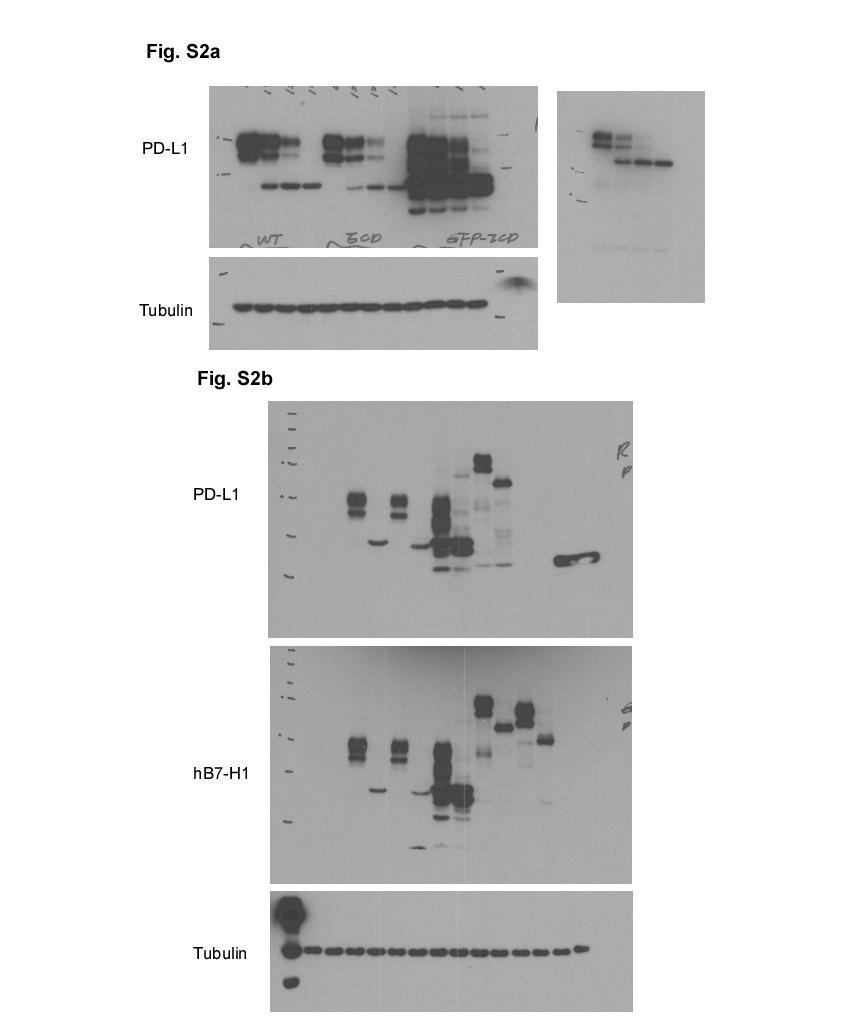
5 Supplementary Figure 5. GSK3β interacts and phosphorylates PD-L1 (a) Ubiquitination of non-glycosylated PD-L1. Endogenous PD-L1 was immunoprecipitated and subjected to Western blotting with ubiquitin antibody. (b) Sequence alignment of the PD-L1 amino acid sequences from different species. Three NXT motifs, N192, N200, and N219 are highlighted in blue and GSK3β phosphorylation motif, S176, T180 and S184, in red. (c) Co-immunoprecipitation measuring the interaction of GSK3β and PD-L1. MDA-MB-231 cells were pretreated with 5 µg/ml Tunicamycin (TM) or DMSO for overnight. Endogenous PD-L1 was immunoprecipitated with PD-L1 antibody and subjected to Western blotting with GSK3β antibody. (d) PD-L1 WT or 4NQ expressing BT549 cells were immunostained with GSK3β and PD-L1 antibodies and assessed using Duolink II assay. Red foci indicate interactions between GSK3β and PD-L1 WT or 4NQ proteins. Scale bar, 20 µm. (e) The binding affinity between PD-L1 4NQ and GSK3β. HEK 293 cells were transient transfected with indicated plasmid and then subject to immunoprecipitation followed by Western blotting. (f) Analysis of PD-L1 phosphorylation using Phos-tag/SDS polyacrylamide gel (PAGE). HEK 293T cells transfected with PD-L1 WT or PD- L1 4NQ together with HA-GSK3β CA were separated by Phos-tag/SDS PAGE. Undenatured samples were subject to λ-ppase treatment for 1 hr before resolving on the Phos-tag/SDS PAGE. (g) Characterization of phospho-pd-l1 antibodies. Black circle, glycosylated PD-L1; arrowhead, non-glycosylated PD-L1.

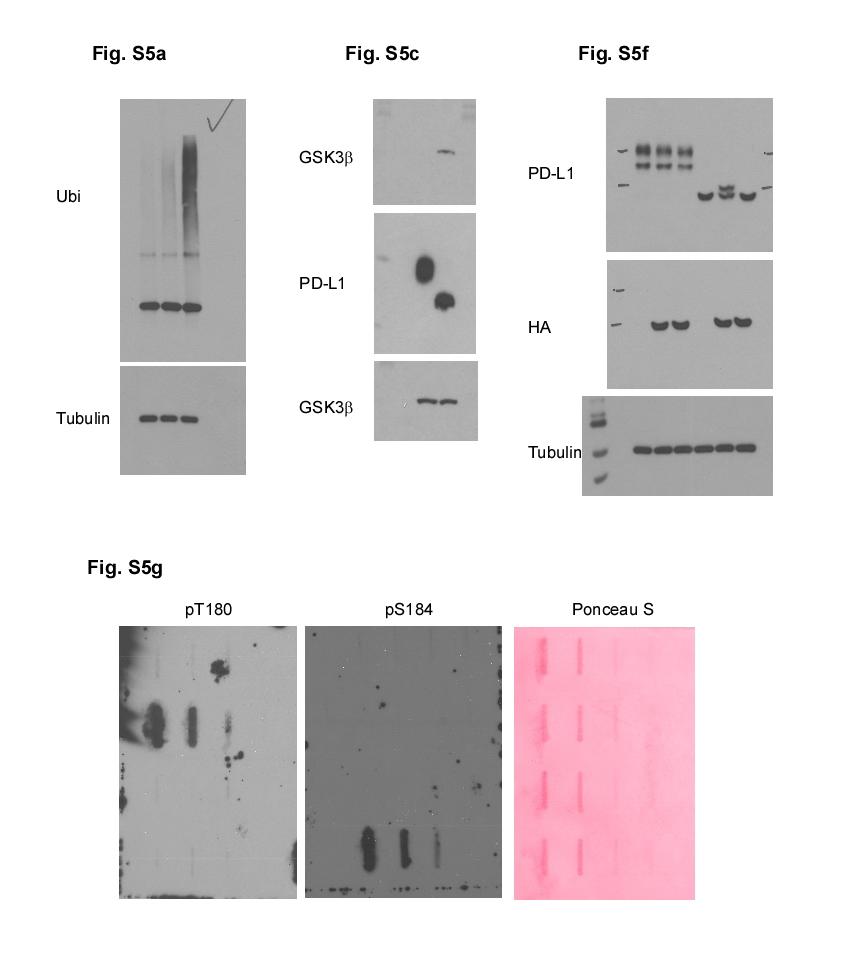
6 Supplementary Figure 6. GSK3β induces β-trcp-mediated PD-L1 ubiquitination and degradation. (a) Western blot analysis of PD-L1 4NQ expression. Various GSK3β were transfected together with PD-L1 4NQ to test their ability degrading PD-L1 4NQ. (b) BT549 PD- L1 4NQ cells were treated with CG, TG and resveratrol with the indicated concentration for 48 h. Protein expression was analyzed by Western blotting. (c) BT-549-PD-L1 4NQ cells were transfected with plasmids expressing HA-GSK3β, Flag-β-TrCP or Flag-β-TrCP df and analyzed by Western blot. (d, e) Ubiquitination of PD-L1 requires GSK3β phosphorylation. GSK3β, PD- L1 4NQ and β-trcp were transient transfected in HEK 293T cells. Ubiquitinated PD-L1 was pull down by His-tagged Ubiquitin and analyzed by Western blot. Black circle, glycosylated PD- L1; arrowhead, non-glycosylated PD-L1.
 PD-1 binding assay of GSK3β stable clones from (c). (e) Schematic diagram of IL-2 ELISA. PD-L1 stable clones were co-cultured with PD-1 overexpressed Jurkat T cells.")
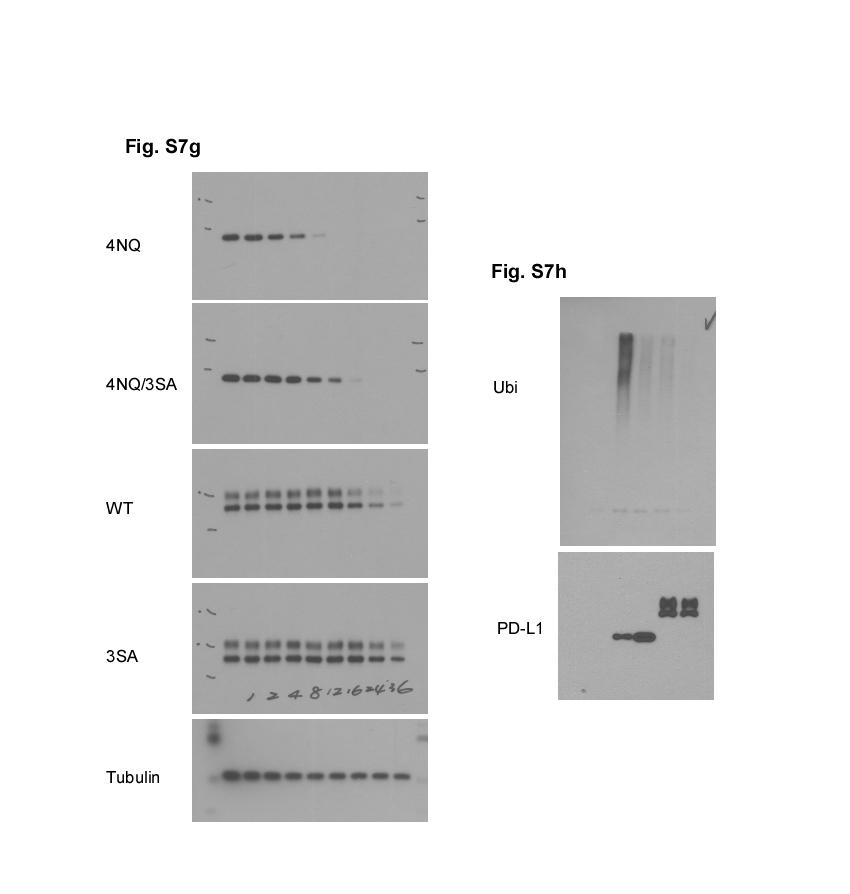
7 Supplementary Figure 7. (a) Characterization of GSK3β shrna clones. (b) Vector design of GSK3b knockdown and reconstitution. (c) Western blot analysis of stable clones with GSK3β variants. (d) PD-1 binding assay of GSK3β stable clones from (c). (e) Schematic diagram of IL-2 ELISA. PD-L1 stable clones were co-cultured with PD-1 overexpressed Jurkat T cells. IL-2 expression from Jurkat T cells was measured by ELISA. (f) Jurkat T cells IL2 expression of GSK3β stable clones from (c). (g, h) Western blot analysis of PD-L1 4NQ, 4NQ/3SA, WT, and 3SA protein stability. Cells were treated with or without 20 mm CHX as indicated intervals shown in (g). Protein ubiquitination is shown in (h). (i) Schematic diagram of T cell-mediated tumor cell killing assay. Nuclear restricted RFP expressing tumor cells and activated T cell are co-cultured in presence of Caspase 3/7 substrate. T cells were activated with anti-cd3 antibody (100 ng/ml) and IL-2 (10 ng/ml). At 96 hr, RFP and green fluorescent (NucView TM 488 Caspase 3/7 substrate) signal were measured. Green fluorescent cell was counted as dead cell. (j) Representative phase images (10x) of BT549 cells and/or activated T cells co-cultures at 96 hr. T cells were activated with anti-cd3 antibody (100 ng/ml) and IL-2 (10 ng/ml). The quantitative ratio of live cells is shown in bar graph (right). Scale bar, 100 µm. (k) Intracellular cytokine stain of IFNγ in CD8 + CD3 + T cell populations from the isolated TIL. Con, vector control expressing cells; WT, PD-L1 WT expressing cells; 3SA, PD-L1 3SA expressing cells. * P < 0.05 by Student s t test. All error bars are expressed as mean ±SD of 3 independent experiments.
 Western blot analysis of PD-L1 expression upon EGF or IFNγ treatment. The mrna expression of individual treatment was shown in the bottom.")
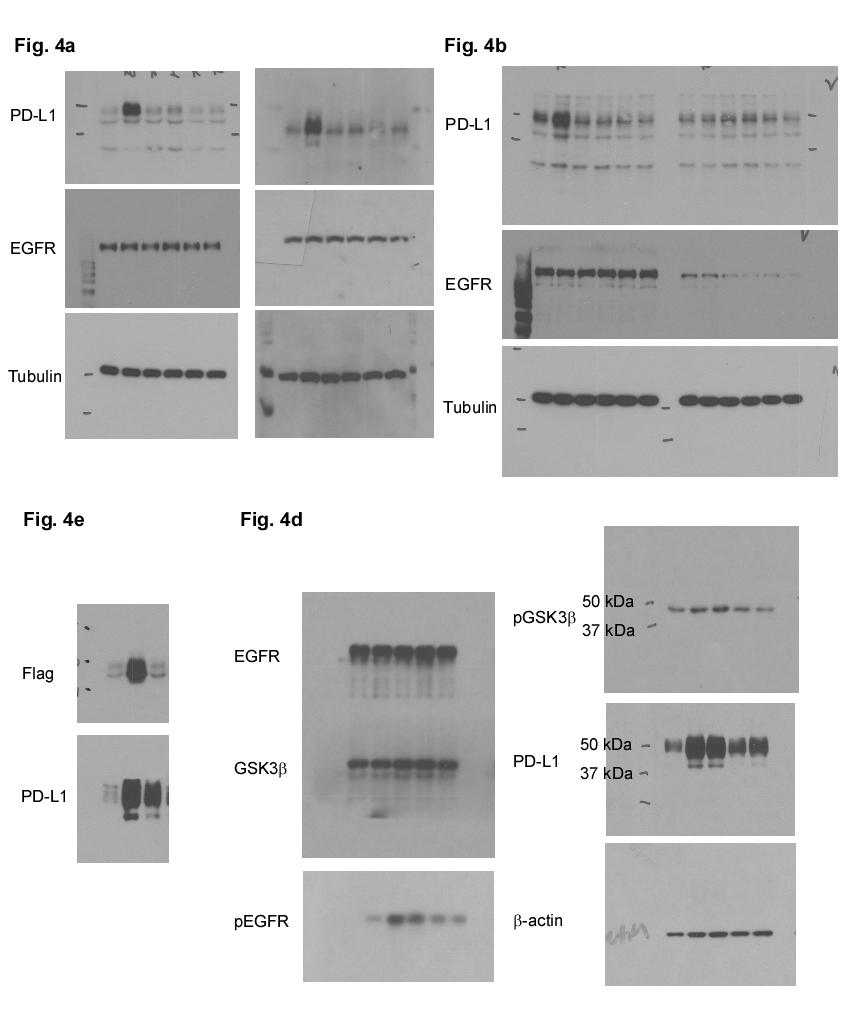
8 Supplementary Figure 8. EGF induces PD-L1 glycosylation. (a) Western blot analysis of PDL1 glycosylation in various cells. Cells were serum starvation for overnight and then treated with 25 ng of EGF. (b) Western blot analysis of PD-L1 expression upon EGF or IFNγ treatment. The mrna expression of individual treatment was shown in the bottom. (c) Representative images from IHC staining of p-egfr (phosphorylation of Tyr 1068), p-gsk3β (phosphorylation of Ser
9 9), PD-L1, and granzyme B in primary breast cancer patients. (d) A proposed model of EGF mediated PD-L1 stabilization contributing to T cell immune escape. Black circle, glycosylated PD-L1; arrowhead, non-glycosylated PD-L1. All error bars are expressed as mean ±SD of 3 independent experiments. Supplementary Figure 9. T cell profile analysis from tumor infiltrated lymphocytes. (a) The effect of treatment on mice body weight. (b) Mice liver and kidney functions were measured at the end of the experiments. (c) Flow cytometry of CD8 and CD4 markers on CD3 + T cells isolated from tumors of gefitinib and/or anti-pd-1 antibody treated mice. (d) Flow cytometry of IFNγ and CD8 markers on CD8 + CD4 T cells isolated from tumors of gefitinib and/or anti-pd-1 antibody-treated mice. Error bars represent mean ±SD of 3 independent experiments. (e) Intracellular cytokine stain of IFNγ + CD8 + in CD3 + T cell populations from the isolated TIL. (f) The tumor growth of EMT6 cells in gefitinib and/or anti-pd-1 antibody treated BALB/c mice. (g) The tumor growth of CT26 cells in gefitinib and/or anti-pd-1 antibody treated BALB/c mice.
10
11
12
13
14
15
16
17
18

19 Supplementary Figure 10. Uncropped scans of the Western blots shown in the indicated figures.
20 Supplementary Table 1. Correlations between expression levels of PD-L1, p-egfr (Tyr 1068), p-gsk3β (Ser 9), and granzyme B expression in surgical specimens of breast cancer. No. expression of PD-L1 (%) / + ++ /+++ Total P value / + 26 (45.6%) 28 (25.2%) 54 (32.1%) p-egfr ++ / (54.4%) 83 (74.8%) 114 (67.9%) P = Total 57 (100%) 111 (100%) 168 (100%) / + 27 (42.9%) 4 (5.2%) 31 (22.1%) p-gsk3β ++ / (57.1%) 73 (94.8%) 109 (77.9%) P = Total 63 (100%) 77 (100%) 140 (100%) / + 50 (68.5%) 92 (81.4%) 142 (76.3%) Granzyme B ++ / (31.5%) 21 (18.6%) 44 (23.7%) P = 0.043* Total 73 (100%) 113 (100%) 186 (100%) P, Pearson Chi-Square test; *inverse correlation between PD-L1 and granzyme B. /+, negative or low expression; ++/+++, medium or high expression.
Supplementary Figure 1.TRIM33 binds β-catenin in the nucleus. a & b, Co-IP of endogenous TRIM33 with β-catenin in HT-29 cells (a) and HEK 293T cells
 and HEK 293T cells") Supplementary Figure 1.TRIM33 binds β-catenin in the nucleus. a & b, Co-IP of endogenous TRIM33 with β-catenin in HT-29 cells (a) and HEK 293T cells (b). TRIM33 was immunoprecipitated, and the amount of
Supplementary Figure 1.TRIM33 binds β-catenin in the nucleus. a & b, Co-IP of endogenous TRIM33 with β-catenin in HT-29 cells (a) and HEK 293T cells (b). TRIM33 was immunoprecipitated, and the amount of
RAW264.7 cells stably expressing control shrna (Con) or GSK3b-specific shrna (sh-
 or GSK3b-specific shrna (sh-") 1 a b Supplementary Figure 1. Effects of GSK3b knockdown on poly I:C-induced cytokine production. RAW264.7 cells stably expressing control shrna (Con) or GSK3b-specific shrna (sh- GSK3b) were stimulated
1 a b Supplementary Figure 1. Effects of GSK3b knockdown on poly I:C-induced cytokine production. RAW264.7 cells stably expressing control shrna (Con) or GSK3b-specific shrna (sh- GSK3b) were stimulated
Supplementary Figure 1. Normal T lymphocyte populations in Dapk -/- mice. (a) Normal thymic development in Dapk -/- mice. Thymocytes from WT and Dapk
 Normal thymic development in Dapk -/- mice. Thymocytes from WT and Dapk") Supplementary Figure 1. Normal T lymphocyte populations in Dapk -/- mice. (a) Normal thymic development in Dapk -/- mice. Thymocytes from WT and Dapk -/- mice were stained for expression of CD4 and CD8.
Supplementary Figure 1. Normal T lymphocyte populations in Dapk -/- mice. (a) Normal thymic development in Dapk -/- mice. Thymocytes from WT and Dapk -/- mice were stained for expression of CD4 and CD8.
Supplementary Fig. 1. GPRC5A post-transcriptionally down-regulates EGFR expression. (a) Plot of the changes in steady state mrna levels versus
 Plot of the changes in steady state mrna levels versus") Supplementary Fig. 1. GPRC5A post-transcriptionally down-regulates EGFR expression. (a) Plot of the changes in steady state mrna levels versus changes in corresponding proteins between wild type and Gprc5a-/-
Supplementary Fig. 1. GPRC5A post-transcriptionally down-regulates EGFR expression. (a) Plot of the changes in steady state mrna levels versus changes in corresponding proteins between wild type and Gprc5a-/-
Nature Structural and Molecular Biology: doi: /nsmb Supplementary Figure 1
 Supplementary Figure 1 Mutational analysis of the SA2-Scc1 interaction in vitro and in human cells. (a) Autoradiograph (top) and Coomassie stained gel (bottom) of 35 S-labeled Myc-SA2 proteins (input)
(A) SW480, DLD1, RKO and HCT116 cells were treated with DMSO or XAV939 (5 µm)
 SW480, DLD1, RKO and HCT116 cells were treated with DMSO or XAV939 (5 µm)") Supplementary Figure Legends Figure S1. Tankyrase inhibition suppresses cell proliferation in an axin/β-catenin independent manner. (A) SW480, DLD1, RKO and HCT116 cells were treated with DMSO or XAV939
Supplementary Figure Legends Figure S1. Tankyrase inhibition suppresses cell proliferation in an axin/β-catenin independent manner. (A) SW480, DLD1, RKO and HCT116 cells were treated with DMSO or XAV939
SUPPLEMENTARY INFORMATION
 SUPPLEMENTARY INFORMATION doi:1.138/nature9814 a A SHARPIN FL B SHARPIN ΔNZF C SHARPIN T38L, F39V b His-SHARPIN FL -1xUb -2xUb -4xUb α-his c Linear 4xUb -SHARPIN FL -SHARPIN TF_LV -SHARPINΔNZF -SHARPIN
Supplementary Materials for
 www.sciencesignaling.org/cgi/content/full/8/364/ra18/dc1 Supplementary Materials for The tyrosine phosphatase (Pez) inhibits metastasis by altering protein trafficking Leila Belle, Naveid Ali, Ana Lonic,
(a) Significant biological processes (upper panel) and disease biomarkers (lower panel)
 Significant biological processes (upper panel) and disease biomarkers (lower panel)") Supplementary Figure 1. Functional enrichment analyses of secretomic proteins. (a) Significant biological processes (upper panel) and disease biomarkers (lower panel) 2 involved by hrab37-mediated secretory
Supplementary Figure 1. Functional enrichment analyses of secretomic proteins. (a) Significant biological processes (upper panel) and disease biomarkers (lower panel) 2 involved by hrab37-mediated secretory
Supplementary Figure 1. The CagA-dependent wound healing or transwell migration of gastric cancer cell. AGS cells transfected with vector control or
 Supplementary Figure 1. The CagA-dependent wound healing or transwell migration of gastric cancer cell. AGS cells transfected with vector control or 3xflag-CagA expression vector were wounded using a pipette
Nature Structural & Molecular Biology: doi: /nsmb.3218
 Supplementary Figure 1 Endogenous EGFR trafficking and responses depend on biased ligands. (a) Lysates from HeLa cells stimulated for 2 min. with increasing concentration of ligands were immunoblotted
Supplementary Figure S1 Supplementary Figure S2
 Supplementary Figure S A) The blots shown in Figure B were qualified by using Gel-Pro analyzer software (Rockville, MD, USA). The ratio of LC3II/LC3I to actin was then calculated. The data are represented
293T cells were transfected with indicated expression vectors and the whole-cell extracts were subjected
 SUPPLEMENTARY INFORMATION Supplementary Figure 1. Formation of a complex between Slo1 and CRL4A CRBN E3 ligase. (a) HEK 293T cells were transfected with indicated expression vectors and the whole-cell
Supplemental Figure 1
 Supplemental Figure 1 1a 1c PD-1 MFI fold change 6 5 4 3 2 1 IL-1α IL-2 IL-4 IL-6 IL-1 IL-12 IL-13 IL-15 IL-17 IL-18 IL-21 IL-23 IFN-α Mut Human PD-1 promoter SBE-D 5 -GTCTG- -1.2kb SBE-P -CAGAC- -1.kb
Supplementary Materials for
 www.sciencesignaling.org/cgi/content/full/6/283/ra57/dc1 Supplementary Materials for JNK3 Couples the Neuronal Stress Response to Inhibition of Secretory Trafficking Guang Yang,* Xun Zhou, Jingyan Zhu,
T H E J O U R N A L O F C E L L B I O L O G Y
 T H E J O U R N A L O F C E L L B I O L O G Y Supplemental material Krenn et al., http://www.jcb.org/cgi/content/full/jcb.201110013/dc1 Figure S1. Levels of expressed proteins and demonstration that C-terminal
SUPPLEMENTARY INFORMATION
 Supplementary Table 1. Cell sphingolipids and S1P bound to endogenous TRAF2. Sphingolipid Cell pmol/mg TRAF2 immunoprecipitate pmol/mg Sphingomyelin 4200 ± 250 Not detected Monohexosylceramide 311 ± 18
supplementary information
 DOI: 10.1038/ncb2153 Figure S1 Ectopic expression of HAUSP up-regulates REST protein. (a) Immunoblotting showed that ectopic expression of HAUSP increased REST protein levels in ENStemA NPCs. (b) Immunofluorescent
Predictive PP1Ca binding region in BIG3 : 1,228 1,232aa (-KAVSF-) HEK293T cells *** *** *** KPL-3C cells - E E2 treatment time (h)
 HEK293T cells *** *** *** KPL-3C cells - E E2 treatment time (h)") Relative expression ERE-luciferase activity activity (pmole/min) activity (pmole/min) activity (pmole/min) activity (pmole/min) MCF-7 KPL-3C ZR--1 BT-474 T47D HCC15 KPL-1 HBC4 activity (pmole/min) a d
Relative expression ERE-luciferase activity activity (pmole/min) activity (pmole/min) activity (pmole/min) activity (pmole/min) MCF-7 KPL-3C ZR--1 BT-474 T47D HCC15 KPL-1 HBC4 activity (pmole/min) a d
Supplemental Information
 Supplemental Information Tobacco-specific Carcinogen Induces DNA Methyltransferases 1 Accumulation through AKT/GSK3β/βTrCP/hnRNP-U in Mice and Lung Cancer patients Ruo-Kai Lin, 1 Yi-Shuan Hsieh, 2 Pinpin
SUPPLEMENTARY FIGURES AND TABLE
 SUPPLEMENTARY FIGURES AND TABLE Supplementary Figure S1: Characterization of IRE1α mutants. A. U87-LUC cells were transduced with the lentiviral vector containing the GFP sequence (U87-LUC Tet-ON GFP).
SUPPLEMENTAL FIGURE LEGENDS
 SUPPLEMENTAL FIGURE LEGENDS Supplemental Figure S1: Endogenous interaction between RNF2 and H2AX: Whole cell extracts from 293T were subjected to immunoprecipitation with anti-rnf2 or anti-γ-h2ax antibodies
Type of file: PDF Title of file for HTML: Supplementary Information Description: Supplementary Figures
 Type of file: PDF Title of file for HTML: Supplementary Information Description: Supplementary Figures Type of file: MOV Title of file for HTML: Supplementary Movie 1 Description: NLRP3 is moving along
SUPPLEMENTARY INFORMATION
 DOI: 10.1038/ncb2607 Figure S1 Elf5 loss promotes EMT in mammary epithelium while Elf5 overexpression inhibits TGFβ induced EMT. (a, c) Different confocal slices through the Z stack image. (b, d) 3D rendering
a b G75 G60 Sw-2 Sw-1 Supplementary Figure 1. Structure predictions by I-TASSER Server.
 a b G75 2 2 G60 Sw-2 Sw-1 Supplementary Figure 1. Structure predictions by I-TASSER Server. a. Overlay of top 10 models generated by I-TASSER illustrates the potential effect of 7 amino acid insertion
SUPPLEMENTARY FIGURES
 SUPPLEMENTARY FIGURES Supplementary Figure S1: Fibroblast-induced elongation of cancer cells requires direct contact with living fibroblasts. A. Representative images of HT29-GFP cultured in the presence
Supplementary Figure 1. MAT IIα is Acetylated at Lysine 81.
 IP: Flag a Mascot PTM Modified Mass Error Position Gene Names Score Score Sequence m/z [ppm] 81 MAT2A;AMS2;MATA2 35.6 137.28 _AAVDYQK(ac)VVR_ 595.83-2.28 b Pre-immu After-immu Flag- WT K81R WT K81R / Flag
SUPPLEMENTARY INFORMATION
 SUPPLEMENTARY INFORMATION doi:10.1038/nature11429 S1a 6 7 8 9 Nlrc4 allele S1b Nlrc4 +/+ Nlrc4 +/F Nlrc4 F/F 9 Targeting construct 422 bp 273 bp FRT-neo-gb-PGK-FRT 3x.STOP S1c Nlrc4 +/+ Nlrc4 F/F casp1
Supplementary Figure 1: si-craf but not si-braf sensitizes tumor cells to radiation.
 Supplementary Figure 1: si-craf but not si-braf sensitizes tumor cells to radiation. (a) Embryonic fibroblasts isolated from wildtype (WT), BRAF -/-, or CRAF -/- mice were irradiated (6 Gy) and DNA damage
Nature Immunology doi: /ni.3268
 Supplementary Figure 1 Loss of Mst1 and Mst2 increases susceptibility to bacterial sepsis. (a) H&E staining of colon and kidney sections from wild type and Mst1 -/- Mst2 fl/fl Vav-Cre mice. Scale bar,
SUPPLEMENTARY INFORMATION
 doi:10.1038/nature12652 Supplementary Figure 1. PRDM16 interacts with endogenous EHMT1 in brown adipocytes. Immunoprecipitation of PRDM16 complex by flag antibody (M2) followed by Western blot analysis
Supporting Information. Post translational Modifications of Serotonin Type 4 Receptor Heterologously Expressed in. Mouse Rod Cells
 Supporting Information Post translational Modifications of Serotonin Type 4 Receptor Heterologously Expressed in Mouse Rod Cells David Salom,, Benlian Wang,, Zhiqian Dong, Wenyu Sun, Pius Padayatti, Steven
SUPPLEMENTARY INFORMATION
 DOI: 10.1038/ncb2566 Figure S1 CDKL5 protein expression pattern and localization in mouse brain. (a) Multiple-tissue western blot from a postnatal day (P) 21 mouse probed with an antibody against CDKL5.
Supplementary Materials
 Supplementary Materials Supplementary Figure S1 Regulation of Ubl4A stability by its assembly partner A, The translation rate of Ubl4A is not affected in the absence of Bag6. Control, Bag6 and Ubl4A CRISPR
SUPPLEMENTARY INFORMATION
 doi:10.1038/nature10962 Supplementary Figure 1. Expression of AvrAC-FLAG in protoplasts. Total protein extracted from protoplasts described in Fig. 1a was subjected to anti-flag immunoblot to detect AvrAC-FLAG
(A) Dose response curves of HMLE_shGFP (blue circle), HMLE_shEcad (red square),
 Dose response curves of HMLE_shGFP (blue circle), HMLE_shEcad (red square),") Supplementary Figures and Tables Figure S1. Validation of EMT-selective small molecules (A) Dose response curves of HMLE_shGFP (blue circle), HMLE_shEcad (red square), and HMLE_Twist (black diamond) cells
Supplementary Figures and Tables Figure S1. Validation of EMT-selective small molecules (A) Dose response curves of HMLE_shGFP (blue circle), HMLE_shEcad (red square), and HMLE_Twist (black diamond) cells
Glycosylation analyses of recombinant proteins by LC-ESI mass spectrometry
 Glycosylation analyses of recombinant proteins by LC-ESI mass spectrometry Dr Malin Bäckström Mammalian Protein Expression Core Facility P4EU meeting Porto Nov 11-12, 2013 MPE - A tissue culture facility
Nature Immunology: doi: /ni.3866
 Nature Immunology: doi:10.1038/ni.3866 Supplementary Figure 1 The effect of TIPE2 on chemotaxis. a, The expression of TIPE2 in dhl-60c, dhl-60t, TIPE2-expressing and 15/16Q-expressing dhl-60t neutrophils
Figure S1: Effects on haptotaxis are independent of effects on cell velocity A)
") Supplemental Figures Figure S1: Effects on haptotaxis are independent of effects on cell velocity A) Velocity of MV D7 fibroblasts expressing different GFP-tagged Ena/VASP family proteins in the haptotaxis
Supplemental Figures Figure S1: Effects on haptotaxis are independent of effects on cell velocity A) Velocity of MV D7 fibroblasts expressing different GFP-tagged Ena/VASP family proteins in the haptotaxis
Supplementary Figure 1
 Supplementary Figure 1 YAP negatively regulates IFN- signaling. (a) Immunoblot analysis of Yap knockdown efficiency with sh-yap (#1 to #4 independent constructs) in Raw264.7 cells. (b) IFN- -Luc and PRDs
Tbk1-TKO! DN cells (%)! 15! 10!
! 15! 10!") a! T Cells! TKO! B Cells! TKO! b! CD4! 8.9 85.2 3.4 2.88 CD8! Tbk1-TKO! 1.1 84.8 2.51 2.54 c! DN cells (%)! 4 3 2 1 DP cells (%)! 9 8 7 6 CD4 + SP cells (%)! 5 4 3 2 1 5 TKO! TKO! TKO! TKO! 15 1 5 CD8
a! T Cells! TKO! B Cells! TKO! b! CD4! 8.9 85.2 3.4 2.88 CD8! Tbk1-TKO! 1.1 84.8 2.51 2.54 c! DN cells (%)! 4 3 2 1 DP cells (%)! 9 8 7 6 CD4 + SP cells (%)! 5 4 3 2 1 5 TKO! TKO! TKO! TKO! 15 1 5 CD8
The clathrin adaptor Numb regulates intestinal cholesterol. absorption through dynamic interaction with NPC1L1
 The clathrin adaptor Numb regulates intestinal cholesterol absorption through dynamic interaction with NPC1L1 Pei-Shan Li 1, Zhen-Yan Fu 1,2, Ying-Yu Zhang 1, Jin-Hui Zhang 1, Chen-Qi Xu 1, Yi-Tong Ma
Tel: ; Fax: ;
 Tel.: +98 216 696 9291; Fax: +98 216 696 9291; E-mail: mrasadeghi@pasteur.ac.ir Tel: +98 916 113 7679; Fax: +98 613 333 6380; E-mail: abakhshi_e@ajums.ac.ir A Soluble Chromatin-bound MOI 0 1 5 0 1 5 HDAC2
Supplementary information. MARCH8 inhibits HIV-1 infection by reducing virion incorporation of envelope glycoproteins
 Supplementary information inhibits HIV-1 infection by reducing virion incorporation of envelope glycoproteins Takuya Tada, Yanzhao Zhang, Takayoshi Koyama, Minoru Tobiume, Yasuko Tsunetsugu-Yokota, Shoji
SUPPLEMENTARY INFORMATION
 DOI: 10.1038/ncb3076 Supplementary Figure 1 btrcp targets Cep68 for degradation during mitosis. a) Cep68 immunofluorescence in interphase and metaphase. U-2OS cells were transfected with control sirna
Supplementary Materials
 Supplementary Materials Figure S1. MTT Cell viability assay. To measure the cytotoxic potential of the oxidative treatment, the MTT [3-(4,5-dimethylthiazol- 2-yl)-2,5-diphenyl tetrazolium bromide] assay
LPS LPS P6 - + Supplementary Fig. 1.
 P6 LPS - - - + + + - LPS + + - - P6 + Supplementary Fig. 1. Pharmacological inhibition of the JAK/STAT blocks LPS-induced HMGB1 nuclear translocation. RAW 267.4 cells were stimulated with LPS in the absence
Supplementary fig. 1. Crystals induce necroptosis does not involve caspases, TNF receptor or NLRP3. A. Mouse tubular epithelial cells were pretreated
 Supplementary fig. 1. Crystals induce necroptosis does not involve caspases, TNF receptor or NLRP3. A. Mouse tubular epithelial cells were pretreated with zvad-fmk (10µM) and exposed to calcium oxalate
Supplementary Figure 1
 Supplementary Figure 1 Supplementary Figure 1. Neither the activation nor suppression of the MAPK pathway affects the ASK1/Vif interaction. (a, b) HEK293 cells were cotransfected with plasmids encoding
Supplementary Fig. 1: ATM is phosphorylated in HER2 breast cancer cell lines. (A) ATM is phosphorylated in SKBR3 cells depending on ATM and HER2
 ATM is phosphorylated in SKBR3 cells depending on ATM and HER2") Supplementary Fig. 1: ATM is phosphorylated in HER2 breast cancer cell lines. (A) ATM is phosphorylated in SKBR3 cells depending on ATM and HER2 activity. Upper panel: Representative histograms for FACS
Supplementary Fig. 1: ATM is phosphorylated in HER2 breast cancer cell lines. (A) ATM is phosphorylated in SKBR3 cells depending on ATM and HER2 activity. Upper panel: Representative histograms for FACS
SUPPLEMENTARY INFORMATION
 doi:10.1038/nature11700 Figure 1: RIP3 as a potential Sirt2 interacting protein. Transfected Flag-tagged Sirt2 was immunoprecipitated from cells and eluted from the Sepharose beads using Flag peptide.
William C. Comb, Jessica E. Hutti, Patricia Cogswell, Lewis C. Cantley, and Albert S. Baldwin
 Molecular Cell, Volume 45 Supplemental Information p85 SH2 Domain Phosphorylation by IKK Promotes Feedback Inhibition of PI3K and Akt in Response to Cellular Starvation William C. Comb, Jessica E. Hutti,
Supplementary Table 1. Metabolic parameters in GFP and OGT-treated mice
 Supplementary Table 1. Metabolic parameters in GFP and OGT-treated mice Fasted Refed GFP OGT GFP OGT Liver G6P (mmol/g) 0.03±0.01 0.04±0.02 0.60±0.04 0.42±0.10 A TGs (mg/g of liver) 20.08±5.17 16.29±0.8
(a) Schematic diagram of the FS mutation of UVRAG in exon 8 containing the highly instable
 Schematic diagram of the FS mutation of UVRAG in exon 8 containing the highly instable") Supplementary Figure 1. Frameshift (FS) mutation in UVRAG. (a) Schematic diagram of the FS mutation of UVRAG in exon 8 containing the highly instable A 10 DNA repeat, generating a premature stop codon
Supplementary Figure 1. Frameshift (FS) mutation in UVRAG. (a) Schematic diagram of the FS mutation of UVRAG in exon 8 containing the highly instable A 10 DNA repeat, generating a premature stop codon
Supplementary Figure 1 CD4 + T cells from PKC-θ null mice are defective in NF-κB activation during T cell receptor signaling. CD4 + T cells were
 Supplementary Figure 1 CD4 + T cells from PKC-θ null mice are defective in NF-κB activation during T cell receptor signaling. CD4 + T cells were isolated from wild type (PKC-θ- WT) or PKC-θ null (PKC-θ-KO)
Supplementary Figure 1. PAQR3 knockdown inhibits SREBP-2 processing in CHO-7 cells CHO-7 cells were transfected with control sirna or a sirna
 Supplementary Figure 1. PAQR3 knockdown inhibits SREBP-2 processing in CHO-7 cells CHO-7 cells were transfected with control sirna or a sirna targeted for hamster PAQR3. At 24 h after the transfection,
hexahistidine tagged GRP78 devoid of the KDEL motif (GRP78-His) on SDS-PAGE. This
 on SDS-PAGE. This") SUPPLEMENTAL FIGURE LEGEND Fig. S1. Generation and characterization of. (A) Coomassie staining of soluble hexahistidine tagged GRP78 devoid of the KDEL motif (GRP78-His) on SDS-PAGE. This protein was expressed
SUPPLEMENTAL FIGURE LEGEND Fig. S1. Generation and characterization of. (A) Coomassie staining of soluble hexahistidine tagged GRP78 devoid of the KDEL motif (GRP78-His) on SDS-PAGE. This protein was expressed
Dramatic increase in SHP2 binding activity of Helicobacter. pylori Western CagA by EPIYA-C duplication: its
 Supplementary Information Dramatic increase in SHP2 binding activity of Helicobacter pylori Western CagA by EPIYA-C duplication: its implications in gastric carcinogenesis Lisa Nagase, Takeru Hayashi,
SUPPLEMENTARY INFORMATION
 Figure S1 Induction of non-apoptotic death of SV40-transformed and primary DKO MEFs, and DKO thymocytes. (A-F) STS-induced non-apoptotic death of DKO MEF. (A, B) Reduced viability of DKO MEFs after exposure
Trim29 gene-targeting strategy. (a) Genotyping of wildtype mice (+/+), Trim29 heterozygous mice (+/ ) and homozygous mice ( / ).
 Genotyping of wildtype mice (+/+), Trim29 heterozygous mice (+/ ) and homozygous mice ( / ).") Supplementary Figure 1 Trim29 gene-targeting strategy. (a) Genotyping of wildtype mice (+/+), Trim29 heterozygous mice (+/ ) and homozygous mice ( / ). (b) Immunoblot analysis of TRIM29 in lung primary
Supplementary Figure 1 Trim29 gene-targeting strategy. (a) Genotyping of wildtype mice (+/+), Trim29 heterozygous mice (+/ ) and homozygous mice ( / ). (b) Immunoblot analysis of TRIM29 in lung primary
(a-r) Whole mount X-gal staining on a developmental time-course of hearts from
 Whole mount X-gal staining on a developmental time-course of hearts from") 1 2 3 4 5 6 7 8 9 10 11 12 13 14 15 16 Supplementary Figure 1 (a-r) Whole mount X-gal staining on a developmental time-course of hearts from Sema3d +/- ;Ephb4 LacZ/+ and Sema3d -/- ;Ephb4 LacZ/+ embryos.
1 2 3 4 5 6 7 8 9 10 11 12 13 14 15 16 Supplementary Figure 1 (a-r) Whole mount X-gal staining on a developmental time-course of hearts from Sema3d +/- ;Ephb4 LacZ/+ and Sema3d -/- ;Ephb4 LacZ/+ embryos.
A. Generation and characterization of Ras-expressing autophagycompetent
 Supplemental Material Supplemental Figure Legends Fig. S1 A. Generation and characterization of Ras-expressing autophagycompetent and -deficient cell lines. HA-tagged H-ras V12 was stably expressed in
Supplementary Figure 1. Characterization of NMuMG-ErbB2 and NIC breast cancer cells expressing shrnas targeting LPP. NMuMG-ErbB2 cells (a) and NIC
 and NIC") Supplementary Figure 1. Characterization of NMuMG-ErbB2 and NIC breast cancer cells expressing shrnas targeting LPP. NMuMG-ErbB2 cells (a) and NIC cells (b) were engineered to stably express either a LucA-shRNA
Supplementary Figure 1. Characterization of NMuMG-ErbB2 and NIC breast cancer cells expressing shrnas targeting LPP. NMuMG-ErbB2 cells (a) and NIC cells (b) were engineered to stably express either a LucA-shRNA
S1a S1b S1c. S1d. S1f S1g S1h SUPPLEMENTARY FIGURE 1. - si sc Il17rd Il17ra bp. rig/s IL-17RD (ng) -100 IL-17RD
 -100 IL-17RD") SUPPLEMENTARY FIGURE 1 0 20 50 80 100 IL-17RD (ng) S1a S1b S1c IL-17RD β-actin kda S1d - si sc Il17rd Il17ra rig/s15-574 - 458-361 bp S1f S1g S1h S1i S1j Supplementary Figure 1. Knockdown of IL-17RD enhances
SUPPLEMENTARY FIGURE 1 0 20 50 80 100 IL-17RD (ng) S1a S1b S1c IL-17RD β-actin kda S1d - si sc Il17rd Il17ra rig/s15-574 - 458-361 bp S1f S1g S1h S1i S1j Supplementary Figure 1. Knockdown of IL-17RD enhances
Figure S1. Reduction in glomerular mir-146a levels correlate with progression to higher albuminuria in diabetic patients.
 Supplementary Materials Supplementary Figures Figure S1. Reduction in glomerular mir-146a levels correlate with progression to higher albuminuria in diabetic patients. Figure S2. Expression level of podocyte
human epithelial cells were pretreated with control sirna (50 nm) or GSK-3β sirna (50 nm)
 or GSK-3β sirna (50 nm)") GSK3β facilitates IFNγ signaling Supplementary Figure Legends Figure S1. The effects of inhibiting GSK3β on IFNγinduced TNFα expression. A, A549 human epithelial cells were pretreated with control sirna
GSK3β facilitates IFNγ signaling Supplementary Figure Legends Figure S1. The effects of inhibiting GSK3β on IFNγinduced TNFα expression. A, A549 human epithelial cells were pretreated with control sirna
SUPPLEMENTARY INFORMATION
 DOI:.38/ncb2822 a MTC02 FAO cells EEA1 b +/+ MEFs /DAPI -/- MEFs /DAPI -/- MEFs //DAPI c HEK 293 cells WCE N M C P AKT TBC1D7 Lamin A/C EEA1 VDAC d HeLa cells WCE N M C P AKT Lamin A/C EEA1 VDAC Figure
Supplementary Figure 1. Spatial distribution of LRP5 and β-catenin in intact cardiomyocytes. (a) and (b) Immunofluorescence staining of endogenous
 and (b) Immunofluorescence staining of endogenous") Supplementary Figure 1. Spatial distribution of LRP5 and β-catenin in intact cardiomyocytes. (a) and (b) Immunofluorescence staining of endogenous LRP5 in intact adult mouse ventricular myocytes (AMVMs)
Supplementary Figure 1. Spatial distribution of LRP5 and β-catenin in intact cardiomyocytes. (a) and (b) Immunofluorescence staining of endogenous LRP5 in intact adult mouse ventricular myocytes (AMVMs)
Supplementary Information
 Supplementary Information mediates STAT3 activation at retromer-positive structures to promote colitis and colitis-associated carcinogenesis Zhang et al. a b d e g h Rel. Luc. Act. Rel. mrna Rel. mrna
Supporting Information. FADD regulates NF-кB activation and promotes ubiquitination of cflip L to induce. apoptosis
 1 2 Supporting Information 3 4 5 FADD regulates NF-кB activation and promotes ubiquitination of cflip L to induce apoptosis 6 7 Kishu Ranjan and Chandramani Pathak* 8 9 Department of Cell Biology, School
Supplementary Figure 1
 Supplementary Figure 1 a γ-h2ax MDC1 RNF8 FK2 BRCA1 U2OS Cells sgrna-1 ** 60 sgrna 40 20 0 % positive Cells (>5 foci per cell) b ** 80 sgrna sgrna γ-h2ax MDC1 γ-h2ax RNF8 FK2 MDC1 BRCA1 RNF8 FK2 BRCA1
(A) RT-PCR for components of the Shh/Gli pathway in normal fetus cell (MRC-5) and a
 RT-PCR for components of the Shh/Gli pathway in normal fetus cell (MRC-5) and a") Supplementary figure legends Supplementary Figure 1. Expression of Shh signaling components in a panel of gastric cancer. (A) RT-PCR for components of the Shh/Gli pathway in normal fetus cell (MRC-5) and
Supplementary figure legends Supplementary Figure 1. Expression of Shh signaling components in a panel of gastric cancer. (A) RT-PCR for components of the Shh/Gli pathway in normal fetus cell (MRC-5) and
Fig. S1. Subcellular localization of overexpressed LPP3wt-GFP in COS-7 and HeLa cells. Cos7 (top) and HeLa (bottom) cells expressing for 24 h human
 and HeLa (bottom) cells expressing for 24 h human") Fig. S1. Subcellular localization of overexpressed LPP3wt-GFP in COS-7 and HeLa cells. Cos7 (top) and HeLa (bottom) cells expressing for 24 h human LPP3wt-GFP, fixed and stained for GM130 (A) or Golgi97
Fig. S1. Subcellular localization of overexpressed LPP3wt-GFP in COS-7 and HeLa cells. Cos7 (top) and HeLa (bottom) cells expressing for 24 h human LPP3wt-GFP, fixed and stained for GM130 (A) or Golgi97
Prolonged mitotic arrest induces a caspase-dependent DNA damage
 SUPPLEMENTARY INFORMATION Prolonged mitotic arrest induces a caspase-dependent DNA damage response at telomeres that determines cell survival Karolina O. Hain, Didier J. Colin, Shubhra Rastogi, Lindsey
Supplementary Figures
 Supplementary Figures Supplementary Figure 1 DOT1L regulates the expression of epithelial and mesenchymal markers. (a) The expression levels and cellular localizations of EMT markers were confirmed by
Nature Immunology: doi: /ni.3631
 Supplementary Figure 1 SPT analyses of Zap70 at the T cell plasma membrane. (a) Total internal reflection fluorescent (TIRF) excitation at 64-68 degrees limits single molecule detection to 100-150 nm above
SUPPLEMENTARY INFORMATION
 doi: 10.1038/nature05732 SUPPLEMENTARY INFORMATION Supplemental Data Supplement Figure Legends Figure S1. RIG-I 2CARD undergo robust ubiquitination a, (top) At 48 h posttransfection with a GST, GST-RIG-I-2CARD
Supplementary Figure 1. Characterization of ALDH-positive cell population in MCF-7 cells. (a) Expression level of stem cell markers in MCF-7 cells or
 Expression level of stem cell markers in MCF-7 cells or") Supplementary Figure 1. Characterization of ALDH-positive cell population in MCF-7 cells. (a) Expression level of stem cell markers in MCF-7 cells or ALDH-positive cell population by qpcr. Data represent
Supplementary Figure 1. Characterization of ALDH-positive cell population in MCF-7 cells. (a) Expression level of stem cell markers in MCF-7 cells or ALDH-positive cell population by qpcr. Data represent
A. List of selected proteins with high SILAC (H/L) ratios identified in mass
 ratios identified in mass") Supplementary material Figure S1. Interaction between UBL5 and FANCI A. List of selected proteins with high SILAC (H/L) ratios identified in mass spectrometry (MS)-based analysis of UBL5-interacting proteins,
Supplementary material Figure S1. Interaction between UBL5 and FANCI A. List of selected proteins with high SILAC (H/L) ratios identified in mass spectrometry (MS)-based analysis of UBL5-interacting proteins,
Supplementary Figure 1
 Supplementary Figure 1 Supplementary Figure 1 Schematic depiction of the tandem Fc GDF15. Supplementary Figure 2 Supplementary Figure 2 Gfral mrna levels in the brains of both wild-type and knockout Gfral
Supplementary Information Supplementary Fig. 1. Elevated Usp9x in melanoma and NRAS mutant melanoma cells are dependent on NRAS for 3D growth.
 Supplementary Information Supplementary Fig. 1. Elevated Usp9x in melanoma and NRAS mutant melanoma cells are dependent on NRAS for 3D growth. a. Immunoblot for Usp9x protein in NRAS mutant melanoma cells
Supplemental information
 Carcinoemryonic antigen-related cell adhesion molecule 6 (CEACAM6) promotes EGF receptor signaling of oral squamous cell carcinoma metastasis via the complex N-glycosylation y Chiang et al. Supplemental
Supplementary Material
 Supplementary Material accompanying the manuscript Interleukin 37 is a fundamental inhibitor of innate immunity Marcel F Nold, Claudia A Nold-Petry, Jarod A Zepp, Brent E Palmer, Philip Bufler & Charles
Supplementary Figure 1: Co-localization of reconstituted L-PTC and dendritic cells
 a CD11c Na + K + ATPase Na + K + ATPase CD11c x-y CD11c Na + K + ATPase Na + K + ATPase CD11c x-z c b x-y view BoNT NAPs CD11c BoNT CD11c NAPs BoNT NAPs CD11c 90 x-z view Apical Basolateral Supplementary
(B D) Three views of the final refined 2Fo-Fc electron density map of the Vpr (red)-ung2 (green) interacting region, contoured at 1.4σ.
 Three views of the final refined 2Fo-Fc electron density map of the Vpr (red)-ung2 (green) interacting region, contoured at 1.4σ.") Supplementary Figure 1 Overall structure of the DDB1 DCAF1 Vpr UNG2 complex. (A) The final refined 2Fo-Fc electron density map, contoured at 1.4σ of Vpr, illustrating well-defined side chains. (B D) Three
Supplementary Figure 1 Overall structure of the DDB1 DCAF1 Vpr UNG2 complex. (A) The final refined 2Fo-Fc electron density map, contoured at 1.4σ of Vpr, illustrating well-defined side chains. (B D) Three
supplementary information
 DOI: 10.1038/ncb1875 Figure S1 (a) The 79 surgical specimens from NSCLC patients were analysed by immunohistochemistry with an anti-p53 antibody and control serum (data not shown). The normal bronchi served
Intracellular MHC class II molecules promote TLR-triggered innate. immune responses by maintaining Btk activation
 Intracellular MHC class II molecules promote TLR-triggered innate immune responses by maintaining Btk activation Xingguang Liu, Zhenzhen Zhan, Dong Li, Li Xu, Feng Ma, Peng Zhang, Hangping Yao and Xuetao
Supplementary Figure 1
 Supplementary Figure 1 Constitutive EGFR signaling does not activate canonical EGFR signals (a) U251EGFRInd cells with or without tetracycline exposure (24h, 1µg/ml) were treated with EGF for 15 minutes
SUPPLEMENTARY INFORMATION
 doi:10.1038/nature11095 Supplementary Table 1. Summary of the binding between Angptls and various Igdomain containing receptors as determined by flow cytometry analysis. The results were summarized from
Supplementary Materials for
 www.sciencesignaling.org/cgi/content/full/9/439/ra78/dc1 Supplementary Materials for Small heterodimer partner mediates liver X receptor (LXR) dependent suppression of inflammatory signaling by promoting
Supplementary Figure 1. Prevalence of U539C and G540A nucleotide and E172K amino acid substitutions among H9N2 viruses. Full-length H9N2 NS
 Supplementary Figure 1. Prevalence of U539C and G540A nucleotide and E172K amino acid substitutions among H9N2 viruses. Full-length H9N2 NS nucleotide sequences (a, b) or amino acid sequences (c) from
File Name: Supplementary Information Description: Supplementary Figures and Supplementary Tables. File Name: Peer Review File Description:
 File Name: Supplementary Information Description: Supplementary Figures and Supplementary Tables File Name: Peer Review File Description: Primer Name Sequence (5'-3') AT ( C) RT-PCR USP21 F 5'-TTCCCATGGCTCCTTCCACATGAT-3'
Supplementary Materials for
 www.sciencesignaling.org/cgi/content/full/8/398/rs12/dc1 Supplementary Materials for Quantitative phosphoproteomics reveals new roles for the protein phosphatase PP6 in mitotic cells Scott F. Rusin, Kate
Supplementary Figure 1. Quantile-quantile (Q-Q) plots. (Panel A) Q-Q plot graphical
 plots. (Panel A) Q-Q plot graphical") Supplementary Figure 1. Quantile-quantile (Q-Q) plots. (Panel A) Q-Q plot graphical representation using all SNPs (n= 13,515,798) including the region on chromosome 1 including SORT1 which was previously
Supplementary Figure 1. Quantile-quantile (Q-Q) plots. (Panel A) Q-Q plot graphical representation using all SNPs (n= 13,515,798) including the region on chromosome 1 including SORT1 which was previously
Mammalian-type Glycosylation l in LEXSY
 Mammalian-type Glycosylation l in LEXSY Case Study: Recombinant hu Erythropoietin Jena Bioscience GmbH Loebstedter Str. 80 07749 Jena, Germany Tel.: +49-3641-628-5000 Fax: +49-3641-628-5100 628 e-mail:
Supplementary Figure S1
 Supplementary Figure S1 Supplementary Figure S1. PARP localization patterns using GFP-PARP and PARP-specific antibody libraries GFP-PARP localization in non-fixed (A) and formaldehyde fixed (B) GFP-PARPx
EGFR shrna A: CCGGCGCAAGTGTAAGAAGTGCGAACTCGAGTTCGCACTTCTTACACTTGCG TTTTTG. EGFR shrna B: CCGGAGAATGTGGAATACCTAAGGCTCGAGCCTTAGGTATTCCACATTCTCTT TTTG
 Supplementary Methods Sequence of oligonucleotides used for shrna targeting EGFR EGFR shrna were obtained from the Harvard RNAi consortium. The following oligonucleotides (forward primer) were used to
m 6 A mrna methylation regulates AKT activity to promote the proliferation and tumorigenicity of endometrial cancer
 SUPPLEMENTARY INFORMATION Articles https://doi.org/10.1038/s41556-018-0174-4 In the format provided by the authors and unedited. m 6 A mrna methylation regulates AKT activity to promote the proliferation
HEK293FT cells were transiently transfected with reporters, N3-ICD construct and
 Supplementary Information Luciferase reporter assay HEK293FT cells were transiently transfected with reporters, N3-ICD construct and increased amounts of wild type or kinase inactive EGFR. Transfections
SUPPLEMENTARY FIGURE LEGENDS
 SUPPLEMENTARY FIGURE LEGENDS Supplemental FIG. 1. Localization of myosin Vb in cultured neurons varies with maturation stage. A and B, localization of myosin Vb in cultured hippocampal neurons. A, in DIV