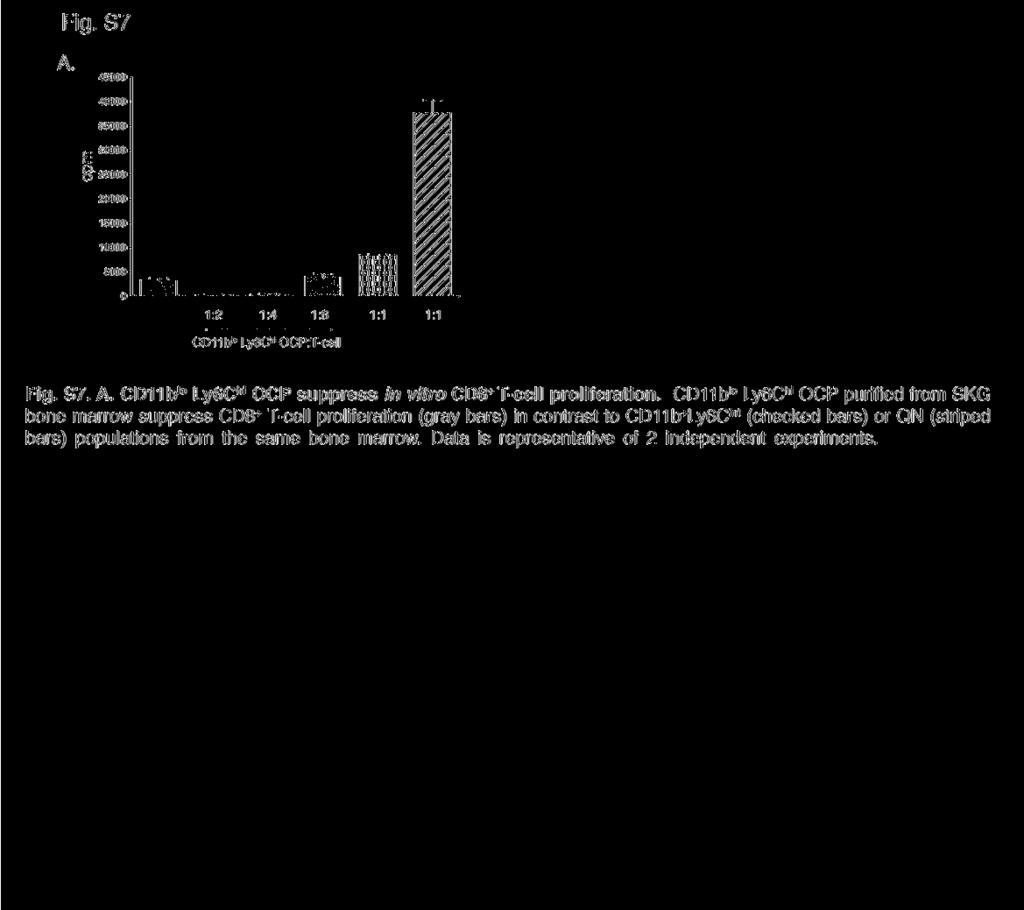
Fig. S1 A. week 4 week 6
|
|
|
- Opal Jordan
- 6 years ago
- Views:
Transcription
1 Fig. S1 Trabecular Number Trabecular Thickness number/mm mm SKG-c SKG-A mm Trabecular Spacing D. week 4 week 6 Figure S1. MicroCT analysis of SKG mice shows significant changes in proximal tibia trabecular parameter consistent with osteopenia. SKG mice at 14 weeks arthritis (SKG-A, gray bars), are compared to healthy litter mate controls (SKG-c, black bars). (A) Trabecular number and (B) trabecular thickness are significantly decreased, and (C) trabecular spacing is correspondingly increased in arthritic mice, p.4 for all comparisons, Student s t-test. Osteoclast resorptive activity measured by serum c-telopeptide (CTX) produciton is increased at 4 and 6 weeks after zymosan injection, n=5 per group (D).
 or from healthy SKG littermates (SKG-c), mononuclear cells were isolated by Ficoll gradeint")

2 Fig. S2 SKG-c SKG-A % total BM p=.18 SKG-c SKG-A TRAP+ MN cells/well - Ly6Chi lo Ly6Chi Figure S2. Peripheral OC differentiation increases in SKG Arthritis. Peripheral blood cells were collected from SKG mice 8 weeks after induction of arthritis (SKG-A) or from healthy SKG littermates (SKG-c), mononuclear cells were isolated by Ficoll gradeint centrifugation and plated at 1x15 cells/ well in 96 well plates in 5% CMG and 25ng/mL RANKL and cultured for 7 days. Results are representative of 2 independent experiments. -/lo Ly6Chi bone marrow increase as early as 1 week after zymosan induction of arthritis. and Ly6C staining of B22-CD3Ter119- gated bone marrow from mice 1 week after zymosan injection (SKG-A) or control PBS injected mice (SKG-c) demonstrates increased, n=5. Results are representative of 3 independent experiments. OC precursor activity is found in both the - and hi Ly6Chi bone marrow cells. The bone marrow CD45R- CD3- -/lo Ly6Chi population was further subdivided into - and lo cells and purified by fluorescence activated cell sorting. Triplicate wells
3 Fig. S3.2 SKG/SKG SKG/wt wt/wt.15 BV/TV BV/TV mm Figure S3. Female SKG mice are osteopenic compared to heterozygous and wild-type litermates. MicroCT analysis of week old female mice from SKG het x SKG het parents shows trabecular osteopenia of SKG/SKG mice (light gray bars, n=6) compared to SKG het (dark gray bars, n=3) and wild-type mice (black bars, n=5) at both (A) proximal tibia and (B) distal femur, p.5, p.2, Student s t-test. (C) Cortical thickness, however, is not signficantly changed at this age.
 + Ly6C hi (99%) + Ly6C int (98%) C57BL/6 (98%) 1 3 1 2 1 1 1.")

 BALB/c (12.5X1 3 cells/well) (B) C57BL/6 mice (2.")
4 Fig. S4 1 4 BALB/c CD3 - B22 - Ter119 - BALB/c % Ly6C C57BL/6 CD3 - B22 - Ter119 - input -/lo Ly6C hi (98%) + Ly6C hi (99%) + Ly6C int (98%) C57BL/6 (98%) % Ly6C TNF-Tg CD3 - B22 - Ter119 - input -/lo Ly6C hi (97%) + Ly6C hi (94%) + Ly6C int (96%) TNF-Tg (99%) % D. 1.1 x1 6 /femur Ly6C input -/lo Ly6C hi (99%) + Ly6C hi (97%) + Ly6C int (95%) (97%) C57BL/6 TNF-Tg Fig. S4. -/lo Ly6C hi are the primary osteoclast precursor population independent of strain. Representative dot plots of and Ly6C stained CD3 - B22 - Ter119 - bone marrow and multinucleated TRAP + cells cultured from individual bone marrow populations plated in triplicate for 3-4d in MCSF and 25ng/mL RANKL demonstrates that -/lo Ly6C hi cells are also the primary osteclast precursors in (A) BALB/c (12.5X1 3 cells/well) (B) C57BL/6 mice (2.5X1 3 cells/well) and (C) 2 week old TNF-Tg mice with arthritis (2.5X1 3 cells/well). The percent of in total bone marrow is noted on the dot plot, and the purity of each sorted population is stated in parenthesis on the x-axis of the graph panel. Results are representative of 2 or more replicates. (D) The number of bone marrow is significantly increased in arthritic TNF-Tg mice compared to age matched wild-type controls, p=.3.

 In the presence of MCSF, sorted -/lo Ly6C hi CD117 + differentiate into hi F4/8 + macrophages with phagocytic activity.")
 -derived macrophages phagocytose Alexa-488 labelled zymosan A and become Alex-488+ (solid line) compared to untreated cells (solid gray); uptake is blocked by preincubation with cytochalasin D")
5 Fig. S5 -/lo Ly6C hi d8 MCSF culture % of max F4/ Alexa-488 D /lo Ly6C hi d8 GMCSF culture E. F. Ter119 - CD3 - B22 - -/lo Ly6C hi CD11c 1 2 FL2-H: FL2-CD11c 1 1 Ki isotype G MHCII I-A/E H. 5 p=.3 cpm lo Ly6C hi CX3CR1 + lo Ly6C h i CX3CR1 neg control 5 μm HU Figure S5. -/lo Ly6C hi CD117 + are multipotent in vitro and like circulating are predominantly quiescent. (A-C) In the presence of MCSF, sorted -/lo Ly6C hi CD117 + differentiate into hi F4/8 + macrophages with phagocytic activity. (A) After 8d culture in MCSF, -derived cells are essentially all hi F4/8 +. (B) -derived macrophages phagocytose Alexa-488 labelled zymosan A and become Alex-488+ (solid line) compared to untreated cells (solid gray); uptake is blocked by preincubation with cytochalasin D (dashed line). (C) -derived macrophages from (B) stained with rhodamine-phalloidin demonstrating intracellular Alexa-488 zymosan A particles, 2X. (D-E) Sorted -/lo Ly6C hi CD117 + differentiate into CD11c + dendritic cells in the presence of GMCSF. (D) cultured in GMCSF for 8d and stimulated with LPS for 4h differnentiate into CD11c + cells that express MHCII + in response to LPS. (E) Rhodamine-phalloidin staining of the cells in (D) demonstrates typical dendritic mophology, 2X. (F) Staining for Ki-67 demonstrates that the -/lo Ly6C hi population is predominantly quiescent on isolation. (G) 3 H thymidine uptake shows that -/lo Ly6C hi CX 3 CR1 + proliferate in response to MCSF in contrast to the CX 3 CR1 - subpopulation. (H) Treatment with (HU) hydroxyurea greatly reduces TRAP + multinucleated OC differentition from -/lo Ly6C hi, suggesting that proliferation is required for OC differentiation from bone marrow.

 IL-17 producing lymp node T-cells are decreased in the group, but serum IL-17 levels are unchanged (data not shown), (D) Co-transfer of significantly exacerbates inflammatory skin lesions")
6 Fig. S6 serum CTX lymph node T-cells 5 ng/ml % IL serum TNFα skin score D. 7.5 serum IL-1β 15 pg/ml pg/ml 35 serum IL pg/ml CD4 + E Figure S6. Co-adoptive transfer of -/lo Ly6Chi does not alter serum CTX, nor decrease inflammatory cytokines. (A) Serum CTX measuered by ELIS (B) Despite amelioration of inflammatory arthritis, serum levels of TNFα, IL-6 and IL-1 are not significantly reduced in mice receiving co-adoptive transfer of. (C) IL-17 producing lymp node T-cells are decreased in the group, but serum IL-17 levels are unchanged (data not shown), (D) Co-transfer of significantly exacerbates inflammatory skin lesions compared to adoptive transfer of SKG T-cells alone, p=.3 Student s t-test. The Treg group had no skin abnormalities. (E) Represenative images of skin pathology shows shows acanthosis, hyperkeratosis and dermal infiltrates that are more pronounced in the group comparted to the group. H&E stain, 4X.
7
Inflammatory arthritis increases mouse osteoclast precursors with myeloid suppressor function
 Inflammatory arthritis increases mouse osteoclast precursors with myeloid suppressor function Julia F. Charles,, Antonios O. Aliprantis, Mary C. Nakamura J Clin Invest. 2012;122(12):4592-4605. https://doi.org/10.1172/jci60920.
Supplementary Figure 1. Characterization of basophils after reconstitution of SCID mice
 Supplementary figure legends Supplementary Figure 1. Characterization of after reconstitution of SCID mice with CD4 + CD62L + T cells. (A-C) SCID mice (n = 6 / group) were reconstituted with 2 x 1 6 CD4
Inflammatory arthritis increases mouse osteoclast precursors with myeloid suppressor function
 Research article Inflammatory arthritis increases mouse osteoclast precursors with myeloid suppressor function Julia F. Charles, 1,2,3 Lih-Yun Hsu, 1 Erene C. Niemi, 1,2 Arthur Weiss, 1,4 Antonios O. Aliprantis,
Supplementary Information. Tissue-wide immunity against Leishmania. through collective production of nitric oxide
 Supplementary Information Tissue-wide immunity against Leishmania through collective production of nitric oxide Romain Olekhnovitch, Bernhard Ryffel, Andreas J. Müller and Philippe Bousso Supplementary
B220 CD4 CD8. Figure 1. Confocal Image of Sensitized HLN. Representative image of a sensitized HLN
 B220 CD4 CD8 Natarajan et al., unpublished data Figure 1. Confocal Image of Sensitized HLN. Representative image of a sensitized HLN showing B cell follicles and T cell areas. 20 µm thick. Image of magnification
Supplementary Figure 1. mrna expression of chitinase and chitinase-like protein in splenic immune cells. Each splenic immune cell population was
 Supplementary Figure 1. mrna expression of chitinase and chitinase-like protein in splenic immune cells. Each splenic immune cell population was sorted by FACS. Surface markers for sorting were CD11c +
% of live splenocytes. STAT5 deletion. (open shapes) % ROSA + % floxed
 % ROSA + % floxed") Supp. Figure 1. a 14 1 1 8 6 spleen cells (x1 6 ) 16 % of live splenocytes 5 4 3 1 % of live splenocytes 8 6 4 b 1 1 c % of CD11c + splenocytes (closed shapes) 8 6 4 8 6 4 % ROSA + (open shapes) % floxed
Supp. Figure 1. a 14 1 1 8 6 spleen cells (x1 6 ) 16 % of live splenocytes 5 4 3 1 % of live splenocytes 8 6 4 b 1 1 c % of CD11c + splenocytes (closed shapes) 8 6 4 8 6 4 % ROSA + (open shapes) % floxed
Supporting Information
 Supporting Information Desnues et al. 10.1073/pnas.1314121111 SI Materials and Methods Mice. Toll-like receptor (TLR)8 / and TLR9 / mice were generated as described previously (1, 2). TLR9 / mice were
SUPPLEMENTARY INFORMATION
 doi:1.138/nature1554 a TNF-α + in CD4 + cells [%] 1 GF SPF 6 b IL-1 + in CD4 + cells [%] 5 4 3 2 1 Supplementary Figure 1. Effect of microbiota on cytokine profiles of T cells in GALT. Frequencies of TNF-α
Suppl Video: Tumor cells (green) and monocytes (white) are seeded on a confluent endothelial
 and monocytes (white) are seeded on a confluent endothelial") Supplementary Information Häuselmann et al. Monocyte induction of E-selectin-mediated endothelial activation releases VE-cadherin junctions to promote tumor cell extravasation in the metastasis cascade
Supplementary Information Häuselmann et al. Monocyte induction of E-selectin-mediated endothelial activation releases VE-cadherin junctions to promote tumor cell extravasation in the metastasis cascade
Cell isolation. Spleen and lymph nodes (axillary, inguinal) were removed from mice
 were removed from mice") Supplementary Methods: Cell isolation. Spleen and lymph nodes (axillary, inguinal) were removed from mice and gently meshed in DMEM containing 10% FBS to prepare for single cell suspensions. CD4 + CD25
Supplementary Methods: Cell isolation. Spleen and lymph nodes (axillary, inguinal) were removed from mice and gently meshed in DMEM containing 10% FBS to prepare for single cell suspensions. CD4 + CD25
Nature Medicine: doi: /nm.2109
 HIV 1 Infects Multipotent Progenitor Cells Causing Cell Death and Establishing Latent Cellular Reservoirs Christoph C. Carter, Adewunmi Onafuwa Nuga, Lucy A. M c Namara, James Riddell IV, Dale Bixby, Michael
Supplementary Materials for
 www.sciencesignaling.org/cgi/content/full/3/114/ra23/dc1 Supplementary Materials for Regulation of Zap70 Expression During Thymocyte Development Enables Temporal Separation of CD4 and CD8 Repertoire Selection
Supplementary Figure 1. IL-12 serum levels and frequency of subsets in FL patients. (A) IL-12
 IL-12") 1 Supplementary Data Figure legends Supplementary Figure 1. IL-12 serum levels and frequency of subsets in FL patients. (A) IL-12 serum levels measured by multiplex ELISA (Luminex) in FL patients before
1 Supplementary Data Figure legends Supplementary Figure 1. IL-12 serum levels and frequency of subsets in FL patients. (A) IL-12 serum levels measured by multiplex ELISA (Luminex) in FL patients before
CD4 + T cells recovered in Rag2 / recipient ( 10 5 ) Heart Lung Pancreas
 Heart Lung Pancreas") a CD4 + T cells recovered in Rag2 / recipient ( 1 5 ) Heart Lung Pancreas.5 1 2 4 6 2 4 6 Ctla4 +/+ Ctla4 / Ctla4 / Lung Ctla4 / Pancreas b Heart Lung Pancreas Ctla4 +/+ Ctla4 / Ctla4 / Lung Ctla4 / Pancreas
a CD4 + T cells recovered in Rag2 / recipient ( 1 5 ) Heart Lung Pancreas.5 1 2 4 6 2 4 6 Ctla4 +/+ Ctla4 / Ctla4 / Lung Ctla4 / Pancreas b Heart Lung Pancreas Ctla4 +/+ Ctla4 / Ctla4 / Lung Ctla4 / Pancreas
SUPPLEMENTARY INFORMATION
 doi:10.1038/nature10134 Supplementary Figure 1. Anti-inflammatory activity of sfc. a, Autoantibody immune complexes crosslink activating Fc receptors, promoting activation of macrophages, and WWW.NATURE.COM/NATURE
SUPPLEMENTARY INFORMATION
 doi: 1.138/nature775 4 O.D. (595-655) 3 1 -ζ no antibody isotype ctrl Plated Soluble 1F6 397 7H11 Supplementary Figure 1 Soluble and plated anti- Abs induce -! signalling. B3Z cells stably expressing!
Supplementary Fig. 1 p38 MAPK negatively regulates DC differentiation. (a) Western blot analysis of p38 isoform expression in BM cells, immature DCs
 Western blot analysis of p38 isoform expression in BM cells, immature DCs") Supplementary Fig. 1 p38 MAPK negatively regulates DC differentiation. (a) Western blot analysis of p38 isoform expression in BM cells, immature DCs (idcs) and mature DCs (mdcs). A myeloma cell line expressing
Supplementary Fig. 1 p38 MAPK negatively regulates DC differentiation. (a) Western blot analysis of p38 isoform expression in BM cells, immature DCs (idcs) and mature DCs (mdcs). A myeloma cell line expressing
L1 on PyMT tumor cells but Py117 cells are more responsive to IFN-γ. (A) Flow
 Flow") A MHCI B PD-L1 Fold expression 8 6 4 2 Fold expression 3 2 1 No tx 1Gy 2Gy IFN Py117 Py117 Supplementary Figure 1. Radiation and IFN-γ enhance MHCI expression and PD- L1 on PyMT tumor cells but Py117 cells
A MHCI B PD-L1 Fold expression 8 6 4 2 Fold expression 3 2 1 No tx 1Gy 2Gy IFN Py117 Py117 Supplementary Figure 1. Radiation and IFN-γ enhance MHCI expression and PD- L1 on PyMT tumor cells but Py117 cells
Hua Tang, Weiping Cao, Sudhir Pai Kasturi, Rajesh Ravindran, Helder I Nakaya, Kousik
 SUPPLEMENTARY FIGURES 1-19 T H 2 response to cysteine-proteases requires dendritic cell-basophil cooperation via ROS mediated signaling Hua Tang, Weiping Cao, Sudhir Pai Kasturi, Rajesh Ravindran, Helder
Supplementary Figures
 Inhibition of Pulmonary Anti Bacterial Defense by IFN γ During Recovery from Influenza Infection By Keer Sun and Dennis W. Metzger Supplementary Figures d a Ly6G Percentage survival f 1 75 5 1 25 1 5 1
Supplementary Figure 1 Chemokine and chemokine receptor expression during muscle regeneration (a) Analysis of CR3CR1 mrna expression by real time-pcr
 Analysis of CR3CR1 mrna expression by real time-pcr") Supplementary Figure 1 Chemokine and chemokine receptor expression during muscle regeneration (a) Analysis of CR3CR1 mrna expression by real time-pcr at day 0, 1, 4, 10 and 21 post- muscle injury. (b)
Supplementary Figure 1 Chemokine and chemokine receptor expression during muscle regeneration (a) Analysis of CR3CR1 mrna expression by real time-pcr at day 0, 1, 4, 10 and 21 post- muscle injury. (b)
The encephalitogenicity of TH17 cells is dependent on IL-1- and IL-23- induced production of the cytokine GM-CSF
 CORRECTION NOTICE Nat.Immunol. 12, 568 575 (2011) The encephalitogenicity of TH17 cells is dependent on IL-1- and IL-23- induced production of the cytokine GM-CSF Mohamed El-Behi, Bogoljub Ciric, Hong
Supplemental Information. Aryl Hydrocarbon Receptor Controls. Monocyte Differentiation. into Dendritic Cells versus Macrophages
 Immunity, Volume 47 Supplemental Information Aryl Hydrocarbon Receptor Controls Monocyte Differentiation into Dendritic Cells versus Macrophages Christel Goudot, Alice Coillard, Alexandra-Chloé Villani,
Nature Immunology: doi: /ni Supplementary Figure 1. Examples of staining for each antibody used for the mass cytometry analysis.
 Supplementary Figure 1 Examples of staining for each antibody used for the mass cytometry analysis. To illustrate the functionality of each antibody probe, representative plots illustrating the expected
Supplemental Information. CD4 + CD25 + Foxp3 + Regulatory T Cells Promote. Th17 Cells In Vitro and Enhance Host Resistance
 Immunity, Volume 34 Supplemental Information D4 + D25 + + Regulatory T ells Promote Th17 ells In Vitro and Enhance Host Resistance in Mouse andida albicans Th17 ell Infection Model Pushpa Pandiyan, Heather
SUPPLEMENTARY INFORMATION
 1. Supplementary Figures and Legends Supplementary Fig. 1. S1P-mediated transcriptional regulation of integrins expressed in OP/monocytoid cells. Real-time quantitative PCR analyses of mrna for two integrins,
Supplemental Figure Legends
 Supplemental Figure Legends Supplemental Figure 1. SemaB / mice have normal immune cell populations. Cells were prepared from the spleens of WT and SemaB / mice, stained with various antibodies and then
Blocking antibodies and peptides. Rat anti-mouse PD-1 (29F.1A12, rat IgG2a, k), PD-
, PD-") Supplementary Methods Blocking antibodies and peptides. Rat anti-mouse PD-1 (29F.1A12, rat IgG2a, k), PD- L1 (10F.9G2, rat IgG2b, k), and PD-L2 (3.2, mouse IgG1) have been described (24). Anti-CTLA-4 (clone
Supplementary Methods Blocking antibodies and peptides. Rat anti-mouse PD-1 (29F.1A12, rat IgG2a, k), PD- L1 (10F.9G2, rat IgG2b, k), and PD-L2 (3.2, mouse IgG1) have been described (24). Anti-CTLA-4 (clone
Siglec-15 Is A Potential Therapeutic Target For Postmenopausal Osteoporosis
 Siglec-15 Is A Potential Therapeutic Target For Postmenopausal Osteoporosis Yusuke Kameda, Masahiko Takahata, Tomohiro Shimizu, Hiroki Hamano, Norimasa Iwasaki. Department of Orthopedic Surgery, Hokkaido
Supplementary Figure 1 Protease allergens induce IgE and IgG1 production. (a-c)
") 1 Supplementary Figure 1 Protease allergens induce IgE and IgG1 production. (a-c) Serum IgG1 (a), IgM (b) and IgG2 (c) concentrations in response to papain immediately before primary immunization (day
1 Supplementary Figure 1 Protease allergens induce IgE and IgG1 production. (a-c) Serum IgG1 (a), IgM (b) and IgG2 (c) concentrations in response to papain immediately before primary immunization (day
Supplemental Figure 1
 Supplemental Figure 1 1a 1c PD-1 MFI fold change 6 5 4 3 2 1 IL-1α IL-2 IL-4 IL-6 IL-1 IL-12 IL-13 IL-15 IL-17 IL-18 IL-21 IL-23 IFN-α Mut Human PD-1 promoter SBE-D 5 -GTCTG- -1.2kb SBE-P -CAGAC- -1.kb
Supplementary Figure 1 Maschalidi et al.
 a 1% 5% % 1% 5% % OVAb βgal activity A.U. (x1 4 ) 2 1 5 βgal activity A.U. (x1 4 ) 2 1 BSAb 2 hours 4 hours OVAb BSAb OVAb BSAb,1 1 1 1 SIINFEKL (ng/ml) CFSE b Beads Alexa488 (%) 8 6 4 2 ** ** 1:1 5:1
Supplementary Figure S1. PTPN2 levels are not altered in proliferating CD8+ T cells. Lymph node (LN) CD8+ T cells from C57BL/6 mice were stained with
 CD8+ T cells from C57BL/6 mice were stained with") Supplementary Figure S1. PTPN2 levels are not altered in proliferating CD8+ T cells. Lymph node (LN) CD8+ T cells from C57BL/6 mice were stained with CFSE and stimulated with plate-bound α-cd3ε (10µg/ml)
Supplementary Figure S1. PTPN2 levels are not altered in proliferating CD8+ T cells. Lymph node (LN) CD8+ T cells from C57BL/6 mice were stained with CFSE and stimulated with plate-bound α-cd3ε (10µg/ml)
BMDCs were generated in vitro from bone marrow cells cultured in 10 % RPMI supplemented
 Supplemental Materials Figure S1. Cultured BMDCs express CD11c BMDCs were generated in vitro from bone marrow cells cultured in 10 % RPMI supplemented with 15 ng/ml GM-CSF. Media was changed and fresh
Supplemental Table 1. Primer sequences for transcript analysis
 Supplemental Table 1. Primer sequences for transcript analysis Primer Sequence (5 3 ) Primer Sequence (5 3 ) Mmp2 Forward CCCGTGTGGCCCTC Mmp15 Forward CGGGGCTGGCT Reverse GCTCTCCCGGTTTC Reverse CCTGGTGTGCCTGCTC
a surface permeabilized
 a surface permeabilized RAW 64.7 P388D1 J774 b CD11b + Ly-6G - Blood Monocytes WT Supplementary Figure 1. Cell surface expression on macrophages and DCs. (a) RAW64.7, P388D1, and J774 cells were subjected
Human and mouse T cell regulation mediated by soluble CD52 interaction with Siglec-10. Esther Bandala-Sanchez, Yuxia Zhang, Simone Reinwald,
 Human and mouse T cell regulation mediated by soluble CD52 interaction with Siglec-1 Esther Bandala-Sanchez, Yuxia Zhang, Simone Reinwald, James A. Dromey, Bo Han Lee, Junyan Qian, Ralph M Böhmer and Leonard
Eosinophils are required. for the maintenance of plasma cells in the bone marrow
 Eosinophils are required for the maintenance of plasma cells in the bone marrow Van Trung Chu, Anja Fröhlich, Gudrun Steinhauser, Tobias Scheel, Toralf Roch, Simon Fillatreau, James J. Lee, Max Löhning
Supplementary Figure 1. Efficiency of Mll4 deletion and its effect on T cell populations in the periphery. Nature Immunology: doi: /ni.
 Supplementary Figure 1 Efficiency of Mll4 deletion and its effect on T cell populations in the periphery. Expression of Mll4 floxed alleles (16-19) in naive CD4 + T cells isolated from lymph nodes and
well for 2 h at rt. Each dot represents an individual mouse and bar is the mean ±
 Supplementary data: Control DC Blimp-1 ko DC 8 6 4 2-2 IL-1β p=.5 medium 8 6 4 2 IL-2 Medium p=.16 8 6 4 2 IL-6 medium p=.3 5 4 3 2 1-1 medium IL-1 n.s. 25 2 15 1 5 IL-12(p7) p=.15 5 IFNγ p=.65 4 3 2 1
Supplementary Materials for
 www.sciencetranslationalmedicine.org/cgi/content/full/8/352/352ra110/dc1 Supplementary Materials for Spatially selective depletion of tumor-associated regulatory T cells with near-infrared photoimmunotherapy
B6/COLODR/SPL/11C/83/LAP/#2.006 B6/COLODR/SPL/11C/86/LAP/#2.016 CD11C B6/COLODR/SPL/11C/80/LAP/#2.011 CD11C
 CD3-specific antibody-induced immune tolerance and suppression of autoimmune encephalomyelitis involves TGF-β production through phagocytes digesting apoptotic T cells Sylvain Perruche 1,3, Pin Zhang 1,
Species differences in histomorphometry
 Species differences in histomorphometry Reinhold G. Erben Department of Biomedical Sciences Institute of Physiology and Pathophysiology University of Veterinary Medicine Vienna Purpose of histomorphometry
Bisphosphonate-induced differential modulation of immune cell function in gingiva and bone marrow in vivo: Role in osteoclastmediated
 /, Vol. 6, No. 24 Bisphosphonate-induced differential modulation of immune cell function in gingiva and bone marrow in vivo: Role in osteoclastmediated NK cell activation Han-Ching Tseng 1,*, Keiichi Kanayama
Supplementary Information:
 Supplementary Information: Follicular regulatory T cells with Bcl6 expression suppress germinal center reactions by Yeonseok Chung, Shinya Tanaka, Fuliang Chu, Roza Nurieva, Gustavo J. Martinez, Seema
ILC1 and ILC3 isolation and culture Following cell sorting, we confirmed that the recovered cells belonged to the ILC1, ILC2 and
 Supplementary Methods and isolation and culture Following cell sorting, we confirmed that the recovered cells belonged to the, ILC2 and subsets. For this purpose we performed intracellular flow cytometry
MATERIALS AND METHODS. Neutralizing antibodies specific to mouse Dll1, Dll4, J1 and J2 were prepared as described. 1,2 All
 MATERIALS AND METHODS Antibodies (Abs), flow cytometry analysis and cell lines Neutralizing antibodies specific to mouse Dll1, Dll4, J1 and J2 were prepared as described. 1,2 All other antibodies used
Supporting Information
 Supporting Information Aldridge et al. 10.1073/pnas.0900655106 Fig. S1. Flow diagram of sublethal (a) and lethal (b) influenza virus infections. (a) Infection of lung epithelial cells by influenza virus
The Pathogenesis of Bone Erosions in RA FULL VERSION
 The Pathogenesis of Bone Erosions in RA FULL VERSION 1 Key Learning Objectives Understand the role of osteoclasts in normal bone remodeling Comprehend the key processes in pathologic osteoclast functions
Supplemental Figure 1. Activated splenocytes upregulate Serpina3g and Serpina3f expression.
 Relative Serpin expression 25 2 15 1 5 Serpina3f 1 2 3 4 5 6 8 6 4 2 Serpina3g 1 2 3 4 5 6 C57BL/6 DBA/2 Supplemental Figure 1. Activated splenocytes upregulate Serpina3g and Serpina3f expression. Splenocytes
Supplementary information CD4 T cells are required for both development and maintenance of disease in a new model of reversible colitis
 Supplementary information CD4 T cells are required for both development and maintenance of disease in a new model of reversible colitis rasseit and Steiner et al. .. Supplementary Figure 1 % of initial
W/T Itgam -/- F4/80 CD115. F4/80 hi CD115 + F4/80 + CD115 +
 F4/8 % in the peritoneal lavage 6 4 2 p=.15 n.s p=.76 CD115 F4/8 hi CD115 + F4/8 + CD115 + F4/8 hi CD115 + F4/8 + CD115 + MHCII MHCII Supplementary Figure S1. CD11b deficiency affects the cellular responses
Generation of ST2-GFP reporter mice and characterization of ILC1 cells following infection
 Supplementary Figure 1 Generation of ST2-GFP reporter mice and characterization of ILC1 cells following infection with influenza virus. (a) ST2-GFP reporter mice were generated as described in Methods.
Combined Rho-kinase inhibition and immunogenic cell death triggers and propagates immunity against cancer
 Supplementary Information Combined Rho-kinase inhibition and immunogenic cell death triggers and propagates immunity against cancer Gi-Hoon Nam, Eun-Jung Lee, Yoon Kyoung Kim, Yeonsun Hong, Yoonjeong Choi,
Supplementary Figure 1 IMQ-Induced Mouse Model of Psoriasis. IMQ cream was
 Supplementary Figure 1 IMQ-Induced Mouse Model of Psoriasis. IMQ cream was painted on the shaved back skin of CBL/J and BALB/c mice for consecutive days. (a, b) Phenotypic presentation of mouse back skin
Supplementary Figures for TSC1 controls macrophage polarization to prevent inflammatory disorder by Linnan Zhu et al
 Supplementary Figures for TSC1 controls macrophage polarization to prevent inflammatory disorder by Linnan Zhu et al Suppl. Fig. 1 Tissue DN C Proteins kd TSC1-17 TSC 1 loxp bp -48-285 ctin PEMs Neutrophils
Quantitative PPARγ expression affects the balance between tolerance and immunity
 Quantitative PPARγ expression affects the balance between tolerance and immunity Ya-Hui Liu 1, Yau-Sheng Tsai 1,2,3, Shih-Chieh Lin 4, Nan-Shih Liao 5, Ming-Shiou Jan 6, Chung-Tiang Liang 7, Shih-Wen Hsu
Supplementary Information
 Supplementary Information Distinct bone marrow-derived and tissue resident macrophage lineages proliferate at key stages during inflammation. 1 Luke C. Davies, 1 Marcela Rosas, 2 Stephen J. Jenkins, 1
Pathologic Stage. Lymph node Stage
 ASC ASC a c Patient ID BMI Age Gleason score Non-obese PBMC 1 22.1 81 6 (3+3) PBMC 2 21.9 6 6 (3+3) PBMC 3 22 84 8 (4+4) PBMC 4 24.6 68 7 (3+4) PBMC 24. 6 (3+3) PBMC 6 24.7 73 7 (3+4) PBMC 7 23. 67 7 (3+4)
Glucocorticoid suppression of osteocyte perilacunar remodeling is associated with subchondral bone degeneration in osteonecrosis
 Supplementary Material Glucocorticoid suppression of osteocyte perilacunar remodeling is associated with subchondral bone degeneration in osteonecrosis Tristan W. Fowler 1, Claire Acevedo 1,2, Courtney
Supplemental Table I.
 Supplemental Table I Male / Mean ± SEM n Mean ± SEM n Body weight, g 29.2±0.4 17 29.7±0.5 17 Total cholesterol, mg/dl 534.0±30.8 17 561.6±26.1 17 HDL-cholesterol, mg/dl 9.6±0.8 17 10.1±0.7 17 Triglycerides,
Supporting Information
 Supporting Information lpek et al. 1.173/pnas.1121217 SI Materials and Methods Mice. cell knockout, inos / (Taconic arms), Rag1 /, INγR /, and IL-12p4 / mice (The Jackson Laboratory) were maintained and/or
Supplementary Figure 1
 Supplementary Figure 1 AAV-GFP injection in the MEC of the mouse brain C57Bl/6 mice at 4 months of age were injected with AAV-GFP into the MEC and sacrificed at 7 days post injection (dpi). (a) Brains
activation with anti-cd3/cd28 beads and 3d following transduction. Supplemental Figure 2 shows
 Supplemental Data Supplemental Figure 1 compares CXCR4 expression in untreated CD8 + T cells, following activation with anti-cd3/cd28 beads and 3d following transduction. Supplemental Figure 2 shows the
SUPPLEMENTARY INFORMATION
 Supplemental Figure 1. Furin is efficiently deleted in CD4 + and CD8 + T cells. a, Western blot for furin and actin proteins in CD4cre-fur f/f and fur f/f Th1 cells. Wild-type and furin-deficient CD4 +
Nature Medicine: doi: /nm.3922
 Title: Glucocorticoid-induced tumor necrosis factor receptor-related protein co-stimulation facilitates tumor regression by inducing IL-9-producing helper T cells Authors: Il-Kyu Kim, Byung-Seok Kim, Choong-Hyun
SUPPORTING INFORMATIONS
 SUPPORTING INFORMATIONS Mice MT/ret RetCD3ε KO α-cd25 treated MT/ret Age 1 month 3 mnths 6 months 1 month 3 months 6 months 1 month 3 months 6 months 2/87 Survival 87/87 incidence of 17/87 1 ary tumor
Immunological response to metallic implants
 Immunological response to metallic implants Doc. dr. Peter Korošec Head of Laboratory for Clinical Immunology & Molecular Genetics Head of Research & Development Department University Clinic of Respiratory
Nature Immunology: doi: /ni Supplementary Figure 1
 Supplementary Figure 1 Fatty acid oxidation is emphasized in 1 macrophages compared with that in macrophages. Gene expression of mitochondrial OXPHOS (Atp5j, Cox4i1, Uqcrc1/2, Ndufs1, Sdhb) and β-oxidation
ONLINE SUPPLEMENT MATERIAL. CD70 limits atherosclerosis and promotes macrophage function.
 ONLINE SUPPLEMENT MATERIAL CD7 limits atherosclerosis and promotes macrophage function. Holger Winkels* 1,2, Svenja Meiler* 1,2, Esther Smeets* 2, Dirk Lievens 1, David Engel 3, Charlotte Spitz 1, Christina
sequences of a styx mutant reveals a T to A transversion in the donor splice site of intron 5
 sfigure 1 Styx mutant mice recapitulate the phenotype of SHIP -/- mice. (A) Analysis of the genomic sequences of a styx mutant reveals a T to A transversion in the donor splice site of intron 5 (GTAAC
Supplementary Figure 1. Efficient DC depletion in CD11c.DOG transgenic mice
 Supplementary Figure 1. Efficient DC depletion in CD11c.DOG transgenic mice (a) CD11c.DOG transgenic mice (tg) were treated with 8 ng/g body weight (b.w.) diphtheria toxin (DT) i.p. on day -1 and every
<10. IL-1β IL-6 TNF + _ TGF-β + IL-23
 3 ns 25 ns 2 IL-17 (pg/ml) 15 1 ns ns 5 IL-1β IL-6 TNF
Electron micrograph of phosphotungstanic acid-stained exosomes derived from murine
 1 SUPPLEMENTARY INFORMATION SUPPLEMENTARY FIGURES Supplementary Figure 1. Physical properties of murine DC-derived exosomes. a, Electron micrograph of phosphotungstanic acid-stained exosomes derived from
Supplementary Materials
 Supplementary Materials Figure S1. MTT Cell viability assay. To measure the cytotoxic potential of the oxidative treatment, the MTT [3-(4,5-dimethylthiazol- 2-yl)-2,5-diphenyl tetrazolium bromide] assay
Supplemental Figure 1. Signature gene expression in in vitro differentiated Th0, Th1, Th2, Th17 and Treg cells. (A) Naïve CD4 + T cells were cultured
 Naïve CD4 + T cells were cultured") Supplemental Figure 1. Signature gene expression in in vitro differentiated Th0, Th1, Th2, Th17 and Treg cells. (A) Naïve CD4 + T cells were cultured under Th0, Th1, Th2, Th17, and Treg conditions. mrna
Supplemental Figure 1. Signature gene expression in in vitro differentiated Th0, Th1, Th2, Th17 and Treg cells. (A) Naïve CD4 + T cells were cultured under Th0, Th1, Th2, Th17, and Treg conditions. mrna
IL-1b Promotes TGF-b1 and IL-2 Dependent Foxp3 Expression in Regulatory T Cells
 IL-1b Promotes TGF-b1 and IL-2 Dependent Foxp3 Expression in Regulatory T Cells Balaji B. Ganesh 1, Palash Bhattacharya 1, Anupama Gopisetty 1, Jianrong Sheng 1, Chenthamarakshan Vasu 2, Bellur S. Prabhakar
Supplementary Figure 1. Example of gating strategy
 Supplementary Figure 1. Example of gating strategy Legend Supplementary Figure 1: First, gating is performed to include only single cells (singlets) (A) and CD3+ cells (B). After gating on the lymphocyte
Pearson r = P (one-tailed) = n = 9
 = n = 9") 8F4-Specific Lysis, % 1 UPN1 UPN3 8 UPN7 6 Pearson r =.69 UPN2 UPN5 P (one-tailed) =.192 4 UPN8 n = 9 2 UPN9 UPN4 UPN6 5 1 15 2 25 8 8F4, % Max MFI Supplementary Figure S1. AML samples UPN1-UPN9 show variable
8F4-Specific Lysis, % 1 UPN1 UPN3 8 UPN7 6 Pearson r =.69 UPN2 UPN5 P (one-tailed) =.192 4 UPN8 n = 9 2 UPN9 UPN4 UPN6 5 1 15 2 25 8 8F4, % Max MFI Supplementary Figure S1. AML samples UPN1-UPN9 show variable
Supplementary Figure 1. Normal T lymphocyte populations in Dapk -/- mice. (a) Normal thymic development in Dapk -/- mice. Thymocytes from WT and Dapk
 Normal thymic development in Dapk -/- mice. Thymocytes from WT and Dapk") Supplementary Figure 1. Normal T lymphocyte populations in Dapk -/- mice. (a) Normal thymic development in Dapk -/- mice. Thymocytes from WT and Dapk -/- mice were stained for expression of CD4 and CD8.
Supplementary Figure 1. Normal T lymphocyte populations in Dapk -/- mice. (a) Normal thymic development in Dapk -/- mice. Thymocytes from WT and Dapk -/- mice were stained for expression of CD4 and CD8.
Canberra, Australia). CD11c-DTR-OVA-GFP (B6.CD11c-OVA), B6.luc + and. Cancer Research Center, Germany). B6 or BALB/c.FoxP3-DTR-GFP mice were
. CD11c-DTR-OVA-GFP (B6.CD11c-OVA), B6.luc + and. Cancer Research Center, Germany). B6 or BALB/c.FoxP3-DTR-GFP mice were") Supplemental Materials and Methods Mice Female C57BL/6 (B6, I-E null, H-2 b ), BALB/c (H-2 d ) + ), FVB/N (H-2 q, I-E null, CD45.1 + ), and B6D2F1 (H-2 b/d ) mice were purchased from the Animal Resources
Supplemental Materials and Methods Mice Female C57BL/6 (B6, I-E null, H-2 b ), BALB/c (H-2 d ) + ), FVB/N (H-2 q, I-E null, CD45.1 + ), and B6D2F1 (H-2 b/d ) mice were purchased from the Animal Resources
NK cell flow cytometric assay In vivo DC viability and migration assay
 NK cell flow cytometric assay 6 NK cells were purified, by negative selection with the NK Cell Isolation Kit (Miltenyi iotec), from spleen and lymph nodes of 6 RAG1KO mice, injected the day before with
and follicular helper T cells is Egr2-dependent. (a) Diagrammatic representation of the
 Diagrammatic representation of the") Supplementary Figure 1. LAG3 + Treg-mediated regulation of germinal center B cells and follicular helper T cells is Egr2-dependent. (a) Diagrammatic representation of the experimental protocol for the
Supplementary Figure 1. LAG3 + Treg-mediated regulation of germinal center B cells and follicular helper T cells is Egr2-dependent. (a) Diagrammatic representation of the experimental protocol for the
SUPPLEMENTARY FIGURE 1
 SUPPLEMENTARY FIGURE 1 A LN Cell count (1 ) 1 3 1 CD+ 1 1 CDL lo CD hi 1 CD+FoxP3+ 1 1 1 7 3 3 3 % of cells 9 7 7 % of cells CD+ 3 1 % of cells CDL lo CD hi 1 1 % of CD+ cells CD+FoxP3+ 3 1 % of CD+ T
Supplementary Information
 Supplementary Information Splenic red pulp macrophages are intrinsically superparamagnetic and contaminate magnetic cell isolates Lars Franken, arika Klein, arina Spasova, nna Elsukova, Ulf Wiedwald, eike
Dual Targeting Nanoparticle Stimulates the Immune
 Dual Targeting Nanoparticle Stimulates the Immune System to Inhibit Tumor Growth Alyssa K. Kosmides, John-William Sidhom, Andrew Fraser, Catherine A. Bessell, Jonathan P. Schneck * Supplemental Figure
Supplemental Information. T Cells Enhance Autoimmunity by Restraining Regulatory T Cell Responses via an Interleukin-23-Dependent Mechanism
 Immunity, Volume 33 Supplemental Information T Cells Enhance Autoimmunity by Restraining Regulatory T Cell Responses via an Interleukin-23-Dependent Mechanism Franziska Petermann, Veit Rothhammer, Malte
In vitro human regulatory T cell suppression assay
 Human CD4 + CD25 + regulatory T cell isolation, in vitro suppression assay and analysis In vitro human regulatory T cell suppression assay Introduction Regulatory T (Treg) cells are a subpopulation of
D CD8 T cell number (x10 6 )
") IFNγ Supplemental Figure 1. CD T cell number (x1 6 ) 18 15 1 9 6 3 CD CD T cells CD6L C CD5 CD T cells CD6L D CD8 T cell number (x1 6 ) 1 8 6 E CD CD8 T cells CD6L F Log(1)CFU/g Feces 1 8 6 p
IFNγ Supplemental Figure 1. CD T cell number (x1 6 ) 18 15 1 9 6 3 CD CD T cells CD6L C CD5 CD T cells CD6L D CD8 T cell number (x1 6 ) 1 8 6 E CD CD8 T cells CD6L F Log(1)CFU/g Feces 1 8 6 p
SUPPLEMENTARY INFORMATION
 a. Smo+/+ b. Smo+/+ 5.63 5.48 c. Lin- d. e. 6 5 4 3 Ter119 Mac B T Sca1 Smo+/+ 25 15 2 o BMT 2 1 5 * Supplementary Figure 1: Deletion of Smoothened does not alter the frequency of hematopoietic lineages
SUPPLEMENTARY METHODS
 SUPPLEMENTARY METHODS Histological analysis. Colonic tissues were collected from 5 parts of the middle colon on day 7 after the start of DSS treatment, and then were cut into segments, fixed with 4% paraformaldehyde,
Conv. R GF Col. GF. Sham Ovx. E. coli. Veh. E. coli. E. coli. Veh. E. coli
 B A Uterus weight (mg) 5 5 Body Weight (g) - - Uterus Weight (mg) - - Supplemental Figure. Effects of prolide and treatment with probiotics on uterus weight and body weight. Data are expressed as ean +
GM-CSF-induced, bone-marrow-derived dendritic cells can expand natural Tregs and induce adaptive Tregs by different mechanisms
 Article GM-CSF-induced, bone-marrow-derived dendritic cells can expand natural Tregs and induce adaptive Tregs by different mechanisms Palash Bhattacharya,*,1 Anupama Gopisetty,*,1 Balaji B. Ganesh,* Jian
Supplementary table I. Real-time primers used in the study. The fold change was obtained by
 Supplementary table I. Real-time primers used in the study. The fold change was obtained by normalizing the gene expression number to those of HPRT, then comparing the samples to untreated or naive mice.
SUPPLEMENTARY INFORMATION
 DOI: 1.138/ncb3355 a S1A8 + cells/ total.1.8.6.4.2 b S1A8/?-Actin c % T-cell proliferation 3 25 2 15 1 5 T cells Supplementary Figure 1 Inter-tumoral heterogeneity of MDSC accumulation in mammary tumor
a 10 4 Link et al. Supplementary Figure 1 Nature Immunology: doi: /ni.1842 Cells per mouse ( 10 5 ) TRPV2KO anti-gr1 anti-gr anti-f4/80
 TRPV2KO anti-gr1 anti-gr anti-f4/80") a 10 4 WT 10 4 TRPV2KO 10 3 10 3 anti-gr1 10 2 10 1 anti-gr1 10 2 10 1 10 0 10 0 10 1 10 2 10 3 10 4 anti-f4/80 42.3 45.2 10 0 10 0 10 1 10 2 10 3 10 4 anti-f4/80 10 4 10 4 40 42.5 anti-cd11b 10 3 10 2
a 10 4 WT 10 4 TRPV2KO 10 3 10 3 anti-gr1 10 2 10 1 anti-gr1 10 2 10 1 10 0 10 0 10 1 10 2 10 3 10 4 anti-f4/80 42.3 45.2 10 0 10 0 10 1 10 2 10 3 10 4 anti-f4/80 10 4 10 4 40 42.5 anti-cd11b 10 3 10 2
Supplementary Materials for
 www.sciencesignaling.org/cgi/content/full/8/381/ra59/dc1 Supplementary Materials for Analysis of single-cell cytokine secretion reveals a role for paracrine signaling in coordinating macrophage responses
Endogenous TNFα orchestrates the trafficking of neutrophils into and within lymphatic vessels during acute inflammation
 SUPPLEMENTARY INFORMATION Endogenous TNFα orchestrates the trafficking of neutrophils into and within lymphatic vessels during acute inflammation Samantha Arokiasamy 1,2, Christian Zakian 1, Jessica Dilliway
Supplemental Figure S1. RANK expression on human lung cancer cells.
 Supplemental Figure S1. RANK expression on human lung cancer cells. (A) Incidence and H-Scores of RANK expression determined from IHC in the indicated primary lung cancer subgroups. The overall expression