Supplementary information CD4 T cells are required for both development and maintenance of disease in a new model of reversible colitis
|
|
|
- Brittney Heath
- 5 years ago
- Views:
Transcription
1 Supplementary information CD4 T cells are required for both development and maintenance of disease in a new model of reversible colitis rasseit and Steiner et al.
2 .. Supplementary Figure 1 % of initial body weight H + H days after CD4 T cell transfer % weight change after treatment H + H days post anti-cd4 treatment C Histopathological score H + H naïve active disease anti-cd4

3 .. Supplementary Figure 2 colon homogenates pg/g tissue pg/g tissue TNFα IL6 d28 post infection perm. colonization IFNγ d28 post infection perm. colonization IL17 IL1α Cxcl9 G-CSF TNFα IFNγ IL17 1 d28 post infection perm. colonization d28 post infection perm. colonization pg/ml serum 6 IL6 2 IL1α Cxcl9 G-CSF 4 5 pg/ml d post infection 7d post infection 28d post infection perm.colonization 1d post infection 7d post infection 28d post infection perm.colonization 1d post infection 7d post infection 28d post infection perm.colonization 1d post infection 7d post infection 28d post infection perm.colonization C H Helicobacter typhlonius infection day1 day7 day28 + permanent H colonization
4 Supplementary Figure 3 12 % of initial body weight anti-cd4 Histopathological Score C TCRαβ 1.4 active disease active disease d11 p.d. d29 p.d..5 d11 p.d. d29 p.d. CD4 Ki67
5 . Supplementary Figure 4 Helicobacter + Helicobacter active disease active disease 11d p.d. 11d p.d. Ifng Il1a Il1b Il6 Trem1 Lcn2 Il33 Tnfa Il17a Il17e Il17f Il23p19 Il12a Il12b Il18 Il5 Il7 Il1 Il22 Il22ra Tgfb1 Tgfb3 Trem2 Ccl2 Ccl3 Cxcl1 Cxcl1 Cxcl2 Ccl2 Cxcl13 Reg3b Reg3g S1a9 Ptprc Ptx Tnfsf11 Mylk Pro inflammatory nti inflammatory Chemokines IEC related response fold induction Others pg/g tissue TNFα IFNγ IL17 IL6 IL1α ns naive H + anti-cd4 H + active disease H anti-cd4 H ns 3 ns 25 ns 3 ns naive H + anti-cd4 H + active disease H anti-cd4 H 2 1 naive H + anti-cd4 H + active disease H anti-cd4 H naive H + anti-cd4 H + active disease H anti-cd4 H 2 1 naive H + anti-cd4 H + active disease H anti-cd4 H
6
7 . Supplementary Figure 6 % of initial body weight isotype control anti-cd4l Histopathological score days anti-cd4l naive isotype control anti-cd4l
8 .. Supplementary Figure 7 Thy1.2 + isotype control Thy1.2 DN anti-thy1.2 Thy1.1 DN 6 Thy1.1 CD4 CD25 C % weight change after treatment Thy1.2 anti-cd4 Thy1.1 anti-thy days post treatment D Histopathological score isotype control Thy1.1 anti-thy1.2 isotype control Thy1.2 anti-cd4
9 Supplementary information CD4 T cells are required for both development and maintenance of disease in a new model of reversible colitis rasseit and Steiner et al. Figure Legends Supplementary Figure 1: Disease kinetics of T cell transfer colitis in Helicobacter typhlonius positive (H + ) and Helicobacter typhlonius negative (H ) lymphopenic mice. () Percent body weight loss. () Percent body weight change in H + and H - mice with active disease treated with anti-cd4 antibodies (C) Colonic histopathology scores of H. typhlonius positive and H. typhlonius negative Rag -/- mice transferred with colitogenic CD4 + CD45R hi T cells during active disease (active disease) or 11 days post depletion of colitogenic CD4 T cells (anti-cd4). Supplementary Figure 2: Infection of lymphopenic mice with Helicobacter typhlonius does not promote local and systemic immune responses. () Protein expression levels of pro-inflammatory cytokines, Cxcl9, G-CSF and GM-CSF in colonic tissue homogenates or () serum of naïve Helicobacter-free mice (H - ), mice infected with H. typhlonius by oral gavage of 5x1 8 live bacteria at different time points (d1, d7, d28), naïve mice permanently colonized with H. typhlonius or H. typhlonius-colonized mice (H + ) with active colitis. (C) Presence of H. typhlonius in fecal pellets as assessed by PCR in the different groups. Supplementary Figure 3: Relapsing-remitting colitis. Helicobacter typhlonius positive Rag -/- mice were transferred with colitogenic CD4 T cells and subsequently depleted of CD4 T cells during active colitis on days 1, 13 and 16 post transfer. Long-term remission was monitored until day 3 post first anti-cd4 treatment (i.e. day 4 post transfer). () Weight loss. () Histopathological score of mice with active disease, 11 days post CD4 T cell depletion (p.d.) or during relapse phase on day 29 p.d. (=day 39 post T cell transfer) (C) Representative FCS plots illustrating CD4 T cell frequencies of CD45 + cells and Ki67 expression of CD4 T cells in the peripheral blood of mice with active disease, 11 days p.d. or during relapse phase on day 29 p.d.. Data shown are representative for 2 independent experiments with n=4. Supplementary Figure 4: Comparison of colonic gene expression profiles in Helicobacter typhlonius positive and Helicobacter typhlonius negative mice with active disease or in remission from colitis. () Heat-map of colonic gene expression profiles of H. typhlonius positive (H + ) and H. typhlonius negative (H + ) Rag -/- mice with active colitis and 11 days post anti-cd4 depletion (p.d). RN values were normalized to the endogenous control genes Gapdh and β2-microglobulin and presented as fold induction/reduction over CD4 + CD45R lo T cell transferred and subsequently anti- CD4 treated controls. () ead-based multiplex assay for protein levels of TNFα, IFNγ, IL17, IL6 and IL1α in colon homogenates. Data with n=4-6 mice per group are shown. ns: not significant.
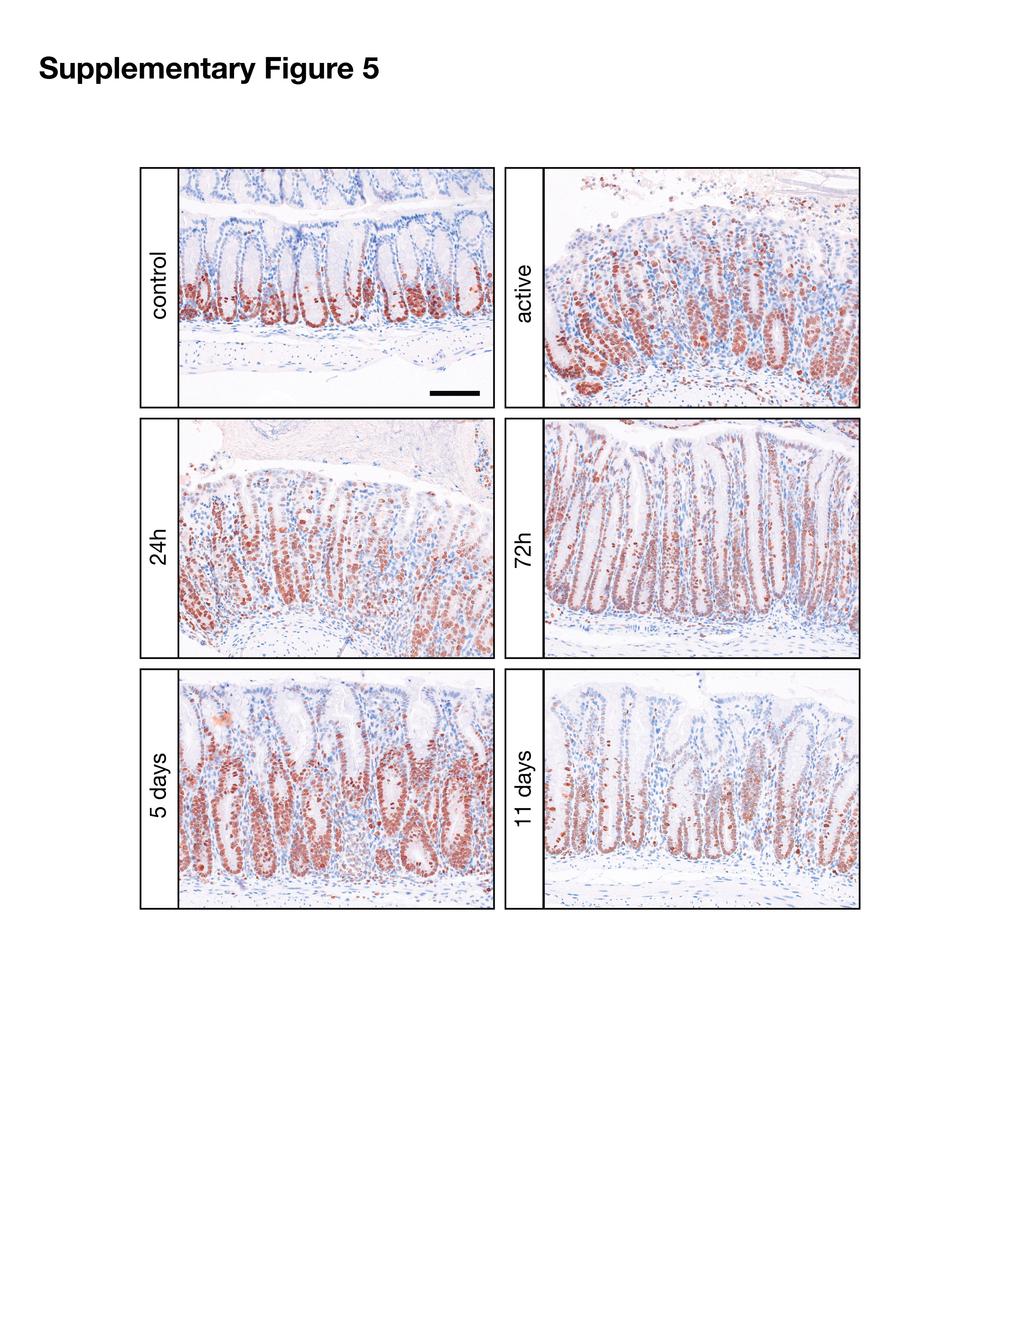
10 Supplementary Figure 5: Increased proliferation rate of colonic epithelial cells in response to mucosal healing. Immunohistochemistry for Ki67 on paraffin embedded tissue sections from colonic tissue of mice with active disease or upon induction of remission from colitis (days 1, 3, 5 and 11 post anti-cd4 depletion (p.d.)). Photographs are representative for n=3 mice per group. Scale bar: 1µm. Supplementary Figure 6: locking CD4L-CD4 interactions in mice with established disease does not promote remission from colitis: H. typhlonius positive (H + ) Rag -/- mice with active colitis ( 1-15% weight loss associated with clinical signs of colitis) were either treated with an isotype control antibody or anti-cd4l at days 13 and 14 and clinical and histopathological parameters of colitis were assessed. () Percent body weight loss. () Colonic histopathological scores of naïve, isotype control- and anti-cd4l-treated mice. Data are representative of 2 independent experiments with n=3-5 mice per treatment group. Supplementary Figure 7: Colitogenic CD4 T cells are critical for maintenance of disease in the preserved presence of CD4+ innate lymphoid cells. Thy1.1 H + Rag -/- mice were transferred with colitogenic Thy1.2 CD4 + CD45R hi T cells to induce active colitis. Selective depletion of CD4 T cells to induce remission from colitis was achieved by anti-thy1.2 antibody treatment. Representative FCS plots of Thy1.1- and Thy1.2 positive cells in the mesenteric lymph nodes of () isotype control treated or () anti-thy1.2 treated mice. CD4 surface expression of transferred colitogenic T cells (green) or resident Thy1.1 innate lymphoid cells (blue) that co-express CD25 are shown. DN: double negative cells. Cells were gated as singlet, live, lineage- (CD11c, Ly6G, CD19) and autofluorescence negative cells. (C) Percent body weight change in mice with active disease treated with anti-thy1.2 or anti CD4 antibodies. (D) Colonic histopathological scores of mice with active disease treated with isotype control antibodies, anti-thy1.2 or anti-cd4 as a control. Data are representative of two independent experiments with n=3-5 per group.
11 Supplementary materials and methods Culture of Helicobacter typhlonius and infection of mice H. typhlonius was purchased from the culture collection of the University of Göteborg (CCUG) and cultured according to the provided protocol under CCUG T ( Rag -/- mice were gavaged with 5x1 8 CFU H. typhlonius. Genomic DN was extracted from colonic content as previously described (Turnbaugh et al., 29). PCR conditions for Helicobacter spp. based on 16S rrn sequences were adapted from previously described protocols (Fox, 1994; attles, 1995, Shames,1995) using the following primer sequences (PHFwd: 5 -GCT TG CG GGT TC C-3 ; PHRev: 5 -GT TTT CC CCT C CC-3 ). Immunhistochemistry for Ki67 Immunohistochemistry was performed on paraffin embedded tissue sections from colonic tissues of mice using primary antibodies against Ki67 (Dako, clone TEC-3) and isotype matched control (rat-antimouse IgG2a) followed by secondary biotinylated rabbit-anti-rat antibody staining (Dako, E468).
Supplementary Figure 1. Characterization of basophils after reconstitution of SCID mice
 Supplementary figure legends Supplementary Figure 1. Characterization of after reconstitution of SCID mice with CD4 + CD62L + T cells. (A-C) SCID mice (n = 6 / group) were reconstituted with 2 x 1 6 CD4
D CD8 T cell number (x10 6 )
") IFNγ Supplemental Figure 1. CD T cell number (x1 6 ) 18 15 1 9 6 3 CD CD T cells CD6L C CD5 CD T cells CD6L D CD8 T cell number (x1 6 ) 1 8 6 E CD CD8 T cells CD6L F Log(1)CFU/g Feces 1 8 6 p
IFNγ Supplemental Figure 1. CD T cell number (x1 6 ) 18 15 1 9 6 3 CD CD T cells CD6L C CD5 CD T cells CD6L D CD8 T cell number (x1 6 ) 1 8 6 E CD CD8 T cells CD6L F Log(1)CFU/g Feces 1 8 6 p
Supplementary Table 1 Clinicopathological characteristics of 35 patients with CRCs
 Supplementary Table Clinicopathological characteristics of 35 patients with CRCs Characteristics Type-A CRC Type-B CRC P value Sex Male / Female 9 / / 8.5 Age (years) Median (range) 6. (9 86) 6.5 (9 76).95
Supplementary Figure 1. mrna expression of chitinase and chitinase-like protein in splenic immune cells. Each splenic immune cell population was
 Supplementary Figure 1. mrna expression of chitinase and chitinase-like protein in splenic immune cells. Each splenic immune cell population was sorted by FACS. Surface markers for sorting were CD11c +
Supplementary Figure 1. NAFL enhanced immunity of other vaccines (a) An over-the-counter, hand-held non-ablative fractional laser (NAFL).
 An over-the-counter, hand-held non-ablative fractional laser (NAFL).") Supplementary Figure 1. NAFL enhanced immunity of other vaccines (a) An over-the-counter, hand-held non-ablative fractional laser (NAFL). (b) Depiction of a MTZ array generated by NAFL. (c-e) IgG production
Supplementary Figure 1. NAFL enhanced immunity of other vaccines (a) An over-the-counter, hand-held non-ablative fractional laser (NAFL). (b) Depiction of a MTZ array generated by NAFL. (c-e) IgG production
CD4 + T cells recovered in Rag2 / recipient ( 10 5 ) Heart Lung Pancreas
 Heart Lung Pancreas") a CD4 + T cells recovered in Rag2 / recipient ( 1 5 ) Heart Lung Pancreas.5 1 2 4 6 2 4 6 Ctla4 +/+ Ctla4 / Ctla4 / Lung Ctla4 / Pancreas b Heart Lung Pancreas Ctla4 +/+ Ctla4 / Ctla4 / Lung Ctla4 / Pancreas
a CD4 + T cells recovered in Rag2 / recipient ( 1 5 ) Heart Lung Pancreas.5 1 2 4 6 2 4 6 Ctla4 +/+ Ctla4 / Ctla4 / Lung Ctla4 / Pancreas b Heart Lung Pancreas Ctla4 +/+ Ctla4 / Ctla4 / Lung Ctla4 / Pancreas
Supplementary information. The proton-sensing G protein-coupled receptor T-cell death-associated gene 8
 1 Supplementary information 2 3 The proton-sensing G protein-coupled receptor T-cell death-associated gene 8 4 (TDAG8) shows cardioprotective effects against myocardial infarction 5 Akiomi Nagasaka 1+,
Supplementary Figure 1 IL-27 IL
 Tim-3 Supplementary Figure 1 Tc0 49.5 0.6 Tc1 63.5 0.84 Un 49.8 0.16 35.5 0.16 10 4 61.2 5.53 10 3 64.5 5.66 10 2 10 1 10 0 31 2.22 10 0 10 1 10 2 10 3 10 4 IL-10 28.2 1.69 IL-27 Supplementary Figure 1.
Supplemental Table 1. Primer sequences for transcript analysis
 Supplemental Table 1. Primer sequences for transcript analysis Primer Sequence (5 3 ) Primer Sequence (5 3 ) Mmp2 Forward CCCGTGTGGCCCTC Mmp15 Forward CGGGGCTGGCT Reverse GCTCTCCCGGTTTC Reverse CCTGGTGTGCCTGCTC
Supplementary. presence of the. (c) mrna expression. Error. in naive or
 mrna expression. Error. in naive or") Figure 1. (a) Naive CD4 + T cells were activated in the presence of the indicated cytokines for 3 days. Enpp2 mrna expression was measured by qrt-pcrhr, infected with (b, c) Naive CD4 + T cells were activated
Figure 1. (a) Naive CD4 + T cells were activated in the presence of the indicated cytokines for 3 days. Enpp2 mrna expression was measured by qrt-pcrhr, infected with (b, c) Naive CD4 + T cells were activated
SUPPLEMENTARY MATERIAL
 SUPPLEMENTARY MATERIAL IL-1 signaling modulates activation of STAT transcription factors to antagonize retinoic acid signaling and control the T H 17 cell it reg cell balance Rajatava Basu 1,5, Sarah K.
SUPPLEMENTARY INFORMATION
 doi:10.1038/nature10134 Supplementary Figure 1. Anti-inflammatory activity of sfc. a, Autoantibody immune complexes crosslink activating Fc receptors, promoting activation of macrophages, and WWW.NATURE.COM/NATURE
Supplementary Figure 1: Expression of NFAT proteins in Nfat2-deleted B cells (a+b) Protein expression of NFAT2 (a) and NFAT1 (b) in isolated splenic
 Protein expression of NFAT2 (a) and NFAT1 (b) in isolated splenic") Supplementary Figure 1: Expression of NFAT proteins in Nfat2-deleted B cells (a+b) Protein expression of NFAT2 (a) and NFAT1 (b) in isolated splenic B cells from WT Nfat2 +/+, TCL1 Nfat2 +/+ and TCL1 Nfat2
Supplementary Figure 1: Expression of NFAT proteins in Nfat2-deleted B cells (a+b) Protein expression of NFAT2 (a) and NFAT1 (b) in isolated splenic B cells from WT Nfat2 +/+, TCL1 Nfat2 +/+ and TCL1 Nfat2
Bezzi et al., Supplementary Figure 1 *** Nature Medicine: doi: /nm Pten pc-/- ;Zbtb7a pc-/- Pten pc-/- ;Pml pc-/- Pten pc-/- ;Trp53 pc-/-
 Gr-1 Gr-1 Gr-1 Bezzi et al., Supplementary Figure 1 a Gr1-CD11b 3 months Spleen T cells 3 months Spleen B cells 3 months Spleen Macrophages 3 months Spleen 15 4 8 6 c CD11b+/Gr1+ cells [%] 1 5 b T cells
well for 2 h at rt. Each dot represents an individual mouse and bar is the mean ±
 Supplementary data: Control DC Blimp-1 ko DC 8 6 4 2-2 IL-1β p=.5 medium 8 6 4 2 IL-2 Medium p=.16 8 6 4 2 IL-6 medium p=.3 5 4 3 2 1-1 medium IL-1 n.s. 25 2 15 1 5 IL-12(p7) p=.15 5 IFNγ p=.65 4 3 2 1
Kerdiles et al - Figure S1
 Kerdiles et al - Figure S1 a b Homo sapiens T B ce ce l ls c l M ls ac r PM oph N ag es Mus musculus Foxo1 PLCγ Supplementary Figure 1 Foxo1 expression pattern is conserved between mouse and human. (a)
MATERIALS AND METHODS. Neutralizing antibodies specific to mouse Dll1, Dll4, J1 and J2 were prepared as described. 1,2 All
 MATERIALS AND METHODS Antibodies (Abs), flow cytometry analysis and cell lines Neutralizing antibodies specific to mouse Dll1, Dll4, J1 and J2 were prepared as described. 1,2 All other antibodies used
Atg5 flox/flox ; CAG-Cre, 19M brain heart lung. spleen stomach colon. Takamura_Fig. S1
 Takamura_Fig. S1 brain heart lung spleen stomach colon kidney SM Supplemental Figure 1 Histological findings of tg5 flox/flox ;CG-Cre mouse tissues. H&E staining of the brain, heart, lung, spleen, stomach,
Supplementary Figure 1. Example of gating strategy
 Supplementary Figure 1. Example of gating strategy Legend Supplementary Figure 1: First, gating is performed to include only single cells (singlets) (A) and CD3+ cells (B). After gating on the lymphocyte
An epithelial circadian clock controls pulmonary inflammation and glucocorticoid action
 An epithelial circadian clock controls pulmonary inflammation and glucocorticoid action Supplementary Figure : Expression levels of toll-like receptor 4 (Tlr4) in muse lung does not change throughout the
Supplementary Information:
 Supplementary Information: Follicular regulatory T cells with Bcl6 expression suppress germinal center reactions by Yeonseok Chung, Shinya Tanaka, Fuliang Chu, Roza Nurieva, Gustavo J. Martinez, Seema
Nature Immunology: doi: /ni Supplementary Figure 1. Cellularity of leukocytes and their progenitors in naive wild-type and Spp1 / mice.
 Supplementary Figure 1 Cellularity of leukocytes and their progenitors in naive wild-type and Spp1 / mice. (a, b) Gating strategies for differentiated cells including PMN (CD11b + Ly6G hi and CD11b + Ly6G
Supplementary Figure 1. Efficiency of Mll4 deletion and its effect on T cell populations in the periphery. Nature Immunology: doi: /ni.
 Supplementary Figure 1 Efficiency of Mll4 deletion and its effect on T cell populations in the periphery. Expression of Mll4 floxed alleles (16-19) in naive CD4 + T cells isolated from lymph nodes and
SUPPLEMENTARY INFORMATION
 doi:1.138/nature1554 a TNF-α + in CD4 + cells [%] 1 GF SPF 6 b IL-1 + in CD4 + cells [%] 5 4 3 2 1 Supplementary Figure 1. Effect of microbiota on cytokine profiles of T cells in GALT. Frequencies of TNF-α
SUPPLEMENTARY INFORMATION
 doi: 1.138/nature89 IFN- (ng ml ) 5 4 3 1 Splenocytes NS IFN- (ng ml ) 6 4 Lymph node cells NS Nfkbiz / Nfkbiz / Nfkbiz / Nfkbiz / IL- (ng ml ) 3 1 Splenocytes IL- (ng ml ) 1 8 6 4 *** ** Lymph node cells
Eosinophils! 40! 30! 20! 10! 0! NS!
 A Macrophages Lymphocytes Eosinophils Neutrophils Percentage (%) 1 ** 4 * 1 1 MMA SA B C Baseline FEV1, % predicted 15 p = 1.11 X 10⁻⁹ 5 CD4:CD8 ratio 1 Supplemental Figure 1. Cellular infiltrate in the
Nature Immunology: doi: /ni Supplementary Figure 1. Production of cytokines and chemokines after vaginal HSV-2 infection.
 Supplementary Figure 1 Production of cytokines and chemokines after vaginal HSV-2 infection. C57BL/6 mice were (a) treated intravaginally with 20 µl of PBS or infected with 6.7x10 4 pfu of HSV-2 in the
Suppl Video: Tumor cells (green) and monocytes (white) are seeded on a confluent endothelial
 and monocytes (white) are seeded on a confluent endothelial") Supplementary Information Häuselmann et al. Monocyte induction of E-selectin-mediated endothelial activation releases VE-cadherin junctions to promote tumor cell extravasation in the metastasis cascade
Supplementary Information Häuselmann et al. Monocyte induction of E-selectin-mediated endothelial activation releases VE-cadherin junctions to promote tumor cell extravasation in the metastasis cascade
Supplementary Materials for
 www.sciencemag.org/content/348/6241/aaa825/suppl/dc1 Supplementary Materials for A mucosal vaccine against Chlamydia trachomatis generates two waves of protective memory T cells Georg Stary,* Andrew Olive,
Supplementary Figures for TSC1 controls macrophage polarization to prevent inflammatory disorder by Linnan Zhu et al
 Supplementary Figures for TSC1 controls macrophage polarization to prevent inflammatory disorder by Linnan Zhu et al Suppl. Fig. 1 Tissue DN C Proteins kd TSC1-17 TSC 1 loxp bp -48-285 ctin PEMs Neutrophils
Pathologic Stage. Lymph node Stage
 ASC ASC a c Patient ID BMI Age Gleason score Non-obese PBMC 1 22.1 81 6 (3+3) PBMC 2 21.9 6 6 (3+3) PBMC 3 22 84 8 (4+4) PBMC 4 24.6 68 7 (3+4) PBMC 24. 6 (3+3) PBMC 6 24.7 73 7 (3+4) PBMC 7 23. 67 7 (3+4)
Supplemental Materials
 Supplemental Materials Programmed death one homolog maintains the pool size of regulatory T cells by promoting their differentiation and stability Qi Wang 1, Jianwei He 1, Dallas B. Flies 2, Liqun Luo
ndln NK Cells (x10 3 ) Days post-infection (A/PR/8) *** *** *** Liver NK Cells (x10 4 ) Days post-infection (MCMV)
 Days post-infection (A/PR/8) *** *** *** Liver NK Cells (x10 4 ) Days post-infection (MCMV)") A mln NK Cells(x ) 6 1 * ndln NK Cells (x ) ns C Lung NK Cells(x ) 1 1 7 * D LN NK Cells (x ) 1 7 1 7 Days post-infection (A/PR/8) * * E Liver NK Cells (x ) 1 7 Days post-infection (A/PR/8) * * * 1 7 Days
A mln NK Cells(x ) 6 1 * ndln NK Cells (x ) ns C Lung NK Cells(x ) 1 1 7 * D LN NK Cells (x ) 1 7 1 7 Days post-infection (A/PR/8) * * E Liver NK Cells (x ) 1 7 Days post-infection (A/PR/8) * * * 1 7 Days
Supplemental Figures: Supplemental Figure 1
 Supplemental Figures: Supplemental Figure 1 Suppl. Figure 1. BM-DC infection with H. pylori does not induce cytotoxicity and treatment of BM-DCs with H. pylori sonicate, but not heat-inactivated bacteria,
1,000 in silico simulated alpha, beta, gamma and delta TCR repertoires were created.
 938 939 940 941 942 Figure S1 Schematic of the in silico TCRminer and MiXCR validation. 1,000 in silico simulated alpha, beta, gamma and delta TCR repertoires were created. Then, 100,000 simulated 80 bp
<10. IL-1β IL-6 TNF + _ TGF-β + IL-23
 3 ns 25 ns 2 IL-17 (pg/ml) 15 1 ns ns 5 IL-1β IL-6 TNF
SUPPLEMENTARY METHODS
 SUPPLEMENTARY METHODS Histological analysis. Colonic tissues were collected from 5 parts of the middle colon on day 7 after the start of DSS treatment, and then were cut into segments, fixed with 4% paraformaldehyde,
Supplementary Figure 1. Dynamic Response of WT and mir-21 -/- mice to caerulein. (a) Representative histological sections of mouse pancreas stained
 Representative histological sections of mouse pancreas stained") Supplementary Figure 1. Dynamic Response of WT and mir-21 -/- mice to caerulein. (a) Representative histological sections of mouse pancreas stained with hematoxylin from caerulein-treated WT and mir-21
Supplementary Figure 1. Dynamic Response of WT and mir-21 -/- mice to caerulein. (a) Representative histological sections of mouse pancreas stained with hematoxylin from caerulein-treated WT and mir-21
Supplementary Figure 1. ETBF activate Stat3 in B6 and Min mice colons
 Supplementary Figure 1 ETBF activate Stat3 in B6 and Min mice colons a pstat3 controls Pos Neg ETBF 1 2 3 4 b pstat1 pstat2 pstat3 pstat4 pstat5 pstat6 Actin Figure Legend: (a) ETBF induce predominantly
NMED-A65251A. Supplementary Figures.
 NMED-A65251A Supplementary Figures. Sup. Fig. 1. ILC3 cells are the main source of in obese mice a. We gated on T cells (upper panels) or T cells (lower panels), and examined production. b. CD45 + - IL-13
Eosinophils are required. for the maintenance of plasma cells in the bone marrow
 Eosinophils are required for the maintenance of plasma cells in the bone marrow Van Trung Chu, Anja Fröhlich, Gudrun Steinhauser, Tobias Scheel, Toralf Roch, Simon Fillatreau, James J. Lee, Max Löhning
Nature Immunology: doi: /ni.3836
 Supplementary Figure 1 Recombinant LIGHT-VTP induces pericyte contractility and endothelial cell activation. (a) Western blot showing purification steps for full length murine LIGHT-VTP (CGKRK) protein:
(A) RT-PCR for components of the Shh/Gli pathway in normal fetus cell (MRC-5) and a
 RT-PCR for components of the Shh/Gli pathway in normal fetus cell (MRC-5) and a") Supplementary figure legends Supplementary Figure 1. Expression of Shh signaling components in a panel of gastric cancer. (A) RT-PCR for components of the Shh/Gli pathway in normal fetus cell (MRC-5) and
Supplementary figure legends Supplementary Figure 1. Expression of Shh signaling components in a panel of gastric cancer. (A) RT-PCR for components of the Shh/Gli pathway in normal fetus cell (MRC-5) and
Supplemental Figure 1
 Supplemental Figure 1 1a 1c PD-1 MFI fold change 6 5 4 3 2 1 IL-1α IL-2 IL-4 IL-6 IL-1 IL-12 IL-13 IL-15 IL-17 IL-18 IL-21 IL-23 IFN-α Mut Human PD-1 promoter SBE-D 5 -GTCTG- -1.2kb SBE-P -CAGAC- -1.kb
Supplemental Table I.
 Supplemental Table I Male / Mean ± SEM n Mean ± SEM n Body weight, g 29.2±0.4 17 29.7±0.5 17 Total cholesterol, mg/dl 534.0±30.8 17 561.6±26.1 17 HDL-cholesterol, mg/dl 9.6±0.8 17 10.1±0.7 17 Triglycerides,
Supplementary Figure 1. Deletion of Smad3 prevents B16F10 melanoma invasion and metastasis in a mouse s.c. tumor model.
 A B16F1 s.c. Lung LN Distant lymph nodes Colon B B16F1 s.c. Supplementary Figure 1. Deletion of Smad3 prevents B16F1 melanoma invasion and metastasis in a mouse s.c. tumor model. Highly invasive growth
SUPPLEMENTAL INFORMATIONS
 1 SUPPLEMENTAL INFORMATIONS Figure S1 Cumulative ZIKV production by testis explants over a 9 day-culture period. Viral titer values presented in Figure 1B (viral release over a 3 day-culture period measured
Nature Immunology: doi: /ni Supplementary Figure 1. Cytokine pattern in skin in response to urushiol.
 Supplementary Figure 1 Cytokine pattern in skin in response to urushiol. Wild-type (WT) and CD1a-tg mice (n = 3 per group) were sensitized and challenged with urushiol (uru) or vehicle (veh). Quantitative
Blocking antibodies and peptides. Rat anti-mouse PD-1 (29F.1A12, rat IgG2a, k), PD-
, PD-") Supplementary Methods Blocking antibodies and peptides. Rat anti-mouse PD-1 (29F.1A12, rat IgG2a, k), PD- L1 (10F.9G2, rat IgG2b, k), and PD-L2 (3.2, mouse IgG1) have been described (24). Anti-CTLA-4 (clone
Supplementary Methods Blocking antibodies and peptides. Rat anti-mouse PD-1 (29F.1A12, rat IgG2a, k), PD- L1 (10F.9G2, rat IgG2b, k), and PD-L2 (3.2, mouse IgG1) have been described (24). Anti-CTLA-4 (clone
17 th International Conference of the Inflammation Research Association: Wednesday AM (Day 4) September 9-13, 2012
 September 9-13, 2012") 17 th International Conference of the Inflammation Research Association: Wednesday AM (Day 4) September 9-13, 2012 The Sagamore Resort, Bolton Landing, NY, USA The following report includes highlights
17 th International Conference of the Inflammation Research Association: Wednesday AM (Day 4) September 9-13, 2012 The Sagamore Resort, Bolton Landing, NY, USA The following report includes highlights
Supplementary Figure S1. Flow cytometric analysis of the expression of Thy1 in NH cells. Flow cytometric analysis of the expression of T1/ST2 and
 Supplementary Figure S1. Flow cytometric analysis of the expression of Thy1 in NH cells. Flow cytometric analysis of the expression of T1/ST2 and Thy1 in NH cells derived from the lungs of naïve mice.
Supplementary Figure 1. IL-12 serum levels and frequency of subsets in FL patients. (A) IL-12
 IL-12") 1 Supplementary Data Figure legends Supplementary Figure 1. IL-12 serum levels and frequency of subsets in FL patients. (A) IL-12 serum levels measured by multiplex ELISA (Luminex) in FL patients before
1 Supplementary Data Figure legends Supplementary Figure 1. IL-12 serum levels and frequency of subsets in FL patients. (A) IL-12 serum levels measured by multiplex ELISA (Luminex) in FL patients before
Supplementary Materials
 Supplementary Materials 1 Supplementary Table 1. List of primers used for quantitative PCR analysis. Gene name Gene symbol Accession IDs Sequence range Product Primer sequences size (bp) β-actin Actb gi
Supplementary Information
 Supplementary Information Supplementary Figure 1. Short-term coreceptor and costimulation blockade induces tolerance to pluripotent human ESCs. (A) Schematic diagram showing experimental approaches and
The Case of the Spring Break Consequences
 The Case of the Spring Break Consequences Hazel reluctantly opened her eyes when her alarm went off. Spring Break was over, and she was definitely NOT ready for the second half of the semester. However,
Supplemental Table 1: Demographics and characteristics of study participants. Male, n (%) 3 (20%) 6 (50%) Age, years [mean ± SD] 33.3 ± ± 9.
![Supplemental Table 1: Demographics and characteristics of study participants. Male, n (%) 3 (20%) 6 (50%) Age, years [mean ± SD] 33.3 ± ± 9.](/thumbs/90/103696086.jpg "Supplemental Table 1: Demographics and characteristics of study participants. Male, n (%) 3 (20%) 6 (50%) Age, years [mean ± SD] 33.3 ± ± 9.") SUPPLEMENTAL DATA Supplemental Table 1: Demographics and characteristics of study participants Lean (n=15) Obese (n=12) Male, n (%) 3 (20%) 6 (50%) Age, years [mean ± SD] 33.3 ± 9.5 44.8 ± 9.1 White, n
SUPPLEMENTAL DATA Supplemental Table 1: Demographics and characteristics of study participants Lean (n=15) Obese (n=12) Male, n (%) 3 (20%) 6 (50%) Age, years [mean ± SD] 33.3 ± 9.5 44.8 ± 9.1 White, n
B6/COLODR/SPL/11C/83/LAP/#2.006 B6/COLODR/SPL/11C/86/LAP/#2.016 CD11C B6/COLODR/SPL/11C/80/LAP/#2.011 CD11C
 CD3-specific antibody-induced immune tolerance and suppression of autoimmune encephalomyelitis involves TGF-β production through phagocytes digesting apoptotic T cells Sylvain Perruche 1,3, Pin Zhang 1,
Title of file for HTML: Supplementary Information Description: Supplementary Figures and Supplementary Table
 Title of file for HTML: Supplementary Information Description: Supplementary Figures and Supplementary Table Title of file for HTML: Peer Review File Description: Innate Scavenger Receptor-A regulates
Life Sciences. Cytokine assays
 Life Sciences Cytokine assays A full range of cytokines Cisbio s kits cover the full range of cytokines: interleukins, interferons (IFN), chemokines, TNF and lymphokines. All our assays are cell based
Fig. S1 A. week 4 week 6
 Fig. S1 Trabecular Number Trabecular Thickness number/mm 3.5 3. 2.5 2. 1.5 1..5 mm.45.4.35.3.25.2.15.1.5 SKG-c SKG-A mm 1.4 1.2 1..8.6.4.2 Trabecular Spacing D. week 4 week 6 Figure S1. MicroCT analysis
Spleen. mlns. E Spleen 4.1. mlns. Spleen. mlns. Mock 17. Mock CD8 HIV-1 CD38 HLA-DR. Ki67. Spleen. Spleen. mlns. Cheng et al. Fig.
 C D E F Mock 17 Mock 4.1 CD38 57 CD8 23.7 HLA-DR Ki67 G H I Cheng et al. Fig.S1 Supplementary Figure 1. persistent infection leads to human T cell depletion and hyper-immune activation. Humanized mice
qpcr-array Analysis Service
 qpcr-array Analysis Service Customer Name Institute Telephone Address E-mail PO Number Service Code Report Date Service Laboratory Department Phalanx Biotech Group, Inc 6 Floor, No.6, Technology Road 5,
Supplementary Figure S1. PTPN2 levels are not altered in proliferating CD8+ T cells. Lymph node (LN) CD8+ T cells from C57BL/6 mice were stained with
 CD8+ T cells from C57BL/6 mice were stained with") Supplementary Figure S1. PTPN2 levels are not altered in proliferating CD8+ T cells. Lymph node (LN) CD8+ T cells from C57BL/6 mice were stained with CFSE and stimulated with plate-bound α-cd3ε (10µg/ml)
Supplementary Figure S1. PTPN2 levels are not altered in proliferating CD8+ T cells. Lymph node (LN) CD8+ T cells from C57BL/6 mice were stained with CFSE and stimulated with plate-bound α-cd3ε (10µg/ml)
Toluidin-Staining of mast cells Ear tissue was fixed with Carnoy (60% ethanol, 30% chloroform, 10% acetic acid) overnight at 4 C, afterwards
 overnight at 4 C, afterwards") Toluidin-Staining of mast cells Ear tissue was fixed with Carnoy (60% ethanol, 30% chloroform, 10% acetic acid) overnight at 4 C, afterwards incubated in 100 % ethanol overnight at 4 C and embedded in
Toluidin-Staining of mast cells Ear tissue was fixed with Carnoy (60% ethanol, 30% chloroform, 10% acetic acid) overnight at 4 C, afterwards incubated in 100 % ethanol overnight at 4 C and embedded in
Transduction of lentivirus to human primary CD4+ T cells
 Transduction of lentivirus to human primary CD4 + T cells Human primary CD4 T cells were stimulated with anti-cd3/cd28 antibodies (10 µl/2 5 10^6 cells of Dynabeads CD3/CD28 T cell expander, Invitrogen)
Supplementary Figure 1: TSLP receptor skin expression in dcssc. A: Healthy control (HC) skin with TSLP receptor expression in brown (10x
 skin with TSLP receptor expression in brown (10x") Supplementary Figure 1: TSLP receptor skin expression in dcssc. A: Healthy control (HC) skin with TSLP receptor expression in brown (10x magnification). B: Second HC skin stained for TSLP receptor in brown
Supplementary Figure 1: TSLP receptor skin expression in dcssc. A: Healthy control (HC) skin with TSLP receptor expression in brown (10x magnification). B: Second HC skin stained for TSLP receptor in brown
Supplementary Figure 1
 d f a IL7 b IL GATA RORγt h HDM IL IL7 PBS Ilra R7 PBS HDM Ilra R7 HDM Foxp Foxp Ilra R7 HDM HDM Ilra R7 HDM. 9..79. CD + FOXP + T reg cell CD + FOXP T conv cell PBS Ilra R7 PBS HDM Ilra R7 HDM CD + FOXP
Supplementary Figures. T Cell Factor-1 initiates T helper 2 fate by inducing GATA-3 and repressing Interferon-γ
 Supplementary Figures T Cell Factor-1 initiates T helper 2 fate by inducing GATA-3 and repressing Interferon-γ Qing Yu, Archna Sharma, Sun Young Oh, Hyung-Geun Moon, M. Zulfiquer Hossain, Theresa M. Salay,
SUPPLEMENTARY INFORMATION
 Supplemental Figure 1. Furin is efficiently deleted in CD4 + and CD8 + T cells. a, Western blot for furin and actin proteins in CD4cre-fur f/f and fur f/f Th1 cells. Wild-type and furin-deficient CD4 +
Hua Tang, Weiping Cao, Sudhir Pai Kasturi, Rajesh Ravindran, Helder I Nakaya, Kousik
 SUPPLEMENTARY FIGURES 1-19 T H 2 response to cysteine-proteases requires dendritic cell-basophil cooperation via ROS mediated signaling Hua Tang, Weiping Cao, Sudhir Pai Kasturi, Rajesh Ravindran, Helder
Innate immune regulation of T-helper (Th) cell homeostasis in the intestine
 cell homeostasis in the intestine") Innate immune regulation of T-helper (Th) cell homeostasis in the intestine Masayuki Fukata, MD, Ph.D. Research Scientist II Division of Gastroenterology, Department of Medicine, F. Widjaja Foundation,
Innate immune regulation of T-helper (Th) cell homeostasis in the intestine Masayuki Fukata, MD, Ph.D. Research Scientist II Division of Gastroenterology, Department of Medicine, F. Widjaja Foundation,
WISP1 mediates IL-6-dependent proliferation in primary human lung fibroblasts
 WISP mediates IL-6-dependent proliferation in primary human lung fibroblasts Klee S, Lehmann M, Wagner DE, aarsma H, Königshoff M Comprehensive Pneumology Center, Helmholtz Zentrum München, Munich, Germany;
Reviewers' comments: Reviewer #1 (Remarks to the Author):
:") Reviewers' comments: Reviewer #1 (Remarks to the Author): In this manuscript, Hasan et al analyse the transcriptional program used by pathogenic Th17 cells raised in the presence of IL-23 as compared to
Reviewers' comments: Reviewer #1 (Remarks to the Author): In this manuscript, Hasan et al analyse the transcriptional program used by pathogenic Th17 cells raised in the presence of IL-23 as compared to
SUPPLEMENTARY FIGURES
 SUPPLEMENTARY FIGURES Supplementary Figure 1: Chemokine receptor expression profiles of CCR6 + and CCR6 - CD4 + IL-17A +/ex and Treg cells. Quantitative PCR analysis of chemokine receptor transcript abundance
pplementary Figur Supplementary Figure 1. a.
 pplementary Figur Supplementary Figure 1. a. Quantification by RT-qPCR of YFV-17D and YFV-17D pol- (+) RNA in the supernatant of cultured Huh7.5 cells following viral RNA electroporation of respective
a) Primary cultures derived from the pancreas of an 11-week-old Pdx1-Cre; K-MADM-p53
 Primary cultures derived from the pancreas of an 11-week-old Pdx1-Cre; K-MADM-p53") 1 2 3 4 5 6 7 8 9 10 Supplementary Figure 1. Induction of p53 LOH by MADM. a) Primary cultures derived from the pancreas of an 11-week-old Pdx1-Cre; K-MADM-p53 mouse revealed increased p53 KO/KO (green,
1 2 3 4 5 6 7 8 9 10 Supplementary Figure 1. Induction of p53 LOH by MADM. a) Primary cultures derived from the pancreas of an 11-week-old Pdx1-Cre; K-MADM-p53 mouse revealed increased p53 KO/KO (green,
Supplementary Table 1. The primers used for quantitative RT-PCR. Gene name Forward (5 > 3 ) Reverse (5 > 3 )
 Reverse (5 > 3 )") 770 771 Supplementary Table 1. The primers used for quantitative RT-PCR. Gene name Forward (5 > 3 ) Reverse (5 > 3 ) Human CXCL1 GCGCCCAAACCGAAGTCATA ATGGGGGATGCAGGATTGAG PF4 CCCCACTGCCCAACTGATAG TTCTTGTACAGCGGGGCTTG
770 771 Supplementary Table 1. The primers used for quantitative RT-PCR. Gene name Forward (5 > 3 ) Reverse (5 > 3 ) Human CXCL1 GCGCCCAAACCGAAGTCATA ATGGGGGATGCAGGATTGAG PF4 CCCCACTGCCCAACTGATAG TTCTTGTACAGCGGGGCTTG
Targeting tumour associated macrophages in anti-cancer therapies. Annamaria Gal Seminar Series on Drug Discovery Budapest 5 January 2018
 Targeting tumour associated macrophages in anti-cancer therapies Annamaria Gal Seminar Series on Drug Discovery Budapest 5 January 2018 Macrophages: Professional phagocytes of the myeloid lineage APC,
Intestinal homeostasis and its breakdown in IBD. Fiona Powrie
 Intestinal homeostasis and its breakdown in IBD Fiona Powrie Translational Gastroenterology Unit Experimental Medicine Division Nuffield Dept of Clinical Medicine University of Oxford fiona.powrie@path.ox.ac.uk
To compare the relative amount of of selected gene expression between sham and
 Supplementary Materials and Methods Gene Expression Analysis To compare the relative amount of of selected gene expression between sham and mice given renal ischemia-reperfusion injury (IRI), ncounter
?Who binds to it. ? Who binds these inflammatory proteins RAGE SUGAR-FREE GLYCOBIOLOGY INFLAMMATION. BASIC SCIENCE?sugar chain structure
 SUGAR-FREE GLYCOBIOLOGY BASIC SCIENCE?sugar chain structure Unusual Sugar Chain It -- is a carboxylate Make lots of It Make an It antibody Inflammatory proteins?who binds to it? Who binds these inflammatory
IL-6Rα IL-6RαT-KO KO. IL-6Rα f/f bp. f/f 628 bp deleted 368 bp. 500 bp
 STD H 2 O WT KO IL-6Rα f/f IL-6Rα IL-6RαT-KO KO 1000 bp 500 bp f/f 628 bp deleted 368 bp Supplementary Figure 1 Confirmation of T-cell IL-6Rα deficiency. (a) Representative histograms and (b) quantification
Supporting Information
 Supporting Information Desnues et al. 10.1073/pnas.1314121111 SI Materials and Methods Mice. Toll-like receptor (TLR)8 / and TLR9 / mice were generated as described previously (1, 2). TLR9 / mice were
Supplementary Information
 Supplementary Information Splenic red pulp macrophages are intrinsically superparamagnetic and contaminate magnetic cell isolates Lars Franken, arika Klein, arina Spasova, nna Elsukova, Ulf Wiedwald, eike
fl/+ KRas;Atg5 fl/+ KRas;Atg5 fl/fl KRas;Atg5 fl/fl KRas;Atg5 Supplementary Figure 1. Gene set enrichment analyses. (a) (b)
 (b)") KRas;At KRas;At KRas;At KRas;At a b Supplementary Figure 1. Gene set enrichment analyses. (a) GO gene sets (MSigDB v3. c5) enriched in KRas;Atg5 fl/+ as compared to KRas;Atg5 fl/fl tumors using gene set
KRas;At KRas;At KRas;At KRas;At a b Supplementary Figure 1. Gene set enrichment analyses. (a) GO gene sets (MSigDB v3. c5) enriched in KRas;Atg5 fl/+ as compared to KRas;Atg5 fl/fl tumors using gene set
Balancing intestinal and systemic inflammation through cell type-specific expression of
 Supplementary Information Balancing intestinal and systemic inflammation through cell type-specific expression of the aryl hydrocarbon receptor repressor Olga Brandstätter 1,2,6, Oliver Schanz 1,6, Julia
a surface permeabilized
 a surface permeabilized RAW 64.7 P388D1 J774 b CD11b + Ly-6G - Blood Monocytes WT Supplementary Figure 1. Cell surface expression on macrophages and DCs. (a) RAW64.7, P388D1, and J774 cells were subjected
Online Data Supplement. Induction of Pulmonary Granuloma Formation by Propionibacterium acnes is regulated by. MyD88 and Nox2
 Online Data Supplement Induction of Pulmonary Granuloma Formation by Propionibacterium acnes is regulated by MyD88 and Nox2 Jessica L. Werner *, Sylvia G. Escolero *, Jeff T. Hewlett *, Tim N. Mak *3,
M2 microglia/ macrophages drive oligodendrocyte differentiation during CNS remyelination
 Supplemental Information Title: M2 microglia/ macrophages drive oligodendrocyte differentiation during CNS remyelination Authors: Veronique E. Miron, Amanda Boyd, Jing-Wei Zhao, Tracy J. Yuen, Julia M.
ILC1 and ILC3 isolation and culture Following cell sorting, we confirmed that the recovered cells belonged to the ILC1, ILC2 and
 Supplementary Methods and isolation and culture Following cell sorting, we confirmed that the recovered cells belonged to the, ILC2 and subsets. For this purpose we performed intracellular flow cytometry
Supplementary Figures
 Supplementary Figures Supplementary Figure 1 Characterization of stable expression of GlucB and sshbira in the CT26 cell line (a) Live cell imaging of stable CT26 cells expressing green fluorescent protein
Formylpeptide receptor2 contributes to colon epithelial homeostasis, inflammation, and tumorigenesis
 Supplementary Data Formylpeptide receptor2 contributes to colon epithelial homeostasis, inflammation, and tumorigenesis Keqiang Chen, Mingyong Liu, Ying Liu, Teizo Yoshimura, Wei Shen, Yingying Le, Scott
Supporting Information
 Supporting Information Aldridge et al. 10.1073/pnas.0900655106 Fig. S1. Flow diagram of sublethal (a) and lethal (b) influenza virus infections. (a) Infection of lung epithelial cells by influenza virus
Supplementary information
 Supplementary information Intrahepatic myeloid cell-aggregates enable local CD8 + T cell expansion and successful immunotherapy against chronic viral liver infection Li- Rung Huang, Dirk Wohlleber, Florian
W/T Itgam -/- F4/80 CD115. F4/80 hi CD115 + F4/80 + CD115 +
 F4/8 % in the peritoneal lavage 6 4 2 p=.15 n.s p=.76 CD115 F4/8 hi CD115 + F4/8 + CD115 + F4/8 hi CD115 + F4/8 + CD115 + MHCII MHCII Supplementary Figure S1. CD11b deficiency affects the cellular responses
Nature Immunology: doi: /ni Supplementary Figure 1. DNA-methylation machinery is essential for silencing of Cd4 in cytotoxic T cells.
 Supplementary Figure 1 DNA-methylation machinery is essential for silencing of Cd4 in cytotoxic T cells. (a) Scheme for the retroviral shrna screen. (b) Histogram showing CD4 expression (MFI) in WT cytotoxic
Endogenous TNFα orchestrates the trafficking of neutrophils into and within lymphatic vessels during acute inflammation
 SUPPLEMENTARY INFORMATION Endogenous TNFα orchestrates the trafficking of neutrophils into and within lymphatic vessels during acute inflammation Samantha Arokiasamy 1,2, Christian Zakian 1, Jessica Dilliway
AVAILABLE BIOMARKER ASSAYS
 AAILABLE BIOMARKER ASSAYS alidation Alpha-2-microglobulin ELISA Anti-CD71/anti-platelet/propidium iodide Anti-KLH IgG ELISA,, Dog, Minipig, Apoptotic, necrotic and dead cells (bone marrow) B (activated
Nature Immunology: doi: /ni Supplementary Figure 1. Examples of staining for each antibody used for the mass cytometry analysis.
 Supplementary Figure 1 Examples of staining for each antibody used for the mass cytometry analysis. To illustrate the functionality of each antibody probe, representative plots illustrating the expected
Supplementary Material
 Supplementary Material Summary: The supplementary information includes 1 table (Table S1) and 4 figures (Figure S1 to S4). Supplementary Figure Legends Figure S1 RTL-bearing nude mouse model. (A) Tumor