Supplemental Data. Article. The Role of SPINK1. in ETS Rearrangement-Negative Prostate Cancers
|
|
|
- Jonah Reynolds
- 5 years ago
- Views:
Transcription
1 Cancer Cell, Volume 13 Supplemental Data Article The Role of SPINK1 in ETS Rearrangement-Negative Prostate Cancers Scott A. Tomlins, Daniel R. Rhodes, Jianjun Yu, Sooryanarayana Varambally, Rohit Mehra, Sven Perner, Francesca Demichelis, Beth E. Helgeson, Bharathi Laxman, David S. Morris, Qi Cao, Xuhong Cao, Ove Andrén, Katja Fall, Laura Johnson, John T. Wei, Rajal B. Shah, Hikmat Al-Ahmadie, James A. Eastham, Scott E. Eggener, Samson W. Fine, Kristina Hotakainen, Ulf-Håkan Stenman, Alex Tsodikov, William L. Gerald, Hans Lilja, Victor E. Reuter, Phillip W. Kantoff, Peter T. Scardino, Mark A. Rubin, Anders S. Bjartell, and Arul M. Chinnaiyan Table S1. Meta-COPA Analysis of Seven Prostate Cancer Gene Expression Profiling Data Sets in Oncomine. Genes were ranked by the number of studies in which they scored in the top 100 outliers (ranked by COPA) at any of the three predefined percentile cutoffs (75th, 90th, and 95th). Genes were further ranked by their average COPA rank (Avg. Rank) in studies in which they ranked in the top 100.
2
3
4

5
6

7
8 Figure S1. Meta-Outlier Genes Showing Overexpression in Benign Prostate Tissue and ETS-Positive Prostate Cancers Meta-outliers, as indicated in Table 1, were analyzed for exclusive overexpression in prostate cancer compared to benign prostate tissue and mutually exclusive overexpression with ERG and ETV1. (A) The expression of meta-outlier genes ORM (ranked 4 th ) and NEB (ranked 7 th ) in normalized expression units are shown from the indicated studies, according to the sample classes described in Figure 1, revealing outlier-expression in multiple benign samples. (B) The expression of the 3 rd ranked meta-outlier gene GPR116 (left panels) and scatter plots of GPR116 vs. ERG (right panels) for all profiled samples in two studies shows co-outlier expression of GPR116 and ERG in multiple samples.
9
10 Figure S2. Overexpression of SPINK1 in Prostate Cancer Compared to Benign Prostate Tissue and Mutually Exclusive Overexpression with ERG and ETV1 in DNA Microarray Studies The expression of SPINK1 and scatter plots of SPINK1 vs. ERG and SPINK1 vs. ETV1 (if measured) for five studies profiling distinct classes of prostate tissue (A) and two studies profiling prostate cancers as part of multi-cancer studies (B) are shown as in Figure 1. Outlierexpression is delineated by the dashed gray lines (See Experimental Procedures). SPINK1 vs. ETV1 is not shown for the expo study, as no samples showed ETV1 overexpression.
11 Figure S3. Overexpression of SPINK1 in Prostate Cancer Compared to Benign Prostate Tissue and Mutually Exclusive Overexpression with ERG and ETV1 Scatter plots of ERG vs. SPINK1 (left panel) and ETV1 vs. SPINK1 (right panel) by qpcr in 10 benign prostate samples (blue), 54 localized prostate cancers (PCa, red) and 7 metastatic (Met) PCa samples (green). Log of Target gene normalized to the average of HMBS+GAPDH are plotted. Outlier-expression is delineated by the dashed gray lines (See Experimental Procedures). Figure S4. Knockdown of SPINK1 in 22RV1 Prostate Cancer Cells Attenuates Invasiveness SPINK1 mediates invasiveness in 22RV1 cells. 22RV1 cells were treated with transfection reagent alone (untreated), or transfected with non-targeting or sirna against SPINK1 as in Figure 5, or two additional sirnas directed against SPINK1 (SPINK1-b, -c), and cells were assayed for invasion. Mean (n = 3) + SEM are shown, and P values < 0.05 are indicated by asterisks.
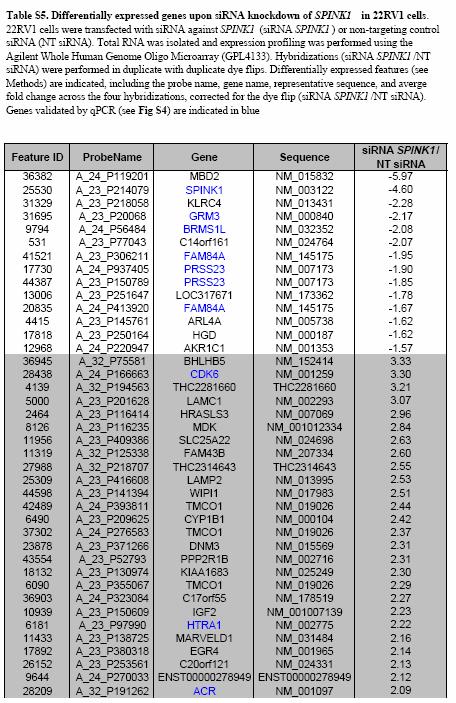
12 Figure S5. qpcr Confirmation of Genes Differentially Expressed upon SPINK1 Knockdown in 22RV1 Cells 22RV1 cells were transfected with sirna against SPINK1 (sirna sispink1) or non-targeting control sirna (NT sirna). Total RNA was isolated and expression profiling was performed using the Agilent Whole Human Genome Oligo Microarray (GPL4133). Differentially expressed features are indicated in Table S4. Selected overexpressed (A) and underexpressed (B) genes in 22RV1 sispink1 cells were assessed by quantitative PCR as shown. The amount of target gene in each sample was normalized to the amount of GAPDH. Mean (n = 3) + SEM are shown, and p values are indicated.
13 Figure S6. Identification of Genes Showing Coexpression with SPINK1 across Multiple Prostate Cancer Profiling Studies Genes showing coexpression with SPINK1 (R > 0.5) from the prostate cancer profiling studies included in the Meta-COPA analysis. SPINK1 was queried in the Oncomine database using the coexpression module. For each study, all genes showing R > 0.3 are listed, along with the corresponding feature identification. SPINK1 is indicated in red. Genes showing R > 0.3 in multiple studies are indicated in blue.
14
15 Figure S7. Meta-Outlier Analysis Summary COPA analysis was performed on 7 prostate cancer gene expression data sets in Oncomine 3.0 ( (A) First, for each data set considering all samples, gene expression values (in Oncomine normalized expression units) are median-centered per gene, setting each gene s median expression value to zero. Each bar in the figure represents an individual sample. Second, the median absolute deviation (MAD) is calculated per gene and scaled to 1 by dividing each gene expression value by its MAD. Of note, median and MAD are used for transformation as opposed to mean and standard deviation so that outlier expression values do not unduly influence the distribution estimates, and are thus preserved post-normalization. (B) Third, for each gene in each data set, COPA scores are computed as the 75 th, 90 th and 95 th percentile of the transformed gene expression values. Thus, each gene in each data set has 3 COPA scores, one at each percentile value, representing the degree of overexpression in decreasing subsets of cases. The expression of SPINK1 (outlier profile) and AMACR (typical biomarker profile) from the Glinsky et al. study are shown in the left and right panels, respectively. (C) Fourth, in each data set, all genes are rank-ordered by the 3 COPA scores, generating 3 rankordered lists of genes per data set. (D) Fifth, for each data set, we defined outlier genes as those that ranked in the top 100 COPA scores in any one of the 3 rank-ordered lists. Sixth, to identify meta-outlier genes, we ranked genes by the number of data sets where the gene was identified as an outlier gene. Genes identified as outliers in the same number of studies were further ranked by their average outlier rank across those studies.
16
17 Figure S8. Identification of Samples Showing Outlier Expression To identify individual samples showing outlier-expression in each microarray data set, we used a two step process to recreate the visual identification of the natural gap between non-outlier and outlier samples. First, gene expression values for all prostate samples in the data set (excluding metastatic prostate cancer) were median centered. Next, all samples were rank ordered in ascending order and the difference between each rank ordered sample and the preceding sample was calculated. The difference, or gap, between visually identified non-outlier and outlier populations in all studies for ERG ranged from 0.22 to 1.0 (median 0.63). Hence, we defined the first sample with a positive median centered value and greater than 0.22 normalized expression unit gap compared to the preceding sample as the transition to samples with outlier expression. Similar gaps were observed for ETV1 and SPINK1 gene expression values and the same criteria (positive median centered value and greater than 0.22 unit gap) was used to define the outlier population. Median centered expression values (in normalized expression units, z-scores) for SPINK1, ETV1 and ERG from the Glinsky_prostate data set are plotted in black. The difference between each sample and the preceding sample are plotted in red. The 0.22 gap threshold is shown in the dashed red line. Outlier populations defined by this method are indicated in blue. Range and Median gap values for each gene in all data sets is given. No gap > 0.22 units was identified for ETV1 in the GSE2109 data set.
PREPARED FOR: U.S. Army Medical Research and Materiel Command Fort Detrick, Maryland Approved for public release; distribution unlimited
 AD Award Number: W81XWH-08-1-0031 TITLE: Characterization of SPINK1 in Prostate Cancer PRINCIPAL INVESTIGATOR: Arul M. Chinnaiyan, M.D., Ph.D. CONTRACTING ORGANIZATION: University of Michigan Ann Arbor,
Module 2: Target Discovery and Validation
 Module 2: Target Discovery and Validation Table of Contents 1.1 Getting Started... 6 1.2 Nomination, validation, and associations of AGTR1 as an outlier in a subset of breast cancers... 7 1.2.1 AGTR1 discovery
I. Clinical and pathological features of the. Expression of the Selected Genes in Publicly. Available PCa Microarray Data
 Supplementary Material I. Clinical and pathological features of the Case/Control set II. III. Comparison of VOG-Δp and pfc approaches Expression of the Selected Genes in Publicly Available PCa Microarray
TITLE: Small Molecule Inhibitors of ERG and ETV1 in Prostate Cancer
 AD Award Number: W81XWH-12-1-0399 TITLE: Small Molecule Inhibitors of ERG and ETV1 in Prostate Cancer PRINCIPAL INVESTIGATOR: Colm Morrissey CONTRACTING ORGANIZATION: University of Washington Seattle WA
SUPPLEMENTARY FIGURES
 SUPPLEMENTARY FIGURES Figure S1. Clinical significance of ZNF322A overexpression in Caucasian lung cancer patients. (A) Representative immunohistochemistry images of ZNF322A protein expression in tissue
MOST: detecting cancer differential gene expression
 Biostatistics (2008), 9, 3, pp. 411 418 doi:10.1093/biostatistics/kxm042 Advance Access publication on November 29, 2007 MOST: detecting cancer differential gene expression HENG LIAN Division of Mathematical
Cancer outlier differential gene expression detection
 Biostatistics (2007), 8, 3, pp. 566 575 doi:10.1093/biostatistics/kxl029 Advance Access publication on October 4, 2006 Cancer outlier differential gene expression detection BAOLIN WU Division of Biostatistics,
Integrative Genomics Analysis Reveals Silencing of b-adrenergic Signaling by Polycomb in Prostate Cancer
 Article Integrative Genomics Analysis Reveals Silencing of b-adrenergic Signaling by Polycomb in Prostate Cancer Jindan Yu, 1 Qi Cao, 1,8 Rohit Mehra, 1,8 Bharathi Laxman, 1 Jianjun Yu, 1,5 Scott A. Tomlins,
SUPPLEMENTARY INFORMATION
 doi:.38/nature8975 SUPPLEMENTAL TEXT Unique association of HOTAIR with patient outcome To determine whether the expression of other HOX lincrnas in addition to HOTAIR can predict patient outcome, we measured
From Cancerous vs Noncancerous Prostatectomy Specimens. Urology, 83(2), 511.e1-511.e7. DOI: /j.urology
, 511.e1-511.e7. DOI: /j.urology") Cancer-associated Changes in the Expression of TMPRSS2-ERG, PCA3, and SPINK1 in Histologically Benign Tissue From Cancerous vs Noncancerous Prostatectomy Specimens. Väänänen, Riina-Minna; Lilja, Hans;
Cancer-associated Changes in the Expression of TMPRSS2-ERG, PCA3, and SPINK1 in Histologically Benign Tissue From Cancerous vs Noncancerous Prostatectomy Specimens. Väänänen, Riina-Minna; Lilja, Hans;
Supplemental Figure S1. Expression of Cirbp mrna in mouse tissues and NIH3T3 cells.
 SUPPLEMENTAL FIGURE AND TABLE LEGENDS Supplemental Figure S1. Expression of Cirbp mrna in mouse tissues and NIH3T3 cells. A) Cirbp mrna expression levels in various mouse tissues collected around the clock
CONTRACTING ORGANIZATION: The University of Michigan Ann Arbor, Michigan
 AD AWARD NUMBER: W81XWH-05-1-0173 TITLE: Tissue Microarray Assessment of Novel Prostate Cancer Biomarkers AMACR and EZH2 and Immunologic Response to Them in African-American and Caucasian Men PRINCIPAL
Nature Neuroscience: doi: /nn Supplementary Figure 1. Behavioral training.
 Supplementary Figure 1 Behavioral training. a, Mazes used for behavioral training. Asterisks indicate reward location. Only some example mazes are shown (for example, right choice and not left choice maze
Supplementary Figures
 Supplementary Figures Supplementary Figure 1 Characterization of stable expression of GlucB and sshbira in the CT26 cell line (a) Live cell imaging of stable CT26 cells expressing green fluorescent protein
WHY DO FUSIONS MATTER?
 Mini-reviews PROSTATE CANCER GENE FUSIONS MORRIS et al. BJUI BJU INTERNATIONAL The discovery and application of gene fusions in prostate cancer David S. Morris*, Scott A. Tomlins, James E. Montie* and
a) List of KMTs targeted in the shrna screen. The official symbol, KMT designation,
 List of KMTs targeted in the shrna screen. The official symbol, KMT designation,") Supplementary Information Supplementary Figures Supplementary Figure 1. a) List of KMTs targeted in the shrna screen. The official symbol, KMT designation, gene ID and specifities are provided. Those highlighted
Supplementary Information Supplementary Figures Supplementary Figure 1. a) List of KMTs targeted in the shrna screen. The official symbol, KMT designation, gene ID and specifities are provided. Those highlighted
Supplementary Information
 Supplementary Information Supplementary Figure 1. Effect of mir mimics and anti-mirs on DTPs a, Representative fluorescence microscopy images of GFP vector control or mir mimicexpressing parental and DTP
m 6 A mrna methylation regulates AKT activity to promote the proliferation and tumorigenicity of endometrial cancer
 SUPPLEMENTARY INFORMATION Articles https://doi.org/10.1038/s41556-018-0174-4 In the format provided by the authors and unedited. m 6 A mrna methylation regulates AKT activity to promote the proliferation
Using Markov Models to Estimate the Impact of New Prostate Cancer Biomarkers
 Using Markov Models to Estimate the Impact of New Prostate Cancer Biomarkers Brian Denton, PhD Associate Professor Department of Industrial and Operations Engineering February 23, 2016 Industrial and Operations
Clasificación Molecular del Cáncer de Próstata. JM Piulats
 Clasificación Molecular del Cáncer de Próstata JM Piulats Introduction The Gleason score is the major method for prostate cancer tissue grading and the most important prognostic factor in this disease.
Molecular Characterization of TMPRSS2 ERG Gene Fusion in the NCI-H660 Prostate Cancer Cell Line: A New Perspective for an Old Model 1 *
 RESEARCH ARTICLE Neoplasia. Vol. 9, No. 3, March 2007, pp. 200 206 200 www.neoplasia.com Molecular Characterization of TMPRSS2 ERG Gene Fusion in the NCI-H660 Prostate Cancer Cell Line: A New Perspective
Prostate cancer (PCA) is a major leading cause of male
 is a major leading cause of male") ORIGINAL ARTICLE TMPRSS2-ERG Fusion Prostate Cancer: An Early Molecular Event Associated With Invasion Sven Perner, MD,*w z Juan-Miguel Mosquera, MD,*w Francesca Demichelis, PhD,*w y Matthias D. Hofer,
ORIGINAL ARTICLE TMPRSS2-ERG Fusion Prostate Cancer: An Early Molecular Event Associated With Invasion Sven Perner, MD,*w z Juan-Miguel Mosquera, MD,*w Francesca Demichelis, PhD,*w y Matthias D. Hofer,
SUPPLEMENTARY INFORMATION
 DOI: 10.1038/ncb2607 Figure S1 Elf5 loss promotes EMT in mammary epithelium while Elf5 overexpression inhibits TGFβ induced EMT. (a, c) Different confocal slices through the Z stack image. (b, d) 3D rendering
Supplementary Figure 1. Repression of hepcidin expression in the liver of mice treated with
 Supplementary Figure 1. Repression of hepcidin expression in the liver of mice treated with DMN Immunohistochemistry for hepcidin and H&E staining (left). qrt-pcr assays for hepcidin in the liver (right).
SUPPLEMENTARY FIGURE LEGENDS
 SUPPLEMENTARY FIGURE LEGENDS Supplementary Figure 1 Negative correlation between mir-375 and its predicted target genes, as demonstrated by gene set enrichment analysis (GSEA). 1 The correlation between
The 16th KJC Bioinformatics Symposium Integrative analysis identifies potential DNA methylation biomarkers for pan-cancer diagnosis and prognosis
 The 16th KJC Bioinformatics Symposium Integrative analysis identifies potential DNA methylation biomarkers for pan-cancer diagnosis and prognosis Tieliu Shi tlshi@bio.ecnu.edu.cn The Center for bioinformatics
Cluster Dendrogram. dist(cor(na.omit(tss.exprs.chip[, c(1:10, 24, 27, 30, 48:50, dist(cor(na.omit(tss.exprs.chip[, c(1:99, 103, 104, 109, 110,
 A Transcriptome (RNA-seq) Transcriptome (RNA-seq) 3. 2.5 2..5..5...5..5 2. 2.5 3. 2.5 2..5..5...5..5 2. 2.5 Cluster Dendrogram RS_ES3.2 RS_ES3. RS_SHS5.2 RS_SHS5. PS_SHS5.2 PS_SHS5. RS_LJ3 PS_LJ3..4 _SHS5.2
A Panel of TMPRSS2:ERG Fusion Transcript Markers for Urine-Based Prostate Cancer Detection with High Specificity and Sensitivity
 EUROPEAN UROLOGY 59 (2011) 407 414 available at www.sciencedirect.com journal homepage: www.europeanurology.com Prostate Cancer A Panel of TMPRSS2:ERG Fusion Transcript Markers for Urine-Based Prostate
CHARACTERIZATION OF COPY NUMBER ABERRATIONS AND EPIGENETIC MODIFICATIONS IN PROSTATE CANCER. Jung H. Kim
 CHARACTERIZATION OF COPY NUMBER ABERRATIONS AND EPIGENETIC MODIFICATIONS IN PROSTATE CANCER by Jung H. Kim A dissertation submitted in partial fulfillment of the requirements for the degree of Doctor of
Fellow GU Lecture Series, Prostate Cancer. Asit Paul, MD, PhD 02/20/2018
 Fellow GU Lecture Series, 2018 Prostate Cancer Asit Paul, MD, PhD 02/20/2018 Disease Burden Screening Risk assessment Treatment Global Burden of Prostate Cancer Prostate cancer ranked 13 th among cancer
Mechanistic Rationale for Inhibition of Poly(ADP-Ribose) Polymerase in ETS Gene Fusion-Positive Prostate Cancer
 Polymerase in ETS Gene Fusion-Positive Prostate Cancer") Article Mechanistic Rationale for Inhibition of Poly(ADP-Ribose) Polymerase in Gene Fusion-Positive Prostate Cancer J. Chad Brenner,,2,3, Bushra Ateeq,,2, Yong Li,,2 Anastasia K. Yocum,,2,8 Qi Cao,,2 Irfan
Article Mechanistic Rationale for Inhibition of Poly(ADP-Ribose) Polymerase in Gene Fusion-Positive Prostate Cancer J. Chad Brenner,,2,3, Bushra Ateeq,,2, Yong Li,,2 Anastasia K. Yocum,,2,8 Qi Cao,,2 Irfan
Supplementary Figure 1: Tissue of Origin analysis on 152 cell lines. (a) Heatmap representation of the 30 Tissue scores for the 152 cell lines.
 Heatmap representation of the 30 Tissue scores for the 152 cell lines.") Supplementary Figure 1: Tissue of Origin analysis on 152 cell lines. (a) Heatmap representation of the 30 Tissue scores for the 152 cell lines. The scores summarize the global expression of the tissue
Supplementary Figure 1: Tissue of Origin analysis on 152 cell lines. (a) Heatmap representation of the 30 Tissue scores for the 152 cell lines. The scores summarize the global expression of the tissue
TITLE: Discovery of Novel Gene Elements Associated With Prostate Cancer Progression
 AD Award Number: W81XWH-11-1-0337 TITLE: Discovery of Novel Gene Elements Associated With Prostate Cancer Progression PRINCIPAL INVESTIGATOR: Arul M. Chinnaiyan, M.D., Ph.D. CONTRACTING ORGANIZATION: University
Nature Genetics: doi: /ng Supplementary Figure 1. SEER data for male and female cancer incidence from
 Supplementary Figure 1 SEER data for male and female cancer incidence from 1975 2013. (a,b) Incidence rates of oral cavity and pharynx cancer (a) and leukemia (b) are plotted, grouped by males (blue),
Supplementary Figure 1. HeliScope CAGE revealed androgen-regulated signaling and differentially regulated promoters in hormone-refractory prostate
 Supplementary Figure 1. HeliScope CAGE revealed androgen-regulated signaling and differentially regulated promoters in hormone-refractory prostate cancer cells. (a) Cell proliferation of BicR cells in
Supplementary Information and Figure legends
 Supplementary Information and Figure legends Table S1. Primers for quantitative RT-PCR Target Sequence (5 -> 3 ) Target Sequence (5 -> 3 ) DAB2IP F:TGGACGATGTGCTCTATGCC R:GGATGGTGATGGTTTGGTAG Snail F:CCTCCCTGTCAGATGAGGAC
Supplementary Figure 1
 Supplementary Figure 1 Asymmetrical function of 5p and 3p arms of mir-181 and mir-30 families and mir-142 and mir-154. (a) Control experiments using mirna sensor vector and empty pri-mirna overexpression
RECENT ADVANCES IN THE MOLECULAR DIAGNOSIS OF BREAST CANCER
 Technology Transfer in Diagnostic Pathology. 6th Central European Regional Meeting. Cytopathology. Balatonfüred, Hungary, April 7-9, 2011. RECENT ADVANCES IN THE MOLECULAR DIAGNOSIS OF BREAST CANCER Philippe
Zurich Open Repository and Archive. EML4-ALK fusion lung cancer: a rare acquired event
 University of Zurich Zurich Open Repository and Archive Winterthurerstr. 190 CH-8057 Zurich http://www.zora.uzh.ch Year: 2008 EML4-ALK fusion lung cancer: a rare acquired event Perner, S; Wagner, P L;
Nature Medicine: doi: /nm.3967
 Supplementary Figure 1. Network clustering. (a) Clustering performance as a function of inflation factor. The grey curve shows the median weighted Silhouette widths for varying inflation factors (f [1.6,
How to detect and investigate Prostate Cancer before TRT
 How to detect and investigate Prostate Cancer before TRT Frans M.J. Debruyne Professor of Urology Andros Men s Health Institutes, The Netherlands Bruges, 25-26 September 2014 PRISM Recommendations for
AWARD NUMBER: W81XWH TITLE: Biological and Clinical Characterization of Novel lncrnas Associated with Metastatic Prostate Cancer
 AWARD NUMBER: W81XWH-13-1-284 TITLE: Biological and Clinical Characterization of Novel lncrnas Associated with Metastatic Prostate Cancer PRINCIPAL INVESTIGATOR: Rohit Malik, Ph.D. CONTRACTING ORGANIZATION:
Impact of Prognostic Factors
 Melanoma Prognostic Factors: where we started, where are we going? Impact of Prognostic Factors Staging Management Surgical intervention Adjuvant treatment Suraj Venna, MD Assistant Clinical Professor,
Supplementary Material
 Supplementary Material Identification of mir-187 and mir-182 as biomarkers for early diagnosis and prognosis in prostate cancer patients treated with radical prostatectomy Irene Casanova-Salas 1, José
2.75: 84% 2.5: 80% 2.25: 78% 2: 74% 1.75: 70% 1.5: 66% 1.25: 64% 1.0: 60% 0.5: 50% 0.25: 25% 0: 0%
 Capstone Test (will consist of FOUR quizzes and the FINAL test grade will be an average of the four quizzes). Capstone #1: Review of Chapters 1-3 Capstone #2: Review of Chapter 4 Capstone #3: Review of
Outline. Outline. Phillip G. Febbo, MD. Genomic Approaches to Outcome Prediction in Prostate Cancer
 Genomic Approaches to Outcome Prediction in Prostate Cancer Phillip G. Febbo, MD Duke Institute for Genome Science and Policy Department of Medicine Department of Molecular Genetics and Microbiology Duke
Guangdong Medical University, Zhanjiang, China; 5 Guangxi Medical University, Nanning, China; 6 Department of Pathology, University of Michigan
 Overexpression of FAM83H-AS1 indicates poor patient survival and knockdown impairs cell proliferation and invasion via MET/EGFR signaling in lung cancer Jie Zhang 1,2, Shumei Feng 3, Wenmei Su 4, Shengbin
File Name: Supplementary Information Description: Supplementary Figures and Supplementary Tables. File Name: Peer Review File Description:
 File Name: Supplementary Information Description: Supplementary Figures and Supplementary Tables File Name: Peer Review File Description: Primer Name Sequence (5'-3') AT ( C) RT-PCR USP21 F 5'-TTCCCATGGCTCCTTCCACATGAT-3'
Supplementary. properties of. network types. randomly sampled. subsets (75%
 Supplementary Information Gene co-expression network analysis reveals common system-level prognostic genes across cancer types properties of Supplementary Figure 1 The robustness and overlap of prognostic
mir-509-5p and mir-1243 increase the sensitivity to gemcitabine by inhibiting
 mir-509-5p and mir-1243 increase the sensitivity to gemcitabine by inhibiting epithelial-mesenchymal transition in pancreatic cancer Hidekazu Hiramoto, M.D. 1,3, Tomoki Muramatsu, Ph.D. 1, Daisuke Ichikawa,
Supplementary Figure 1: High-throughput profiling of survival after exposure to - radiation. (a) Cells were plated in at least 7 wells in a 384-well
 Cells were plated in at least 7 wells in a 384-well") Supplementary Figure 1: High-throughput profiling of survival after exposure to - radiation. (a) Cells were plated in at least 7 wells in a 384-well plate at cell densities ranging from 25-225 cells in
Supplementary Figure 1: High-throughput profiling of survival after exposure to - radiation. (a) Cells were plated in at least 7 wells in a 384-well plate at cell densities ranging from 25-225 cells in
Lentiviral Delivery of Combinatorial mirna Expression Constructs Provides Efficient Target Gene Repression.
 Supplementary Figure 1 Lentiviral Delivery of Combinatorial mirna Expression Constructs Provides Efficient Target Gene Repression. a, Design for lentiviral combinatorial mirna expression and sensor constructs.
Comparison of open chromatin regions between dentate granule cells and other tissues and neural cell types.
 Supplementary Figure 1 Comparison of open chromatin regions between dentate granule cells and other tissues and neural cell types. (a) Pearson correlation heatmap among open chromatin profiles of different
Case Studies on High Throughput Gene Expression Data Kun Huang, PhD Raghu Machiraju, PhD
 Case Studies on High Throughput Gene Expression Data Kun Huang, PhD Raghu Machiraju, PhD Department of Biomedical Informatics Department of Computer Science and Engineering The Ohio State University Review
T H E J O U R N A L O F C E L L B I O L O G Y
 Supplemental material Díaz et al., http://www.jcb.org/cgi/content/full/jcb.201209151/dc1 T H E J O U R N A L O F C E L L B I O L O G Y Figure S1. Hypoxia induces invadopodia formation in different epithelial
Supplementary information
 Supplementary information Human Cytomegalovirus MicroRNA mir-us4-1 Inhibits CD8 + T Cell Response by Targeting ERAP1 Sungchul Kim, Sanghyun Lee, Jinwook Shin, Youngkyun Kim, Irini Evnouchidou, Donghyun
Supplementary Figure 1: Digitoxin induces apoptosis in primary human melanoma cells but not in normal melanocytes, which express lower levels of the
 Supplementary Figure 1: Digitoxin induces apoptosis in primary human melanoma cells but not in normal melanocytes, which express lower levels of the cardiac glycoside target, ATP1A1. (a) The percentage
7SK ChIRP-seq is specifically RNA dependent and conserved between mice and humans.
 Supplementary Figure 1 7SK ChIRP-seq is specifically RNA dependent and conserved between mice and humans. Regions targeted by the Even and Odd ChIRP probes mapped to a secondary structure model 56 of the
Supplementary Materials for
 www.sciencesignaling.org/cgi/content/full/8/375/ra41/dc1 Supplementary Materials for Actin cytoskeletal remodeling with protrusion formation is essential for heart regeneration in Hippo-deficient mice
Nature Getetics: doi: /ng.3471
 Supplementary Figure 1 Summary of exome sequencing data. ( a ) Exome tumor normal sample sizes for bladder cancer (BLCA), breast cancer (BRCA), carcinoid (CARC), chronic lymphocytic leukemia (CLLX), colorectal
 DOI: 10.1038/ncb2210 b. ICAM1 ng ml -1 P = 0.0001 Small RNA (15-30nts) ng ml -1 Cell Lysate Exosome HDL Plasma HDL Normal Human HDL mirnas R = 0.45 P < 0.0001 Normal Human Exosome mirnas Figure S1. Characterization
PREPARED FOR: U.S. Army Medical Research and Materiel Command Fort Detrick, Maryland
 AD Award Number: W81XWH-8-1-11 TITLE: A Search for Gene Fusions/Translocations in Breast Cancer PRINCIPAL INVESTIGATOR: Arul M. Chinnaiyan, M.D., Ph.D. CONTRACTING ORGANIZATION: University of Michigan
SUPPLEMENTAL FILE. mir-22 and mir-29a are members of the androgen receptor cistrome modulating. LAMC1 and Mcl-1 in prostate cancer
 1 SUPPLEMENTAL FILE 2 3 mir-22 and mir-29a are members of the androgen receptor cistrome modulating LAMC1 and Mcl-1 in prostate cancer 4 5 6 Lorenza Pasqualini 1, Huajie Bu 1,2, Martin Puhr 1, Narisu Narisu
Supplementary Figure 1. ALVAC-protein vaccines and macaque immunization. (A) Maximum likelihood
 Maximum likelihood") Supplementary Figure 1. ALVAC-protein vaccines and macaque immunization. (A) Maximum likelihood tree illustrating CRF01_AE gp120 protein sequence relationships between 107 Envs sampled in the RV144 trial
Supplementary Figure 1. ALVAC-protein vaccines and macaque immunization. (A) Maximum likelihood tree illustrating CRF01_AE gp120 protein sequence relationships between 107 Envs sampled in the RV144 trial
TEB. Id4 p63 DAPI Merge. Id4 CK8 DAPI Merge
 a Duct TEB b Id4 p63 DAPI Merge Id4 CK8 DAPI Merge c d e Supplementary Figure 1. Identification of Id4-positive MECs and characterization of the Comma-D model. (a) IHC analysis of ID4 expression in the
PSA and the Future. Axel Heidenreich, Department of Urology
 PSA and the Future Axel Heidenreich, Department of Urology PSA and Prostate Cancer EAU Guideline 2011 PSA is a continuous variable PSA value (ng/ml) risk of PCa, % 0 0.5 6.6 0.6 1 10.1 1.1 2 17.0 2.1 3
Supplementary Figure 1. Quantile-quantile (Q-Q) plots. (Panel A) Q-Q plot graphical
 plots. (Panel A) Q-Q plot graphical") Supplementary Figure 1. Quantile-quantile (Q-Q) plots. (Panel A) Q-Q plot graphical representation using all SNPs (n= 13,515,798) including the region on chromosome 1 including SORT1 which was previously
Supplementary Figure 1. Quantile-quantile (Q-Q) plots. (Panel A) Q-Q plot graphical representation using all SNPs (n= 13,515,798) including the region on chromosome 1 including SORT1 which was previously
*Applied Molecular Oncology, Ontario Cancer Institute, Princess Margaret Hospital, Toronto, Ontario, Canada;
 RESEARCH ARTICLE Neoplasia. Vol. 8, No. 6, June 2006, pp. 465 469 465 www.neoplasia.com Three-Color FISH Analysis of TMPRSS2/ERG Fusions in Prostate Cancer Indicates That Genomic Microdeletion of Chromosome
SUPPLEMENTARY INFORMATION
 doi:10.1038/nature10866 a b 1 2 3 4 5 6 7 Match No Match 1 2 3 4 5 6 7 Turcan et al. Supplementary Fig.1 Concepts mapping H3K27 targets in EF CBX8 targets in EF H3K27 targets in ES SUZ12 targets in ES
Supplementary Information Titles Journal: Nature Medicine
 Supplementary Information Titles Journal: Nature Medicine Article Title: Corresponding Author: Supplementary Item & Number Supplementary Fig.1 Fig.2 Fig.3 Fig.4 Fig.5 Fig.6 Fig.7 Fig.8 Fig.9 Fig. Fig.11
Supplementary Figure 1 Induction of cellular senescence and isolation of exosome. a to c, Pre-senescent primary normal human diploid fibroblasts
 Supplementary Figure 1 Induction of cellular senescence and isolation of exosome. a to c, Pre-senescent primary normal human diploid fibroblasts (TIG-3 cells) were rendered senescent by either serial passage
Effects of UBL5 knockdown on cell cycle distribution and sister chromatid cohesion
 Supplementary Figure S1. Effects of UBL5 knockdown on cell cycle distribution and sister chromatid cohesion A. Representative examples of flow cytometry profiles of HeLa cells transfected with indicated
A prostate cancer susceptibility allele at 6q22 increases RFX6 expression by modulating HOXB13 chromatin binding
 Supplementary Information A prostate cancer susceptibility allele at 6q22 increases RFX6 expression by modulating HOXB13 chromatin binding Qilai Huang 1,2*, Thomas Whitington 3,4*, Ping Gao 1,2, Johan
Integrative Microarray Analysis of Pathways Dysregulated in Metastatic Prostate Cancer
 Research Article Integrative Microarray Analysis of Pathways Dysregulated in Metastatic Prostate Cancer Sunita R. Setlur, 1,2 Thomas E. Royce, 4,5 Andrea Sboner, 4 Juan-Miguel Mosquera, 1,2 Francesca Demichelis,
Expert-guided Visual Exploration (EVE) for patient stratification. Hamid Bolouri, Lue-Ping Zhao, Eric C. Holland
 for patient stratification. Hamid Bolouri, Lue-Ping Zhao, Eric C. Holland") Expert-guided Visual Exploration (EVE) for patient stratification Hamid Bolouri, Lue-Ping Zhao, Eric C. Holland Oncoscape.sttrcancer.org Paul Lisa Ken Jenny Desert Eric The challenge Given - patient clinical
Expert-guided Visual Exploration (EVE) for patient stratification Hamid Bolouri, Lue-Ping Zhao, Eric C. Holland Oncoscape.sttrcancer.org Paul Lisa Ken Jenny Desert Eric The challenge Given - patient clinical
Soft Agar Assay. For each cell pool, 100,000 cells were resuspended in 0.35% (w/v)
") SUPPLEMENTARY MATERIAL AND METHODS Soft Agar Assay. For each cell pool, 100,000 cells were resuspended in 0.35% (w/v) top agar (LONZA, SeaKem LE Agarose cat.5004) and plated onto 0.5% (w/v) basal agar.
SUPPLEMENTARY MATERIAL AND METHODS Soft Agar Assay. For each cell pool, 100,000 cells were resuspended in 0.35% (w/v) top agar (LONZA, SeaKem LE Agarose cat.5004) and plated onto 0.5% (w/v) basal agar.
Supplementary Methods
 Supplementary Methods Analysis of time course gene expression data. The time course data of the expression level of a representative gene is shown in the below figure. The trajectory of longitudinal expression
Tel: ; Fax: ;
 Tel.: +98 216 696 9291; Fax: +98 216 696 9291; E-mail: mrasadeghi@pasteur.ac.ir Tel: +98 916 113 7679; Fax: +98 613 333 6380; E-mail: abakhshi_e@ajums.ac.ir A Soluble Chromatin-bound MOI 0 1 5 0 1 5 HDAC2
PROSTATIC ADENOCARCINOMA: DIAGNOSTIC CRITERIA AND IMPORTANT MIMICKERS PROSTATIC ADENOCARCINOMA: DIAGNOSTIC CRITERIA
 PROSTATIC ADENOCARCINOMA: DIAGNOSTIC CRITERIA AND IMPORTANT MIMICKERS PROSTATIC ADENOCARCINOMA: DIAGNOSTIC CRITERIA 1 A good H & E helps! ADENOCARCINOMA DIAGNOSTIC CRITERIA Relatively uniform proliferation
Supplementary Figures
 Supplementary Figures Supplementary Fig. 1. Galectin-3 is present within tumors. (A) mrna expression levels of Lgals3 (galectin-3) and Lgals8 (galectin-8) in the four classes of cell lines as determined
Functional genomics reveal that the serine synthesis pathway is essential in breast cancer
 Functional genomics reveal that the serine synthesis pathway is essential in breast cancer Results Presented by Stacey Lin Lloyd Lab http://www.amsbio.com/expression-ready-lentiviral-particles.aspx Overview
fl/+ KRas;Atg5 fl/+ KRas;Atg5 fl/fl KRas;Atg5 fl/fl KRas;Atg5 Supplementary Figure 1. Gene set enrichment analyses. (a) (b)
 (b)") KRas;At KRas;At KRas;At KRas;At a b Supplementary Figure 1. Gene set enrichment analyses. (a) GO gene sets (MSigDB v3. c5) enriched in KRas;Atg5 fl/+ as compared to KRas;Atg5 fl/fl tumors using gene set
KRas;At KRas;At KRas;At KRas;At a b Supplementary Figure 1. Gene set enrichment analyses. (a) GO gene sets (MSigDB v3. c5) enriched in KRas;Atg5 fl/+ as compared to KRas;Atg5 fl/fl tumors using gene set
Supplementary Figure 1: Additional metabolic parameters of obesity mouse models and controls. (a) Body weight, (b) blood glucose and (c) insulin
 Body weight, (b) blood glucose and (c) insulin") Supplementary Figure 1: Additional metabolic parameters of obesity mouse models and controls. (a) Body weight, (b) blood glucose and (c) insulin resistance index of homeostatic model assessment (HOMA IR)
Supplementary Figure 1: Additional metabolic parameters of obesity mouse models and controls. (a) Body weight, (b) blood glucose and (c) insulin resistance index of homeostatic model assessment (HOMA IR)
Supplemental Information. Menin Deficiency Leads to Depressive-like. Behaviors in Mice by Modulating. Astrocyte-Mediated Neuroinflammation
 Neuron, Volume 100 Supplemental Information Menin Deficiency Leads to Depressive-like Behaviors in Mice by Modulating Astrocyte-Mediated Neuroinflammation Lige Leng, Kai Zhuang, Zeyue Liu, Changquan Huang,
The ubiquitin ligase TRIM25 targets ERG for degradation in prostate cancer
 /, Vol. 7, No. 40 The ubiquitin ligase TRIM25 targets ERG for degradation in prostate cancer Shan Wang 1,2, Rahul K. Kollipara 1, Caroline G. Humphries 1, Shi-Hong Ma 2, Ryan Hutchinson 2, Rui Li 2, Javed
Supplementary Materials
 Supplementary Materials Supplementary Figure S1 Regulation of Ubl4A stability by its assembly partner A, The translation rate of Ubl4A is not affected in the absence of Bag6. Control, Bag6 and Ubl4A CRISPR
Title: Human breast cancer associated fibroblasts exhibit subtype specific gene expression profiles
 Author's response to reviews Title: Human breast cancer associated fibroblasts exhibit subtype specific gene expression profiles Authors: Julia Tchou (julia.tchou@uphs.upenn.edu) Andrew V Kossenkov (akossenkov@wistar.org)
Characterization of Bone Metastases from Rapid Autopsies of Prostate Cancer Patients
 Human Cancer Biology Clinical Cancer Research Characterization of Bone Metastases from Rapid Autopsies of Prostate Cancer Patients Rohit Mehra 1,4,6, Chandan Kumar-Sinha 1,6, Sunita Shankar 1,6, Robert
Review Article Long Noncoding RNA H19 in Digestive System Cancers: A Meta-Analysis of Its Association with Pathological Features
 BioMed Research International Volume 2016, Article ID 4863609, 8 pages http://dx.doi.org/10.1155/2016/4863609 Review Article Long Noncoding RNA H19 in Digestive System Cancers: A Meta-Analysis of Its Association
SUPPLEMENTARY INFORMATION
 DOI: 1.138/ncb3355 a S1A8 + cells/ total.1.8.6.4.2 b S1A8/?-Actin c % T-cell proliferation 3 25 2 15 1 5 T cells Supplementary Figure 1 Inter-tumoral heterogeneity of MDSC accumulation in mammary tumor
HHS Public Access Author manuscript Oncogene. Author manuscript; available in PMC 2011 March 30.
 The neuronal repellent SLIT2 is a target for repression by EZH2 in prostate cancer Jindan Yu #,1,2,3, Qi Cao 1,2, Jianjun Yu 1, Longtao Wu #, Ashraf Dallol 6, James Li 1, Guoan Chen 1, Catherine Grasso
(A) Cells grown in monolayer were fixed and stained for surfactant protein-c (SPC,
 Cells grown in monolayer were fixed and stained for surfactant protein-c (SPC,") Supplemental Figure Legends Figure S1. Cell line characterization (A) Cells grown in monolayer were fixed and stained for surfactant protein-c (SPC, green) and co-stained with DAPI to visualize the nuclei.
Supplemental Figure Legends Figure S1. Cell line characterization (A) Cells grown in monolayer were fixed and stained for surfactant protein-c (SPC, green) and co-stained with DAPI to visualize the nuclei.
Module 3: Pathway and Drug Development
 Module 3: Pathway and Drug Development Table of Contents 1.1 Getting Started... 6 1.2 Identifying a Dasatinib sensitive cancer signature... 7 1.2.1 Identifying and validating a Dasatinib Signature... 7
Expression and Function of ETS Genes in Prostate Cancer
 Expression and Function of ETS Genes in Prostate Cancer Delila Gasi Tandefelt The studies described in this thesis were performed at the Department of Pathology of the Josephine Nefkens Institute, Erasmus
Supplementary Figures
 Supplementary Figures Supplementary Figure 1. H3F3B expression in lung cancer. a. Comparison of H3F3B expression in relapsed and non-relapsed lung cancer patients. b. Prognosis of two groups of lung cancer
Genomic Loss of microrna-101 Leads to Overexpression of Histone Methyltransferase EZH2 in Cancer
 www.sciencemag.org/cgi/content/full/1165395/dc1 Supporting Online Material for Genomic Loss of microrna-11 Leads to Overexpression of Histone Methyltransferase EZH2 in Cancer Sooryanarayana Varambally,
Supplement to SCnorm: robust normalization of single-cell RNA-seq data
 Supplement to SCnorm: robust normalization of single-cell RNA-seq data Supplementary Note 1: SCnorm does not require spike-ins, since we find that the performance of spike-ins in scrna-seq is often compromised,
Supplementary Information
 Supplementary Information An orally available, small-molecule interferon inhibits viral replication Hideyuki Konishi 1, Koichi Okamoto 1, Yusuke Ohmori 1, Hitoshi Yoshino 2, Hiroshi Ohmori 1, Motooki Ashihara
Nature Medicine: doi: /nm.2109
 HIV 1 Infects Multipotent Progenitor Cells Causing Cell Death and Establishing Latent Cellular Reservoirs Christoph C. Carter, Adewunmi Onafuwa Nuga, Lucy A. M c Namara, James Riddell IV, Dale Bixby, Michael
SUPPLEMENTARY APPENDIX
 SUPPLEMENTARY APPENDIX 1) Supplemental Figure 1. Histopathologic Characteristics of the Tumors in the Discovery Cohort 2) Supplemental Figure 2. Incorporation of Normal Epidermal Melanocytic Signature