A prostate cancer susceptibility allele at 6q22 increases RFX6 expression by modulating HOXB13 chromatin binding
|
|
|
- Alexia Harrell
- 5 years ago
- Views:
Transcription
1 Supplementary Information A prostate cancer susceptibility allele at 6q22 increases RFX6 expression by modulating HOXB13 chromatin binding Qilai Huang 1,2*, Thomas Whitington 3,4*, Ping Gao 1,2, Johan F. Lindberg 4, Yuehong Yang 1,2, Jielin Sun 5, Marja-Riitta Väisänen 6, Robert Szulkin 4, Matti Annala 7, Jian Yan 3, Lars A. Egevad 8, Kai Zhang 1,2, Ruizhu Lin 1,2, Arttu Jolma 3,9, Matti Nykter 7, Aki Manninen 1,2, Fredrik Wiklund 4, Markku H. Vaarala 6,10, Tapio Visakorpi 7, Jianfeng Xu 5, Jussi Taipale 3,9# & Gong-Hong Wei 1,2# *These authors contributed equally to this work. # To whom correspondence and request for materials should be addressed to G.H.W. (gonghong.wei@oulu.fi) or J. T. (jussi.taipale@ki.se). Affiliations: 1 Biocenter Oulu, University of Oulu, Oulu, Finland 2 Department of Medical Biochemistry and Molecular Biology, Institute of Biomedicine, University of Oulu, Oulu, Finland 3 Department of Biosciences and Nutrition, Karolinska Institutet, Stockholm, Sweden 4 Department of Medical Epidemiology and Biostatistics, Karolinska Institutet, Stockholm, Sweden 5 Center for Cancer Genomics, Wake Forest School of Medicine, Winston-Salem, USA 6 Department of Pathology, Oulu University Hospital, Oulu, Finland 7 Prostate Cancer Research Center, Institute of Biomedical Technology and BioMediTech, University of Tampere and Tampere University Hospital, Finland 8 Department of Pathology and Cytology, Karolinska University Hospital, Stockholm, Sweden 9 Genome-Scale Biology Program, University of Helsinki, Helsinki, Finland 10 Medical Research Center Oulu, Oulu, Finland 1
2 This supplementary PDF file contains the following information: Supplementary Figures 1-14 Supplementary References Notes: Other Supplementary Materials for this manuscript includes the following: Supplementary Tables 1-12 (separately uploaded) Supplementary Table 1 GWAS vs ChIP-seq Supplementary Table 2 SNP-PWM match Supplementary Table 3 Tampere gene expression Supplementary Table 4 Swedish gene expression for rs eqtl analysis Supplementary Table 5 Clinical datasets of gene expression Supplementary Table 6 SNP genotyping at 6q22 Supplementary Table 7 Taylor clinical samples Supplementary Table 8 TCGA clinical samples Supplementary Table 9 Oligonucleotides used in this study Supplementary Table 10 Gene cloning and related primers Supplementary Table 11 Antibodies Supplementary Table 12 Target sequences of sirna and shrna Supplementary Data Set 1 (separately uploaded) Supplementary Data Set 1 Transcription factor position-weight matrix Inventory of Supplementary Figures and Tables Supplementary Figure 2 and Supplementary Table 1 relate to Figures 1 Supplementary Figure 3 and 4 relate to Figures 2 Supplementary Figure 5-9 and Supplementary Table 3-6 relate to Figures 3 Supplementary Figure 10 and 11 relate to Figures 4 Supplementary Figure 12-14, Supplementary Table 3-5, 7, 8 relate to Figures 5 2
3 3
4 Supplementary Figure 1: The homeodomain protein HOXB13 is a prostatelineage-specific transcription factor. (a) The tissue-specific pattern of HOXB13 mrna expression in a panel of 79 human tissues (GSE1133) 11,53. (b) HOXB13 mrna expression levels were determined in a set of 184 human primary tumor samples representing several distinct cancer types including prostate cancer 11,53. The expression levels of HOXB13 were determined by designed custom arrays including the vast majority of protein-coding genes in human genome 11. Note that HOXB13 is specifically and highly expressed in normal prostate gland and prostate tumors, in contrast to other normal human tissues (a) or tumors derived from different cancer types (b). 4
5 5
6 Supplementary Figure 2: The binding specificities of HOX transcription factors, AR and FOXA1 to the DNA sequences harboring the prostate cancer risk-associated SNP rs (a) Relative binding affinity of 19 HOX transcription factors to the DNA sequences harboring risk T allele of rs The binding affinities were measured using the luciferase-based DNA binding assay 21. Error bars, ± s.d. (n = 6 technical replicates). Note that, in contrast to other HOX members, HOXB13 indicate the strongest binding affinity to the DNA sequences harboring the rs T allele measured by Renilla luciferase activity. (b-d) EMSA for the binding activity of HOXB13 (b), AR (c) or FOXA1 (d) to the HOXB13 DNA-binding consensus sequences harboring the SNP rs Double-stranded FAM labeled HOXB13 consensus DNA was incubated with COS-1 cell nuclear extract with ectopically expressed protein as indicated. Note that rs T allele shows stronger binding affinity for HOXB13 than the C allele. In contrast, we observed no any binding activity of AR (c) or FOXA1 (d) to the HOXB13 DNA-binding consensus, as indicated by nonspecific bands in (c) or (d). The boiled/denatured COS-1 cell nuclear extract containing HOXB13 recombinant proteins does not show any binding activity to the HOXB13 DNA-binding consensus (lane 8 in b). Lane 1 represents negative control. The binding of HOXB13 consensus sequence to human recombinant HOXB13 protein (lane 2) is competed by a scrambled sequence (lane 3) and by the sequence containing the rs T allele (lane 4) and C allele (lane 5), the permutation of A base (lane 6) and G base (lane 7) at the same chromosome location as rs339331, and the lane 8 in b represents the results from the incubation of the HOXB13 DNA-binding consensus oligos with the boiled COS-1 cell nuclear extract containing ectopically expressed HOXB13 proteins. 6
7 Supplementary Figure 3: ChIP-qPCR confirmation of HOXB13 chromatin binding to the rs enhancer at the prostate cancer 6q22 risk locus. (a) ChIP-qPCR analysis confirmed the HOXB13 chromatin binding to an rs containing region and a positive 7
8 enhancer control in prostate cancer cell VCaP under different treatments. Error bars, ± s.d. (n = 3 technical replicates). ** P < 0.01, *** P < Eth means ethanol treatment for 24 hours; R1881, 1nM synthetic androgen methyltrienolone (R1881) treatment for 24 hours; and, DHT, 100nM dihydrotestosterone (DHT) treatment for 24 hours. (b) HOXB13 favors binding to the risk allele T at rs determined by ChIP followed by allele-specific quantitative PCR (ChIP-AS-qPCR; see also Fig. 1b). The qpcr primers were designed for allele-specific amplification of the rs region harboring T (red) or C allele (blue). Error bars, ± s.d. (n = 3 technical replicates). * P < 0.05, ** P < (c) ChIP-qPCR analysis of epigenetic signatures at a silent chromatin region. Note that the repressive histone mark H3K27me3 alone shows a strong enrichment at given silent chromatin region. Error bars, ± s.d. n = 3 technical replicates. *** P < compared to IgG control. In a-c, the P values were assessed using two-tailed Student s t-test. (d-e) Shown are genome browser representations of HOXB13, H3K27ac/me3 and H3K4me1 enrichment profiles determined by ChIP-seq in VCaP cells, indicating a positive enhancer region at the prostate specific antigen (PSA, also called KLK3) locus 54 (d), and a silent chromatin region with repressive mark H3K27me3 (e), a histone modification associated with polycomb silencing 55. Abbreviations: H3K4me1, the monomethylation of histone H3 at lysine 4; H3K27ac, the acetylation of histone H3 at lysine 27; and H3K27me3, the trimethylation of histone H3 at lysine 27. 8

9 Supplementary Figure 4: Cell type-specificity and allele-specific differences in chromatin state of rs enhancer at prostate cancer susceptibility 6q22 locus. (a) FAIRE-qPCR assays were performed in prostate cancer cell 22Rv1 to map open chromatin 9
10 state and nucleosome occupancy at rs centered 8kb region of 6q22 locus (indicated by chromosome coordinate, build, hg19). Fold enrichment was calculated as a ratio of the signal from the FAIRE sample relative to the signal from input control DNA by qpcr. The primer sets and amplicons are indicated as red arrows. FAIRE refers to formaldehyde-assisted isolation of regulatory elements 28,29. Note that the strongest FAIRE signals were observed at rs region. Error bars, ± s.d. n = 3 technical replicates. (b) Evidence from the ENCODE project indicating that rs is locating at a prostate cancer cell-type-specific open chromatin region. Top: Shown is DNase-seq signals in LNCaP cells and other 10 non-prostate cancer cell models from the ENCODE project 30,31. Bottom: Shown is FAIRE-seq signals in 5 different cell lines from the ENCODE project. The exact chromosome position of rs is highlighted by a vertical line. Both DNase-seq and FAIRE-seq can define regulatory elements with cell-type-specific open chromatin state 56. Note that a strong DNase-seq signal at rs region was specifically observed in prostate cancer cell line LNCaP, further suggesting this is a prostate cancer cell-type-specific enhancer. In addition, LNCaP DNaseseq result at rs is well consistent with our FAIRE-qPCR results (see panel a and Fig. 2g) and ChIP-seq profiles for HOXB13 and active enhancer marks H3K4me1 and H3K27ac 26,27,57 (see Fig. 1d and 2f). (c) Allele-specific differences in chromatin state of the rs enhancer. Sanger sequencing profiles of FAIRE and input DNA for the region around rs revealed that the T risk allele is enriched in the open chromatin fragments compared to input DNA in both VCaP and 22Rv1 cells. (d) ChIP-AS-qPCR reveals the preference of HOXB13 binding to the rs risk allele T in 22Rv1 cells (see also Fig. 2b and Supplementary Fig. 3b in VCaP cells). Note that the occupancy of HOXB13 to the rs region with T allele is significantly increased in response to DHT treatment. (e) Allele specificity of chromatin state at rs region. The FAIRE signals at rs region with T or C allele were examined using AS-qPCR. Note that the FAIRE signals are significantly higher at rs region with T allele in comparison with C allele. Overall, androgen treatment induces chromatin opening while the change at T allele is prominent (indicated by grey line). This analysis together with the observation in (c), suggest that the variation at rs may alter the chromatin opening states at this locus. Furthermore, the preference of HOXB13 occupancy at rs region harboring T risk allele (d) may contribute to enhanced chromatin opening at the same allele. In (d) and (e), Error bars, ± s.d. (n = 3 technical replicates). (f) Luciferase reporter assays showing increased enhancer activity of rs T over C alleles in VCaP. Note that androgen treatment stimulates rs T enhancer activity. The fragment of the enhancer used here is rs centered 600bp region (chr6: ). Error bars, ± s.d. (n = 4 technical replicates). In d-f, * P < 0.05, ** P < 0.01, ***P < were evaluated using two-tailed Student s t-test. 10
11 Supplementary Figure 5: The expression status of RFX6, GPRC6A and HOXB13 in human prostate tumors. (a) RFX6 expression levels in a clinical dataset of 57 human prostate tumors reported in Grasso et al. 35 The "Fold change" value pertains to the specified sample relative to a pooled benign prostate tissue sample (refer to GSE35988 for additional information) 35. (b) RFX6 expression levels in 35 human prostate carcinomas from the Tamura et al. dataset 36. (c-e) The expression levels of RFX6 (c), HOXB13 (d) or GPRC6A (e) in a cohort of 150 human prostate tumors (primary and metastatic) are from the Taylor et al. dataset 37. The relative expression level is displayed as Z-score versus matched normal control tissues. Positive Z-score indicates increased expression, and negative means decreased expression. Note that all the datasets in (a-c) show consistent RFX6 upregulation in a subset of human prostate tumors. HOXB13 are upregualted with higher frequency in the reported clinical tumor samples 37. In contrast, GPRC6A is less frequently expressed in the reported dataset
12 Supplementary Figure 6: shrna-mediated knockdown of HOXB13 confers reduced expression of RFX6 in prostate cancer cells. (a-c) Depletion of HOXB13 greatly decreases the transcriptional level of RFX6 gene in LNCaP (a), 22Rv1 (b), and VCaP (c). Error bars, ± s.d. (n = 3 technical replicates). Note that the results from this shrna-mediated knockdown assay are well consistent with our independent sirna-mediated depletion of HOXB13 in the given prostate cancer cell models (see also Fig. 3b-d). 12
13 13
14 Supplementary Figure 7: Expression correlation of RFX6 or GPRC6A with HOXB13 in human prostate tumor samples. (a,b) Scatter plot showing the positive correlation between RFX6 and HOXB13 expression (a), and the inverse correlation between GPRC6A and HOXB13 expression (b) in a subset of prostate tumors (n=103) with upregulated HOXB13 from the dataset 37. (c) Scatter plot showing the positive correlation between RFX6 and HOXB13 expression in a subset of prostate tumors (n=73) with upregulated RFX6 from the dataset 37. (d,e) Scatter plot showing a positive correlation between RFX6 and HOXB13 expression (d) and the inverse correlation between GPRC6A and HOXB13 (e) in an independent cohort of prostate tumors (n=176) from the TCGA dataset (queried from cbio Portal 40 ). (f,g) Scatter plot showing the positive correlations between RFX6 and HOXB13 expression in a Finnish cohort of prostate cancer (f), and a subset of commercialized prostate tumor samples (g). The statistical significance of the correlation was assessed by performing Pearson s correlation coefficient tests. In d-f, the statistical significance was also evaluated using Spearman s rank correlation coefficient. 14
15 Supplementary Figure 8: Depletion of HOXB13 confers reduced occupancy of transcription factors and chromatin openness at rs region. (a) shrnamediated depletion of HOXB13 reduces chromatin occupancy of AR and FOXA1 at rs containing region in prostate cancer cell LNCaP. Error bars, ± s.e.m. (n = 3 technical replicates). (b-d) shrna-mediated depletion of HOXB13 diminishes chromatin openness revealed by FAIRE-qPCR in prostate cancer cell line LNCaP (b), 22Rv1 (c), and VCaP (d). Fold enrichment was calculated as a ratio of the signal revealed by qpcr from FAIRE sample relative to the signal from input DNA. Error bars, ± s.d. (n = 3 technical replicates). *** P < by two-tailed Student s t-tests. 15
16 16
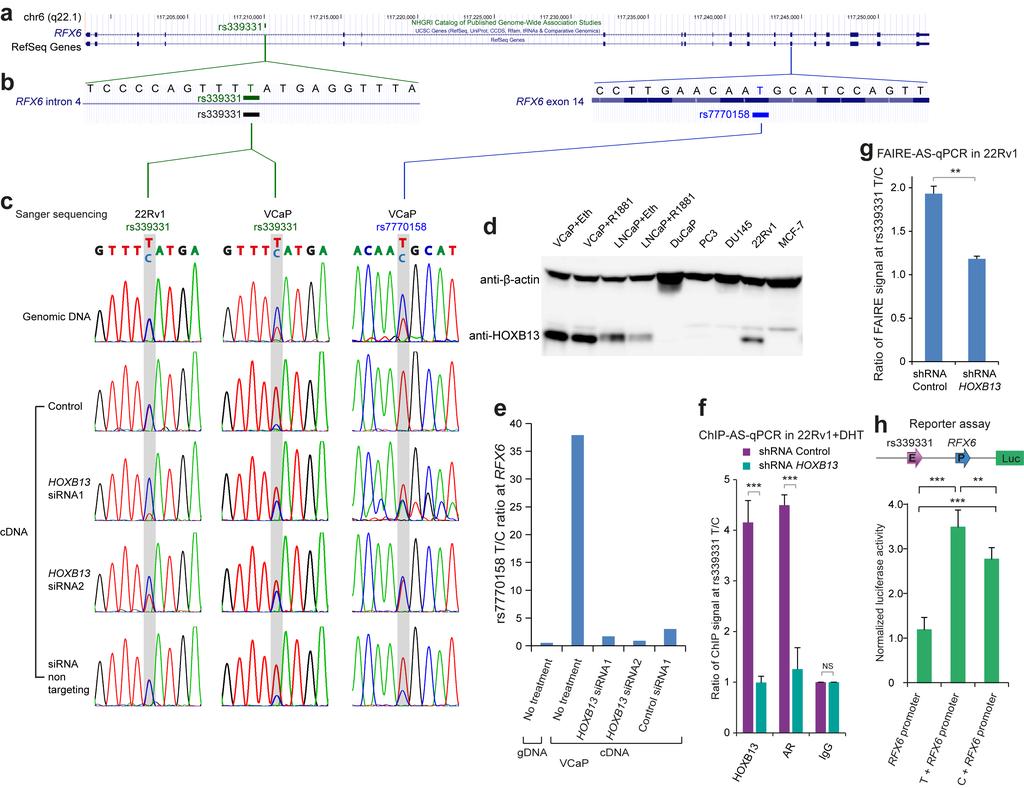
17 Supplementary Figure 9: The prostate cancer risk-associated SNP rs is involved in allelic imbalance of RFX6 expression modulated by HOXB13. The prostate cancer risk-associated SNP rs is involved in allelic imbalance of RFX6 expression modulated by HOXB13. (a) Genome browser track presents complete structure of exons and introns for RefSeq human gene RFX6. GWAS SNP rs is locating within intron 4 of RFX6. (b) A focused view of non-coding SNP rs centered 21bp in intron 4 and coding SNP rs centered 21bp in exon 14 of RFX6 gene, indicating each SNP reference allele is T base; the other allele is C base. (c) Sanger sequencing profiles indicate different signal density for the alleles of non-coding SNP rs and coding SNP rs in RFX6 gene. Sanger sequencing samples include genomic DNA and cdna reversely transcribed from RNA under different treatments. The first and second columns, respectively, show Sanger sequencing profiles surrounding rs site in 22Rv1 and VCaP cells. The third column shows Sanger sequencing signals for coding SNP rs in VCaP cells. Note that Sanger sequencing of both rs and rs regions result in similar chromatogram signals from VCaP cells under the same growth condition, further supporting a causal role of rs mediated disruption of the HOXB13 motif in modulating its chromatin occupancy, which in turn causes allelic imbalance in RFX6 expression (see also Fig. 3fh). (d) Western blot results indicate differential expression of HOXB13 at protein level across 6 prostate cancer cell lines (VCaP, LNCaP, DuCaP, PC3, DU145 and 22Rv1) and one breast cancer cell model MCF-7. Note that HOXB13 protein abundance in either VCaP or LNCaP is clearly higher than the level in 22Rv1 cells. (e) Ratio of T allele to C allele at coding SNP rs site shows allelic imbalance in RFX6 transcription in VCaP, consistent with the observations in Fig. 3f-h. (f) Depletion of HOXB13 reduces the chromatin occupancy of HOXB13 and AR preferentially at rs region with T allele. AS-PCR was applied to examine the ChIP signal specifically at rs region with T allele or C allele. Shown are the ChIP signals at T allele normalized to C allele. Error bars, ± s.d. (n = 3 technical replicates). *** P < by two-tailed Student s t-tests. (g) Depletion of HOXB13 reduces the chromatin open state specifically at rs region with T allele. AS-PCR was applied to examine the FAIRE signal specifically at rs region with T allele or C allele. Shown are the FAIRE signals at T allele normalized to C allele. Error bars, ± s.d. (n = 3 technical replicates). ** P < 0.01 by two-tailed Student s t-tests. (h) Luciferase reporter assay reveals increased enhancer activity of rs T over C alleles to the RFX6 promoter. The fragment of the enhancer used here is rs centered 600bp region (chr6: ), 300bp shorter than the one used in Fig. 3j. Error bars, ± s.d. (n = 5 technical replicates). The P values were evaluated using two-tailed Student s t-tests. 17
 Efficiency of sirnas or shrna-mediated RFX6 knockdown was measured using quantitative real-time PCR. Error bars, ± s.d. (n = 3 technical replicates).")
18 Supplementary Figure 10: The transcription factor gene RFX6 and HOXB13 influence cellular phenotypes related to tumor-associated properties in prostate cancer cells. (a,b) Efficiency of sirnas or shrna-mediated RFX6 knockdown was measured using quantitative real-time PCR. Error bars, ± s.d. (n = 3 technical replicates). Note that the most efficient sirna or shrna against RFX6 was selected for 18
19 subsequent assays to test functional roles of RFX6 in cell growth control and cellular transformation. (c) Cell proliferation was measured at the indicated time points by XTT colorimetric assay (absorbance at 450 nm; mean ± s.d. of three independent experiments). ** P < 0.01, *** P < 0.001, **** P < , using two-tailed Student s t-test. (d) Cell growth potential was real-time monitored and assessed by an Electric Cell-Substrate Impedance Sensing (ECIS) assay. Note that capacitance at high frequency exhibits significant correlation with cell free electrode area. When cells attached to the electrode or cell proliferation occurred, the capacitance will drop. (e) Cell growth rate was real-time monitored using an ECIS assay. Note that when cell proliferation occurs, the resistance will increase. (f) Representative images of cell migration assay of 22Rv1 cells transfected with control and the most efficient sirna against HOXB13. Scale bar, 100µm. (g) Quantitation of relative migration for the cells transfected with control and the most efficient sirna against HOXB13. (h) Representative images of cell invasion assay of 22Rv1 cells transfected with control and the most efficient sirna against HOXB13. Scale bar, 100µm. (i) Quantitation of relative invasion for the cells transfected with control and most efficient sirna against HOXB13. In g and i, error bars, ± s.d. n = 3 technical replicates, the P values were assessed using two-tailed Student s t-test. 19
 Representative images of invasion assay for control shrna lentivirus particle infected 22Rv1 cells transfected with empty, HOXB13 or RFX6 expression vector.")
20 Supplementary Figure 11: RFX6 and HOXB13 play a role in prostate cancer cell proliferation and invasion. (a) Representative images of invasion assay for control shrna lentivirus particle infected 22Rv1 cells transfected with empty, HOXB13 or RFX6 expression vector. (b) Representative images of invasion assay for HOXB13 shrna lentivirus particle infected 22Rv1 cells transfected with empty or RFX6 20
21 expression vector. (c) Representative images of invasion assay for RFX6 shrna lentivirus particle infected 22Rv1 cells transfected with empty or HOXB13 expression vector. In a-c, scale bar, 100µm. (d) Quantitation of relative invasion for control shrna lentivirus particle infected 22Rv1 cells transfected with empty, HOXB13 or RFX6 expression vector as shown in a. Note that ectopic overexpression of HOXB13 or RFX6 enhance 22Rv1 invasion, in agreement with our invasion assays with depletion of HOXB13 (Supplementary Fig. 10h,i) or RFX6 (Fig. 4e,f). (e) Quantitation of relative invasion for HOXB13 shrna lentivirus particle infected 22Rv1 cells transfected with empty or RFX6 expression vector. Note that ectopic overexpression of RFX6 significantly restored the decreased cell invasion caused by shrna-mediated HOXB13 knockdown. (f) Quantitation of relative invasion for RFX6 shrna lentivirus particle infected 22Rv1 cells transfected with empty or HOXB13 expression vector. In contrast to the functional rescue of RFX6 to HOXB13 depletion, to a lesser extent, ectopic overexpression of HOXB13 restored the decreased cell invasion caused by shrnamediated RFX6 knockdown. A possible explanation to this observation is that HOXB13 is an upstream regulator of RFX6 gene expression. The increased RFX6 transcripts may be simultaneously degraded by the shrnas against RFX6. In d-f, Error bars, ± s.e.m. (n = 3 technical replicates). The P values were assessed using two-tailed Student s t-test. 21
22 22
23 Supplementary Figure 12: RFX6 upregulation in human prostate cancer correlates with tumor progression and the risk of biochemical relapse. (a) RFX6 mrna expression is upregulated in a subset of prostate tumors in comparison with matched adjacent normal controls from the same prostate tissues. The box plot in the inset shows that RFX6 expression is significantly higher in the tumors than the matched normal controls. Note that RFX6 mrna expression levels were measured by quantitative PCR in a Finnish Oulu cohort of prostate cancer tissues from the patients who underwent radical retropubic prostatectomy. In contrast, there are no detectable expression levels of GPRC6A expression in most of the samples (data not shown). (b) RFX6 is highly expressed in metastatic prostate tumors from an independent clinical dataset 39. Normalisation procedure for RFX6 expression intensity is stated in GSE3325. (c) RFX6 mrna expression is strikingly upregulated in metastasis in the Taylor et al. dataset 37. By contrast, GPRC6A expression does not correlate with prostate tumor metastasis in the same dataset. Normalisation procedure for RFX6 expression intensity is stated in GSE (d) GPRC6A expression does not correlate with prostate tumor progression to high Gleason score in the ref. 37 dataset. In contrast, from the ref. 37 dataset, we observed a significant correlation of RFX6 upregulation with tumor progression to high Gleason score (see Fig. 5d). (e,f) RFX6 upregulation markedly correlates with elevated serum PSA levels (e), a diagnostic marker for prostate cancer, and biochemical recurrence (f) in a cohort of patients reported in the ref. 37. In contrast, GPRC6A expression does not show any apparent association with PSA levels (e) and recurrence (f). In a-f, the horizontal lines represent the median values. The significance of comparison between groups was assessed by Mann-Whitney U -tests. (g,h) Kaplan Meier plot of the risk for biochemical recurrence in two patient groups with higher (top 75% of GPRC6A upregulated tumors; n = 55) or lower (bottom 75% of GPRC6A downregulated tumors; n =42) expression of GPRC6A in a cohort of patients reported in the ref. 37 (g) (see Supplemental Table 7 for clinical variables), and with higher (top 75% of GPRC6A upregulated tumors; n = 22) or lower (bottom 75% of GPRC6A downregulated tumors; n =63) expression of GPRC6A in an independent cohort of patients from the TCGA datasets of prostate adenocarcinomas (TCGA Research Network; see also Supplemental Table 8). Overall, the patients with tumors expressing higher levels of GPRC6A shows no increased risk of biochemical relapse. The number of patients in each group at every 10-month interval was indicated. The P value was calculated by a Log-rank test. 23
24 Supplementary Figure 13: Prognostic potential of RFX6 or GPRC6A upregulation and the effect of RFX6 deletion on the risk of biochemical recurrence in prostate cancer. (a) Kaplan Meier plots of the risk of biochemical recurrence in prostate tumors with high (Z-score > 1.75) or low (Z-score <= 1.75) expression of RFX6 (left panel) or GPRC6A (right panel) in the ref. 37 dataset. (b) Kaplan Meier plots of biochemical recurrence in two patient groups with high or low RFX6 expressing tumors with the cases carrying RFX6 deletion excluded. (c) Kaplan Meier plots of biochemical recurrence in two patient groups carrying the tumors with an RFX6 deletion or without RFX6 deletion. Note that, the correlation between RFX6 expression and biochemical recurrence is not explained by RFX6 deletion status. The P values in a-c are calculated with a log-rank test. Numbers of patients in each category are shown for each ten-month interval. 24
25 Supplementary Figure 14: The correlation between RFX6 expression and tumor aggressiveness is not explained by tumor size. (a) Tumor size is a potential confounding variable that could explain the observed correlation between RFX6 expression and tumor aggressiveness. Hence, we have examined two hypotheses using the Taylor et al. dataset 37. H0: RFX6 expression does not actually correlate with tumor severity in pure tumor samples. Instead, the observed RFX6 expression/tumor severity correlation is due to small (and low severity) tumors being contaminated with normal cells, which results in small tumors yielding low RFX6 expression measurements. H1: 25
26 RFX6 expression does correlate with severity in pure tumor samples, and our observed RFX6/severity correlation is not due to contamination from normal cells in small tumors. This schematic summarizes the rationale for hypothesis H0. The remaining data in this figure provide evidence refuting this hypothesis. (b) Kaplan Meier plots of biochemical recurrence in two patient groups with small tumors (pathological stage T2A/T2B) or large tumors (pathological stage T2C or larger). Tumor size correlates with tumor severity (the rate of biochemical recurrence) as one would expect, since larger tumors are previously known to be more aggressive on average. This correlation suggests that the pathological staging metadata is reliable in this cohort. (c) Boxplot of RFX6 expression for primary tumors of increasing size. Contrary to hypothesis H0 defined above, RFX6 expression does not correlate with tumor size in the primary tumor samples. The whiskers in the boxplot indicate the range of the data and the horizontal bar shows the median. The P value was assessed by a Kruskal-Wallis test. (d) Kaplan- Meier plots of biochemical recurrence in two patient groups carrying the tumors with high or low levels of RFX6 expression (the small primary tumors (pathological stage T2A/T2B) excluded). This survival analysis still yields a significant difference in biochemical recurrence between high RFX6 and low RFX6 expression groups, even when small tumors (T2A and T2B) are excluded from the analysis. This suggests that normal tissue contamination in small tumors cannot account for the observed correlation. In b and d, numbers of patients in each category are shown for each tenmonth interval, and the P values were calculated with a log-rank test. (e) Quantilequantile plot comparing the distribution of RFX6 expression levels in metastatic tumors with that in primary tumors. In contrast to the analysis shown in Supplementary Fig. 12c, this analysis excluded the small primary tumors (pathological stage T2A/T2B). Therefore the dramatic difference between primary and metastatic RFX6 expression persists even after small primary tumors are excluded. Expression units are Z-score, defined as the number of standard deviations from the mean RFX6 expression as estimated from normal prostate tissue. 26
27 Supplementary References 53. Wu, C., Macleod, I. & Su, A. I. BioGPS and MyGene.info: organizing online, gene-centric information. Nucleic Acids Res. 41, D561-5 (2013). 54. Wang, Q., Carroll, J. S. & Brown, M. Spatial and temporal recruitment of androgen receptor and its coactivators involves chromosomal looping and polymerase tracking. Mol. Cell 19, (2005). 55. Kerppola, T. K. Polycomb group complexes--many combinations, many functions. Trends Cell Biol. 19, (2009). 56. Song, L. et al. Open chromatin defined by DNaseI and FAIRE identifies regulatory elements that shape cell-type identity. Genome Res. 21, (2011). 57. Rada-Iglesias, A. et al. A unique chromatin signature uncovers early developmental enhancers in humans. Nature 470, (2011). 27
a) List of KMTs targeted in the shrna screen. The official symbol, KMT designation,
 List of KMTs targeted in the shrna screen. The official symbol, KMT designation,") Supplementary Information Supplementary Figures Supplementary Figure 1. a) List of KMTs targeted in the shrna screen. The official symbol, KMT designation, gene ID and specifities are provided. Those highlighted
Supplementary Information Supplementary Figures Supplementary Figure 1. a) List of KMTs targeted in the shrna screen. The official symbol, KMT designation, gene ID and specifities are provided. Those highlighted
Comparison of open chromatin regions between dentate granule cells and other tissues and neural cell types.
 Supplementary Figure 1 Comparison of open chromatin regions between dentate granule cells and other tissues and neural cell types. (a) Pearson correlation heatmap among open chromatin profiles of different
SUPPLEMENTARY INFORMATION
 doi:.38/nature8975 SUPPLEMENTAL TEXT Unique association of HOTAIR with patient outcome To determine whether the expression of other HOX lincrnas in addition to HOTAIR can predict patient outcome, we measured
m 6 A mrna methylation regulates AKT activity to promote the proliferation and tumorigenicity of endometrial cancer
 SUPPLEMENTARY INFORMATION Articles https://doi.org/10.1038/s41556-018-0174-4 In the format provided by the authors and unedited. m 6 A mrna methylation regulates AKT activity to promote the proliferation
Supplementary Figure S1: Defective heterochromatin repair in HGPS progeroid cells
 Supplementary Figure S1: Defective heterochromatin repair in HGPS progeroid cells Immunofluorescence staining of H3K9me3 and 53BP1 in PH and HGADFN003 (HG003) cells at 24 h after γ-irradiation. Scale bar,
Supplemental Figure S1. Expression of Cirbp mrna in mouse tissues and NIH3T3 cells.
 SUPPLEMENTAL FIGURE AND TABLE LEGENDS Supplemental Figure S1. Expression of Cirbp mrna in mouse tissues and NIH3T3 cells. A) Cirbp mrna expression levels in various mouse tissues collected around the clock
Supplementary Figure S1. Gene expression analysis of epidermal marker genes and TP63.
 Supplementary Figure Legends Supplementary Figure S1. Gene expression analysis of epidermal marker genes and TP63. A. Screenshot of the UCSC genome browser from normalized RNAPII and RNA-seq ChIP-seq data
SUPPLEMENTARY INFORMATION
 DOI: 10.1038/ncb2607 Figure S1 Elf5 loss promotes EMT in mammary epithelium while Elf5 overexpression inhibits TGFβ induced EMT. (a, c) Different confocal slices through the Z stack image. (b, d) 3D rendering
Supplementary Figure 1: High-throughput profiling of survival after exposure to - radiation. (a) Cells were plated in at least 7 wells in a 384-well
 Cells were plated in at least 7 wells in a 384-well") Supplementary Figure 1: High-throughput profiling of survival after exposure to - radiation. (a) Cells were plated in at least 7 wells in a 384-well plate at cell densities ranging from 25-225 cells in
Supplementary Figure 1: High-throughput profiling of survival after exposure to - radiation. (a) Cells were plated in at least 7 wells in a 384-well plate at cell densities ranging from 25-225 cells in
Supplementary Figure 1. HeliScope CAGE revealed androgen-regulated signaling and differentially regulated promoters in hormone-refractory prostate
 Supplementary Figure 1. HeliScope CAGE revealed androgen-regulated signaling and differentially regulated promoters in hormone-refractory prostate cancer cells. (a) Cell proliferation of BicR cells in
Nature Genetics: doi: /ng Supplementary Figure 1. Assessment of sample purity and quality.
 Supplementary Figure 1 Assessment of sample purity and quality. (a) Hematoxylin and eosin staining of formaldehyde-fixed, paraffin-embedded sections from a human testis biopsy collected concurrently with
Accessing and Using ENCODE Data Dr. Peggy J. Farnham
 1 William M Keck Professor of Biochemistry Keck School of Medicine University of Southern California How many human genes are encoded in our 3x10 9 bp? C. elegans (worm) 959 cells and 1x10 8 bp 20,000
Nature Immunology: doi: /ni Supplementary Figure 1. Characteristics of SEs in T reg and T conv cells.
 Supplementary Figure 1 Characteristics of SEs in T reg and T conv cells. (a) Patterns of indicated transcription factor-binding at SEs and surrounding regions in T reg and T conv cells. Average normalized
Nature Structural & Molecular Biology: doi: /nsmb Supplementary Figure 1
 Supplementary Figure 1 Effect of HSP90 inhibition on expression of endogenous retroviruses. (a) Inducible shrna-mediated Hsp90 silencing in mouse ESCs. Immunoblots of total cell extract expressing the
Soft Agar Assay. For each cell pool, 100,000 cells were resuspended in 0.35% (w/v)
") SUPPLEMENTARY MATERIAL AND METHODS Soft Agar Assay. For each cell pool, 100,000 cells were resuspended in 0.35% (w/v) top agar (LONZA, SeaKem LE Agarose cat.5004) and plated onto 0.5% (w/v) basal agar.
SUPPLEMENTARY MATERIAL AND METHODS Soft Agar Assay. For each cell pool, 100,000 cells were resuspended in 0.35% (w/v) top agar (LONZA, SeaKem LE Agarose cat.5004) and plated onto 0.5% (w/v) basal agar.
Supplementary Figure 1. Efficiency of Mll4 deletion and its effect on T cell populations in the periphery. Nature Immunology: doi: /ni.
 Supplementary Figure 1 Efficiency of Mll4 deletion and its effect on T cell populations in the periphery. Expression of Mll4 floxed alleles (16-19) in naive CD4 + T cells isolated from lymph nodes and
Supplementary Figure 1 IL-27 IL
 Tim-3 Supplementary Figure 1 Tc0 49.5 0.6 Tc1 63.5 0.84 Un 49.8 0.16 35.5 0.16 10 4 61.2 5.53 10 3 64.5 5.66 10 2 10 1 10 0 31 2.22 10 0 10 1 10 2 10 3 10 4 IL-10 28.2 1.69 IL-27 Supplementary Figure 1.
7SK ChIRP-seq is specifically RNA dependent and conserved between mice and humans.
 Supplementary Figure 1 7SK ChIRP-seq is specifically RNA dependent and conserved between mice and humans. Regions targeted by the Even and Odd ChIRP probes mapped to a secondary structure model 56 of the
Nature Immunology: doi: /ni Supplementary Figure 1. Huwe1 has high expression in HSCs and is necessary for quiescence.
 Supplementary Figure 1 Huwe1 has high expression in HSCs and is necessary for quiescence. (a) Heat map visualizing expression of genes with a known function in ubiquitin-mediated proteolysis (KEGG: Ubiquitin
of TERT, MLL4, CCNE1, SENP5, and ROCK1 on tumor development were discussed.
 Supplementary Note The potential association and implications of HBV integration at known and putative cancer genes of TERT, MLL4, CCNE1, SENP5, and ROCK1 on tumor development were discussed. Human telomerase
injected subcutaneously into flanks of 6-8 week old athymic male nude mice (LNCaP SQ) and body
 and body") SUPPLEMENTAL FIGURE LEGENDS Figure S1: Generation of ENZR Xenografts and Cell Lines: (A) 1x10 6 LNCaP cells in matrigel were injected subcutaneously into flanks of 6-8 week old athymic male nude mice (LNCaP
SUPPLEMENTAL FIGURE LEGENDS Figure S1: Generation of ENZR Xenografts and Cell Lines: (A) 1x10 6 LNCaP cells in matrigel were injected subcutaneously into flanks of 6-8 week old athymic male nude mice (LNCaP
Supplementary Figures
 Supplementary Figures Supplementary Figure 1. Confirmation of Dnmt1 conditional knockout out mice. a, Representative images of sorted stem (Lin - CD49f high CD24 + ), luminal (Lin - CD49f low CD24 + )
SUPPLEMENTARY INFORMATION
 DOI: 1.138/ncb3355 a S1A8 + cells/ total.1.8.6.4.2 b S1A8/?-Actin c % T-cell proliferation 3 25 2 15 1 5 T cells Supplementary Figure 1 Inter-tumoral heterogeneity of MDSC accumulation in mammary tumor
Supplemental Information For: The genetics of splicing in neuroblastoma
 Supplemental Information For: The genetics of splicing in neuroblastoma Justin Chen, Christopher S. Hackett, Shile Zhang, Young K. Song, Robert J.A. Bell, Annette M. Molinaro, David A. Quigley, Allan Balmain,
File Name: Supplementary Information Description: Supplementary Figures and Supplementary Tables. File Name: Peer Review File Description:
 File Name: Supplementary Information Description: Supplementary Figures and Supplementary Tables File Name: Peer Review File Description: Primer Name Sequence (5'-3') AT ( C) RT-PCR USP21 F 5'-TTCCCATGGCTCCTTCCACATGAT-3'
Nature Genetics: doi: /ng Supplementary Figure 1
 Supplementary Figure 1 Expression deviation of the genes mapped to gene-wise recurrent mutations in the TCGA breast cancer cohort (top) and the TCGA lung cancer cohort (bottom). For each gene (each pair
The common colorectal cancer predisposition SNP rs at chromosome 8q24 confers potential to enhanced Wnt signaling
 SUPPLEMENTARY INFORMATION The common colorectal cancer predisposition SNP rs6983267 at chromosome 8q24 confers potential to enhanced Wnt signaling Sari Tuupanen 1, Mikko Turunen 2, Rainer Lehtonen 1, Outi
SUPPLEMENTAL FILE. mir-22 and mir-29a are members of the androgen receptor cistrome modulating. LAMC1 and Mcl-1 in prostate cancer
 1 SUPPLEMENTAL FILE 2 3 mir-22 and mir-29a are members of the androgen receptor cistrome modulating LAMC1 and Mcl-1 in prostate cancer 4 5 6 Lorenza Pasqualini 1, Huajie Bu 1,2, Martin Puhr 1, Narisu Narisu
Supplementary Materials for
 www.sciencesignaling.org/cgi/content/full/8/375/ra41/dc1 Supplementary Materials for Actin cytoskeletal remodeling with protrusion formation is essential for heart regeneration in Hippo-deficient mice
EPIGENETIC RE-EXPRESSION OF HIF-2α SUPPRESSES SOFT TISSUE SARCOMA GROWTH
 EPIGENETIC RE-EXPRESSION OF HIF-2α SUPPRESSES SOFT TISSUE SARCOMA GROWTH Supplementary Figure 1. Supplementary Figure 1. Characterization of KP and KPH2 autochthonous UPS tumors. a) Genotyping of KPH2
Broad H3K4me3 is associated with increased transcription elongation and enhancer activity at tumor suppressor genes
 Broad H3K4me3 is associated with increased transcription elongation and enhancer activity at tumor suppressor genes Kaifu Chen 1,2,3,4,5,10, Zhong Chen 6,10, Dayong Wu 6, Lili Zhang 7, Xueqiu Lin 1,2,8,
Supplementary Figure 1
 Supplementary Figure 1 Asymmetrical function of 5p and 3p arms of mir-181 and mir-30 families and mir-142 and mir-154. (a) Control experiments using mirna sensor vector and empty pri-mirna overexpression
Supplemental Table S1
 Supplemental Table S. Tumorigenicity and metastatic potential of 44SQ cell subpopulations a Tumorigenicity b Average tumor volume (mm ) c Lung metastasis d CD high /4 8. 8/ CD low /4 6./ a Mice were injected
Supplementary Figure 1. HOPX is hypermethylated in NPC. (a) Methylation levels of HOPX in Normal (n = 24) and NPC (n = 24) tissues from the
 Methylation levels of HOPX in Normal (n = 24) and NPC (n = 24) tissues from the") Supplementary Figure 1. HOPX is hypermethylated in NPC. (a) Methylation levels of HOPX in Normal (n = 24) and NPC (n = 24) tissues from the genome-wide methylation microarray data. Mean ± s.d.; Student
Supplementary Figure 1. HOPX is hypermethylated in NPC. (a) Methylation levels of HOPX in Normal (n = 24) and NPC (n = 24) tissues from the genome-wide methylation microarray data. Mean ± s.d.; Student
Gene expression profiling predicts clinical outcome of prostate cancer. Gennadi V. Glinsky, Anna B. Glinskii, Andrew J. Stephenson, Robert M.
 SUPPLEMENTARY DATA Gene expression profiling predicts clinical outcome of prostate cancer Gennadi V. Glinsky, Anna B. Glinskii, Andrew J. Stephenson, Robert M. Hoffman, William L. Gerald Table of Contents
Effects of UBL5 knockdown on cell cycle distribution and sister chromatid cohesion
 Supplementary Figure S1. Effects of UBL5 knockdown on cell cycle distribution and sister chromatid cohesion A. Representative examples of flow cytometry profiles of HeLa cells transfected with indicated
Supplementary Figure S1 Expression of mir-181b in EOC (A) Kaplan-Meier
 Kaplan-Meier") Supplementary Figure S1 Expression of mir-181b in EOC (A) Kaplan-Meier curves for progression-free survival (PFS) and overall survival (OS) in a cohort of patients (N=52) with stage III primary ovarian
Supplementary Figure S1 Expression of mir-181b in EOC (A) Kaplan-Meier curves for progression-free survival (PFS) and overall survival (OS) in a cohort of patients (N=52) with stage III primary ovarian
Supplementary Figure 1: Attenuation of association signals after conditioning for the lead SNP. a) attenuation of association signal at the 9p22.
 attenuation of association signal at the 9p22.") Supplementary Figure 1: Attenuation of association signals after conditioning for the lead SNP. a) attenuation of association signal at the 9p22.32 PCOS locus after conditioning for the lead SNP rs10993397;
Supplementary Figure 1: Attenuation of association signals after conditioning for the lead SNP. a) attenuation of association signal at the 9p22.32 PCOS locus after conditioning for the lead SNP rs10993397;
Supplementary Figure 1: STAT3 suppresses Kras-induced lung tumorigenesis
 Supplementary Figure 1: STAT3 suppresses Kras-induced lung tumorigenesis (a) Immunohistochemical (IHC) analysis of tyrosine 705 phosphorylation status of STAT3 (P- STAT3) in tumors and stroma (all-time
Nature Immunology: doi: /ni Supplementary Figure 1. Transcriptional program of the TE and MP CD8 + T cell subsets.
 Supplementary Figure 1 Transcriptional program of the TE and MP CD8 + T cell subsets. (a) Comparison of gene expression of TE and MP CD8 + T cell subsets by microarray. Genes that are 1.5-fold upregulated
microrna-200b and microrna-200c promote colorectal cancer cell proliferation via
 Supplementary Materials microrna-200b and microrna-200c promote colorectal cancer cell proliferation via targeting the reversion-inducing cysteine-rich protein with Kazal motifs Supplementary Table 1.
Session 6: Integration of epigenetic data. Peter J Park Department of Biomedical Informatics Harvard Medical School July 18-19, 2016
 Session 6: Integration of epigenetic data Peter J Park Department of Biomedical Informatics Harvard Medical School July 18-19, 2016 Utilizing complimentary datasets Frequent mutations in chromatin regulators
(a) Significant biological processes (upper panel) and disease biomarkers (lower panel)
 Significant biological processes (upper panel) and disease biomarkers (lower panel)") Supplementary Figure 1. Functional enrichment analyses of secretomic proteins. (a) Significant biological processes (upper panel) and disease biomarkers (lower panel) 2 involved by hrab37-mediated secretory
Supplementary Figure 1. Functional enrichment analyses of secretomic proteins. (a) Significant biological processes (upper panel) and disease biomarkers (lower panel) 2 involved by hrab37-mediated secretory
fl/+ KRas;Atg5 fl/+ KRas;Atg5 fl/fl KRas;Atg5 fl/fl KRas;Atg5 Supplementary Figure 1. Gene set enrichment analyses. (a) (b)
 (b)") KRas;At KRas;At KRas;At KRas;At a b Supplementary Figure 1. Gene set enrichment analyses. (a) GO gene sets (MSigDB v3. c5) enriched in KRas;Atg5 fl/+ as compared to KRas;Atg5 fl/fl tumors using gene set
KRas;At KRas;At KRas;At KRas;At a b Supplementary Figure 1. Gene set enrichment analyses. (a) GO gene sets (MSigDB v3. c5) enriched in KRas;Atg5 fl/+ as compared to KRas;Atg5 fl/fl tumors using gene set
SUPPLEMENTARY FIGURE LEGENDS
 SUPPLEMENTARY FIGURE LEGENDS Supplementary Figure 1 Negative correlation between mir-375 and its predicted target genes, as demonstrated by gene set enrichment analysis (GSEA). 1 The correlation between
Computational Analysis of UHT Sequences Histone modifications, CAGE, RNA-Seq
 Computational Analysis of UHT Sequences Histone modifications, CAGE, RNA-Seq Philipp Bucher Wednesday January 21, 2009 SIB graduate school course EPFL, Lausanne ChIP-seq against histone variants: Biological
Heintzman, ND, Stuart, RK, Hon, G, Fu, Y, Ching, CW, Hawkins, RD, Barrera, LO, Van Calcar, S, Qu, C, Ching, KA, Wang, W, Weng, Z, Green, RD,
 Heintzman, ND, Stuart, RK, Hon, G, Fu, Y, Ching, CW, Hawkins, RD, Barrera, LO, Van Calcar, S, Qu, C, Ching, KA, Wang, W, Weng, Z, Green, RD, Crawford, GE, Ren, B (2007) Distinct and predictive chromatin
Supplementary Figures
 Supplementary Figures Supplementary Figure 1. Heatmap of GO terms for differentially expressed genes. The terms were hierarchically clustered using the GO term enrichment beta. Darker red, higher positive
BIO360 Fall 2013 Quiz 1
 BIO360 Fall 2013 Quiz 1 1. Examine the diagram below. There are two homologous copies of chromosome one and the allele of YFG carried on the light gray chromosome has undergone a loss-of-function mutation.
cis-regulatory enrichment analysis in human, mouse and fly
 cis-regulatory enrichment analysis in human, mouse and fly Zeynep Kalender Atak, PhD Laboratory of Computational Biology VIB-KU Leuven Center for Brain & Disease Research Laboratory of Computational Biology
PID1 increases chemotherapy-induced apoptosis in medulloblastoma and glioblastoma cells in a manner that involves NFκB
 SUPPLEMENTARY FIGURES: PID1 increases chemotherapy-induced apoptosis in medulloblastoma and glioblastoma cells in a manner that involves NFκB Jingying Xu, Xiuhai Ren, Anup Singh Pathania, G. Esteban Fernandez,
TITLE: The Role of HOX Proteins in Androgen-Independent Prostate Cancer
 AD Award Number: W81XWH-6-1-64 TITLE: The Role of HOX Proteins in Androgen-Independent Prostate Cancer PRINCIPAL INVESTIGATOR: Sunshine Daddario, B.A. CONTRACTING ORGANIZATION: University of Colorado Health
SUPPLEMENTARY INFORMATION
 doi:10.1038/nature12215 Supplementary Figure 1. The effects of full and dissociated GR agonists in supporting BFU-E self-renewal divisions. BFU-Es were cultured in self-renewal medium with indicated GR
Nature Structural & Molecular Biology: doi: /nsmb.2419
 Supplementary Figure 1 Mapped sequence reads and nucleosome occupancies. (a) Distribution of sequencing reads on the mouse reference genome for chromosome 14 as an example. The number of reads in a 1 Mb
Supplemental Figure 1. Genes showing ectopic H3K9 dimethylation in this study are DNA hypermethylated in Lister et al. study.
 mc mc mc mc SUP mc mc Supplemental Figure. Genes showing ectopic HK9 dimethylation in this study are DNA hypermethylated in Lister et al. study. Representative views of genes that gain HK9m marks in their
Predictive PP1Ca binding region in BIG3 : 1,228 1,232aa (-KAVSF-) HEK293T cells *** *** *** KPL-3C cells - E E2 treatment time (h)
 HEK293T cells *** *** *** KPL-3C cells - E E2 treatment time (h)") Relative expression ERE-luciferase activity activity (pmole/min) activity (pmole/min) activity (pmole/min) activity (pmole/min) MCF-7 KPL-3C ZR--1 BT-474 T47D HCC15 KPL-1 HBC4 activity (pmole/min) a d
Relative expression ERE-luciferase activity activity (pmole/min) activity (pmole/min) activity (pmole/min) activity (pmole/min) MCF-7 KPL-3C ZR--1 BT-474 T47D HCC15 KPL-1 HBC4 activity (pmole/min) a d
Supplementary Figures
 Supplementary Figures Supplementary Figure 1 Characterization of stable expression of GlucB and sshbira in the CT26 cell line (a) Live cell imaging of stable CT26 cells expressing green fluorescent protein
Nature Immunology: doi: /ni Supplementary Figure 1. DNA-methylation machinery is essential for silencing of Cd4 in cytotoxic T cells.
 Supplementary Figure 1 DNA-methylation machinery is essential for silencing of Cd4 in cytotoxic T cells. (a) Scheme for the retroviral shrna screen. (b) Histogram showing CD4 expression (MFI) in WT cytotoxic
Supplementary Table S1. Tumor samples used for analysis Tumor size (cm) BNG (grade) ERα PR. pn-
 BNG (grade) ERα PR. pn-") Supplementary Table S1. Tumor samples used for analysis Sample# Age Tumor size (cm) pn- Stage Stage BNG (grade) ERα PR HER2 (FISH) Triple negative T1 46 3 N1a III 2 Pos Neg N T2 58 1 N(i-) I 3 Pos Neg
Supplementary Table S1. Tumor samples used for analysis Sample# Age Tumor size (cm) pn- Stage Stage BNG (grade) ERα PR HER2 (FISH) Triple negative T1 46 3 N1a III 2 Pos Neg N T2 58 1 N(i-) I 3 Pos Neg
Nature Genetics: doi: /ng Supplementary Figure 1. Phenotypic characterization of MES- and ADRN-type cells.
 Supplementary Figure 1 Phenotypic characterization of MES- and ADRN-type cells. (a) Bright-field images showing cellular morphology of MES-type (691-MES, 700-MES, 717-MES) and ADRN-type (691-ADRN, 700-
Figure S1, Beyer et al.
 Figure S1, eyer et al. Pax7 Myogenin si sitrl Hoechst T = 72h 14 1.8.6.4.2 12 1 8 6 4 2 24h 48h 96h diff. sitrl siset1 212 72h diff. b1 td r t Se km MyH Vinculin Myogenin β-ctin Vinculin MW b1 ka td r
Dominic J Smiraglia, PhD Department of Cancer Genetics. DNA methylation in prostate cancer
 Dominic J Smiraglia, PhD Department of Cancer Genetics DNA methylation in prostate cancer Overarching theme Epigenetic regulation allows the genome to be responsive to the environment Sets the tone for
Supplementary Figures
 Supplementary Figures Supplementary Figure 1. Pan-cancer analysis of global and local DNA methylation variation a) Variations in global DNA methylation are shown as measured by averaging the genome-wide
Supplementary Information
 Supplementary Information - chimeric fusion transcript in human gastric cancer promotes tumorigenesis through activation of PI3K/AKT signaling Sun Mi Yun, Kwiyeom Yoon, Sunghoon Lee, Eunjeong Kim, Seong-Ho
Bmi-1 regulates stem cell-like properties of gastric cancer cells via modulating mirnas
 Wang et al. Journal of Hematology & Oncology (2016) 9:90 DOI 10.1186/s13045-016-0323-9 RESEARCH Bmi-1 regulates stem cell-like properties of gastric cancer cells via modulating mirnas Open Access Xiaofeng
Supplementary Figure 1. Quantile-quantile (Q-Q) plots. (Panel A) Q-Q plot graphical
 plots. (Panel A) Q-Q plot graphical") Supplementary Figure 1. Quantile-quantile (Q-Q) plots. (Panel A) Q-Q plot graphical representation using all SNPs (n= 13,515,798) including the region on chromosome 1 including SORT1 which was previously
Supplementary Figure 1. Quantile-quantile (Q-Q) plots. (Panel A) Q-Q plot graphical representation using all SNPs (n= 13,515,798) including the region on chromosome 1 including SORT1 which was previously
Supplementary Figure 1. AdipoR1 silencing and overexpression controls. (a) Representative blots (upper and lower panels) showing the AdipoR1 protein
 Representative blots (upper and lower panels) showing the AdipoR1 protein") Supplementary Figure 1. AdipoR1 silencing and overexpression controls. (a) Representative blots (upper and lower panels) showing the AdipoR1 protein content relative to GAPDH in two independent experiments.
Supplementary Figure 1. AdipoR1 silencing and overexpression controls. (a) Representative blots (upper and lower panels) showing the AdipoR1 protein content relative to GAPDH in two independent experiments.
Transcriptional control in Eukaryotes: (chapter 13 pp276) Chromatin structure affects gene expression. Chromatin Array of nuc
 Chromatin structure affects gene expression. Chromatin Array of nuc") Transcriptional control in Eukaryotes: (chapter 13 pp276) Chromatin structure affects gene expression Chromatin Array of nuc 1 Transcriptional control in Eukaryotes: Chromatin undergoes structural changes
Transcriptional control in Eukaryotes: (chapter 13 pp276) Chromatin structure affects gene expression Chromatin Array of nuc 1 Transcriptional control in Eukaryotes: Chromatin undergoes structural changes
Supplemental Figure 1
 1 Supplemental Figure 1 Effects of DATE shortening on HGF promoter activity. The HGF promoter region (-1037 to +56) containing wild-type (30As) or truncated DATE (26As, 27As, 28A, 29As) from breast cancer
Phospho-MED1-enhanced UBE2C locus looping drives castration-resistant prostate cancer growth
 The EMBO Journal (2011) 30, 2405 2419 & 2011 European Molecular Biology Organization All Rights Reserved 0261-4189/11 www.embojournal.org Phospho-MED1-enhanced UBE2C locus looping drives castration-resistant
Supplementary Figure 1: Comparison of acgh-based and expression-based CNA analysis of tumors from breast cancer GEMMs.
 Supplementary Figure 1: Comparison of acgh-based and expression-based CNA analysis of tumors from breast cancer GEMMs. (a) CNA analysis of expression microarray data obtained from 15 tumors in the SV40Tag
Supplementary Figure 1
 Supplementary Figure 1 Constitutive EGFR signaling does not activate canonical EGFR signals (a) U251EGFRInd cells with or without tetracycline exposure (24h, 1µg/ml) were treated with EGF for 15 minutes
Lung Met 1 Lung Met 2 Lung Met Lung Met H3K4me1. Lung Met H3K27ac Primary H3K4me1
 a Gained Met-VELs 1.5 1.5 -.5 Lung Met 1 Lung Met Lung Met 3 1. Lung Met H3K4me1 Lung Met H3K4me1 1 Lung Met H3K4me1 Lung Met H3K7ac 1.5 Lung Met H3K7ac Lung Met H3K7ac.8 Primary H3K4me1 Primary H3K7ac
SUPPLEMENTARY FIGURES
 SUPPLEMENTARY FIGURES Figure S1. Clinical significance of ZNF322A overexpression in Caucasian lung cancer patients. (A) Representative immunohistochemistry images of ZNF322A protein expression in tissue
Supplementary information
 Supplementary information High fat diet-induced changes of mouse hepatic transcription and enhancer activity can be reversed by subsequent weight loss Majken Siersbæk, Lyuba Varticovski, Shutong Yang,
Functional characterisation of hepatitis B viral X protein/microrna-21 interaction in HBVassociated hepatocellular carcinoma
 RESEARCH FUND FOR THE CONTROL OF INFECTIOUS DISEASES Functional characterisation of hepatitis B viral X protein/microrna-21 interaction in HBVassociated hepatocellular carcinoma CH Li, SC Chow, DL Yin,
H3K4 demethylase KDM5B regulates global dynamics of transcription elongation and alternative splicing in embryonic stem cells
 Nucleic Acids Research, 2017 1 doi: 10.1093/nar/gkx251 H3K4 demethylase KDM5B regulates global dynamics of transcription elongation and alternative splicing in embryonic stem cells Runsheng He 1,2 and
Supplementary Fig. 1. GPRC5A post-transcriptionally down-regulates EGFR expression. (a) Plot of the changes in steady state mrna levels versus
 Plot of the changes in steady state mrna levels versus") Supplementary Fig. 1. GPRC5A post-transcriptionally down-regulates EGFR expression. (a) Plot of the changes in steady state mrna levels versus changes in corresponding proteins between wild type and Gprc5a-/-
Supplementary Fig. 1. GPRC5A post-transcriptionally down-regulates EGFR expression. (a) Plot of the changes in steady state mrna levels versus changes in corresponding proteins between wild type and Gprc5a-/-
Supplementary Figure 1. Genotyping strategies for Mcm3 +/+, Mcm3 +/Lox and Mcm3 +/- mice and luciferase activity in Mcm3 +/Lox mice. A.
 Supplementary Figure 1. Genotyping strategies for Mcm3 +/+, Mcm3 +/Lox and Mcm3 +/- mice and luciferase activity in Mcm3 +/Lox mice. A. Upper part, three-primer PCR strategy at the Mcm3 locus yielding
RNA-Seq profiling of circular RNAs in human colorectal Cancer liver metastasis and the potential biomarkers
 Xu et al. Molecular Cancer (2019) 18:8 https://doi.org/10.1186/s12943-018-0932-8 LETTER TO THE EDITOR RNA-Seq profiling of circular RNAs in human colorectal Cancer liver metastasis and the potential biomarkers
Supplementary Information
 Supplementary Information mediates STAT3 activation at retromer-positive structures to promote colitis and colitis-associated carcinogenesis Zhang et al. a b d e g h Rel. Luc. Act. Rel. mrna Rel. mrna
Supplemental Information. Menin Deficiency Leads to Depressive-like. Behaviors in Mice by Modulating. Astrocyte-Mediated Neuroinflammation
 Neuron, Volume 100 Supplemental Information Menin Deficiency Leads to Depressive-like Behaviors in Mice by Modulating Astrocyte-Mediated Neuroinflammation Lige Leng, Kai Zhuang, Zeyue Liu, Changquan Huang,
SUPPLEMENTARY FIGURES
 SUPPLEMENTARY FIGURES 1 Supplementary Figure 1, Adult hippocampal QNPs and TAPs uniformly express REST a-b) Confocal images of adult hippocampal mouse sections showing GFAP (green), Sox2 (red), and REST
ACK1 Tyrosine Kinases: A Critical Regulator of Prostate Cancer
 ACK1 Tyrosine Kinases: A Critical Regulator of Prostate Cancer Nupam Mahajan Moffitt Cancer Center Learners Objectives How Androgen Receptor (AR) signaling is accomplished in absence of androgen What are
MIR retrotransposon sequences provide insulators to the human genome
 Supplementary Information: MIR retrotransposon sequences provide insulators to the human genome Jianrong Wang, Cristina Vicente-García, Davide Seruggia, Eduardo Moltó, Ana Fernandez- Miñán, Ana Neto, Elbert
SUPPLEMENTARY INFORMATION
 doi:10.1038/nature23267 Discussion Our findings reveal unique roles for the methylation states of histone H3K9 in RNAi-dependent and - independent heterochromatin formation. Clr4 is the sole S. pombe enzyme
Supplementary Information Titles Journal: Nature Medicine
 Supplementary Information Titles Journal: Nature Medicine Article Title: Corresponding Author: Supplementary Item & Number Supplementary Fig.1 Fig.2 Fig.3 Fig.4 Fig.5 Fig.6 Fig.7 Fig.8 Fig.9 Fig. Fig.11
TITLE: MiR-146-SIAH2-AR Signaling in Castration-Resistant Prostate Cancer
 AWARD NUMBER: W81XWH-14-1-0387 TITLE: MiR-146-SIAH2-AR Signaling in Castration-Resistant Prostate Cancer PRINCIPAL INVESTIGATOR: Dr. Goberdhan Dimri, PhD CONTRACTING ORGANIZATION: George Washington University,
Supplementary methods:
 Supplementary methods: Primers sequences used in real-time PCR analyses: β-actin F: GACCTCTATGCCAACACAGT β-actin [11] R: AGTACTTGCGCTCAGGAGGA MMP13 F: TTCTGGTCTTCTGGCACACGCTTT MMP13 R: CCAAGCTCATGGGCAGCAACAATA
Breeding scheme, transgenes, histological analysis and site distribution of SB-mutagenized osteosarcoma.
 Supplementary Figure 1 Breeding scheme, transgenes, histological analysis and site distribution of SB-mutagenized osteosarcoma. (a) Breeding scheme. R26-LSL-SB11 homozygous mice were bred to Trp53 LSL-R270H/+
Nature Structural & Molecular Biology: doi: /nsmb Supplementary Figure 1. Differential expression of mirnas from the pri-mir-17-92a locus.
 Supplementary Figure 1 Differential expression of mirnas from the pri-mir-17-92a locus. (a) The mir-17-92a expression unit in the third intron of the host mir-17hg transcript. (b,c) Impact of knockdown
EPIGENOMICS PROFILING SERVICES
 EPIGENOMICS PROFILING SERVICES Chromatin analysis DNA methylation analysis RNA-seq analysis Diagenode helps you uncover the mysteries of epigenetics PAGE 3 Integrative epigenomics analysis DNA methylation
Plasma-Seq conducted with blood from male individuals without cancer.
 Supplementary Figures Supplementary Figure 1 Plasma-Seq conducted with blood from male individuals without cancer. Copy number patterns established from plasma samples of male individuals without cancer
SUPPLEMENTARY INFORMATION
 doi:10.1038/nature12652 Supplementary Figure 1. PRDM16 interacts with endogenous EHMT1 in brown adipocytes. Immunoprecipitation of PRDM16 complex by flag antibody (M2) followed by Western blot analysis
Supplementary Table S1. List of PTPRK-RSPO3 gene fusions in TCGA's colon cancer cohort. Chr. # of Gene 2. Chr. # of Gene 1
 Supplementary Tale S1. List of PTPRK-RSPO3 gene fusions in TCGA's colon cancer cohort TCGA Case ID Gene-1 Gene-2 Chr. # of Gene 1 Chr. # of Gene 2 Genomic coordiante of Gene 1 at fusion junction Genomic
mirna Dr. S Hosseini-Asl
 mirna Dr. S Hosseini-Asl 1 2 MicroRNAs (mirnas) are small noncoding RNAs which enhance the cleavage or translational repression of specific mrna with recognition site(s) in the 3 - untranslated region
Chromatin marks identify critical cell-types for fine-mapping complex trait variants
 Chromatin marks identify critical cell-types for fine-mapping complex trait variants Gosia Trynka 1-4 *, Cynthia Sandor 1-4 *, Buhm Han 1-4, Han Xu 5, Barbara E Stranger 1,4#, X Shirley Liu 5, and Soumya
Computer Science, Biology, and Biomedical Informatics (CoSBBI) Outline. Molecular Biology of Cancer AND. Goals/Expectations. David Boone 7/1/2015
 Outline. Molecular Biology of Cancer AND. Goals/Expectations. David Boone 7/1/2015") Goals/Expectations Computer Science, Biology, and Biomedical (CoSBBI) We want to excite you about the world of computer science, biology, and biomedical informatics. Experience what it is like to be a
Goals/Expectations Computer Science, Biology, and Biomedical (CoSBBI) We want to excite you about the world of computer science, biology, and biomedical informatics. Experience what it is like to be a
Supplemental Figure S1. Tertiles of FKBP5 promoter methylation and internal regulatory region
 Supplemental Figure S1. Tertiles of FKBP5 promoter methylation and internal regulatory region methylation in relation to PSS and fetal coupling. A, PSS values for participants whose placentas showed low,
mir-509-5p and mir-1243 increase the sensitivity to gemcitabine by inhibiting
 mir-509-5p and mir-1243 increase the sensitivity to gemcitabine by inhibiting epithelial-mesenchymal transition in pancreatic cancer Hidekazu Hiramoto, M.D. 1,3, Tomoki Muramatsu, Ph.D. 1, Daisuke Ichikawa,