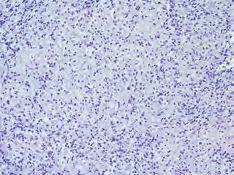
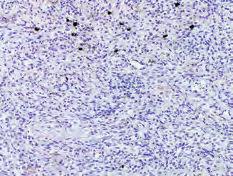
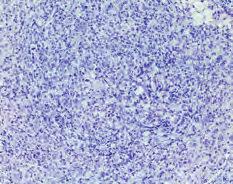
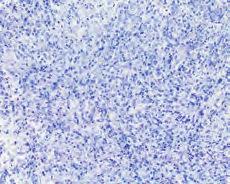
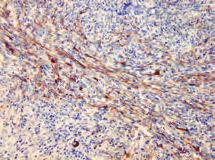
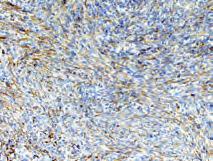
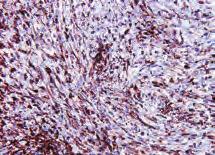
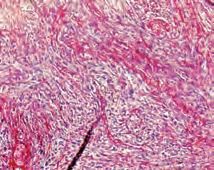
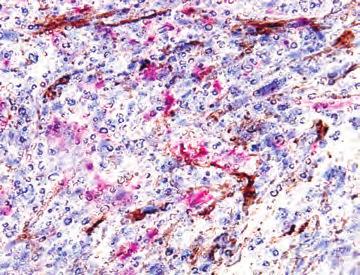
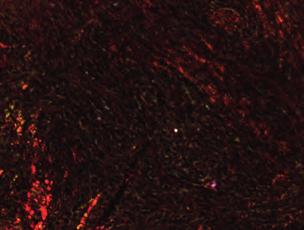
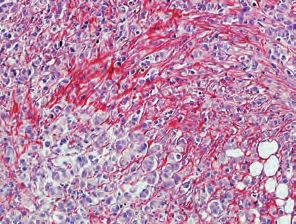
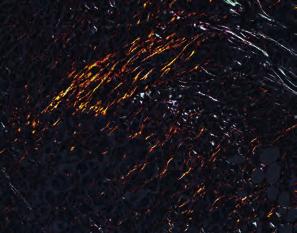
Fig 1 CD163. CD11b S100A9. Sirius Red. 100μm ** ** CD163. CD11b S100A9 ** Sirius Red (PL) Sirius Red SUM Mo.
|
|
|
- Brice Sutton
- 6 years ago
- Views:
Transcription


 IHC")


")


 * o")


1 T47D T47D + o SU-59 Fig SU-59 + o IHC score (-3) IHC score (-2) CD IHC score (-3) CD63 3 ** 2 CDb CDb * * SA9 SA9 ** * 2 IHC score (-4) αsa αsa 4 ** ** 2 Sirius Red μm IHC score (%) Sirius Red Sirius Red (PL) * o 9 o 7D o 59 o 7D 5 T4 D T4 D SU -5 7 SU T T SU SU
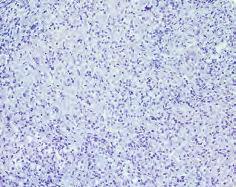
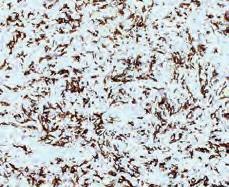
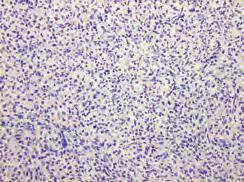
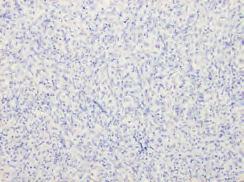
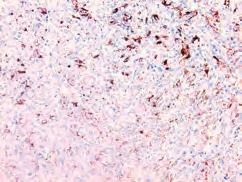
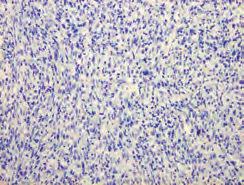
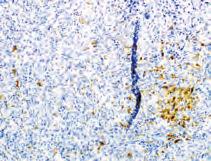
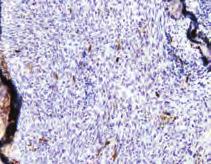
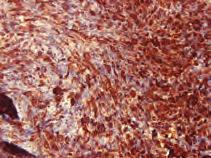
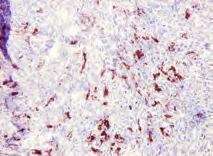
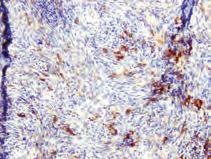
2 Supplementary Figure. Immunohistochemistry of xenografts Tumor xenografts consisting of triple negative (TN) SU-59 breast cancer cells co-transplanted with primary human monocytes, express more myeloid-related, immunosuppressive and activated fibroblast markers than luminal A T47D / monocyte xenografts. The xenografts were grown in highly immunodeficient NSG-mice (see aterial and methods), and sections from the tumors were stained with myeloid (CD63, CDb, SA9) and the activated fibroblast marker αsa. The two cell lines chosen are negative for SA9. Immunohistochemistry was performed using the indicated antibodies. All histological sections were counterstained with HE. N=5 mice were analyzed for each group; Grafts were analyzed on day 2. The histograms to the right show the mean value for each IHC score with statistical analysis. IHC scores are shown in Supplementary Table 2. *=p<.5, **=p<. ANOVA non-parametric Kruskal Wallis test. N=5. Error bars indicate SE.


3 A Fig 2 B DA-B-23 + onocytes DA-B-23 + onocytes CD63 F4/8 CDb CD68 SA9 CD28 Vimentin CD9 CD34 C β2-microglobulin CF-7 CF-7 + onocytes Gr- PDGFRβ DA-B-23 αsa Gr- Sirius Red DA-B-23 + onocytes
4 Supplementary Figure 2. Immunohistochemistry of xenografts (A) Xenografts consisting of triple-negative (TN) DA-B-23 breast cancer cells cotransplanted with primary human monocytes, into NSG mice. One graft representing a low myeloid cell take is shown for the TN DA-B-23 / monocyte co-transplant group. (B) Xenografts consisting of triple-negative (TN) DA-B-23 breast cancer cells cotransplanted with primary human monocytes, into NSG mice and stained for murine macrophages (F4/8), human macrophages (CD68) human myeloid dendritic cells (mdcs; CD28) and human fibroblasts (CD9). (C) Xenografts consisting of luminal A (CF-7) and triple-negative (TN) DA-B-23 breast cancer cells transplanted with or without primary human monocytes, into NSG mice and stained for the mouse myeloid marker, Gr. All histological sections were counterstained with HE. N=5 for each group. 2


5 A DA-B-23 CF-7 Red - Vimentin Green - Phalloidin Blue - DAPI onocytes (o) Ctrl edium B CF-7 C DA-B-23 C CF-7 + onocytes 23 CDb Red Vimentin Brown C F-7 D A -B o - C WB: Vimentin WB: Actin Fig 3
6 Supplementary Figure 3. Vimentin is expressed by myeloid cells (A) Immunofluorescence of primary human monocytes cultured with breast cancer cell conditioned medium or under control conditions (only G-CSF) and stained for Vimentin (red), phalloidin (to stain actin filaments; green) and DAPI (nuclear stain; blue). CF-7 and DA- B-23 breast cancer cells were used as negative and positive controls, respectively. (B) Double staining IHC of CDb and vimentin in xeno-transplants from CF-7 / monocytes tumors as indicated. Black arrows show staining with vimentin but not CDb. (C) Western blot (WB) of vimentin expression in CF-7 and DA-B-23 breast cancer cells or human primary monocytes (o) isolated from samples from two healthy blood donors. Actin is used as a loading control. 3
 In vitro")
 CXCL6 EG-VEGF Endothelin IGFBP2 TIP Trombospondin")


 OD measurement (U) E")
7 Fig 4 A B 2 migration * 8 3 * rl Ct CF- -23 B DA C F D T 7 A 4-7D D B A B46 8 Percentage of live CD4+ cells (%) In vitro monocyte survival C D CF-7 + onocytes Luminal A CF-7 Activin A Amphiregulin (AR) CXCL6 EG-VEGF Endothelin IGFBP2 TIP Trombospondin VEGF VEGF-C T47D P9 Endothelin- T47D + onocytes CXCL4 DA-B-23 + onocytes DA-B-23 Angiogenin Angiopoietin Coagulation factor III Collagen XVIII Endothelin G-CSF IGFBP3 IL8 P9 Pentraxin 3 / PTX3 PDGF-AA Persephin Serpin E TIP Trombospondin upa VEGF VEGF-C TN DA-B-468 SU-59 DA-B onocytes G-CSF P9 3 Endothelin- 4 IL-8* 5 CXCL4* 6 CCL2 2 SU-59 + onocytes G-CSF.5 P IL-8.5 * saturated values Endothelin CXCL4.5 * saturated values CCL C C F7 F + 7 T4 T o 47 7 D D + D D A A- - o B B-2 2 D 3 3 D A A- + - o B B SU SU - o o. C C F7 F + 7 T4 T o 7 47 D D + D D A A- - o B B-2 2 D 3 3 D A A- + - o B B SU SU - o o. C C F7 F + 7 T4 T o 47 7 D D + D D A A- - o B B-2 2 D 3 3 D A A- + - o B B SU SU - o o. OD measurement (U) OD measurement (U) E
8 Supplementary Figure 4. Effect of breast cancer cells on monocytes (A) Survival of isolated human primary monocytes in breast cancer cell conditioned medium, grown for 7 days, was assessed. 7AAD and CD4 + staining was performed to analyze the content of live monocyte/macrophages in each culture. *=p<.5 ***=p<.. ANOVA. N=5. Error bars indicate SE. (B) Boyden chamber migration assay of primary human 2 macrophages migrating towards control medium or breast cancer cell conditioned medium. *=p<.5 ANOVA. N=8. Error bars indicate SE. (C) Human angiogenesis array proteome profiler of supernatants from luminal A (CF-7 and T47D) or triple negative (TN) (DA-B-23, DA-B-468 and SU-59) breast cancer cells before monocyte co-culture. The factors in the blue box are expressed typically in luminal A breast cancer cells, and the factors in the purple box are expressed typically in TN breast cancer cells. (D) Human angiogenesis array proteome profiler of supernatants from co-cultures of human primary monocytes and luminal A (CF-7 and T47D) or TN (DA-B-23, DA- B-468 and SU-59) breast cancer cells. The factors in the green and pink boxes are specifically upregulated upon co-culture with monocytes, with the criteria if upregulated in both cultures of luminal A or TN breast cancer/monocyte co-cultures, respectively. The star (*) indicates saturated values. The numbers (-7) below the boxes indicate corresponding dots with each factor. (E) The histograms represent the OD values for each factor in relation to the reference dots A-2 (upper left corner) for each filter. N=2. 4


9 * msa9 5 * αsa 4 ns 3 2 R 4T μm 67 N C Number # of αsa positive cells per field in borders Ly6C Number # of αsa positive cells per field 67NR 67 N R 4T 5 Number # of SA9 positive cells per field B 67 N R 4T 67 N R 4T Number # of Ly6C positive cells per field CD63 - Red αsa - Brown A DA-B-23 + onocytes Fig 5 5μm 4T Ly6C msa9 αsa Sirius Red μm αsa border 5 * 4 3 2
10 Supplementary Figure 5. Immunohistochemistry of xenografts and syngeneic tumors (A) Double immunohistochemical staining of CD63 and αsa in the DA-B-23 / monocytes xenografts. Black arrows show staining with only αsa and green arrows show double staining. (B) Syngeneic mouse tumors consisting of luminal A (67NR) or TN (4T.3) breast cancer cells transplanted into BALB/c mice. The TN 4T.3 grafts express more myeloid-related (Ly6C), immunosuppressive (SA9) and activated fibroblast (αsa) markers than the luminal 67NR tumors. Sections from the tumors were stained with myeloid (Ly6C and SA9) and the activated fibroblast marker αsa. Immunohistochemistry was completed using the indicated antibodies. All histological sections were counterstained with HE. (C) The histograms show the mean value for each IHC score with statistical analysis. For scoring five fields were counted per staining. *=p<.5 ann-whitney U-test. Error bars indicate SE. 5


")
11 Fig 6 CF-7 CF-7 + onocytes (d2) Bright light A Polarized light μm B Polarized light Bright light DA-B-23 DA-B-23 + onocytes (d2) CF-7 + onocytes (d9)
12 Supplementary Figure 6. Sirius Red staining of xenografts (A) Sirius Red staining of the stroma (top row; bright light microscope; red) and classical collagen bundles (bottom row; polarized light microscope; red/green/yellowish stain) on; CF-7 or CF-7 / monocytes on day 2 and day 9, as indicated. (B) Sirius Red staining of the stroma (top row; bright light microscope; red) and classical collagen bundles (bottom row; polarized light microscope; red/green yellowish stain) on; DA-B-23 or DA-B-23 / monocytes xenografts. (N=5 for each group) on day 2. 6


 of Annexin")


 of open wound left")


13 Fig 7 A CF-7 B CF-7 + o Collagen VI mrna levels of primary fibroblasts cultured in co-culture supernatants Relative mrna expression Collagen VI 5μm DA-B-23 + o Collagen VI C D mrna levels of primary monocytes cultured in BC supernatants ** 3 2 l -7 7D Ctr F 4 C T B B SU DA DA E..5 *** (%) 5 rl Ct o o o 8 7D T4 D + B SU -5 T4 DA B - SU DA 24h h G F 5 *** 5 Primary fibroblast proliferation in co-culture supernatants Relative 3H Thymidine incorporation Amount (%) of Annexin V+ PI- cells Primary fibroblast apoptosis in co-culture supernatants 2. **.5..5 rl D o 8 o 9 o Ct T D B U 5 T4 DA B- S - SU DA rl -7 o o Ct CF B 3 CF A -2 D B DA Primary fibroblast migration in co-culture supernatants Relative area (%) of open wound left Relative mrna expression Collagen VI * rl D o 8 o 9 o Ct T D B U 5 T4 DA B- S - SU DA Relative mrna expression DA-B-23.5 mrna levels of primary fibroblasts cultured in co-culture supernatants 2.5 TGFβ 2. ns o 7D o 3 o 68 o 59 o CF7 + T4 + B-2 + B D SU -5 CF T4 DA B-2 DA B - - SU DA DA
14 Supplementary Figure 7. Collagen IV expression in TNBC xenografts and cultures Collagen VI is expressed by myeloid cells in a triple-negative breast tumor context. (A) Xenografts of luminal A CF-7 or TN DA-B-23 breast cancer cells, alone (left) or with primary human monocytes (o; right) in NSG-mice. Immunohistochemistry was performed using antibodies to collagen VI. Black arrow indicate collagen VI expression in TN / monocyte grafts. All histological sections were counterstained with HE. (B) Collagen VI mrna expression levels measured by RT-QPCR in primary mouse fibroblasts grown in breast cancer / monocyte co-culture supernatants. *=p<.5 ANOVA. N=4. (C) Collagen VI mrna expression levels measured by RT-QPCR in human myeloid cells cultured in breast cancer supernatants. Primary human 2 macrophages = positive control*=p<.5 ANOVA. N=4. Error bars indicate SE. (D) Scratch wound assays showing mouse primary fibroblast migration in supernatants derived from co-cultures of human primary monocytes (o) and luminal A (T47D) or TN (DA-B-468 and SU-59) breast cancer cells. ***=p<. ANOVA non-parametric Kruskal Wallis test. N=2. (E) Survival analysis of mouse primary fibroblasts grown in supernatants derived from cocultures of human primary monocytes and luminal A (T47D) or TN (DA-B-468 and SU-59) breast cancer cells. Annexin V staining was performed to analyze the percentage apoptotic cells. ***=p<. ANOVA Dunn s multiple comparison test. N=. (F) Proliferation of mouse primary human fibroblasts grown in supernatants derived from cocultures of human primary monocytes and luminal A (T47D) or TN (DA-B-468 and SU-59) breast cancer cells, measured using a thymidine incorporation proliferation assay. **=p<. ANOVA Dunn s multiple comparison test. N=4. 7
15 (G) mrna expression levels of TGFβ in mouse primary fibroblasts cultured in supernatants derived from co-cultures of human primary monocytes and luminal A (CF-7 and T47D) or TN (DA-B-23, DA-B-468 and SU-59) breast cancer cells, assessed by RT-QPCR analysis. ns=non-significant ANOVA Dunn s multiple comparison test. N=4-8. 8
16 Supplementary Table. Histological and immunohistochemistry scores of xenografts consisting of luminal A CF-7 or triple-negative (TN) DA-B-23 (23) breast cancer cells, alone or co-transplanted with primary human monocytes (o), in NSG mice CF- 7 (x 6 cells) CF- 7+o (x 6 + x 6 ) 23 (x 6 ) 23+o (x 6 + x 6 ) Size (mm) 3 X CDb (- 2) X 2 2 CD68 (- 3) 3 X CD63 (- 3) X 3 3 SA9 (- 3) X Vimentin (- 2) X αsa (- 4) X β2- microglobulin (%) 25 X > > PDGFRβ (- ) X Sirius Red (%) 5 X Sirius Red (%) PL X
17 Collagen VI (- ) 4 X CD34 (- 2) 2 X For statistics see Fig., Fig. 2, Fig. 3 and Supplementary Fig.. 2 Two tumors 3 Statistics for CD68 not shown in Figures: (DA- B o) CD68 expression as compared to (CF- 7 + o); *p<.5 (t- test) 4 Statistics for Collagen VI not shown in Figures: (DA- B o) Collagen VI expression as compared to (CF- 7 + o); **p<. (t- test) x No tumor PL = polarized light
18 Supplementary Table 2. Histological and immunohistochemistry scores of xenografts consisting of luminal A T47D or triple-negative (TN) SU-59 breast cancer cells, alone or co-transplanted with primary human monocytes (o), in NSG mice T47D (5x 6 cells) T47D+o (5x 6 + x 6 ) SU- 59 (x 6 ) SU- 59+o (x 6 + x 6 ) Size (mm) X CDb (- 2) 2 X 2 2 CD63 (- 3) 3 3 X 3 3 SA9 (- 3) 2 3 X αsa (- 4) X Sirius Red (%) X Sirius Red (%) PL X Collagen VI (- ) 2 X For statistics see Supplementary Fig. and Fig Statistics for Collagen VI not shown in Figures: (T47D + o) Collagen VI expression as compared to (SU o); **p<. (t- test) x No tumor PL = polarized light
19 Supplementary Table 3. Gene expression of ACTA2, Ly6C, SA9 and CXCL6 in mouse TNBC 4T.2 tumors compared to mouse luminal 67NR tumors. Gene Gene Name Whole tumor gene Adjusted P value array data (4T.2 vs 67NR) (Fold change) ACTA2 Alpha smooth muscle E- 3 actin Ly6C Lymphocyte antigen complex SA9 S Calcium binding E- 4 protein A9 CXCL6 Chemokine (C- X- C- otif) Ligand E- 2 Already published data 2 2
20 Supplementary Table 4. Antibodies used for immunohistochemistry (specificity ; clone; dilution; distributor) anti-cxcl6 (specific for human; ab44 dilution :; Abcam) anti-cdb (specific for human; clone #EP345Y dilution :; Abcam) anti-cd63 (specific for human; clone #D6 dilution :25; Novocastra) anti-cd68 (specific for human; dilution :5; DAKO) anti-vimentin (clone #V9 dilution :; Dako) anti-αsa (recognizes both mouse and human origin; clone #A4 dilution :; Dako) anti-human SA9 (specific for human; calgranulin B clone #H9 dilution :2; Santa Cruz) anti-mouse SA9 (specific for mouse; ab5472 dilution :; Abcam) anti-β2microglobulin (specific for mouse; sc-836 dilution :; Santa Cruz) anti-pdgfrβ (clone #369 dilution :; Cell Signaling) anti-collagen VI (recognizes both mouse and human origin; clone #H-2 dilution :25; Santa Cruz) anti-hla-abc (specific for human; Ab7328 dilution :2; Abcam) anti-cd34 (specific for mouse; clone #EC4.7 dilution :8; Santa Cruz) anti-f4/8 (specific for mouse; clone #Cl:A3- dilution :2; Abcam) anti-dc-lap (specific for human; CD28; clone #E. dilution :; Dendritics) anti-cd9 (specific for human; clone #EPR332 dilution :25; Abcam) anti-ly6c (specific for mouse; ab5627 dilution :; Abcam) anti-gr (specific for mouse; clone #RB6-8C5; Nordic Biosite) Specificity (mouse vs human) tested for all antibodies 3
21 Supplementary Table 5. Primers used in Quantitative real-time PCR GENES FORWARD REVERSE ouse ACTB CTCTGGCTCCTAGCACCATGAAGA CATGATGCTTGATCACATGTCTCG ouse HPRT CAAGCTTGCTGGTGAAAAGGAC GTCAAGGGCATATCCTACAACAAA ouse GAPDH TGCACCACCAACTGCTTAG GATGCAGGGATGATGTTC ouse alpha-sa ACTGGGACGACATGGAAAAG GTTCAGTGGTGCCTCTGTCA ouse TGF-B GGATACCAACTATTGCTTCAGCTCC AGGCTCCAAATATAGGGGCAGGGTC ouse FAP ACTGGGTGTATATGAAGTTGAGGAC TTCTTCATCAATGAAACCCATTT ouse CXCL6 product number: , Bio-Rad ouse COL6A CCACAGGGTGACCAAGGAAG ACCTCGGTATCCTTTAGGTCCAA Human ACTB CTGGAACGGTGAAGGTGACA AAGGGACTTCCTGTAACAATGCA Human GAPDH TGCACCACCAACTGCTTAGC GGCATGGACTGTGGTCATGAG Human SDHA TGGGAACAAGAGGGCATCTG CCACCACTGCATCAAATTCATG Human YWHAZ ACTTTTGGTACATTGTGGCTTCAA CCGCCAGGACAAACCAGTAT Human UBC ATTTGGGTCGCGGTTCTTG TGCCTTGACATTCTCGATGGT Human COL6A ACCGACTGCGCTATCAAGAA TCGGTCACCACAATCAGGTA 4
22 Supplementary References Bergenfelz, C. et al. SA9 expressed in ER(- )PgR(- ) breast cancers induces inflammatory cytokines and is associated with an impaired overall survival. Br J Cancer 3, , doi:.38/bjc (25). 2 Johnstone, C. N. et al. Functional and molecular characterisation of EO77.LB tumours, a new C57BL/6- mouse- derived model of spontaneously metastatic mammary cancer. Dis odel ech 8, , doi:.242/dmm.783 (25). 5
Supplemental figure 1. PDGFRα is expressed dominantly by stromal cells surrounding mammary ducts and alveoli. A) IHC staining of PDGFRα in
 IHC staining of PDGFRα in") Supplemental figure 1. PDGFRα is expressed dominantly by stromal cells surrounding mammary ducts and alveoli. A) IHC staining of PDGFRα in nulliparous (left panel) and InvD6 mouse mammary glands (right
Supplemental figure 1. PDGFRα is expressed dominantly by stromal cells surrounding mammary ducts and alveoli. A) IHC staining of PDGFRα in nulliparous (left panel) and InvD6 mouse mammary glands (right
Supplemental Figure Legends
 Supplemental Figure Legends Supplemental Figure 1. Antibody array analysis of conditioned media from endothelial cells after treatment with exosomes (*p
PKCζ Promotes Breast Cancer Invasion by Regulating Expression of E-cadherin and Zonula Occludens-1 (ZO-1) via NFκB-p65
 via NFκB-p65") SUPPLEMENTARY INFORMATION TITLE: PKCζ Promotes Breast Cancer Invasion by Regulating Expression of E-cadherin and Zonula Occludens-1 (ZO-1) via NFκB-p65 RUNNING TITLE: PKCζ-NFκB Signaling in Breast Cancer
SUPPLEMENTARY INFORMATION TITLE: PKCζ Promotes Breast Cancer Invasion by Regulating Expression of E-cadherin and Zonula Occludens-1 (ZO-1) via NFκB-p65 RUNNING TITLE: PKCζ-NFκB Signaling in Breast Cancer
(a) Significant biological processes (upper panel) and disease biomarkers (lower panel)
 Significant biological processes (upper panel) and disease biomarkers (lower panel)") Supplementary Figure 1. Functional enrichment analyses of secretomic proteins. (a) Significant biological processes (upper panel) and disease biomarkers (lower panel) 2 involved by hrab37-mediated secretory
Supplementary Figure 1. Functional enrichment analyses of secretomic proteins. (a) Significant biological processes (upper panel) and disease biomarkers (lower panel) 2 involved by hrab37-mediated secretory
Supplementary Figure 1: TSLP receptor skin expression in dcssc. A: Healthy control (HC) skin with TSLP receptor expression in brown (10x
 skin with TSLP receptor expression in brown (10x") Supplementary Figure 1: TSLP receptor skin expression in dcssc. A: Healthy control (HC) skin with TSLP receptor expression in brown (10x magnification). B: Second HC skin stained for TSLP receptor in brown
Supplementary Figure 1: TSLP receptor skin expression in dcssc. A: Healthy control (HC) skin with TSLP receptor expression in brown (10x magnification). B: Second HC skin stained for TSLP receptor in brown
Suppl Video: Tumor cells (green) and monocytes (white) are seeded on a confluent endothelial
 and monocytes (white) are seeded on a confluent endothelial") Supplementary Information Häuselmann et al. Monocyte induction of E-selectin-mediated endothelial activation releases VE-cadherin junctions to promote tumor cell extravasation in the metastasis cascade
Supplementary Information Häuselmann et al. Monocyte induction of E-selectin-mediated endothelial activation releases VE-cadherin junctions to promote tumor cell extravasation in the metastasis cascade
Supplemental Materials. Stromal Modulation Reverses Primary Resistance to Immune Checkpoint Blockade in. Pancreatic Cancer.
 Supplemental Materials Stromal Modulation Reverses Primary Resistance to Immune Checkpoint Blockade in Pancreatic Cancer Jun Zhao 1, Zhilan Xiao 2, 3, Tingting Li 1, 4, Huiqin Chen 5, Ying Yuan 5, Alan
SUPPLEMENTARY INFORMATION
 DOI:.38/ncb3399 a b c d FSP DAPI 5mm mm 5mm 5mm e Correspond to melanoma in-situ Figure a DCT FSP- f MITF mm mm MlanaA melanoma in-situ DCT 5mm FSP- mm mm mm mm mm g melanoma in-situ MITF MlanaA mm mm
Supplemental Table 1. Primer sequences for transcript analysis
 Supplemental Table 1. Primer sequences for transcript analysis Primer Sequence (5 3 ) Primer Sequence (5 3 ) Mmp2 Forward CCCGTGTGGCCCTC Mmp15 Forward CGGGGCTGGCT Reverse GCTCTCCCGGTTTC Reverse CCTGGTGTGCCTGCTC
Supplementary Figure 1: Neuregulin 1 increases the growth of mammary organoids compared to EGF. (a) Mammary epithelial cells were freshly isolated,
 Mammary epithelial cells were freshly isolated,") 1 2 3 4 5 6 7 8 9 10 Supplementary Figure 1: Neuregulin 1 increases the growth of mammary organoids compared to EGF. (a) Mammary epithelial cells were freshly isolated, embedded in matrigel and exposed
1 2 3 4 5 6 7 8 9 10 Supplementary Figure 1: Neuregulin 1 increases the growth of mammary organoids compared to EGF. (a) Mammary epithelial cells were freshly isolated, embedded in matrigel and exposed
Supplementary Table 1. The primers used for quantitative RT-PCR. Gene name Forward (5 > 3 ) Reverse (5 > 3 )
 Reverse (5 > 3 )") 770 771 Supplementary Table 1. The primers used for quantitative RT-PCR. Gene name Forward (5 > 3 ) Reverse (5 > 3 ) Human CXCL1 GCGCCCAAACCGAAGTCATA ATGGGGGATGCAGGATTGAG PF4 CCCCACTGCCCAACTGATAG TTCTTGTACAGCGGGGCTTG
770 771 Supplementary Table 1. The primers used for quantitative RT-PCR. Gene name Forward (5 > 3 ) Reverse (5 > 3 ) Human CXCL1 GCGCCCAAACCGAAGTCATA ATGGGGGATGCAGGATTGAG PF4 CCCCACTGCCCAACTGATAG TTCTTGTACAGCGGGGCTTG
Nature Immunology: doi: /ni Supplementary Figure 1. Cellularity of leukocytes and their progenitors in naive wild-type and Spp1 / mice.
 Supplementary Figure 1 Cellularity of leukocytes and their progenitors in naive wild-type and Spp1 / mice. (a, b) Gating strategies for differentiated cells including PMN (CD11b + Ly6G hi and CD11b + Ly6G
Supplementary Figure 1. SA-β-Gal positive senescent cells in various cancer tissues. Representative frozen sections of breast, thyroid, colon and
 Supplementary Figure 1. SA-β-Gal positive senescent cells in various cancer tissues. Representative frozen sections of breast, thyroid, colon and stomach cancer were stained with SA-β-Gal and nuclear fast
Targeting tumour associated macrophages in anti-cancer therapies. Annamaria Gal Seminar Series on Drug Discovery Budapest 5 January 2018
 Targeting tumour associated macrophages in anti-cancer therapies Annamaria Gal Seminar Series on Drug Discovery Budapest 5 January 2018 Macrophages: Professional phagocytes of the myeloid lineage APC,
Supplementary Figure 1. HOPX is hypermethylated in NPC. (a) Methylation levels of HOPX in Normal (n = 24) and NPC (n = 24) tissues from the
 Methylation levels of HOPX in Normal (n = 24) and NPC (n = 24) tissues from the") Supplementary Figure 1. HOPX is hypermethylated in NPC. (a) Methylation levels of HOPX in Normal (n = 24) and NPC (n = 24) tissues from the genome-wide methylation microarray data. Mean ± s.d.; Student
Supplementary Figure 1. HOPX is hypermethylated in NPC. (a) Methylation levels of HOPX in Normal (n = 24) and NPC (n = 24) tissues from the genome-wide methylation microarray data. Mean ± s.d.; Student
Supplementary Figure (OH) 22 nanoparticles did not affect cell viability and apoposis. MDA-MB-231, MCF-7, MCF-10A and BT549 cells were
 22 nanoparticles did not affect cell viability and apoposis. MDA-MB-231, MCF-7, MCF-10A and BT549 cells were") Supplementary Figure 1. Gd@C 82 (OH) 22 nanoparticles did not affect cell viability and apoposis. MDA-MB-231, MCF-7, MCF-10A and BT549 cells were treated with PBS, Gd@C 82 (OH) 22, C 60 (OH) 22 or GdCl
Supplementary Figure 1. Gd@C 82 (OH) 22 nanoparticles did not affect cell viability and apoposis. MDA-MB-231, MCF-7, MCF-10A and BT549 cells were treated with PBS, Gd@C 82 (OH) 22, C 60 (OH) 22 or GdCl
SUPPLEMENTARY INFORMATION
 DOI: 1.138/ncb3355 a S1A8 + cells/ total.1.8.6.4.2 b S1A8/?-Actin c % T-cell proliferation 3 25 2 15 1 5 T cells Supplementary Figure 1 Inter-tumoral heterogeneity of MDSC accumulation in mammary tumor
Supplementary Figures
 Supplementary Figures Supplementary Figure 1 Characterization of stable expression of GlucB and sshbira in the CT26 cell line (a) Live cell imaging of stable CT26 cells expressing green fluorescent protein
Supplementary Figure 1: Hsp60 / IEC mice are embryonically lethal (A) Light microscopic pictures show mouse embryos at developmental stage E12.
 Light microscopic pictures show mouse embryos at developmental stage E12.") Supplementary Figure 1: Hsp60 / IEC mice are embryonically lethal (A) Light microscopic pictures show mouse embryos at developmental stage E12.5 and E13.5 prepared from uteri of dams and subsequently genotyped.
Supplementary Figure 1: Hsp60 / IEC mice are embryonically lethal (A) Light microscopic pictures show mouse embryos at developmental stage E12.5 and E13.5 prepared from uteri of dams and subsequently genotyped.
SUPPLEMENTARY INFORMATION
 DOI: 10.1038/ncb3021 Supplementary figure 1 Characterisation of TIMPless fibroblasts. a) Relative gene expression of TIMPs1-4 by real time quantitative PCR (RT-qPCR) in WT or ΔTimp fibroblasts (mean ±
Pathologic Stage. Lymph node Stage
 ASC ASC a c Patient ID BMI Age Gleason score Non-obese PBMC 1 22.1 81 6 (3+3) PBMC 2 21.9 6 6 (3+3) PBMC 3 22 84 8 (4+4) PBMC 4 24.6 68 7 (3+4) PBMC 24. 6 (3+3) PBMC 6 24.7 73 7 (3+4) PBMC 7 23. 67 7 (3+4)
M2 microglia/ macrophages drive oligodendrocyte differentiation during CNS remyelination
 Supplemental Information Title: M2 microglia/ macrophages drive oligodendrocyte differentiation during CNS remyelination Authors: Veronique E. Miron, Amanda Boyd, Jing-Wei Zhao, Tracy J. Yuen, Julia M.
SUPPLEMENTARY INFORMATION
 doi:1.138/nature1554 a TNF-α + in CD4 + cells [%] 1 GF SPF 6 b IL-1 + in CD4 + cells [%] 5 4 3 2 1 Supplementary Figure 1. Effect of microbiota on cytokine profiles of T cells in GALT. Frequencies of TNF-α
Nature Immunology: doi: /ni Supplementary Figure 1. Production of cytokines and chemokines after vaginal HSV-2 infection.
 Supplementary Figure 1 Production of cytokines and chemokines after vaginal HSV-2 infection. C57BL/6 mice were (a) treated intravaginally with 20 µl of PBS or infected with 6.7x10 4 pfu of HSV-2 in the
Supporting Information
 Supporting Information M1 macrophage-derived nanovesicles potentiate the anticancer efficacy of immune checkpoint inhibitors Yeon Woong Choo, 1, Mikyung Kang, 2, Han Young Kim, 1 Jin Han, 1 Seokyung Kang,
Supplementary Figure 1. Dynamic Response of WT and mir-21 -/- mice to caerulein. (a) Representative histological sections of mouse pancreas stained
 Representative histological sections of mouse pancreas stained") Supplementary Figure 1. Dynamic Response of WT and mir-21 -/- mice to caerulein. (a) Representative histological sections of mouse pancreas stained with hematoxylin from caerulein-treated WT and mir-21
Supplementary Figure 1. Dynamic Response of WT and mir-21 -/- mice to caerulein. (a) Representative histological sections of mouse pancreas stained with hematoxylin from caerulein-treated WT and mir-21
well for 2 h at rt. Each dot represents an individual mouse and bar is the mean ±
 Supplementary data: Control DC Blimp-1 ko DC 8 6 4 2-2 IL-1β p=.5 medium 8 6 4 2 IL-2 Medium p=.16 8 6 4 2 IL-6 medium p=.3 5 4 3 2 1-1 medium IL-1 n.s. 25 2 15 1 5 IL-12(p7) p=.15 5 IFNγ p=.65 4 3 2 1
Bezzi et al., Supplementary Figure 1 *** Nature Medicine: doi: /nm Pten pc-/- ;Zbtb7a pc-/- Pten pc-/- ;Pml pc-/- Pten pc-/- ;Trp53 pc-/-
 Gr-1 Gr-1 Gr-1 Bezzi et al., Supplementary Figure 1 a Gr1-CD11b 3 months Spleen T cells 3 months Spleen B cells 3 months Spleen Macrophages 3 months Spleen 15 4 8 6 c CD11b+/Gr1+ cells [%] 1 5 b T cells
Supplementary Figure 1. Expression of CUGBP1 in non-parenchymal liver cells treated with TGF-β
 Supplementary Figures Supplementary Figure 1. Expression of CUGBP1 in non-parenchymal liver cells treated with TGF-β and LPS. Non-parenchymal liver cells were isolated and treated with or without TGF-β
Supplementary Figures
 Supplementary Figures Supplementary Figure 1. Confirmation of Dnmt1 conditional knockout out mice. a, Representative images of sorted stem (Lin - CD49f high CD24 + ), luminal (Lin - CD49f low CD24 + )
Nature Medicine: doi: /nm.4078
 Supplementary Figure 1. Cetuximab induces ER stress response in DiFi cells. (a) Scheme of SILAC proteome. (b) MS-base read out of SILAC experiment. The histogram of log 2 -transformed normalized H/L ratios
Figure S1. ERBB3 mrna levels are elevated in Luminal A breast cancers harboring ERBB3
 Supplemental Figure Legends. Figure S1. ERBB3 mrna levels are elevated in Luminal A breast cancers harboring ERBB3 ErbB3 gene copy number gain. Supplemental Figure S1. ERBB3 mrna levels are elevated in
SUPPLEMENTAL INFORMATIONS
 1 SUPPLEMENTAL INFORMATIONS Figure S1 Cumulative ZIKV production by testis explants over a 9 day-culture period. Viral titer values presented in Figure 1B (viral release over a 3 day-culture period measured
Supplementary Table 1. Characterization of HNSCC PDX models established at MSKCC
 Supplementary Table 1. Characterization of HNSCC PDX models established at MSKCC Supplementary Table 2. Drug content and loading efficiency estimated with F-NMR and UV- Vis Supplementary Table 3. Complete
Eosinophils are required. for the maintenance of plasma cells in the bone marrow
 Eosinophils are required for the maintenance of plasma cells in the bone marrow Van Trung Chu, Anja Fröhlich, Gudrun Steinhauser, Tobias Scheel, Toralf Roch, Simon Fillatreau, James J. Lee, Max Löhning
SHREE ET AL, SUPPLEMENTAL MATERIALS. (A) Workflow for tumor cell line derivation and orthotopic implantation.
 Workflow for tumor cell line derivation and orthotopic implantation.") SHREE ET AL, SUPPLEMENTAL MATERIALS SUPPLEMENTAL FIGURE AND TABLE LEGENDS Supplemental Figure 1. Derivation and characterization of TS1-TGL and TS2-TGL PyMT cell lines and development of an orthotopic
SHREE ET AL, SUPPLEMENTAL MATERIALS SUPPLEMENTAL FIGURE AND TABLE LEGENDS Supplemental Figure 1. Derivation and characterization of TS1-TGL and TS2-TGL PyMT cell lines and development of an orthotopic
Supplementary Materials. for Garmy-Susini, et al, Integrin 4 1 signaling is required for lymphangiogenesis and tumor metastasis
 Supplementary Materials for Garmy-Susini, et al, Integrin 4 1 signaling is required for lymphangiogenesis and tumor metastasis 1 Supplementary Figure Legends Supplementary Figure 1: Integrin expression
Postn MCM Smad2 fl/fl Postn MCM Smad3 fl/fl Postn MCM Smad2/3 fl/fl. Postn MCM. Tgfbr1/2 fl/fl TAC
 A Smad2 fl/fl Smad3 fl/fl Smad2/3 fl/fl Tgfbr1/2 fl/fl 1. mm B Tcf21 MCM Tcf21 MCM Smad3 fl/fl Tcf21 MCM Smad2/3 fl/fl Tcf21 MCM Tgfbr1/2 fl/fl αmhc MCM C 1. mm 1. mm D Smad2 fl/fl Smad3 fl/fl Smad2/3
Preclinical evaluation of pain in endometriosis
 receptor antagonism reduces peripheral and central hyperalgesia in a preclinical mouse model of endometriosis Erin Greaves, Andrew W Horne, Helen Jerina, arta ikolajczak, Lisa Hilferty, Rory itchell, Sue
Supplementary Figure 1: STAT3 suppresses Kras-induced lung tumorigenesis
 Supplementary Figure 1: STAT3 suppresses Kras-induced lung tumorigenesis (a) Immunohistochemical (IHC) analysis of tyrosine 705 phosphorylation status of STAT3 (P- STAT3) in tumors and stroma (all-time
SUPPLEMENTARY INFORMATION
 DOI: 10.1038/ncb2607 Figure S1 Elf5 loss promotes EMT in mammary epithelium while Elf5 overexpression inhibits TGFβ induced EMT. (a, c) Different confocal slices through the Z stack image. (b, d) 3D rendering
Supplementary Figure 1. Identification of tumorous sphere-forming CSCs and CAF feeder cells. The LEAP (Laser-Enabled Analysis and Processing)
") Supplementary Figure 1. Identification of tumorous sphere-forming CSCs and CAF feeder cells. The LEAP (Laser-Enabled Analysis and Processing) platform with laser manipulation to efficiently purify lung
Supplementary Figure 1. Identification of tumorous sphere-forming CSCs and CAF feeder cells. The LEAP (Laser-Enabled Analysis and Processing) platform with laser manipulation to efficiently purify lung
Supplementary Figure 1
 Supplementary Figure 1 a Percent of body weight! (%) 4! 3! 1! Epididymal fat Subcutaneous fat Liver SD Percent of body weight! (%) ** 3! 1! SD Percent of body weight! (%) 6! 4! SD ** b Blood glucose (mg/dl)!
Supplementary Figure 1
 CD31 FN Supplementary Figure 1 a Multivariate Cox regression analysis of predicting factors for disease-free and overall survival in 435 HNSCC patients b FN staining in whole sections of HNSCC c FN expression
Supplementary Figure 1. Double-staining immunofluorescence analysis of invasive colon and breast cancers. Specimens from invasive ductal breast
 Supplementary Figure 1. Double-staining immunofluorescence analysis of invasive colon and breast cancers. Specimens from invasive ductal breast carcinoma (a) and colon adenocarcinoma (b) were staining
Supplementary Figure 1:
 Supplementary Figure 1: (A) Whole aortic cross-sections stained with Hematoxylin and Eosin (H&E), 7 days after porcine-pancreatic-elastase (PPE)-induced AAA compared to untreated, healthy control aortas
Nature Medicine: doi: /nm.4324
 1 2 3 4 5 6 7 8 9 10 11 12 13 14 15 16 17 18 19 20 21 22 23 24 25 Supplementary Figure 1. Kinetics of SnCs development in surgically-induced OA and effect of GCV-induced SnC clearance on OA disease progression
marker. DAPI labels nuclei. Flies were 20 days old. Scale bar is 5 µm. Ctrl is
 Supplementary Figure 1. (a) Nos is detected in glial cells in both control and GFAP R79H transgenic flies (arrows), but not in deletion mutant Nos Δ15 animals. Repo is a glial cell marker. DAPI labels
Supplementary Table 1
 Supplementary Table 1 Flow Cytometry Antibodies Antibody Fluorochrome Clone Vendor CD45 PE-cyanine 7 30-F11 D ioscience CD3 Pacific lue 17A2 iolegend (San Diego, CA) CD11b APC M1/70 iolegend (San Diego,
SUPPLEMENTARY FIGURES
 SUPPLEMENTARY FIGURES Supplementary Figure S1: Fibroblast-induced elongation of cancer cells requires direct contact with living fibroblasts. A. Representative images of HT29-GFP cultured in the presence
T H E J O U R N A L O F C E L L B I O L O G Y
 T H E J O U R N A L O F C E L L B I O L O G Y Supplemental material Amelio et al., http://www.jcb.org/cgi/content/full/jcb.201203134/dc1 Figure S1. mir-24 regulates proliferation and by itself induces
Supplementary Figures
 Supplementary Figures Supplementary Fig. 1. Galectin-3 is present within tumors. (A) mrna expression levels of Lgals3 (galectin-3) and Lgals8 (galectin-8) in the four classes of cell lines as determined
Supplementary Figure S1. Flow cytometric analysis of the expression of Thy1 in NH cells. Flow cytometric analysis of the expression of T1/ST2 and
 Supplementary Figure S1. Flow cytometric analysis of the expression of Thy1 in NH cells. Flow cytometric analysis of the expression of T1/ST2 and Thy1 in NH cells derived from the lungs of naïve mice.
Supplementary Figures
 Supplementary Figures Supplementary Figure 1 DOT1L regulates the expression of epithelial and mesenchymal markers. (a) The expression levels and cellular localizations of EMT markers were confirmed by
Nature Medicine: doi: /nm.3922
 Title: Glucocorticoid-induced tumor necrosis factor receptor-related protein co-stimulation facilitates tumor regression by inducing IL-9-producing helper T cells Authors: Il-Kyu Kim, Byung-Seok Kim, Choong-Hyun
Figure S1. A Non-lesional Lesional
 Figure S1 Non-lesional Lesional GEN1 Non-lesional GEN1 Lesional C Normal Negative control Figure S1. Dermal Populations of + cells are found in human skin. Immunohistochemistry for on fixed, frozen skin
Supplementary information. The proton-sensing G protein-coupled receptor T-cell death-associated gene 8
 1 Supplementary information 2 3 The proton-sensing G protein-coupled receptor T-cell death-associated gene 8 4 (TDAG8) shows cardioprotective effects against myocardial infarction 5 Akiomi Nagasaka 1+,
Supplementary Figure 1 Chemokine and chemokine receptor expression during muscle regeneration (a) Analysis of CR3CR1 mrna expression by real time-pcr
 Analysis of CR3CR1 mrna expression by real time-pcr") Supplementary Figure 1 Chemokine and chemokine receptor expression during muscle regeneration (a) Analysis of CR3CR1 mrna expression by real time-pcr at day 0, 1, 4, 10 and 21 post- muscle injury. (b)
Supplementary Figure 1 Chemokine and chemokine receptor expression during muscle regeneration (a) Analysis of CR3CR1 mrna expression by real time-pcr at day 0, 1, 4, 10 and 21 post- muscle injury. (b)
Supplementary figure 1. Systemic delivery of anti-cd47 antibody controls tumor growth in
 T u m o r v o lu m e (m m 3 ) P e rc e n t s u rv iv a l P e rc e n t s u rv iv a l Supplementary data a 1 8 6 4 2 5 1 1 5 2 2 5 3 3 5 4 T im e a fte r tu m o r in o c u la tio n (d ) b c 1 5 1 1 5 * *
sequences of a styx mutant reveals a T to A transversion in the donor splice site of intron 5
 sfigure 1 Styx mutant mice recapitulate the phenotype of SHIP -/- mice. (A) Analysis of the genomic sequences of a styx mutant reveals a T to A transversion in the donor splice site of intron 5 (GTAAC
Online supplement. Phenotypic, functional and plasticity features of classical and alternatively activated
 Online supplement Phenotypic, functional and plasticity features of classical and alternatively activated human macrophages Abdullah Al Tarique*, Jayden Logan *, Emma Thomas *, Patrick G Holt *, Peter
Supplemental Figure 1. Signature gene expression in in vitro differentiated Th0, Th1, Th2, Th17 and Treg cells. (A) Naïve CD4 + T cells were cultured
 Naïve CD4 + T cells were cultured") Supplemental Figure 1. Signature gene expression in in vitro differentiated Th0, Th1, Th2, Th17 and Treg cells. (A) Naïve CD4 + T cells were cultured under Th0, Th1, Th2, Th17, and Treg conditions. mrna
Supplemental Figure 1. Signature gene expression in in vitro differentiated Th0, Th1, Th2, Th17 and Treg cells. (A) Naïve CD4 + T cells were cultured under Th0, Th1, Th2, Th17, and Treg conditions. mrna
Supplemental Table 1. Primers used for RT-PCR analysis of inflammatory cytokines Gene Primer Sequence
 Supplemental Table 1. Primers used for RT-PCR analysis of inflammatory cytokines Gene Primer Sequence IL-1α Forward primer 5 -CAAGATGGCCAAAGTTCGTGAC-3' Reverse primer 5 -GTCTCATGAAGTGAGCCATAGC-3 IL-1β
Supplementary Figure 1 The ability to regenerate an ear hole is discontinuous with wound healing. Ear-hole closure at D85 for each sex within each
 Supplementary Figure 1 The ability to regenerate an ear hole is discontinuous with wound healing. Ear-hole closure at D85 for each sex within each species observed. Data show a binary response to a 4 mm
Supplementary Figure 1. ETBF activate Stat3 in B6 and Min mice colons
 Supplementary Figure 1 ETBF activate Stat3 in B6 and Min mice colons a pstat3 controls Pos Neg ETBF 1 2 3 4 b pstat1 pstat2 pstat3 pstat4 pstat5 pstat6 Actin Figure Legend: (a) ETBF induce predominantly
Chronic variable stress activates hematopoietic stem cells
 SUPPLEMENTARY INFORMATION Chronic variable stress activates hematopoietic stem cells Timo Heidt *, Hendrik B. Sager *, Gabriel Courties, Partha Dutta, Yoshiko Iwamoto, Alex Zaltsman, Constantin von zur
Supplementary Information File
 Supplementary Information File Supplementary Table 1. List of synthesized sirna sequences for target genes sirna Species Sequence Ctrl sirna mouse sense 5 -UUCUCCGAACGUGUCACGUTT-3 Antisense 5 -ACGUGACACGUUCGGAGAATT-3
SUPPLEMENTARY FIGURES AND TABLE
 SUPPLEMENTARY FIGURES AND TABLE Supplementary Figure S1: Characterization of IRE1α mutants. A. U87-LUC cells were transduced with the lentiviral vector containing the GFP sequence (U87-LUC Tet-ON GFP).
Figure SⅠ: Expression of mir-155, mir-122 and mir-196a in allografts compared with
 Figure SⅠ: Expression of mir-155, mir-122 and mir-196a in allografts compared with isografts (control) at the 2nd week, 4th and 8th week by RT-PCR. At the advanced stage, the expression of these three
Supplementary Table S1. Tumor samples used for analysis Tumor size (cm) BNG (grade) ERα PR. pn-
 BNG (grade) ERα PR. pn-") Supplementary Table S1. Tumor samples used for analysis Sample# Age Tumor size (cm) pn- Stage Stage BNG (grade) ERα PR HER2 (FISH) Triple negative T1 46 3 N1a III 2 Pos Neg N T2 58 1 N(i-) I 3 Pos Neg
Supplementary Table S1. Tumor samples used for analysis Sample# Age Tumor size (cm) pn- Stage Stage BNG (grade) ERα PR HER2 (FISH) Triple negative T1 46 3 N1a III 2 Pos Neg N T2 58 1 N(i-) I 3 Pos Neg
(A) PCR primers (arrows) designed to distinguish wild type (P1+P2), targeted (P1+P2) and excised (P1+P3)14-
 PCR primers (arrows) designed to distinguish wild type (P1+P2), targeted (P1+P2) and excised (P1+P3)14-") 1 Supplemental Figure Legends Figure S1. Mammary tumors of ErbB2 KI mice with 14-3-3σ ablation have elevated ErbB2 transcript levels and cell proliferation (A) PCR primers (arrows) designed to distinguish
1 Supplemental Figure Legends Figure S1. Mammary tumors of ErbB2 KI mice with 14-3-3σ ablation have elevated ErbB2 transcript levels and cell proliferation (A) PCR primers (arrows) designed to distinguish
Supplemental Information. Tissue Myeloid Progenitors Differentiate. into Pericytes through TGF-b Signaling. in Developing Skin Vasculature
 Cell Reports, Volume 18 Supplemental Information Tissue Myeloid Progenitors Differentiate into Pericytes through TGF-b Signaling in Developing Skin Vasculature Tomoko Yamazaki, Ani Nalbandian, Yutaka Uchida,
ONLINE SUPPLEMENT MATERIAL. CD70 limits atherosclerosis and promotes macrophage function.
 ONLINE SUPPLEMENT MATERIAL CD7 limits atherosclerosis and promotes macrophage function. Holger Winkels* 1,2, Svenja Meiler* 1,2, Esther Smeets* 2, Dirk Lievens 1, David Engel 3, Charlotte Spitz 1, Christina
L1 on PyMT tumor cells but Py117 cells are more responsive to IFN-γ. (A) Flow
 Flow") A MHCI B PD-L1 Fold expression 8 6 4 2 Fold expression 3 2 1 No tx 1Gy 2Gy IFN Py117 Py117 Supplementary Figure 1. Radiation and IFN-γ enhance MHCI expression and PD- L1 on PyMT tumor cells but Py117 cells
A MHCI B PD-L1 Fold expression 8 6 4 2 Fold expression 3 2 1 No tx 1Gy 2Gy IFN Py117 Py117 Supplementary Figure 1. Radiation and IFN-γ enhance MHCI expression and PD- L1 on PyMT tumor cells but Py117 cells
Supplementary Figure 1. Deletion of Smad3 prevents B16F10 melanoma invasion and metastasis in a mouse s.c. tumor model.
 A B16F1 s.c. Lung LN Distant lymph nodes Colon B B16F1 s.c. Supplementary Figure 1. Deletion of Smad3 prevents B16F1 melanoma invasion and metastasis in a mouse s.c. tumor model. Highly invasive growth
Supplementary Materials for
 www.sciencesignaling.org/cgi/content/full/2/1/ra81/dc1 Supplementary Materials for Delivery of MicroRNA-126 by Apoptotic Bodies Induces CXCL12- Dependent Vascular Protection Alma Zernecke,* Kiril Bidzhekov,
SUPPLEMENTARY INFORMATION. CXCR4 inhibitors could benefit to HER2 but not to Triple-Negative. breast cancer patients
 SUPPLEMENTARY INFORMATION CXCR4 inhibitors could benefit to HER2 but not to Triple-Negative breast cancer patients Lefort S. 1,2, Thuleau A. 3, Kieffer Y. 1,2, Sirven P. 1,2, Bieche I. 4, Marangoni E.
An epithelial-to-mesenchymal transition-inducing potential of. granulocyte macrophage colony-stimulating factor in colon. cancer
 An epithelial-to-mesenchymal transition-inducing potential of granulocyte macrophage colony-stimulating factor in colon cancer Yaqiong Chen, Zhi Zhao, Yu Chen, Zhonglin Lv, Xin Ding, Renxi Wang, He Xiao,
Supplementary Figure 1. IDH1 and IDH2 mutation site sequences on WHO grade III
 Supplementary Materials: Supplementary Figure 1. IDH1 and IDH2 mutation site sequences on WHO grade III patient samples. Genomic DNA samples extracted from punch biopsies from either FFPE or frozen tumor
Supplemental Data. TGF-β-mediated mir-181a expression promotes breast cancer metastasis by targeting Bim.
 Supplemental Data TGF-β-mediated mir-181a expression promotes breast cancer metastasis by targeting Bim. Molly A. Taylor 1, Khalid Sossey-Alaoui 2, Cheryl L. Thompson 3, David Danielpour 4, and William
As outlined under External contributions (see appendix 7.1), the group of Prof. Gröne at the
, the group of Prof. Gröne at the") 3 RESULTS As outlined under External contributions (see appendix 7.1), the group of Prof. Gröne at the DKFZ in Heidelberg (Dept. of Cellular and Molecular pathology) contributed to this work by performing
3 RESULTS As outlined under External contributions (see appendix 7.1), the group of Prof. Gröne at the DKFZ in Heidelberg (Dept. of Cellular and Molecular pathology) contributed to this work by performing
Mitosis. Single Nano Micro Milli Macro. Primary. PCNA expression
 a b c DAPI YFP CC3 DAPI YFP PCNA DAPI YFP ph3 DAPI YFP KI67 e 6 Mitosis f 1 PCNA expression %ph3 + /YFP + n= 63 87 61 3 13 8 n= 15 3 9 1 5 %PCNA+/YFP+ 8 6 Supplementary Figure 1. Proliferation/apoptosis
Supplementary Figure S1 Expression of mir-181b in EOC (A) Kaplan-Meier
 Kaplan-Meier") Supplementary Figure S1 Expression of mir-181b in EOC (A) Kaplan-Meier curves for progression-free survival (PFS) and overall survival (OS) in a cohort of patients (N=52) with stage III primary ovarian
Supplementary Figure S1 Expression of mir-181b in EOC (A) Kaplan-Meier curves for progression-free survival (PFS) and overall survival (OS) in a cohort of patients (N=52) with stage III primary ovarian
ANGPTL2 increases bone metastasis of breast cancer cells through. Tetsuro Masuda, Motoyoshi Endo, Yutaka Yamamoto, Haruki Odagiri, Tsuyoshi
 Masuda et al. Supplementary information for ANGPTL2 increases bone metastasis of breast cancer cells through enhancing CXCR4 signaling Tetsuro Masuda, Motoyoshi Endo, Yutaka Yamamoto, Haruki Odagiri, Tsuyoshi
p = formed with HCI-001 p = Relative # of blood vessels that formed with HCI-002 Control Bevacizumab + 17AAG Bevacizumab 17AAG
 A.. Relative # of ECs associated with HCI-001 1.4 1.2 1.0 0.8 0.6 0.4 0.2 0.0 ol b p < 0.001 Relative # of blood vessels that formed with HCI-001 1.4 1.2 1.0 0.8 0.6 0.4 0.2 0.0 l b p = 0.002 Control IHC:
Therapeutic effect of baicalin on experimental autoimmune encephalomyelitis. is mediated by SOCS3 regulatory pathway
 Therapeutic effect of baicalin on experimental autoimmune encephalomyelitis is mediated by SOCS3 regulatory pathway Yuan Zhang 1,2, Xing Li 1,2, Bogoljub Ciric 1, Cun-gen Ma 3, Bruno Gran 4, Abdolmohamad
SUPPLEMENTARY METHODS
 SUPPLEMENTARY METHODS Histological analysis. Colonic tissues were collected from 5 parts of the middle colon on day 7 after the start of DSS treatment, and then were cut into segments, fixed with 4% paraformaldehyde,
(A) RT-PCR for components of the Shh/Gli pathway in normal fetus cell (MRC-5) and a
 RT-PCR for components of the Shh/Gli pathway in normal fetus cell (MRC-5) and a") Supplementary figure legends Supplementary Figure 1. Expression of Shh signaling components in a panel of gastric cancer. (A) RT-PCR for components of the Shh/Gli pathway in normal fetus cell (MRC-5) and
Supplementary figure legends Supplementary Figure 1. Expression of Shh signaling components in a panel of gastric cancer. (A) RT-PCR for components of the Shh/Gli pathway in normal fetus cell (MRC-5) and
TEB. Id4 p63 DAPI Merge. Id4 CK8 DAPI Merge
 a Duct TEB b Id4 p63 DAPI Merge Id4 CK8 DAPI Merge c d e Supplementary Figure 1. Identification of Id4-positive MECs and characterization of the Comma-D model. (a) IHC analysis of ID4 expression in the
Supplementary Figure 1: Expression of NFAT proteins in Nfat2-deleted B cells (a+b) Protein expression of NFAT2 (a) and NFAT1 (b) in isolated splenic
 Protein expression of NFAT2 (a) and NFAT1 (b) in isolated splenic") Supplementary Figure 1: Expression of NFAT proteins in Nfat2-deleted B cells (a+b) Protein expression of NFAT2 (a) and NFAT1 (b) in isolated splenic B cells from WT Nfat2 +/+, TCL1 Nfat2 +/+ and TCL1 Nfat2
Supplementary Figure 1: Expression of NFAT proteins in Nfat2-deleted B cells (a+b) Protein expression of NFAT2 (a) and NFAT1 (b) in isolated splenic B cells from WT Nfat2 +/+, TCL1 Nfat2 +/+ and TCL1 Nfat2
TGF-β Signaling Regulates Neuronal C1q Expression and Developmental Synaptic Refinement
 Supplementary Information Title: TGF-β Signaling Regulates Neuronal C1q Expression and Developmental Synaptic Refinement Authors: Allison R. Bialas and Beth Stevens Supplemental Figure 1. In vitro characterization
Nature Biotechnology: doi: /nbt Supplementary Figure 1. Analysis of hair bundle morphology in Ush1c c.216g>a mice at P18 by SEM.
 Supplementary Figure 1 Analysis of hair bundle morphology in Ush1c c.216g>a mice at P18 by SEM. (a-c) Heterozygous c.216ga mice displayed normal hair bundle morphology at P18. (d-i) Disorganized hair bundles
B220 CD4 CD8. Figure 1. Confocal Image of Sensitized HLN. Representative image of a sensitized HLN
 B220 CD4 CD8 Natarajan et al., unpublished data Figure 1. Confocal Image of Sensitized HLN. Representative image of a sensitized HLN showing B cell follicles and T cell areas. 20 µm thick. Image of magnification
Supplementary Figure 1. Spatial distribution of LRP5 and β-catenin in intact cardiomyocytes. (a) and (b) Immunofluorescence staining of endogenous
 and (b) Immunofluorescence staining of endogenous") Supplementary Figure 1. Spatial distribution of LRP5 and β-catenin in intact cardiomyocytes. (a) and (b) Immunofluorescence staining of endogenous LRP5 in intact adult mouse ventricular myocytes (AMVMs)
Supplementary Figure 1. Spatial distribution of LRP5 and β-catenin in intact cardiomyocytes. (a) and (b) Immunofluorescence staining of endogenous LRP5 in intact adult mouse ventricular myocytes (AMVMs)
Supplementary Figures
 Supplementary Figures Supplementary Figure 1. NKT ligand-loaded tumour antigen-presenting B cell- and monocyte-based vaccine induces NKT, NK and CD8 T cell responses. (A) The cytokine profiles of liver
Supplementary Figure S I: Effects of D4F on body weight and serum lipids in apoe -/- mice.
 Supplementary Figures: Supplementary Figure S I: Effects of D4F on body weight and serum lipids in apoe -/- mice. Male apoe -/- mice were fed a high-fat diet for 8 weeks, and given PBS (model group) or
Supplementary Figure 1. EC-specific Deletion of Snail1 Does Not Affect EC Apoptosis. (a,b) Cryo-sections of WT (a) and Snail1 LOF (b) embryos at
 Cryo-sections of WT (a) and Snail1 LOF (b) embryos at") Supplementary Figure 1. EC-specific Deletion of Snail1 Does Not Affect EC Apoptosis. (a,b) Cryo-sections of WT (a) and Snail1 LOF (b) embryos at E10.5 were double-stained for TUNEL (red) and PECAM-1 (green).
Supplementary Figure 1. EC-specific Deletion of Snail1 Does Not Affect EC Apoptosis. (a,b) Cryo-sections of WT (a) and Snail1 LOF (b) embryos at E10.5 were double-stained for TUNEL (red) and PECAM-1 (green).
SOPten flox/flox (KO) Pten flox/flox (WT) flox allele 6.0 kb. Pten. Actin. ! allele 2.3 kb. Supplementary Figure S1. Yanagi, et al.
 Pten flox/flox (WT) flox allele 6.0 kb. Pten. Actin. ! allele 2.3 kb. Supplementary Figure S1. Yanagi, et al.") s1 A Pten flox/flox () SOPten flox/flox () flox allele 6. kb B Pten flox/flox () SOPten flox/flox () Pten Actin! allele 2.3 kb Supplementary Figure S1. Yanagi, et al. A B BrdU BrdU positive cells ( ) 3
s1 A Pten flox/flox () SOPten flox/flox () flox allele 6. kb B Pten flox/flox () SOPten flox/flox () Pten Actin! allele 2.3 kb Supplementary Figure S1. Yanagi, et al. A B BrdU BrdU positive cells ( ) 3
Figure S1. Figure S2. Figure S3.
 Figure S1. PSA expression in VCaP was not dependent on the residual androgens in hormonedepleted medium. VCaP or LNCaP cells grown in CSS medium or SFM (serum-free medium) were treated with ethanol (-)
Supplementary Figure 1.TRIM33 binds β-catenin in the nucleus. a & b, Co-IP of endogenous TRIM33 with β-catenin in HT-29 cells (a) and HEK 293T cells
 and HEK 293T cells") Supplementary Figure 1.TRIM33 binds β-catenin in the nucleus. a & b, Co-IP of endogenous TRIM33 with β-catenin in HT-29 cells (a) and HEK 293T cells (b). TRIM33 was immunoprecipitated, and the amount of
Supplementary Figure 1.TRIM33 binds β-catenin in the nucleus. a & b, Co-IP of endogenous TRIM33 with β-catenin in HT-29 cells (a) and HEK 293T cells (b). TRIM33 was immunoprecipitated, and the amount of