SREBP-2 promotes stem cell-like properties and metastasis by transcriptional activation of c-myc in prostate cancer
|
|
|
- Lucy Erika Snow
- 5 years ago
- Views:
Transcription
1 SREBP-2 promotes stem cell-like properties and metastasis by transcriptional activation of c-myc in prostate cancer Supplementary Material Supplementary Methods Supplementary References Supplementary Figure Legends Supplementary Figures S1-11 Supplementary Tables S1-4 1
2 Supplementary Methods Cell proliferation, invasion and migration assays For the growth curve assay, cells were seeded in 24-well plates in triplicates. Cell numbers were counted over a period of 8 days. For the clonogenic assay, 500 or 1,000 cells were plated in 6-well plates. The developed colonies were stained with 1% crystal violet and counted after 14 or 21-day incubation. In vitro cell invasion or migration was determined by Boyden chambers (transwell inserts, 8 μm pore size) precoated with growth factor reduced Matrigel matrix (invasion assay, BD Biosciences) or collagen I (migration assay), respectively cells were seeded inside transwell inserts containing medium without serum for 48-hour incubation. The invading or migrating cells on the lower surface of the filters were fixed with 4% formaldehyde, stained using 1% crystal violet, and quantified by counting the number of stained cells in 5 independent fields. Quantitative real-time PCR (qpcr) The qpcr program was: a hot start at 95 o C for 5 minutes followed by 40 cycles of denaturation at 95 o C for 15 seconds, annealing at 60 o C for 30 seconds and elongation at 72 o C for 30 seconds. Data were analyzed by 2 -ΔΔCT method (1), normalized to β-actin and represented as the average fold of three independent experiments. The primer sequences used for PCR analysis are listed below. 2
3 Gene Forward (5-3 ) Reverse (5-3 ) SREBP-2 CCCCTGACTTCCCTGCTGCA GCGCGAGTGTGGCCGGATC c-myc TCAAGAGGCGAACACACAAC GGCCTTTTCATTGTTTTCCA ALDH1A1 AGTGCCCCTTTGGTGGATTC AAGAGCTTCTCTCCACTCTTG CD44 TCAGAGGAGTAGGAGAGAGGAAAC GAAAAGTCAAAGTAACAATAACAGTGG NANOG ATGCCTCACACGGAGACTGT AAGTGGGTTGTTTGCCTTTG SOX-2 HMGCS1 HMGCR MVK MVD LDLR TTGCTGCCTCTTTAAGACTAGGA GAGGGCTTCGTGGGACACATA GTCATTCCAGCCAAGGTTGT CCTTGTGGCTGGCGTCAGAAA ACCACGGGGACACCACGGT CAACGGCTCAGACGAGCAAG CTGGGGCTCAAACTTCTCTC GCCACTGGGATGGATCTTT GGGACCACTTGCTTCCATTA CGAGGGCATTCAGATGGTGCT CCACACAGCAGCCACAAACTC AGTCACAGACGAACTGCCGAGA β-actin CAAGGCCAACCGCGAGAAGATGAC GCCAGAGGCGTACAGGGATAGCACA Immunofluorescence staining Cells were fixed with 10% formalin and permeabilized with 0.1% Triton X-100 in PBS. After washing with PBS, cells were blocked with 1% BSA for 1 hour. Anti- SREBP-2 (Abcam, ab30862) primary antibody was added and incubated at 4 o C overnight. After washing twice in PBS, anti-rabbit IgG-FITC (sc-2090, Santa Cruz Technology) secondary antibody was added and incubated for 1 hour. For the examination of nuclear morphology, cells were stained with DAPI solution (1 μg/ml) for 10 minutes. Fluorescence images were visualized by fluorescence microscopy (Nikon Eclipe Ti) (2). Flow cytometric analysis ALDH activity was determined by flow cytometric analysis using the ALDEFLOUR TM Kit (StemCell Technologies). Briefly, cells were harvested and incubated in ALDHEFLUOR assay buffer containing the substrate at 37 o C for 30 3
4 minutes. Cells treated with diethylaminobenzaldehyde (DEAB, an ALDH inhibitor) were used to define sorting gates based on baseline fluorescence. For sorting a CD44 + /CD24 - cell population, cells were dissociated with Accutase (Sigma-Aldrich) and washed twice in PBS with 0.5% FBS. Fluorochrome-conjugated monoclonal antibodies against CD44 (PE/Cy5, BioLegend) and CD24 (PE, BioLegend) were added to the cell suspension at appropriate concentrations recommended by the manufacturer and incubated at 4 C for 30 minutes in the dark. FACS was performed by a BD FACScan flow cytometer (BD Biosciences). Data were analyzed using FlowJo software (Tree Star). Chromatin immunoprecipitation (ChIP) analysis ChIP was conducted using an EZ-ChIP TM -Chromatin Immunoprecipitation Kit (Millipore) following the manufacturer s instructions. Cells were fixed with 1% formaldehyde for 10 minutes and lysed in SDS lysis buffer supplemented with protease inhibitor cocktail. The chromatin was sheared by sonication to generate bp cross-linked DNA fragments. Immunoprecipitation was performed at 4 C overnight with anti-srebp-2 antibody (Abcam) or IgG. After binding with protein A/G-Sepharose and washing with low- and high- salt wash buffer, the immunoprecipitated DNA was eluted and de-crosslinked by incubating at 65 C overnight. After treatment with RNase A and Proteinase K, the DNA was purified using spin columns and subsequently subjected to qpcr using different sets of primers specific to c-myc promoter region encompassing different putative SREBP-2-binding sites, SRE-S1, SRE-S2, SRE-S3 and SRE-S4. One percent of chromatin prior to immunoprecipitation was saved as input and specific 4
5 enrichment of SREBP-2-bound DNA was calculated from three separate experiments. Primer sequences used for ChIP analysis are listed below. Site Forward (5-3 ) Reverse (5-3 ) SRE-S1 GAGCGAATAGGGGGCTTC GCTCGGGTGTTGTAAGTTCC SRE-S2 CCGGCTAGGGTGGAAGAG GCTGCTATGGGCAAAGTTTC SRE-S3 GGGTTCCCAAAGCAGAGG GGTCCTCAGCCGTCCAGA SRE-S4 CATGCGGCTCTCTTACTCTG CCCTCTGCTTTGGGAACC Histology and immunohistochemical (IHC) staining For histological examination, tumors or organs harvested from euthanized mice were fixed with 4% formaldehyde solution overnight, embedded in paraffin and cut into 5-μmthick sections. The deparaffinized sections were stained with hematoxylin and eosin (H&E). IHC staining was conducted using primary antibodies against SREBP-2 (ab30682, 1:100; Abcam), c-myc (ab32072, 1:50; Abcam), ALDH1A1 (HPA002123, 1:100; Sigma-Aldrich), CD44 (5640, 1:100; Cell Signaling Technology) or Ki67 (ab16667, 1:100; Abcam) as described previously (2). The total IHC score (mixed cytoplasmic/nucleic staining) was calculated as the value of the percentage of positive staining staining intensity, ranged from 0 to 12 as reported previously (3-5). The percentage of positive staining was scored as follows: negative as 0, less than 25% of tumor cells as 1, 25-50% of tumor cells as 2, 50-75% of tumor cells as 3, or more than 75% of tumor cells as 4. The quantitative expression levels of SREBP-2, c-myc, ALDH1A1 and CD44 were defined as follows: + (weak, score 1-4), ++ (moderate, score 5-8), or +++ (strong, score 9-12). All scoring was performed by pathologists at Cedars-Sinai Medical Center. 5
6 Supplemental References 1. Livak KJ, Schmittgen TD. Analysis of relative gene expression data using real-time quantitative PCR and the 2(-Delta Delta C(T)) Method. Methods 2001; 25: Li X, Chen YT, Hu P, Huang WC. Fatostatin Displays High Anti-Tumor Activity in Prostate Cancer by Blocking SREBP-Regulated Metabolic Pathways and Androgen Receptor Signaling. Mol Cancer Ther De Marzo AM, Knudsen B, Chan-Tack K, Epstein JI. E-cadherin expression as a marker of tumor aggressiveness in routinely processed radical prostatectomy specimens. Urology 1999; 53: ten Berge RL, Snijdewint FG, von Mensdorff-Pouilly S, et al. MUC1 (EMA) is preferentially expressed by ALK positive anaplastic large cell lymphoma, in the normally glycosylated or only partly hypoglycosylated form. J Clin Pathol 2001; 54: Koo CL, Kok LF, Lee MY, et al. Scoring mechanisms of p16ink4a immunohistochemistry based on either independent nucleic stain or mixed cytoplasmic with nucleic expression can significantly signal to distinguish between endocervical and endometrial adenocarcinomas in a tissue microarray study. J Transl Med 2009; 7: 25. 6
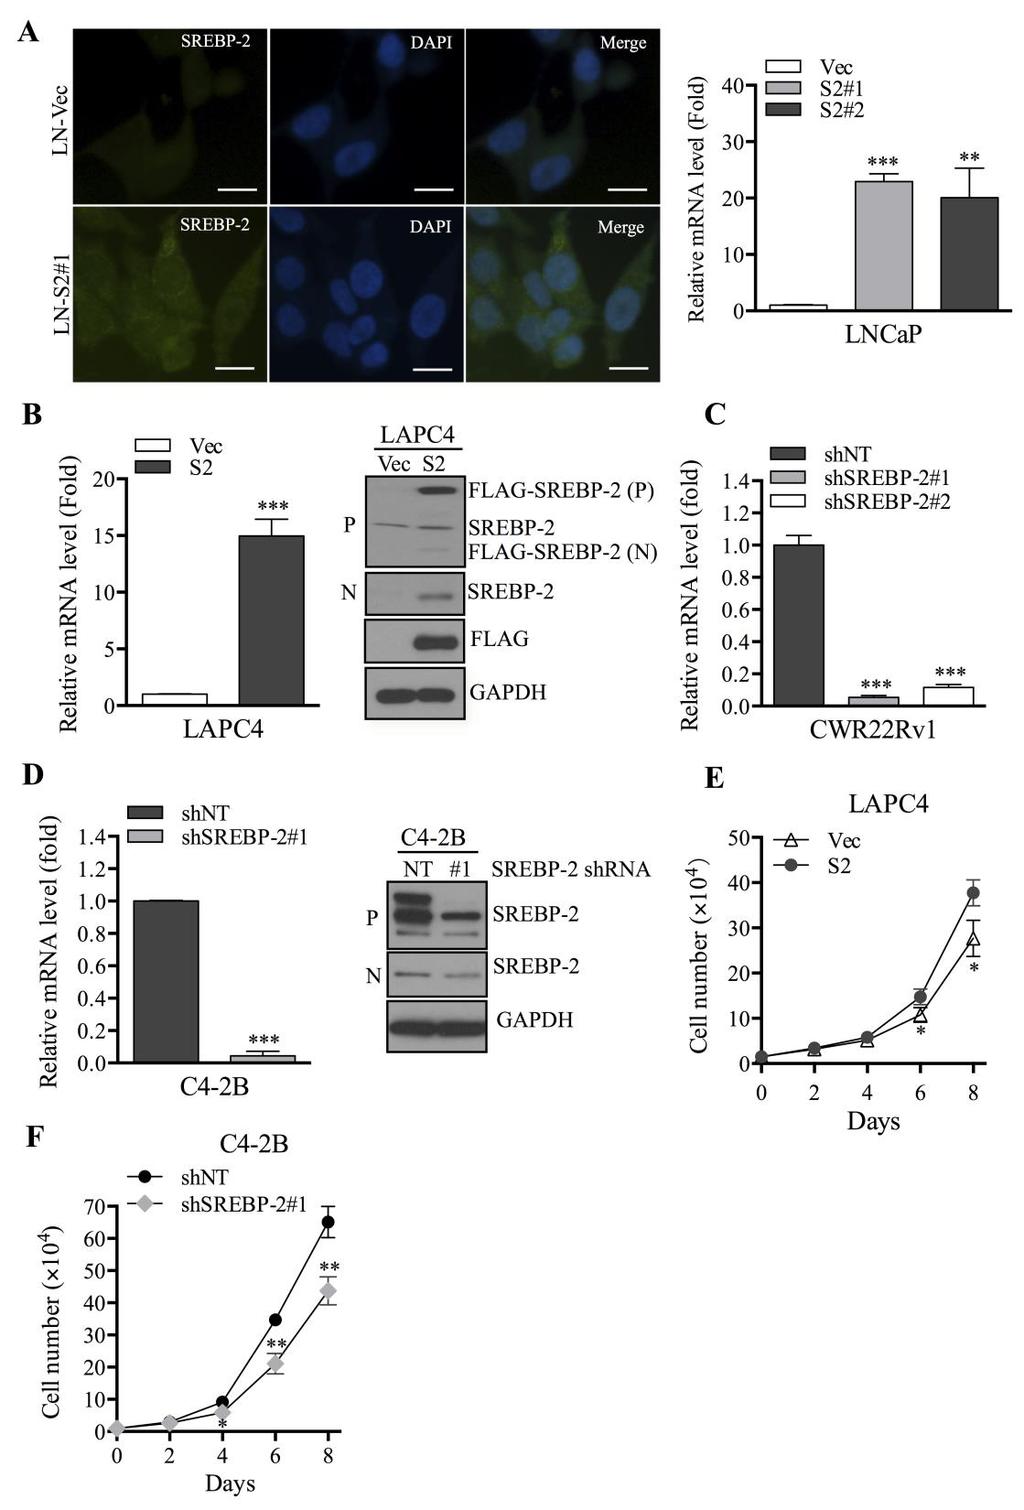
7 Supplementary Figure Legends Supplementary Figure S1. Analysis of SREBP-2 expression in human PCa tissues (Grasso Prostate, Oncomine database). A, boxplot displayed expression pattern of SREBP-2 in local prostate cancer (LPC, n=59) and metastatic castrate-resistant prostate cancer (mcrpc, n=35). B, correlation between SREBP-2 expression and overall survival in PCa patients from the data set in A. Supplementary Figure S2. Establishment of SREBP-2-overexpressing and -knockdown PCa cells and the effect of SREBP-2 on cell proliferation. A, immunofluorescence staining and qpcr analysis of SREBP-2 expression in LN-Vec (vector control), LN-S2#1 (SREBP-2-overexpressing clone 1) and LN-S2#2 (SREBP-2-overexpressing clone 2) cells. **P < 0.01, ***P < B, qpcr and Western blot analysis of SREBP-2 expression in LA-Vec (vector control) and LA-S2 (SREBP-2-overexpressing) cells. ***P < GAPDH was used as a loading control. P, precursor form of SREBP-2; N, nuclear form of SREBP-2. C, qpcr analysis of SREBP-2 expression in CWR22Rv1 shnt (non-targeting shrna), shsrebp-2#1 and shsrebp-2#2 (SREBP-2 shrna) cells. ***P < D, qpcr and Western blot analysis of SREBP-2 expression in C4-2B-shNT (non-targeting shrna) and C4-2B-shSREBP-2#1 (SREBP-2 shrna). ***P < E, growth curve of LA-Vec and LA-S2 cells. Data represent the mean ± SD of three separate experiments. *P < F, growth curve of C4-2B shnt and C4-2B shsrebp-2#1 cells. Data represent the mean ± SD of three separate experiments. *P < 0.05, **P <
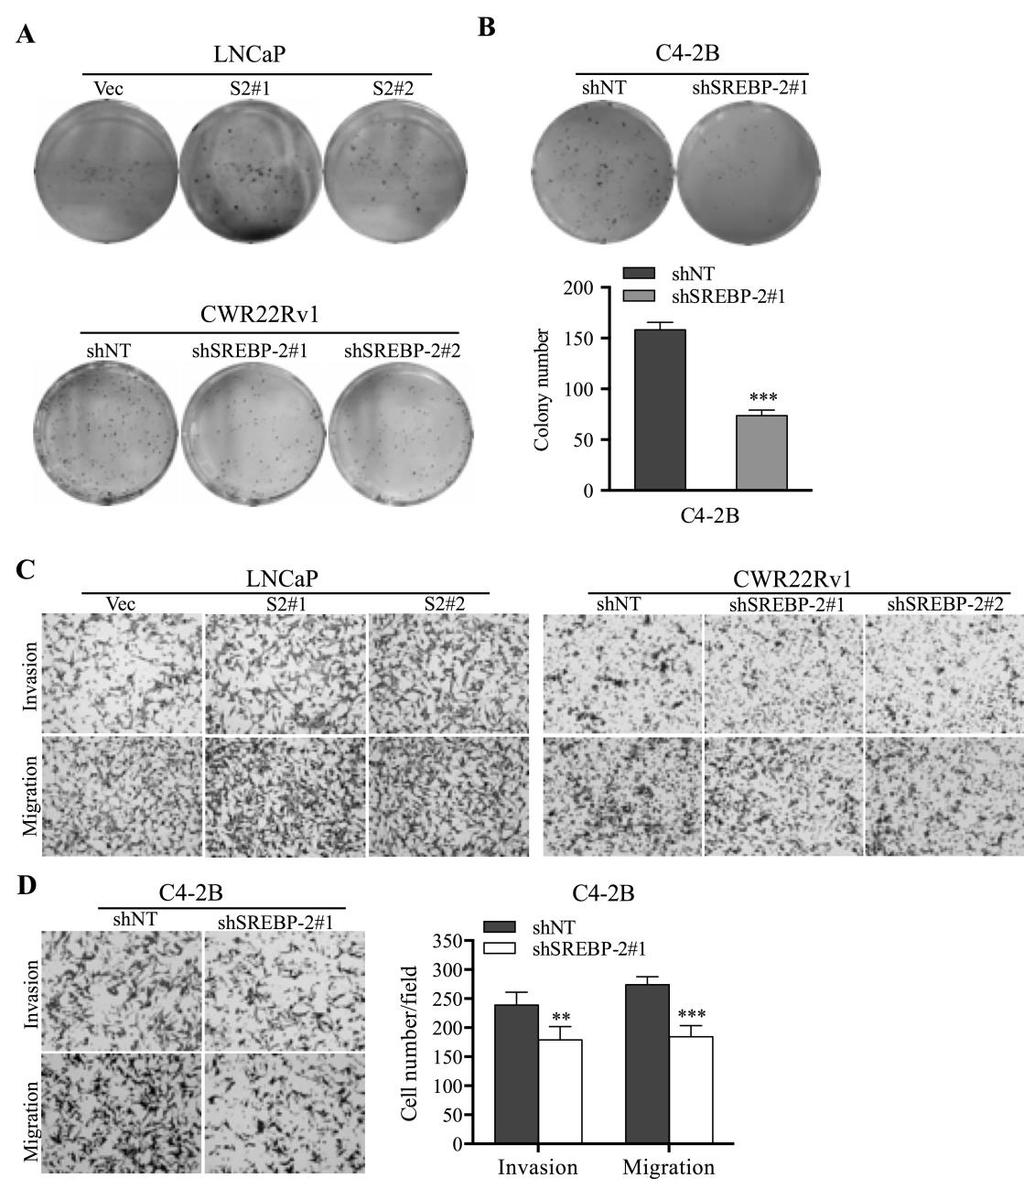
8 Supplementary Figure S3. SREBP-2 increases colony formation, invasion and migration in PCa cells. A, developed colonies of LN-Vec, LN-S2#1 and LN-S2#2 cells (upper panel) and CWR22Rv1 shnt, shsrebp-2#1 and shsrebp-2#2 cells (lower panel) stained by crystal violet were photographed. B, developed colonies of C4-2B shnt and C4-2B shsrebp-2#1 cells were stained by crystal violet, counted and shown as the mean ± SD from three separate experiments. ***P < C, representative images of invaded or migrated SREBP-2-overexpressing LNCaP cells (left panel; Vec, S2#1 and S2#2) and SREBP-2-knockdown CWR22Rv1 cells (right panel; shnt, shsrebp-2#1 and shsrebp-2#2). D, invasion or migration assays of C4-2B shnt and shsrebp-2#1 cells. Data was shown as the mean ± SD from three separate experiments. **P < 0.01, ***P < Supplementary Figure S4. SREBP-2 induces stem cell population and prostasphere formation in PCa cells. A, Western blot analysis for c-myc and ALDH1A1 in LN-Vec, LN-S2#1 and LN-S2#2 cells. GAPDH was used as a loading control. B, ALDH activity of LN-Vec, LN-S2#1 and LN-S2#2 cells was assessed by flow cytometry using an ALDEFLUOR kit. DEAB was used to establish the baseline fluorescence of these cells and define the ALDEFLUOR-positive region. C, primary and secondary prostasphere formation and expression of c-myc, ALDH1A1 and CD44 mrna levels in LA-Vec and LA-S2 cells. Representative images were shown at the bottom and the numbers of primary and secondary prostaspheres were counted and shown as the mean ± SD from four separate experiments. ***P < Scale bar = 20 μm. 8
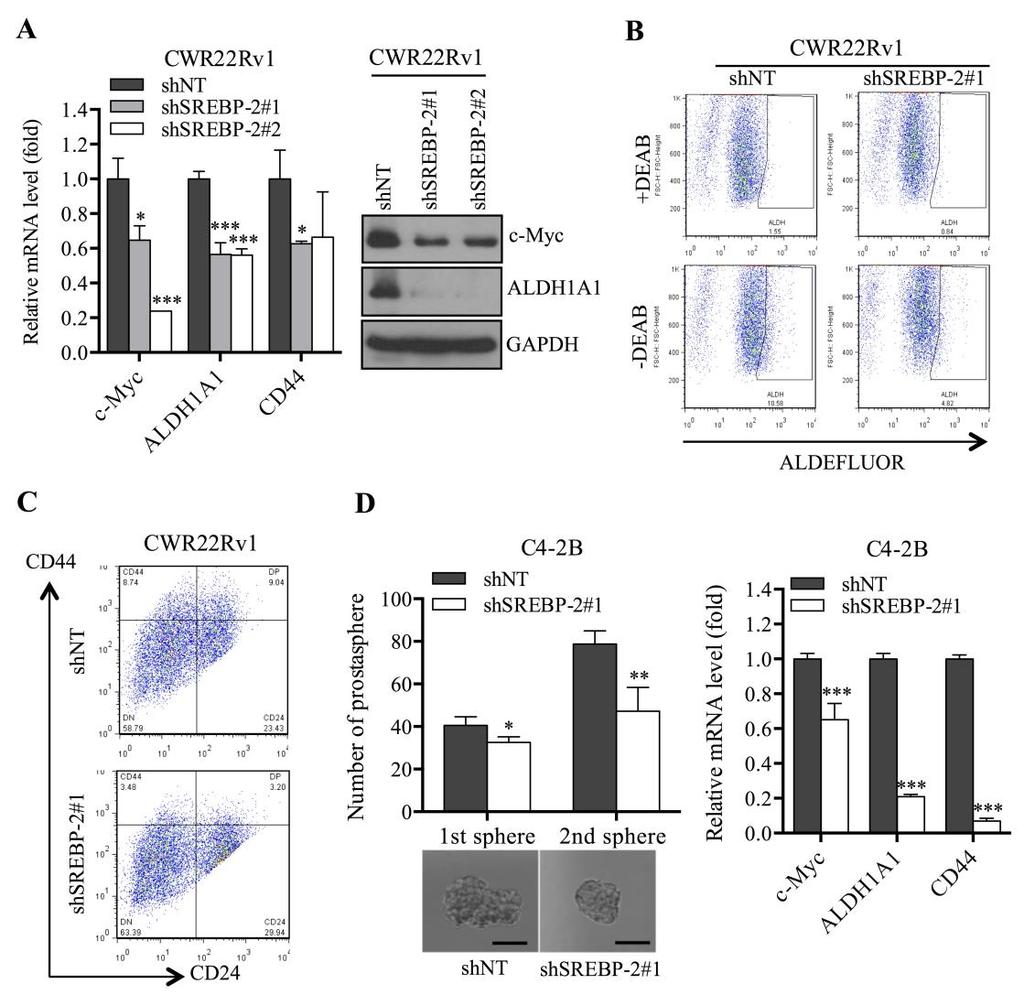
9 Supplementary Figure S5. SREBP-2 silencing reduces stem cell population and prostasphere formation in PCa cells. A, qpcr and Western blot analysis of c-myc, ALDH1A1 and CD44 expression in CWR22Rv1 shnt, shsrebp-2#1 and shsrebp- 2#2 cells. The bar graphs show the mean ± SD from three independent experiments. *P < 0.05, ***P < B, ALDH activity of CWR22Rv1 shnt and shsrebp-2#1 cells was assessed by flow cytometry using an ALDEFLUOR kit. C, representative plots of flowcytometric analyses for CD44-PE/Cy5/CD24-PE stained CWR22Rv1 shnt and shsrebp-2#1 cells. D, numbers and representative images of primary and secondary prostaspheres and qpcr analyses of c-myc, ALDH1A1 and CD44 in C4-2B shnt and shsrebp-2#1 cells. The bar graphs show the mean ± SD from three independent experiments. *P < 0.05, **P < 0.01, ***P < Scale bar = 20 μm. Supplementary Figure S6. SREBP-2 promotes PCa stem cell-like properties through transcriptional activation of c-myc. A, Western blot analysis of c-myc in various normal/non-cancerous prostate epithelial and PCa cell lines. The correlation of SREBP-2 (nuclear form, N-SREBP-2) and c-myc in these cell lines was calculated by Pearson s R correlation test (right panel). B, scatter plots showing the correlation between SREBP-2 and c-myc in the patients from Taylor Prostate 3 databases. C, schematic representation of the nucleotide sequences for 5 putative SREBP cis-acting sites in the 5 -flanking c- Myc promoter region (Del-4). D, ChIP analysis of LNCaP cells immunoprecipitated by anti-srebp-2 or IgG antibody followed by qpcr using 4 sets of primers for the SREBP- 2-binding sites, SRE-S1, S2, S3 and S4 in the c-myc promoter. Input: 2% of total lysate. **P < 0.01, N.S., no significance. E, numbers and representative images of the developed 9
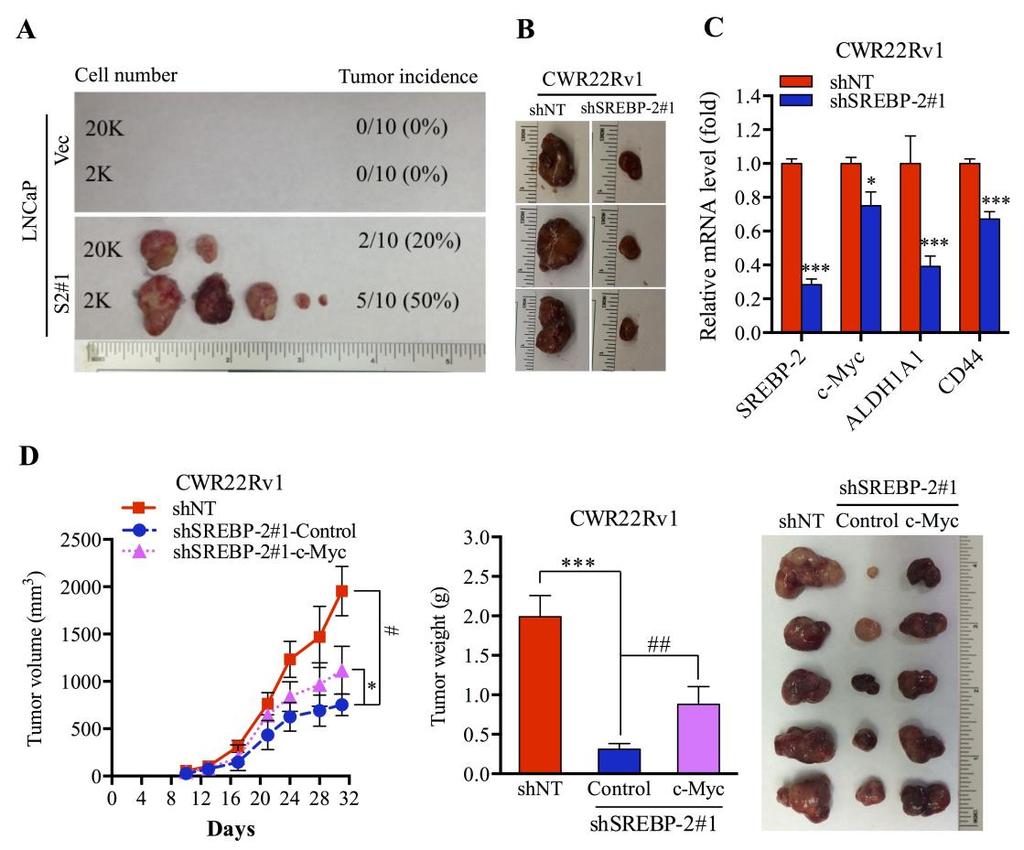
10 colonies of LN-Vec and LN-S2#1 cells transfected with control or c-myc sirna-1. Data were shown as the mean ± SD from three independent experiments. *P < 0.05, compared with LN-Vec cells; ## P < 0.01, compared with LN-S2#1 control sirna cells. F, numbers and representative images of the developed colonies of CWR22Rv1 shnt and shsrebp-2#1 cells transduced with control (shsrebp-2#1-control) or c-myc expression (shsrebp-2#1-c-myc) vector. Data represented as the mean ± SD collected from three independent experiments, ***P < 0.001, compared with shnt cells. ###P < 0.001, compared with shsrebp-2#1-control cells. Supplementary Figure S7. SREBP-2 plays an important role in PCa tumorigenicity through activation of c-myc in vivo. A, xenograft tumors and tumor incidence derived from LN-Vec and LN-S2#1 cells in NOD.SCID mice 120 days after subcutaneous inoculation. Cells (2K or 20K cells) were resuspended in a total volume of 100 μl PBS containing 50% Matrigel and subcutaneously injected into the flanks of the mice. B, representative images of subcutaneous CWR22Rv1 shnt and shsrebp-2#1 tumors (31 days after the injection). C, qpcr analysis of SREBP-2, c-myc, ALDH1A1 and CD44 expression in subcutaneous CWR22Rv1 shnt and shsrebp-2#1 tumors. Data were shown as the mean ± SD from each group (N = 4). *P < 0.05, ***P < D, tumor growth after injection of CWR22Rv1 shnt, shsrebp-2#1-control and shsrebp-2#1-c- Myc cells (N = 5 mice for each group) in nude mice was determined by measuring tumor size (the mean SEM) at the indicated time. *P < 0.05, compared with shnt tumor; #P < 0.05, compared with shsrebp-2#1-control tumor (left panel). Tumor weight and the image from xenograft mouse model injected with CWR22Rv1 shnt, shsrebp-2#1-10
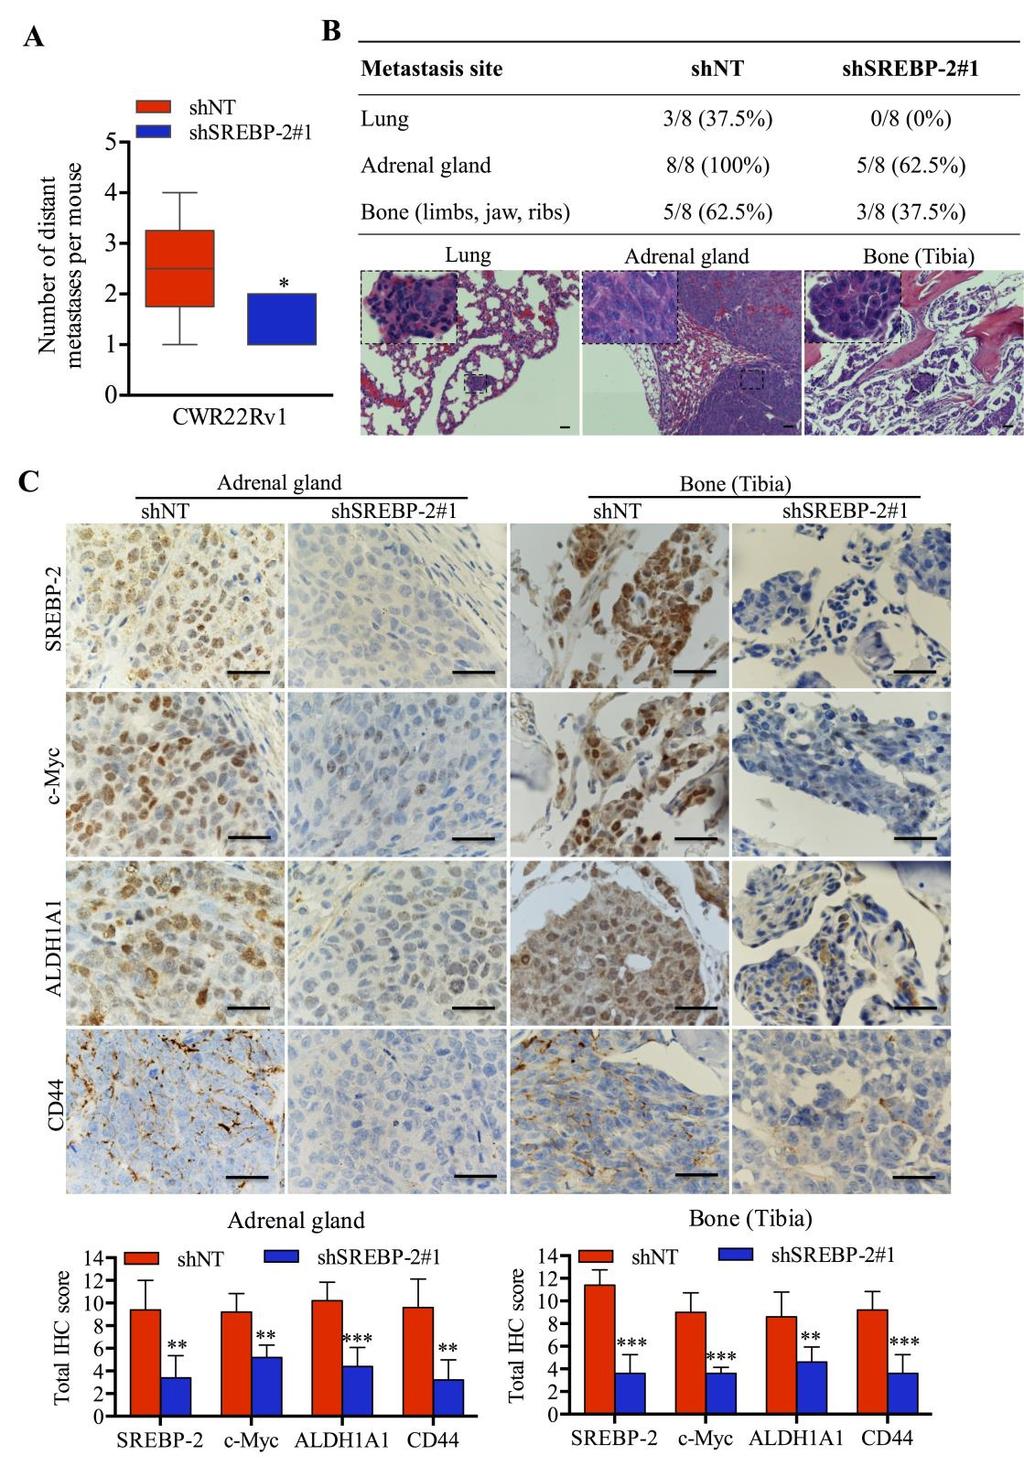
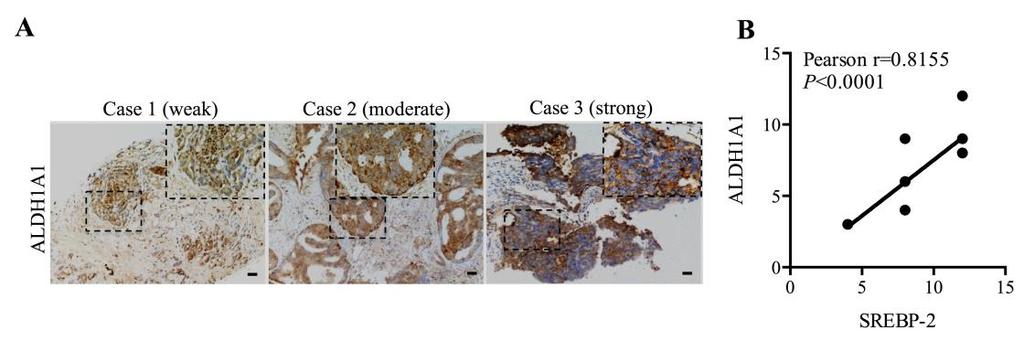
11 Control and shsrebp-2#1-c-myc cells were shown (right panel). ***P < 0.001, compared with shnt tumor; ##P < 0.01, compared with shsrebp-2#1-control tumor. Supplementary Figure S8. SREBP-2 promotes PCa metastasis in vivo. A, bar graphs showing the number of distant metastatic sites observed by luciferase signal in mice 5 weeks after intracardiac injection of CWR22Rv1 shnt and shsrebp-2#1 cells. *P < B, summary of CWR22Rv1 shnt and shsrebp-2#1 tumor metastatic sites 5 weeks after intracardiac injection. SREBP-2 knockdown reduced the frequency and burden of PCa metastatic progression. Representative H&E staining of lung, adrenal gland and tibia tissues harvested from mice bearing CWR22Rv1 shnt tumors. The enlarged areas of metastatic tumor are indicated in the dashed rectangle. Scale bar = 20 μm. C, IHC analysis of SREBP-2, c-myc, ALDH1A1 and CD44 expressions in adrenal gland and bone tissues from mice bearing metastatic CWR22Rv1 shnt or shsrebp-2#1 tumors. Quantitative analysis was reported as total IHC score by assessing the intensity of each staining and the percentage of positive cells, and shown as the mean ± SD from each group (bottom panel). Scale bar = 20 μm. *P < 0.05, **P < 0.01, ***P < Supplementary Figure S9. SREBP-2 expression was associated with ALDH1A1 in clinical PCa specimens. A, representative images showing weak, moderate or strong ALDH1A1 expression relative to SREBP-2 level (Fig. 4A, top panel). Scale bar = 20 μm. B, scatter plots showing the positive correlation between SREBP-2 and ALDH1A1 in PCa patients. 11
12 Supplementary Figure S10. SREBP-2 induces epithelial to mesenchymal transition (EMT) in LNCaP cells. A, representative phase-contrast images of LN-Vec, LN-S2#1 and LN-S2#2 cells. Scale bar = 20 μm. B, overexpression of SREBP-2 results in gain of mesenchymal markers (N-Cad, Vimentin, Snail2 and ZEB1) and loss of epithelial markers (E-Cad) in LN-Vec, LN-S2#1 and LN-S2#2 cells determined by qpcr. *P < 0.05, **P < 0.01, ***P < C, Western blot analysis revealed increases in N-Cad and Vimentin and decrease in E-Cad with SREBP-2. GAPDH was used to show equal loading. N-Cad, N-cadherin; E-Cad, E-cadherin. Supplementary Figure S11. Stem cell-like properties mediated by SREBP-2 are not through cholesterol metabolism in PCa cells. A, qpcr analysis of HMGCS1, HMGCR, MVD, and LDLR mrna levels (left panel) and Western blot analysis of HMGCR expression (right panel) in control (LN-Vec) and SREBP-2-overexpressing LNCaP cells (LN-S2#1 and LN-S2#2). B, qpcr analysis of HMGCS1, HMGCR, MVK, MVD, and LDLR mrna levels (left panel) and Western blot analysis of HMGCR expression (right panel) in control (shnt) and SREBP-2-knockdown CWR22Rv1 cells (shsrebp-2#1 and shsrebp-2#2). qpcr data were normalized to β-actin and represent the mean ± SD of three independent experiments. *P < 0.05, **P < 0.01, ***P < C, primary and secondary prostasphere formation of LN-Vec and LN-S2#1 cells treated with vehicle or Simvastatin (10 μm) for 24 hours (top panel). Representative images of prostaspheres from one experiment were shown at the bottom. Scale bar = 20 μm. N.S., no significance. D, qpcr and Western blot analyses of SREBP-2 and stemness related markers (c-myc, ALDH1A1 and CD44) in LN-Vec and LN-S2#1 cells treated with vehicle or Simvastatin 12
13 after 24-hour treatment. GAPDH was used as a loading control. N.S., no significance. E, primary and secondary prostasphere formation of CWR22Rv1 shnt and shsrebp-2#1 cells treated with additional cholesterol (10 μm) for 48 hours (top panel). Representative images of prostaspheres from one experiment were shown at the bottom. Scale bar = 20 μm. N.S., no significance. F, qpcr and Western blot analyses of SREBP-2 and stemness related markers in CWR22Rv1 shsrebp-2#1 cells treated with cholesterol for 48 hours. N.S., no significance. 13
14 Supplementary Figure S1 14
15 Supplementary Figure S2 15
16 Supplementary Figure S3 16
17 Supplementary Figure S4 17
18 Supplementary Figure S5 18
19 Supplementary Figure S6 19
20 Supplementary Figure S7 20
21 Supplementary Figure S8 21
22 Supplementary Figure S9 22

23 Supplementary Figure S10 23

24 Supplementary Figure S11 24

25 Supplementary Table S1. Clinical and pathological characteristics of human PCa TMA and SREBP-2 expression Note: + (weak, score 1-4), ++ (moderate, score 5-8) or +++ (strong, score 9-12). 25

26 Supplementary Table S2. Clinical and pathological characteristics of human PCa specimens and the correlation of SREBP-2 with c-myc or ALDH1A1 expression Note: + (weak, score 1-4), ++ (moderate, score 5-8) or +++ (strong, score 9-12). 26
27 Supplementary Table S3. The correlation of SREBP-2 and c-myc expression in human PCa tissues Number (%) SREBP-2 χ 2* P Weak Moderate Strong Weak 2 (11.8%) 1 (5.9%) 0 c-myc Moderate 0 1 (5.9%) 2 (11.8%) Strong 0 4 (23.5%) 7 (41.2%) Note: weak, score 1-4 (+); moderate, score 5-8 (++); or strong, score 9-12 (+++). * Chi-square test. 27
28 Supplementary Table S4. The correlation of SREBP-2 and ALDH1A1 expression in human PCa tissues Number (%) SREBP-2 χ 2* P Weak Moderate Strong Weak 2 (11.8%) 0 2 (11.8%) ALDH1A1 Moderate 0 5 (29.4%) 3 (17.6%) Strong 0 1 (5.9%) 4 (23.5%) Note: weak, score 1-4 (+); moderate, score 5-8 (++); or strong, score 9-12 (+++). * Chi-square test. 28
Supplementary Information and Figure legends
 Supplementary Information and Figure legends Table S1. Primers for quantitative RT-PCR Target Sequence (5 -> 3 ) Target Sequence (5 -> 3 ) DAB2IP F:TGGACGATGTGCTCTATGCC R:GGATGGTGATGGTTTGGTAG Snail F:CCTCCCTGTCAGATGAGGAC
(A) RT-PCR for components of the Shh/Gli pathway in normal fetus cell (MRC-5) and a
 RT-PCR for components of the Shh/Gli pathway in normal fetus cell (MRC-5) and a") Supplementary figure legends Supplementary Figure 1. Expression of Shh signaling components in a panel of gastric cancer. (A) RT-PCR for components of the Shh/Gli pathway in normal fetus cell (MRC-5) and
Supplementary figure legends Supplementary Figure 1. Expression of Shh signaling components in a panel of gastric cancer. (A) RT-PCR for components of the Shh/Gli pathway in normal fetus cell (MRC-5) and
Supplementary Figures
 Supplementary Figures Supplementary Figure 1 DOT1L regulates the expression of epithelial and mesenchymal markers. (a) The expression levels and cellular localizations of EMT markers were confirmed by
(a) Significant biological processes (upper panel) and disease biomarkers (lower panel)
 Significant biological processes (upper panel) and disease biomarkers (lower panel)") Supplementary Figure 1. Functional enrichment analyses of secretomic proteins. (a) Significant biological processes (upper panel) and disease biomarkers (lower panel) 2 involved by hrab37-mediated secretory
Supplementary Figure 1. Functional enrichment analyses of secretomic proteins. (a) Significant biological processes (upper panel) and disease biomarkers (lower panel) 2 involved by hrab37-mediated secretory
(A) PCR primers (arrows) designed to distinguish wild type (P1+P2), targeted (P1+P2) and excised (P1+P3)14-
 PCR primers (arrows) designed to distinguish wild type (P1+P2), targeted (P1+P2) and excised (P1+P3)14-") 1 Supplemental Figure Legends Figure S1. Mammary tumors of ErbB2 KI mice with 14-3-3σ ablation have elevated ErbB2 transcript levels and cell proliferation (A) PCR primers (arrows) designed to distinguish
1 Supplemental Figure Legends Figure S1. Mammary tumors of ErbB2 KI mice with 14-3-3σ ablation have elevated ErbB2 transcript levels and cell proliferation (A) PCR primers (arrows) designed to distinguish
Supplementary Figure (OH) 22 nanoparticles did not affect cell viability and apoposis. MDA-MB-231, MCF-7, MCF-10A and BT549 cells were
 22 nanoparticles did not affect cell viability and apoposis. MDA-MB-231, MCF-7, MCF-10A and BT549 cells were") Supplementary Figure 1. Gd@C 82 (OH) 22 nanoparticles did not affect cell viability and apoposis. MDA-MB-231, MCF-7, MCF-10A and BT549 cells were treated with PBS, Gd@C 82 (OH) 22, C 60 (OH) 22 or GdCl
Supplementary Figure 1. Gd@C 82 (OH) 22 nanoparticles did not affect cell viability and apoposis. MDA-MB-231, MCF-7, MCF-10A and BT549 cells were treated with PBS, Gd@C 82 (OH) 22, C 60 (OH) 22 or GdCl
SUPPLEMENTARY INFORMATION. Supplementary Figures S1-S9. Supplementary Methods
 SUPPLEMENTARY INFORMATION SUMO1 modification of PTEN regulates tumorigenesis by controlling its association with the plasma membrane Jian Huang 1,2#, Jie Yan 1,2#, Jian Zhang 3#, Shiguo Zhu 1, Yanli Wang
Supplementary Figure 1. HOPX is hypermethylated in NPC. (a) Methylation levels of HOPX in Normal (n = 24) and NPC (n = 24) tissues from the
 Methylation levels of HOPX in Normal (n = 24) and NPC (n = 24) tissues from the") Supplementary Figure 1. HOPX is hypermethylated in NPC. (a) Methylation levels of HOPX in Normal (n = 24) and NPC (n = 24) tissues from the genome-wide methylation microarray data. Mean ± s.d.; Student
Supplementary Figure 1. HOPX is hypermethylated in NPC. (a) Methylation levels of HOPX in Normal (n = 24) and NPC (n = 24) tissues from the genome-wide methylation microarray data. Mean ± s.d.; Student
Supplementary Figures
 Supplementary Figures Supplementary Figure 1 Characterization of stable expression of GlucB and sshbira in the CT26 cell line (a) Live cell imaging of stable CT26 cells expressing green fluorescent protein
Supplementary Figure 1.TRIM33 binds β-catenin in the nucleus. a & b, Co-IP of endogenous TRIM33 with β-catenin in HT-29 cells (a) and HEK 293T cells
 and HEK 293T cells") Supplementary Figure 1.TRIM33 binds β-catenin in the nucleus. a & b, Co-IP of endogenous TRIM33 with β-catenin in HT-29 cells (a) and HEK 293T cells (b). TRIM33 was immunoprecipitated, and the amount of
Supplementary Figure 1.TRIM33 binds β-catenin in the nucleus. a & b, Co-IP of endogenous TRIM33 with β-catenin in HT-29 cells (a) and HEK 293T cells (b). TRIM33 was immunoprecipitated, and the amount of
Supplementary Materials and Methods
 DD2 suppresses tumorigenicity of ovarian cancer cells by limiting cancer stem cell population Chunhua Han et al. Supplementary Materials and Methods Analysis of publicly available datasets: To analyze
Suppl Video: Tumor cells (green) and monocytes (white) are seeded on a confluent endothelial
 and monocytes (white) are seeded on a confluent endothelial") Supplementary Information Häuselmann et al. Monocyte induction of E-selectin-mediated endothelial activation releases VE-cadherin junctions to promote tumor cell extravasation in the metastasis cascade
Supplementary Information Häuselmann et al. Monocyte induction of E-selectin-mediated endothelial activation releases VE-cadherin junctions to promote tumor cell extravasation in the metastasis cascade
RNA extraction, RT-PCR and real-time PCR. Total RNA were extracted using
 Supplementary Information Materials and Methods RNA extraction, RT-PCR and real-time PCR. Total RNA were extracted using Trizol reagent (Invitrogen,Carlsbad, CA) according to the manufacturer's instructions.
Supplemental information
 Carcinoemryonic antigen-related cell adhesion molecule 6 (CEACAM6) promotes EGF receptor signaling of oral squamous cell carcinoma metastasis via the complex N-glycosylation y Chiang et al. Supplemental
Argininosuccinate synthetase 1 suppression and arginine restriction inhibit cell
 Argininosuccinate synthetase 1 suppression and arginine restriction inhibit cell migration in gastric cancer cell lines Yan-Shen Shan 1, Hui-Ping Hsu 1, Ming-Derg Lai 2,3, Meng-Chi Yen 2,4, Wei-Ching Chen
mir-509-5p and mir-1243 increase the sensitivity to gemcitabine by inhibiting
 mir-509-5p and mir-1243 increase the sensitivity to gemcitabine by inhibiting epithelial-mesenchymal transition in pancreatic cancer Hidekazu Hiramoto, M.D. 1,3, Tomoki Muramatsu, Ph.D. 1, Daisuke Ichikawa,
Supplementary Data Table of Contents:
 Supplementary Data Table of Contents: - Supplementary Methods - Supplementary Figures S1(A-B) - Supplementary Figures S2 (A-B) - Supplementary Figures S3 - Supplementary Figures S4(A-B) - Supplementary
Supplementary Table S1. Tumor samples used for analysis Tumor size (cm) BNG (grade) ERα PR. pn-
 BNG (grade) ERα PR. pn-") Supplementary Table S1. Tumor samples used for analysis Sample# Age Tumor size (cm) pn- Stage Stage BNG (grade) ERα PR HER2 (FISH) Triple negative T1 46 3 N1a III 2 Pos Neg N T2 58 1 N(i-) I 3 Pos Neg
Supplementary Table S1. Tumor samples used for analysis Sample# Age Tumor size (cm) pn- Stage Stage BNG (grade) ERα PR HER2 (FISH) Triple negative T1 46 3 N1a III 2 Pos Neg N T2 58 1 N(i-) I 3 Pos Neg
Type of file: PDF Size of file: 0 KB Title of file for HTML: Supplementary Information Description: Supplementary Figures
 Type of file: PDF Size of file: 0 KB Title of file for HTML: Supplementary Information Description: Supplementary Figures Supplementary Figure 1 mir-128-3p is highly expressed in chemoresistant, metastatic
Impact of hyper-o-glcnacylation on apoptosis and NF-κB activity SUPPLEMENTARY METHODS
 SUPPLEMENTARY METHODS 3D culture and cell proliferation- MiaPaCa-2 cell culture in 3D was performed as described previously (1). Briefly, 8-well glass chamber slides were evenly coated with 50 µl/well
SUPPLEMENTARY INFORMATION
 DOI: 10.1038/ncb2607 Figure S1 Elf5 loss promotes EMT in mammary epithelium while Elf5 overexpression inhibits TGFβ induced EMT. (a, c) Different confocal slices through the Z stack image. (b, d) 3D rendering
Supplementary Materials and Methods
 Supplementary Materials and Methods Immunoblotting Immunoblot analysis was performed as described previously (1). Due to high-molecular weight of MUC4 (~ 950 kda) and MUC1 (~ 250 kda) proteins, electrophoresis
injected subcutaneously into flanks of 6-8 week old athymic male nude mice (LNCaP SQ) and body
 and body") SUPPLEMENTAL FIGURE LEGENDS Figure S1: Generation of ENZR Xenografts and Cell Lines: (A) 1x10 6 LNCaP cells in matrigel were injected subcutaneously into flanks of 6-8 week old athymic male nude mice (LNCaP
SUPPLEMENTAL FIGURE LEGENDS Figure S1: Generation of ENZR Xenografts and Cell Lines: (A) 1x10 6 LNCaP cells in matrigel were injected subcutaneously into flanks of 6-8 week old athymic male nude mice (LNCaP
Supplemental Table S1
 Supplemental Table S. Tumorigenicity and metastatic potential of 44SQ cell subpopulations a Tumorigenicity b Average tumor volume (mm ) c Lung metastasis d CD high /4 8. 8/ CD low /4 6./ a Mice were injected
SUPPLEMENTARY INFORMATION
 DOI: 1.138/ncb3355 a S1A8 + cells/ total.1.8.6.4.2 b S1A8/?-Actin c % T-cell proliferation 3 25 2 15 1 5 T cells Supplementary Figure 1 Inter-tumoral heterogeneity of MDSC accumulation in mammary tumor
Supplemental Information
 Supplemental Information Tobacco-specific Carcinogen Induces DNA Methyltransferases 1 Accumulation through AKT/GSK3β/βTrCP/hnRNP-U in Mice and Lung Cancer patients Ruo-Kai Lin, 1 Yi-Shuan Hsieh, 2 Pinpin
Supplementary Figure 1. Characterization of ALDH-positive cell population in MCF-7 cells. (a) Expression level of stem cell markers in MCF-7 cells or
 Expression level of stem cell markers in MCF-7 cells or") Supplementary Figure 1. Characterization of ALDH-positive cell population in MCF-7 cells. (a) Expression level of stem cell markers in MCF-7 cells or ALDH-positive cell population by qpcr. Data represent
Supplementary Figure 1. Characterization of ALDH-positive cell population in MCF-7 cells. (a) Expression level of stem cell markers in MCF-7 cells or ALDH-positive cell population by qpcr. Data represent
Supplementary Figure 1 Role of Raf-1 in TLR2-Dectin-1-mediated cytokine expression
 Supplementary Figure 1 Supplementary Figure 1 Role of Raf-1 in TLR2-Dectin-1-mediated cytokine expression. Quantitative real-time PCR of indicated mrnas in DCs stimulated with TLR2-Dectin-1 agonist zymosan
Supplemental figure 1. PDGFRα is expressed dominantly by stromal cells surrounding mammary ducts and alveoli. A) IHC staining of PDGFRα in
 IHC staining of PDGFRα in") Supplemental figure 1. PDGFRα is expressed dominantly by stromal cells surrounding mammary ducts and alveoli. A) IHC staining of PDGFRα in nulliparous (left panel) and InvD6 mouse mammary glands (right
Supplemental figure 1. PDGFRα is expressed dominantly by stromal cells surrounding mammary ducts and alveoli. A) IHC staining of PDGFRα in nulliparous (left panel) and InvD6 mouse mammary glands (right
Supplementary Figure 1
 Supplementary Figure 1 Control Pancreatitis Supplementary Figure 2 A Panc Liver SI Spleen H 2 O B EZH2 fl/fl C EZH2 fl/fl 37bp EZH2 ERK2 D E 5 EZH2 fl/fl Fasting Glucose (mg/dl) 2 18 16 14 12 1 8 6 4 2
(A) Dose response curves of HMLE_shGFP (blue circle), HMLE_shEcad (red square),
 Dose response curves of HMLE_shGFP (blue circle), HMLE_shEcad (red square),") Supplementary Figures and Tables Figure S1. Validation of EMT-selective small molecules (A) Dose response curves of HMLE_shGFP (blue circle), HMLE_shEcad (red square), and HMLE_Twist (black diamond) cells
Supplementary Figures and Tables Figure S1. Validation of EMT-selective small molecules (A) Dose response curves of HMLE_shGFP (blue circle), HMLE_shEcad (red square), and HMLE_Twist (black diamond) cells
HCC1937 is the HCC1937-pcDNA3 cell line, which was derived from a breast cancer with a mutation
 SUPPLEMENTARY INFORMATION Materials and Methods Human cell lines and culture conditions HCC1937 is the HCC1937-pcDNA3 cell line, which was derived from a breast cancer with a mutation in exon 20 of BRCA1
Monoclonal antibody targeting of N-cadherin inhibits prostate cancer growth, metastasis and castration resistance
 Monoclonal antibody targeting of N-cadherin inhibits prostate cancer growth, metastasis and castration resistance Tanaka H, Kono E, Tran CP, Miyazaki H, Yamashiro J, Shimomura T, Ladan F, Wada R, Huang
Supplementary Information
 Supplementary Information Supplementary Figure 1. CD4 + T cell activation and lack of apoptosis after crosslinking with anti-cd3 + anti-cd28 + anti-cd160. (a) Flow cytometry of anti-cd160 (5D.10A11) binding
Supplemental Figure 1
 Supplemental Figure 1 1a 1c PD-1 MFI fold change 6 5 4 3 2 1 IL-1α IL-2 IL-4 IL-6 IL-1 IL-12 IL-13 IL-15 IL-17 IL-18 IL-21 IL-23 IFN-α Mut Human PD-1 promoter SBE-D 5 -GTCTG- -1.2kb SBE-P -CAGAC- -1.kb
Material and Methods. Flow Cytometry Analyses:
 Material and Methods Flow Cytometry Analyses: Immunostaining of breast cancer cells for HER2 was performed by incubating cells with anti- HER2/neu APC (Biosciences, Cat# 340554), anti-her2/neu PE (Biosciences,
SUPPLEMENTARY INFORMATION
 DOI:.38/ncb3399 a b c d FSP DAPI 5mm mm 5mm 5mm e Correspond to melanoma in-situ Figure a DCT FSP- f MITF mm mm MlanaA melanoma in-situ DCT 5mm FSP- mm mm mm mm mm g melanoma in-situ MITF MlanaA mm mm
Supplementary Figures
 Supplementary Figures Supplementary Fig. 1. Galectin-3 is present within tumors. (A) mrna expression levels of Lgals3 (galectin-3) and Lgals8 (galectin-8) in the four classes of cell lines as determined
Figure S1. PMVs from THP-1 cells expose phosphatidylserine and carry actin. A) Flow
 Flow") SUPPLEMENTARY DATA Supplementary Figure Legends Figure S1. PMVs from THP-1 cells expose phosphatidylserine and carry actin. A) Flow cytometry analysis of PMVs labelled with annexin-v-pe (Guava technologies)
SUPPLEMENTARY DATA Supplementary Figure Legends Figure S1. PMVs from THP-1 cells expose phosphatidylserine and carry actin. A) Flow cytometry analysis of PMVs labelled with annexin-v-pe (Guava technologies)
An epithelial-to-mesenchymal transition-inducing potential of. granulocyte macrophage colony-stimulating factor in colon. cancer
 An epithelial-to-mesenchymal transition-inducing potential of granulocyte macrophage colony-stimulating factor in colon cancer Yaqiong Chen, Zhi Zhao, Yu Chen, Zhonglin Lv, Xin Ding, Renxi Wang, He Xiao,
Supplementary Fig. 1: ATM is phosphorylated in HER2 breast cancer cell lines. (A) ATM is phosphorylated in SKBR3 cells depending on ATM and HER2
 ATM is phosphorylated in SKBR3 cells depending on ATM and HER2") Supplementary Fig. 1: ATM is phosphorylated in HER2 breast cancer cell lines. (A) ATM is phosphorylated in SKBR3 cells depending on ATM and HER2 activity. Upper panel: Representative histograms for FACS
Supplementary Fig. 1: ATM is phosphorylated in HER2 breast cancer cell lines. (A) ATM is phosphorylated in SKBR3 cells depending on ATM and HER2 activity. Upper panel: Representative histograms for FACS
Gladstone Institutes, University of California (UCSF), San Francisco, USA
, San Francisco, USA") Fluorescence-linked Antigen Quantification (FLAQ) Assay for Fast Quantification of HIV-1 p24 Gag Marianne Gesner, Mekhala Maiti, Robert Grant and Marielle Cavrois * Gladstone Institutes, University of
Fluorescence-linked Antigen Quantification (FLAQ) Assay for Fast Quantification of HIV-1 p24 Gag Marianne Gesner, Mekhala Maiti, Robert Grant and Marielle Cavrois * Gladstone Institutes, University of
Supplementary Figure 1. PAQR3 knockdown inhibits SREBP-2 processing in CHO-7 cells CHO-7 cells were transfected with control sirna or a sirna
 Supplementary Figure 1. PAQR3 knockdown inhibits SREBP-2 processing in CHO-7 cells CHO-7 cells were transfected with control sirna or a sirna targeted for hamster PAQR3. At 24 h after the transfection,
Epithelial interleukin-25 is a key mediator in Th2-high, corticosteroid-responsive
 Online Data Supplement: Epithelial interleukin-25 is a key mediator in Th2-high, corticosteroid-responsive asthma Dan Cheng, Zheng Xue, Lingling Yi, Huimin Shi, Kan Zhang, Xiaorong Huo, Luke R. Bonser,
(a) Schematic diagram of the FS mutation of UVRAG in exon 8 containing the highly instable
 Schematic diagram of the FS mutation of UVRAG in exon 8 containing the highly instable") Supplementary Figure 1. Frameshift (FS) mutation in UVRAG. (a) Schematic diagram of the FS mutation of UVRAG in exon 8 containing the highly instable A 10 DNA repeat, generating a premature stop codon
Supplementary Figure 1. Frameshift (FS) mutation in UVRAG. (a) Schematic diagram of the FS mutation of UVRAG in exon 8 containing the highly instable A 10 DNA repeat, generating a premature stop codon
Supplementary Table; Supplementary Figures and legends S1-S21; Supplementary Materials and Methods
 Silva et al. PTEN posttranslational inactivation and hyperactivation of the PI3K/Akt pathway sustain primary T cell leukemia viability Supplementary Table; Supplementary Figures and legends S1-S21; Supplementary
Essential Medium, containing 10% fetal bovine serum, 100 U/ml penicillin and 100 µg/ml streptomycin. Huvec were cultured in
 Supplemental data Methods Cell culture media formulations A-431 and U-87 MG cells were maintained in Dulbecco s Modified Eagle s Medium. FaDu cells were cultured in Eagle's Minimum Essential Medium, containing
PKCζ Promotes Breast Cancer Invasion by Regulating Expression of E-cadherin and Zonula Occludens-1 (ZO-1) via NFκB-p65
 via NFκB-p65") SUPPLEMENTARY INFORMATION TITLE: PKCζ Promotes Breast Cancer Invasion by Regulating Expression of E-cadherin and Zonula Occludens-1 (ZO-1) via NFκB-p65 RUNNING TITLE: PKCζ-NFκB Signaling in Breast Cancer
SUPPLEMENTARY INFORMATION TITLE: PKCζ Promotes Breast Cancer Invasion by Regulating Expression of E-cadherin and Zonula Occludens-1 (ZO-1) via NFκB-p65 RUNNING TITLE: PKCζ-NFκB Signaling in Breast Cancer
Supplementary Figure 1. Identification of tumorous sphere-forming CSCs and CAF feeder cells. The LEAP (Laser-Enabled Analysis and Processing)
") Supplementary Figure 1. Identification of tumorous sphere-forming CSCs and CAF feeder cells. The LEAP (Laser-Enabled Analysis and Processing) platform with laser manipulation to efficiently purify lung
Supplementary Figure 1. Identification of tumorous sphere-forming CSCs and CAF feeder cells. The LEAP (Laser-Enabled Analysis and Processing) platform with laser manipulation to efficiently purify lung
SUPPLEMENTARY INFORMATION
 doi:10.1038/nature12652 Supplementary Figure 1. PRDM16 interacts with endogenous EHMT1 in brown adipocytes. Immunoprecipitation of PRDM16 complex by flag antibody (M2) followed by Western blot analysis
HEK293FT cells were transiently transfected with reporters, N3-ICD construct and
 Supplementary Information Luciferase reporter assay HEK293FT cells were transiently transfected with reporters, N3-ICD construct and increased amounts of wild type or kinase inactive EGFR. Transfections
Detailed step-by-step operating procedures for NK cell and CTL degranulation assays
 Supplemental methods Detailed step-by-step operating procedures for NK cell and CTL degranulation assays Materials PBMC isolated from patients, relatives and healthy donors as control K562 cells (ATCC,
SUPPLEMENTAL EXPERIMENTAL PROCEDURES
 SUPPLEMENTAL EXPERIMENTAL PROCEDURES Crystal violet assay Cells were seeded in 24-well plates and cultured in media supplemented with % FBS for 7 days. Media were then removed, plates were briefly washed
SUPPLEMENTARY INFORMATION
 SUPPLEMENTARY INFORMATION FOR Liver X Receptor α mediates hepatic triglyceride accumulation through upregulation of G0/G1 Switch Gene 2 (G0S2) expression I: SUPPLEMENTARY METHODS II: SUPPLEMENTARY FIGURES
Supplementary Figure 1. Characterization of NMuMG-ErbB2 and NIC breast cancer cells expressing shrnas targeting LPP. NMuMG-ErbB2 cells (a) and NIC
 and NIC") Supplementary Figure 1. Characterization of NMuMG-ErbB2 and NIC breast cancer cells expressing shrnas targeting LPP. NMuMG-ErbB2 cells (a) and NIC cells (b) were engineered to stably express either a LucA-shRNA
Supplementary Figure 1. Characterization of NMuMG-ErbB2 and NIC breast cancer cells expressing shrnas targeting LPP. NMuMG-ErbB2 cells (a) and NIC cells (b) were engineered to stably express either a LucA-shRNA
SUPPLEMENT. Materials and methods
 SUPPLEMENT Materials and methods Cell culture and reagents Cell media and reagents were from Invitrogen unless otherwise indicated. Antibiotics and Tet-certified serum were from Clontech. In experiments
Supplementary Information
 Supplementary Information mediates STAT3 activation at retromer-positive structures to promote colitis and colitis-associated carcinogenesis Zhang et al. a b d e g h Rel. Luc. Act. Rel. mrna Rel. mrna
Bmi-1 regulates stem cell-like properties of gastric cancer cells via modulating mirnas
 Wang et al. Journal of Hematology & Oncology (2016) 9:90 DOI 10.1186/s13045-016-0323-9 RESEARCH Bmi-1 regulates stem cell-like properties of gastric cancer cells via modulating mirnas Open Access Xiaofeng
Figure S1. ERBB3 mrna levels are elevated in Luminal A breast cancers harboring ERBB3
 Supplemental Figure Legends. Figure S1. ERBB3 mrna levels are elevated in Luminal A breast cancers harboring ERBB3 ErbB3 gene copy number gain. Supplemental Figure S1. ERBB3 mrna levels are elevated in
Hopkins University, Howard Hughes Medical Institute, USA) (27). Cells were maintained in DMEM
 (27). Cells were maintained in DMEM") Supplementary Materials and Methods Cell Culture HCT116 (TP53 +/+ and TP53 -/- ) cells were provided by Dr. Bert Vogelstein (Johns Hopkins University, Howard Hughes Medical Institute, USA) (27). Cells
Supplementary Materials and Methods Cell Culture HCT116 (TP53 +/+ and TP53 -/- ) cells were provided by Dr. Bert Vogelstein (Johns Hopkins University, Howard Hughes Medical Institute, USA) (27). Cells
Cell isolation. Spleen and lymph nodes (axillary, inguinal) were removed from mice
 were removed from mice") Supplementary Methods: Cell isolation. Spleen and lymph nodes (axillary, inguinal) were removed from mice and gently meshed in DMEM containing 10% FBS to prepare for single cell suspensions. CD4 + CD25
Supplementary Methods: Cell isolation. Spleen and lymph nodes (axillary, inguinal) were removed from mice and gently meshed in DMEM containing 10% FBS to prepare for single cell suspensions. CD4 + CD25
Supplementary Figure 1. The CagA-dependent wound healing or transwell migration of gastric cancer cell. AGS cells transfected with vector control or
 Supplementary Figure 1. The CagA-dependent wound healing or transwell migration of gastric cancer cell. AGS cells transfected with vector control or 3xflag-CagA expression vector were wounded using a pipette
Supplementary Figure 1: si-craf but not si-braf sensitizes tumor cells to radiation.
 Supplementary Figure 1: si-craf but not si-braf sensitizes tumor cells to radiation. (a) Embryonic fibroblasts isolated from wildtype (WT), BRAF -/-, or CRAF -/- mice were irradiated (6 Gy) and DNA damage
Supplementary Fig. 1. GPRC5A post-transcriptionally down-regulates EGFR expression. (a) Plot of the changes in steady state mrna levels versus
 Plot of the changes in steady state mrna levels versus") Supplementary Fig. 1. GPRC5A post-transcriptionally down-regulates EGFR expression. (a) Plot of the changes in steady state mrna levels versus changes in corresponding proteins between wild type and Gprc5a-/-
Supplementary Fig. 1. GPRC5A post-transcriptionally down-regulates EGFR expression. (a) Plot of the changes in steady state mrna levels versus changes in corresponding proteins between wild type and Gprc5a-/-
Supplementary Figure 1. SA-β-Gal positive senescent cells in various cancer tissues. Representative frozen sections of breast, thyroid, colon and
 Supplementary Figure 1. SA-β-Gal positive senescent cells in various cancer tissues. Representative frozen sections of breast, thyroid, colon and stomach cancer were stained with SA-β-Gal and nuclear fast
SUPPLEMENTARY INFORMATION
 DOI: 10.1038/ncb3021 Supplementary figure 1 Characterisation of TIMPless fibroblasts. a) Relative gene expression of TIMPs1-4 by real time quantitative PCR (RT-qPCR) in WT or ΔTimp fibroblasts (mean ±
Supplemental Figure 1
 Supplemental Figure 1 A S100A4: SFLGKRTDEAAFQKLMSNLDSNRDNEVDFQEYCVFLSCIAMMCNEFFEGFPDK Overlap: SF G DE KLM LD N D VDFQEY VFL I M N FF G PD S100A2: SFVGEKVDEEGLKKLMGSLDENSDQQVDFQEYAVFLALITVMCNDFFQGCPDR
Suppression of Aurora-A-FLJ10540 signaling axis prohibits the malignant state of head and neck cancer
 Chen et al. Molecular Cancer (2015) 14:83 DOI 10.1186/s12943-015-0348-7 RESEARCH Open Access Suppression of Aurora-A-FLJ10540 signaling axis prohibits the malignant state of head and neck cancer Chang-Han
for six pairs of mice. (b) Representative FACS analysis of absolute number of T cells (CD4 + and
 Representative FACS analysis of absolute number of T cells (CD4 + and") SUPPLEMENTARY DATA Supplementary Figure 1: Peripheral lymphoid organs of SMAR1 -/- mice have an effector memory phenotype. (a) Lymphocytes collected from MLNs and Peyer s patches (PPs) of WT and SMAR1
SUPPLEMENTARY DATA Supplementary Figure 1: Peripheral lymphoid organs of SMAR1 -/- mice have an effector memory phenotype. (a) Lymphocytes collected from MLNs and Peyer s patches (PPs) of WT and SMAR1
Supplementary Information Supplementary Fig. 1. Elevated Usp9x in melanoma and NRAS mutant melanoma cells are dependent on NRAS for 3D growth.
 Supplementary Information Supplementary Fig. 1. Elevated Usp9x in melanoma and NRAS mutant melanoma cells are dependent on NRAS for 3D growth. a. Immunoblot for Usp9x protein in NRAS mutant melanoma cells
well for 2 h at rt. Each dot represents an individual mouse and bar is the mean ±
 Supplementary data: Control DC Blimp-1 ko DC 8 6 4 2-2 IL-1β p=.5 medium 8 6 4 2 IL-2 Medium p=.16 8 6 4 2 IL-6 medium p=.3 5 4 3 2 1-1 medium IL-1 n.s. 25 2 15 1 5 IL-12(p7) p=.15 5 IFNγ p=.65 4 3 2 1
m 6 A mrna methylation regulates AKT activity to promote the proliferation and tumorigenicity of endometrial cancer
 SUPPLEMENTARY INFORMATION Articles https://doi.org/10.1038/s41556-018-0174-4 In the format provided by the authors and unedited. m 6 A mrna methylation regulates AKT activity to promote the proliferation
Supplementary Data. Supplementary Methods:
 Supplementary Data Supplementary Methods: Cell viability assay. Cells were seeded overnight at a density of 2,000 cells per well in 96-well plates in RPMI with 10% FBS and then treated with the relevant
Title of file for HTML: Supplementary Information Description: Supplementary Figures and Supplementary Table
 Title of file for HTML: Supplementary Information Description: Supplementary Figures and Supplementary Table Title of file for HTML: Peer Review File Description: Innate Scavenger Receptor-A regulates
SUPPLEMENTARY FIGURES
 SUPPLEMENTARY FIGURES 1 Supplementary Figure 1, Adult hippocampal QNPs and TAPs uniformly express REST a-b) Confocal images of adult hippocampal mouse sections showing GFAP (green), Sox2 (red), and REST
Soft Agar Assay. For each cell pool, 100,000 cells were resuspended in 0.35% (w/v)
") SUPPLEMENTARY MATERIAL AND METHODS Soft Agar Assay. For each cell pool, 100,000 cells were resuspended in 0.35% (w/v) top agar (LONZA, SeaKem LE Agarose cat.5004) and plated onto 0.5% (w/v) basal agar.
SUPPLEMENTARY MATERIAL AND METHODS Soft Agar Assay. For each cell pool, 100,000 cells were resuspended in 0.35% (w/v) top agar (LONZA, SeaKem LE Agarose cat.5004) and plated onto 0.5% (w/v) basal agar.
Supplementary Figure 1. PD-L1 is glycosylated in cancer cells. (a) Western blot analysis of PD-L1 in breast cancer cells. (b) Western blot analysis
 Western blot analysis of PD-L1 in breast cancer cells. (b) Western blot analysis") Supplementary Figure 1. PD-L1 is glycosylated in cancer cells. (a) Western blot analysis of PD-L1 in breast cancer cells. (b) Western blot analysis of PD-L1 in ovarian cancer cells. (c) Western blot analysis
Supplementary Figure 1. PD-L1 is glycosylated in cancer cells. (a) Western blot analysis of PD-L1 in breast cancer cells. (b) Western blot analysis of PD-L1 in ovarian cancer cells. (c) Western blot analysis
Inhibition of TGFβ enhances chemotherapy action against triple negative breast cancer by abrogation of
 SUPPLEMENTAL DATA Inhibition of TGFβ enhances chemotherapy action against triple negative breast cancer by abrogation of cancer stem cells and interleukin-8 Neil E. Bhola 1, Justin M. Balko 1, Teresa C.
Supplementary Figure 1. Basal level EGFR across a panel of ESCC lines. Immunoblots demonstrate the expression of phosphorylated and total EGFR as
 Supplementary Figure 1. Basal level EGFR across a panel of ESCC lines. Immunoblots demonstrate the expression of phosphorylated and total EGFR as well as their downstream effectors across a panel of ESCC
Supplementary Figure 1: Expression of NFAT proteins in Nfat2-deleted B cells (a+b) Protein expression of NFAT2 (a) and NFAT1 (b) in isolated splenic
 Protein expression of NFAT2 (a) and NFAT1 (b) in isolated splenic") Supplementary Figure 1: Expression of NFAT proteins in Nfat2-deleted B cells (a+b) Protein expression of NFAT2 (a) and NFAT1 (b) in isolated splenic B cells from WT Nfat2 +/+, TCL1 Nfat2 +/+ and TCL1 Nfat2
Supplementary Figure 1: Expression of NFAT proteins in Nfat2-deleted B cells (a+b) Protein expression of NFAT2 (a) and NFAT1 (b) in isolated splenic B cells from WT Nfat2 +/+, TCL1 Nfat2 +/+ and TCL1 Nfat2
T H E J O U R N A L O F C E L L B I O L O G Y
 T H E J O U R N A L O F C E L L B I O L O G Y Supplemental material Amelio et al., http://www.jcb.org/cgi/content/full/jcb.201203134/dc1 Figure S1. mir-24 regulates proliferation and by itself induces
SUPPLEMENTARY FIGURE LEGENDS. atypical adenomatous hyperplasias (AAH); Grade II: adenomas; Grade III: adenocarcinomas;
; Grade II: adenomas; Grade III: adenocarcinomas;") SUPPLEMENTARY FIGURE LEGENDS Supplementary Figure S1: Tumor grades in Ras G12D ; p53 / lung tumors. Representative histology (H&E) of K-Ras G12D ; p53 / lung tumors 13 weeks after tumor initiation. Grade
SUPPLEMENTARY FIGURE LEGENDS Supplementary Figure S1: Tumor grades in Ras G12D ; p53 / lung tumors. Representative histology (H&E) of K-Ras G12D ; p53 / lung tumors 13 weeks after tumor initiation. Grade
File Name: Supplementary Information Description: Supplementary Figures and Supplementary Tables. File Name: Peer Review File Description:
 File Name: Supplementary Information Description: Supplementary Figures and Supplementary Tables File Name: Peer Review File Description: Primer Name Sequence (5'-3') AT ( C) RT-PCR USP21 F 5'-TTCCCATGGCTCCTTCCACATGAT-3'
General Laboratory methods Plasma analysis: Gene Expression Analysis: Immunoblot analysis: Immunohistochemistry:
 General Laboratory methods Plasma analysis: Plasma insulin (Mercodia, Sweden), leptin (duoset, R&D Systems Europe, Abingdon, United Kingdom), IL-6, TNFα and adiponectin levels (Quantikine kits, R&D Systems
Nimbolide inhibits pancreatic cancer growth and metastasis through ROS-mediated
 Nimbolide inhibits pancreatic cancer growth and metastasis through ROS-mediated apoptosis and inhibition of epithelial-to-mesenchymal transition Ramadevi Subramani a, Ph.D., Elizabeth Gonzalez b, MS.,
supplementary information
 DOI: 10.1038/ncb1875 Figure S1 (a) The 79 surgical specimens from NSCLC patients were analysed by immunohistochemistry with an anti-p53 antibody and control serum (data not shown). The normal bronchi served
IL-13 Augments Compressive Stress-induced Tissue Factor Expression in Human Airway Epithelial Cells
 IL-13 Augments Compressive Stress-induced Tissue Factor Expression in Human Airway Epithelial Cells Jennifer A. Mitchel, Silvio Antoniak, Joo-Hyeon Lee, Sae-Hoon Kim, Maureen McGill, David I. Kasahara,
TFEB-mediated increase in peripheral lysosomes regulates. Store Operated Calcium Entry
 TFEB-mediated increase in peripheral lysosomes regulates Store Operated Calcium Entry Luigi Sbano, Massimo Bonora, Saverio Marchi, Federica Baldassari, Diego L. Medina, Andrea Ballabio, Carlotta Giorgi
Supplementary data Supplementary Figure 1 Supplementary Figure 2
 Supplementary data Supplementary Figure 1 SPHK1 sirna increases RANKL-induced osteoclastogenesis in RAW264.7 cell culture. (A) RAW264.7 cells were transfected with oligocassettes containing SPHK1 sirna
Supplementary Figure 1. mrna targets were found in exosomes and absent in free-floating supernatant. Serum exosomes and exosome-free supernatant were
 Supplementary Figure 1. mrna targets were found in exosomes and absent in free-floating supernatant. Serum exosomes and exosome-free supernatant were separated via ultracentrifugation and lysed to analyze
Supplemental Figure 1. Isolation and characterization of CD133+ neurosphere-like
 SUPPLEMENTL FIGURE LEGENDS Supplemental Figure 1. Isolation and characterization of CD133+ neurosphere-like spheroids from a human brain tumor sample or glioma xenograft. () CD133+ tumor cells isolated
Supplementary Figures
 Supplementary Figures Supplementary Figure 1. Confirmation of Dnmt1 conditional knockout out mice. a, Representative images of sorted stem (Lin - CD49f high CD24 + ), luminal (Lin - CD49f low CD24 + )
Erzsebet Kokovay, Susan Goderie, Yue Wang, Steve Lotz, Gang Lin, Yu Sun, Badrinath Roysam, Qin Shen,
 Cell Stem Cell, Volume 7 Supplemental Information Adult SVZ Lineage Cells Home to and Leave the Vascular Niche via Differential Responses to SDF1/CXCR4 Signaling Erzsebet Kokovay, Susan Goderie, Yue Wang,
SUPPLEMENTARY FIGURES AND TABLE
 SUPPLEMENTARY FIGURES AND TABLE Supplementary Figure S1: Characterization of IRE1α mutants. A. U87-LUC cells were transduced with the lentiviral vector containing the GFP sequence (U87-LUC Tet-ON GFP).
hexahistidine tagged GRP78 devoid of the KDEL motif (GRP78-His) on SDS-PAGE. This
 on SDS-PAGE. This") SUPPLEMENTAL FIGURE LEGEND Fig. S1. Generation and characterization of. (A) Coomassie staining of soluble hexahistidine tagged GRP78 devoid of the KDEL motif (GRP78-His) on SDS-PAGE. This protein was expressed
SUPPLEMENTAL FIGURE LEGEND Fig. S1. Generation and characterization of. (A) Coomassie staining of soluble hexahistidine tagged GRP78 devoid of the KDEL motif (GRP78-His) on SDS-PAGE. This protein was expressed
CD14 + S100A9 + Monocytic Myeloid-Derived Suppressor Cells and Their Clinical Relevance in Non-Small Cell Lung Cancer
 CD14 + S1A9 + Monocytic Myeloid-Derived Suppressor Cells and Their Clinical Relevance in Non-Small Cell Lung Cancer Po-Hao, Feng M.D., Kang-Yun, Lee, M.D. Ph.D., Ya-Ling Chang, Yao-Fei Chan, Lu- Wei, Kuo,Ting-Yu
Supplementary Figure 1. A. Bar graph representing the expression levels of the 19 indicated genes in the microarrays analyses comparing human lung
 Supplementary Figure 1. A. Bar graph representing the expression levels of the 19 indicated genes in the microarrays analyses comparing human lung immortalized broncho-epithelial cells (AALE cells) expressing
Islet viability assay and Glucose Stimulated Insulin Secretion assay RT-PCR and Western Blot
 Islet viability assay and Glucose Stimulated Insulin Secretion assay Islet cell viability was determined by colorimetric (3-(4,5-dimethylthiazol-2-yl)-2,5- diphenyltetrazolium bromide assay using CellTiter
Supplementary Figure 1
 CD31 FN Supplementary Figure 1 a Multivariate Cox regression analysis of predicting factors for disease-free and overall survival in 435 HNSCC patients b FN staining in whole sections of HNSCC c FN expression
Supplemental figures and figure legends (90517-INS-RG-RV-2) Supplemental Figure 1.
 Supplemental Figure 1.") Supplemental figures and figure legends (957-INS-RG-RV-) Supplemental Figure. A B.5.5 Interaction p=.89 Model p
Supplemental figures and figure legends (957-INS-RG-RV-) Supplemental Figure. A B.5.5 Interaction p=.89 Model p