Programmed necrosis, not apoptosis, is a key mediator of cell loss and DAMP-mediated inflammation in dsrna-induced retinal degeneration
|
|
|
- Emory Strickland
- 5 years ago
- Views:
Transcription
1 Programmed necrosis, not apoptosis, is a key mediator of cell loss and DAMP-mediated inflammation in dsrna-induced retinal degeneration The Harvard community has made this article openly available. Please share how this access benefits you. Your story matters Citation Murakami, Y, H Matsumoto, M Roh, A Giani, K Kataoka, Y Morizane, M Kayama, et al Programmed Necrosis, Not Apoptosis, Is a Key Mediator of Cell Loss and DAMP-Mediated Inflammation in dsrna-induced Retinal Degeneration. Cell Death & Differentiation 21 (2) (August 16): doi: /cdd Published Version /cdd Citable link Terms of Use This article was downloaded from Harvard University s DASH repository, and is made available under the terms and conditions applicable to Open Access Policy Articles, as set forth at nrs.harvard.edu/urn-3:hul.instrepos:dash.current.terms-ofuse#oap
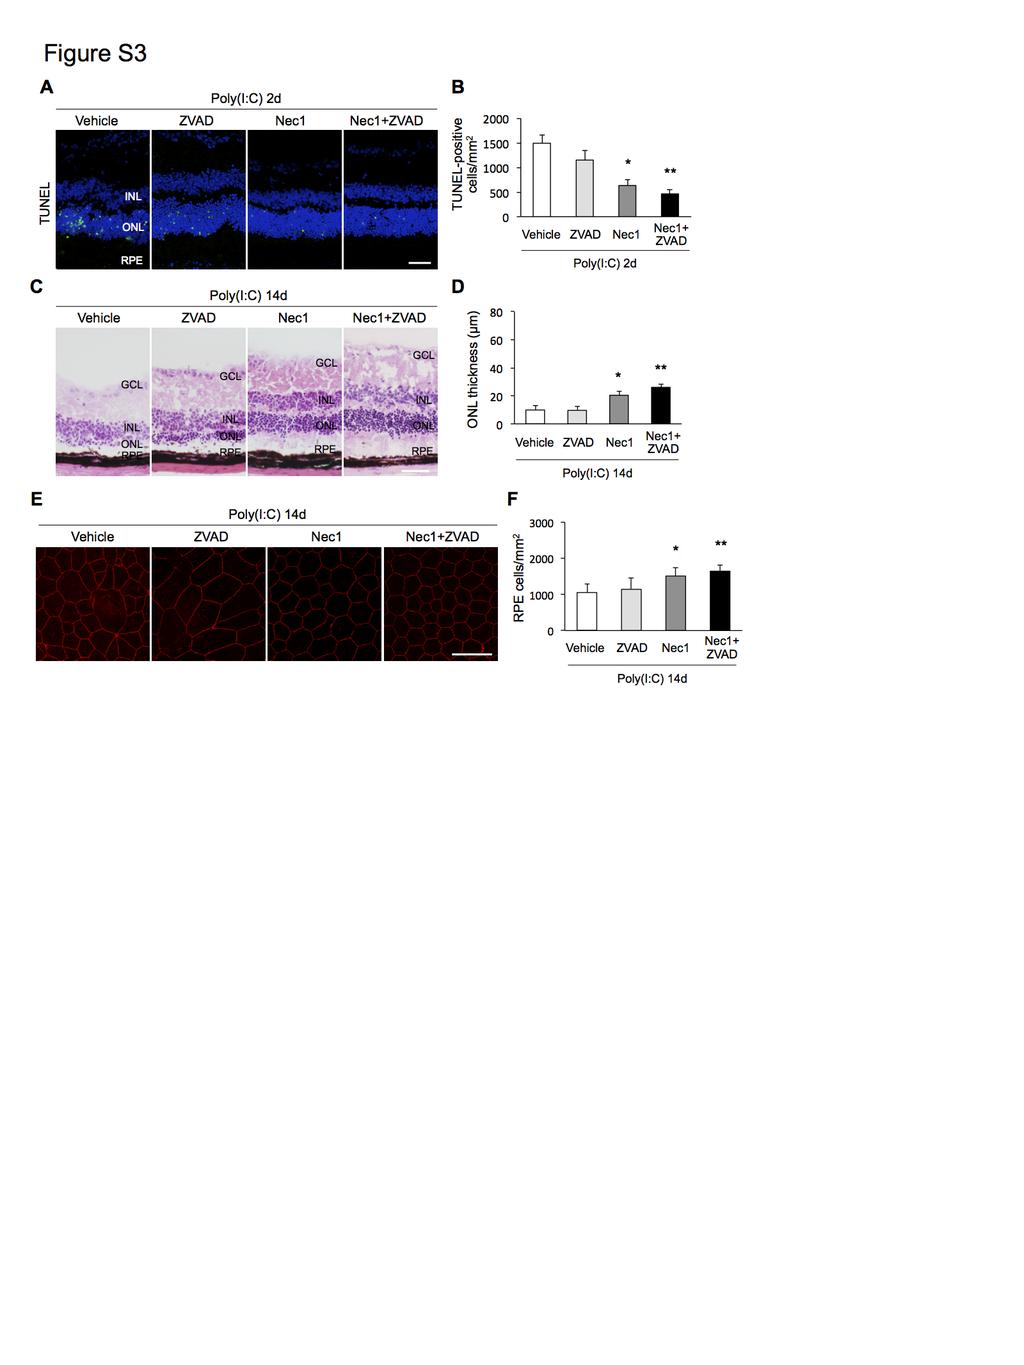
2 Legends to supplementary figures. Figure S1. Effect of subretinal injection on the baseline expression of RIP3. (A) Quantitative real-time PCR analysis for RIP3 in the untreated retinas and the retinas 2 days after subretinal injection of PBS (n = 4 each). NS: not significant. (B) Western blot analysis for RIP3 in the untreated retinas and the retinas 2 days after subretinal injection of PBS (n = 4 each). Levels normalized to!-actin. The bar graphs indicate the relative level of RIP3 to!-actin by densitometric analysis. NS: not significant. Figure S2. Effect of Z-VAD on caspase-3 cleavage after subretinal dsrna injection in WT mice. (A and B) Immunofluorescence for cleaved caspase-3 (A) and quantification of cleaved caspase-3-positive cells (B) in the WT retinas 2 days after subretinal poly(i:c) injection (n = 6 in WT and n = 8 in Rip3 -/- ). Treatment with Z-VAD suppressed caspase-3 cleavage after poly(i:c) injection. Scale bar, 50 µm. *, P < (B) The graphs show mean ± SEM. Figure S3. Nec-1 protects photoreceptors and the RPE against dsrna-induced retinal injury in mice. (A and B) TUNEL (green) and DAPI (blue) staining (A) and quantification of TUNELpositive cells (B) in the WT retinas 2 days after subretinal injection of poly(i:c) plus vehicle (n = 5), poly(i:c) plus Z-VAD (n = 6), poly(i:c) plus Nec-1 (n = 6), or poly(i:c), Nec-1 plus Z-VAD (n = 5). Scale bar, 50 µm. *, P < 0.05, **, P < 0.01, vs. poly(i:c) plus vehicle treatment. (C and D) Retinal histology (C) and quantification of ONL thickness (D) in the WT retinas 2 days after subretinal injection of poly(i:c) plus vehicle (n = 6), poly(i:c) plus Z- VAD (n = 6), poly(i:c) plus Nec-1 (n = 7), or poly(i:c), Nec-1 plus Z-VAD (n = 7). Scale bar, 50 µm. *, P < 0.05, **, P < 0.01, vs. poly(i:c) plus vehicle treatment. (E and F) ZO-1 staining (E) and quantification of ZO-1-positive RPE cells (F) in the
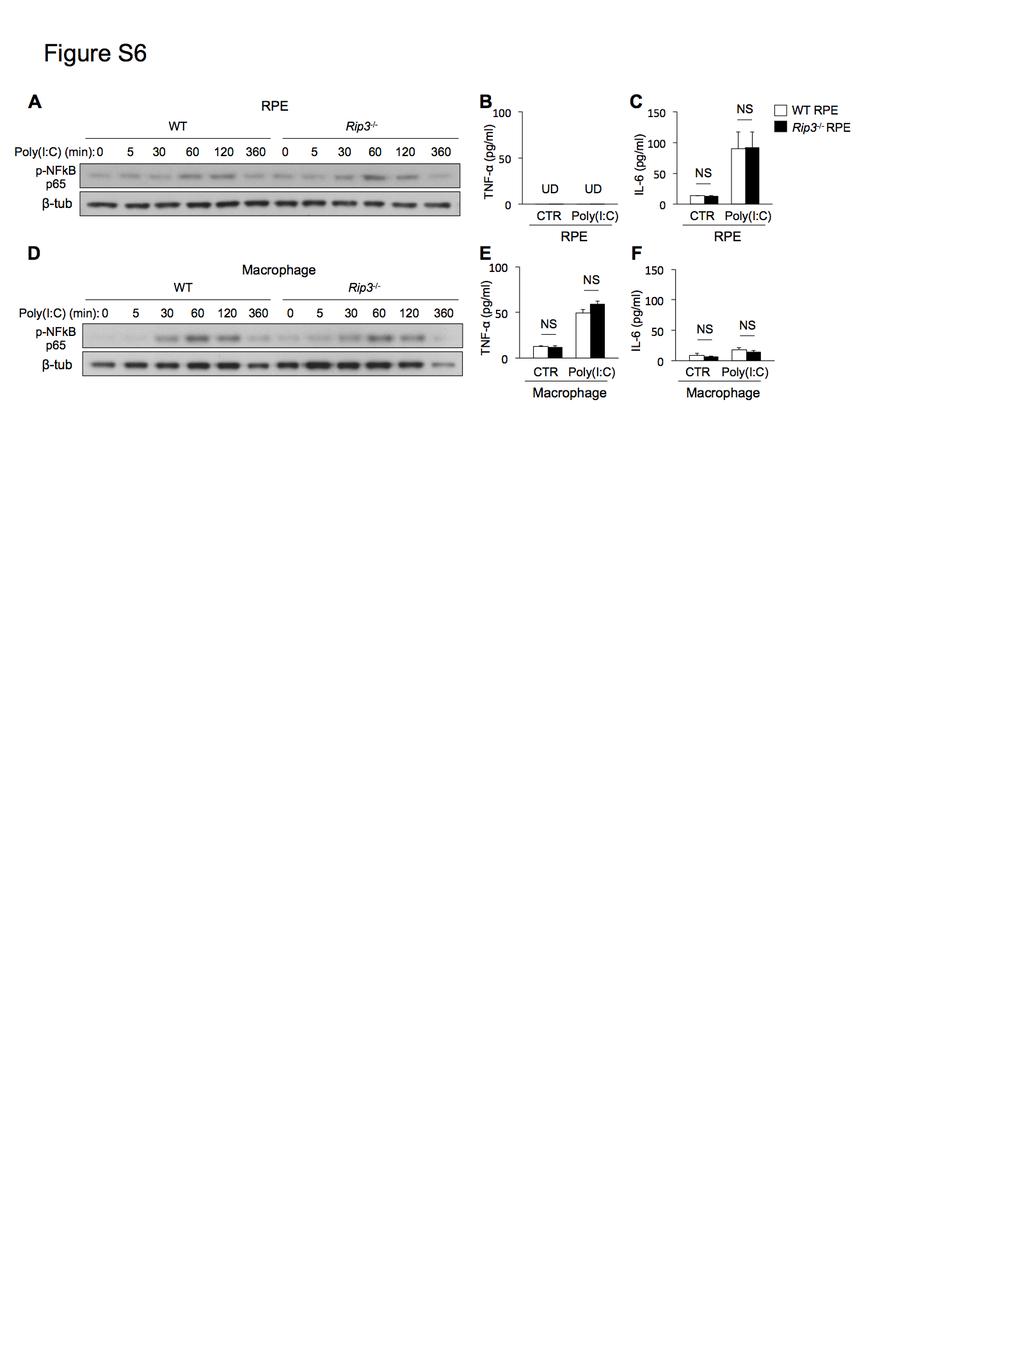
3 WT retinas 2 days after subretinal injection of poly(i:c) plus vehicle (n = 6), poly(i:c) plus Z-VAD (n = 6), poly(i:c) plus Nec-1 (n = 6), or poly(i:c), Nec-1 plus Z-VAD (n = 5). Rip3 deficiency attenuated the loss of RPE cells after poly(i:c) injection. Scale bar, 50 µm. *, P < 0.05, **, P < 0.01, vs. poly(i:c) plus vehicle treatment. (B, D and F) The graphs show mean ± SD. Figure S4. Nec-1 suppresses inflammatory cell infiltration in dsrna-induced retinal degeneration in mice. (A and B) Immunofluorescence for CD11b (A) and quantification of CD11b-positive cells (B) in the WT retinas 2 days after subretinal injection of poly(i:c) plus vehicle (n = 6), poly(i:c) plus Z-VAD (n = 6), poly(i:c) plus Nec-1 (n = 8), or poly(i:c), Nec-1 plus Z-VAD (n = 8). Scale bar, 50 µm. *, P < 0.05, **, P < 0.01, vs. poly(i:c) plus vehicle treatment. (B) The graphs show mean ± SD. Figure S5. RIP3 promotes microglial infiltration in the inner retina after dsrna injection in mice. (A and B) Retinal wholemount staining for Iba-1 (A) and quantification of Iba-1-positive microglial cells (B) in the area injected with PBS or poly(i:c) in WT and Rip3 -/- mice (n = 6 each). Microglial infiltration in the inner retina after poly(i:c) injection was relatively decreased in Rip3 -/- mice compared with WT mice. Scale bar, 50 µm. *, P < 0.01, NS: not significant. (B) The graphs show mean ± SD. Figure S6. RIP3 is not essential for NF-κB activation and cytokine production induced by dsrna in RPE cells and macrophages. (A and D) Western blotting for phosphorylated NF-κB after 5 µg/ml poly(i:c) treatment in WT- and Rip3 -/- mouse-derived RPE cells (A) or peritoneal macrophages (D).
4 (B, C, E and F) ELISA to measure TNF-α (B and E) and IL-6 (C and F) in the supernatants of RPE cells (B and C) or macrophages (E and F) 24 hours after poly(i:c) stimulation (n = 4 each). There was no difference in TNF-α or IL-6 production between WT- and Rip3 -/- mouse-derived cells. NS: not significant. UD: undetectable. (B, C, E and F) The graphs show mean ± SEM. Figure S7. RIP3 is not essential for NF-κB activation and cytokine production induced by TNF-α in RPE cells and macrophages. (A and C) Western blotting for phosphorylated NF-κB after 30 ng/ml TNF-α treatment in WT- and Rip3 -/- -derived RPE cells (A) or peritoneal macrophages (C). (B and D) ELISA to measure IL-6 in the supernatants of RPE cells (B) or macrophages (D) 24 hours after TNF-α stimulation (n = 4 each). NS: not significant. (B and D) The graphs show mean ± SEM. Supplementary methods. Iba-1 staining. Eyes were enucleated and fixed in 4% PFA for 1 h. After washing with PBS, the neuroretinas were dissected, blocked with 10% nonfat dried milk and 0.3% triton X in PBS for 1 h, and then incubated with anti-iba-1 antibody (1:300; Wako, Osaka, Japan) at 4 C overnight. Anti-rabbit Alexa Fluor 488 (1:300; Life Technologies, Grand Island, NY) was used as a secondary antibody. Five points in PBS- or poly(i:c)-injected areas were randomly selected and the inner retina was photographed at x40 magnification with a Leica SP2 confocal microscopy. The number of Iba-1 positive cells in the five regions was counted using ImageJ software and averaged by a masked observer.
5
6
7
8
9
10
11
12
Rescue of mutant rhodopsin traffic by metformin-induced AMPK activation accelerates photoreceptor degeneration Athanasiou et al
 Supplementary Material Rescue of mutant rhodopsin traffic by metformin-induced AMPK activation accelerates photoreceptor degeneration Athanasiou et al Supplementary Figure 1. AICAR improves P23H rod opsin
Supplementary Figure S I: Effects of D4F on body weight and serum lipids in apoe -/- mice.
 Supplementary Figures: Supplementary Figure S I: Effects of D4F on body weight and serum lipids in apoe -/- mice. Male apoe -/- mice were fed a high-fat diet for 8 weeks, and given PBS (model group) or
Intracellular MHC class II molecules promote TLR-triggered innate. immune responses by maintaining Btk activation
 Intracellular MHC class II molecules promote TLR-triggered innate immune responses by maintaining Btk activation Xingguang Liu, Zhenzhen Zhan, Dong Li, Li Xu, Feng Ma, Peng Zhang, Hangping Yao and Xuetao
Supplementary Material
 Supplementary Material accompanying the manuscript Interleukin 37 is a fundamental inhibitor of innate immunity Marcel F Nold, Claudia A Nold-Petry, Jarod A Zepp, Brent E Palmer, Philip Bufler & Charles
Supplementary fig. 1. Crystals induce necroptosis does not involve caspases, TNF receptor or NLRP3. A. Mouse tubular epithelial cells were pretreated
 Supplementary fig. 1. Crystals induce necroptosis does not involve caspases, TNF receptor or NLRP3. A. Mouse tubular epithelial cells were pretreated with zvad-fmk (10µM) and exposed to calcium oxalate
Fang et al. NMuMG. PyVmT unstained Anti-CCR2-PE MDA-MB MCF MCF10A
 A NMuMG PyVmT 16.5+.5 47.+7.2 Fang et al. unstained Anti-CCR2-PE 4T1 Control 37.6+6.3 56.1+.65 MCF1A 16.1+3. MCF-7 3.1+5.4 MDA-M-231 42.1+5.5 unstained Secondary antibody only Anti-CCR2 SUPPLEMENTAL FIGURE
Supplementary Figure 1
 Supplementary Figure 1 AAV-GFP injection in the MEC of the mouse brain C57Bl/6 mice at 4 months of age were injected with AAV-GFP into the MEC and sacrificed at 7 days post injection (dpi). (a) Brains
c Ischemia (30 min) Reperfusion (8 w) Supplementary Figure bp 300 bp Ischemia (30 min) Reperfusion (4 h) Dox 20 mg/kg i.p.
 Reperfusion (8 w) Supplementary Figure bp 300 bp Ischemia (30 min) Reperfusion (4 h) Dox 20 mg/kg i.p.") a Marker Ripk3 +/ 5 bp 3 bp b Ischemia (3 min) Reperfusion (4 h) d 2 mg/kg i.p. 1 w 5 w Sacrifice for IF size A subset for echocardiography and morphological analysis c Ischemia (3 min) Reperfusion (8
a Marker Ripk3 +/ 5 bp 3 bp b Ischemia (3 min) Reperfusion (4 h) d 2 mg/kg i.p. 1 w 5 w Sacrifice for IF size A subset for echocardiography and morphological analysis c Ischemia (3 min) Reperfusion (8
Relative SOD1 activity. Relative SOD2 activity. Relative SOD activity (Infected:Mock) + CP + DDC
 + CP + DDC") Supplementary Figure 1. SOD1 activity is significantly increased relative to SOD1 levels. SOD1 and SOD2 activities in the infected mork13 cells are shown normalised to their corresponding levels and relative
Supplementary Figure 1. SOD1 activity is significantly increased relative to SOD1 levels. SOD1 and SOD2 activities in the infected mork13 cells are shown normalised to their corresponding levels and relative
SUPPLEMENTARY INFORMATION
 doi:1.138/nature1554 a TNF-α + in CD4 + cells [%] 1 GF SPF 6 b IL-1 + in CD4 + cells [%] 5 4 3 2 1 Supplementary Figure 1. Effect of microbiota on cytokine profiles of T cells in GALT. Frequencies of TNF-α
Supplementary Figure 1 IMQ-Induced Mouse Model of Psoriasis. IMQ cream was
 Supplementary Figure 1 IMQ-Induced Mouse Model of Psoriasis. IMQ cream was painted on the shaved back skin of CBL/J and BALB/c mice for consecutive days. (a, b) Phenotypic presentation of mouse back skin
Supplementary Figure 1. Dynamic Response of WT and mir-21 -/- mice to caerulein. (a) Representative histological sections of mouse pancreas stained
 Representative histological sections of mouse pancreas stained") Supplementary Figure 1. Dynamic Response of WT and mir-21 -/- mice to caerulein. (a) Representative histological sections of mouse pancreas stained with hematoxylin from caerulein-treated WT and mir-21
Supplementary Figure 1. Dynamic Response of WT and mir-21 -/- mice to caerulein. (a) Representative histological sections of mouse pancreas stained with hematoxylin from caerulein-treated WT and mir-21
Figure S1. Reduction in glomerular mir-146a levels correlate with progression to higher albuminuria in diabetic patients.
 Supplementary Materials Supplementary Figures Figure S1. Reduction in glomerular mir-146a levels correlate with progression to higher albuminuria in diabetic patients. Figure S2. Expression level of podocyte
Supplementary Figure 1. Characterization of basophils after reconstitution of SCID mice
 Supplementary figure legends Supplementary Figure 1. Characterization of after reconstitution of SCID mice with CD4 + CD62L + T cells. (A-C) SCID mice (n = 6 / group) were reconstituted with 2 x 1 6 CD4
Supplemental Figure 1. (A) Western blot for the expression of RIPK1 in HK-2 cells treated with or without LPS (1 µg/ml) for indicated times.
 Western blot for the expression of RIPK1 in HK-2 cells treated with or without LPS (1 µg/ml) for indicated times.") Supplemental Figure 1. (A) Western blot for the expression of RIPK1 in HK-2 cells treated with or without LPS (1 µg/ml) for indicated times. Western blots shown are representative results from 3 independent
Supplemental Figure 1. (A) Western blot for the expression of RIPK1 in HK-2 cells treated with or without LPS (1 µg/ml) for indicated times. Western blots shown are representative results from 3 independent
a surface permeabilized
 a surface permeabilized RAW 64.7 P388D1 J774 b CD11b + Ly-6G - Blood Monocytes WT Supplementary Figure 1. Cell surface expression on macrophages and DCs. (a) RAW64.7, P388D1, and J774 cells were subjected
An unconventional role for mirna: let-7 activates Toll-like receptor 7 and causes neurodegeneration
 An unconventional role for mirna: let-7 activates Toll-like receptor 7 and causes neurodegeneration Sabrina M. Lehmann, Christina Krüger, Boyoun Park, Katja Derkow, Karen Rosenberger, Jan Baumgart, Thorsten
NLRX1: 5 -GCTCCATGGCTTAGAGCATC-3 (forward) 5 -AACTCCTCCTCCGTCCTGAT-3 (reverse) β-actin
 5 -AACTCCTCCTCCGTCCTGAT-3 (reverse) β-actin") NLRX1 β-actin 1 2 3 4 5 6 1 2 3 4 5 6 NLRX1 (667 bp) β-actin (523 bp) Supplementary Figure 1: Expression of NLRX1 in human cell lines. 1: HeLa, 2: HEK293T, 3: MCF-7, 4:Ramos, 5:Jurkat, 6: THP1. The following
NLRX1 β-actin 1 2 3 4 5 6 1 2 3 4 5 6 NLRX1 (667 bp) β-actin (523 bp) Supplementary Figure 1: Expression of NLRX1 in human cell lines. 1: HeLa, 2: HEK293T, 3: MCF-7, 4:Ramos, 5:Jurkat, 6: THP1. The following
SHREE ET AL, SUPPLEMENTAL MATERIALS. (A) Workflow for tumor cell line derivation and orthotopic implantation.
 Workflow for tumor cell line derivation and orthotopic implantation.") SHREE ET AL, SUPPLEMENTAL MATERIALS SUPPLEMENTAL FIGURE AND TABLE LEGENDS Supplemental Figure 1. Derivation and characterization of TS1-TGL and TS2-TGL PyMT cell lines and development of an orthotopic
SHREE ET AL, SUPPLEMENTAL MATERIALS SUPPLEMENTAL FIGURE AND TABLE LEGENDS Supplemental Figure 1. Derivation and characterization of TS1-TGL and TS2-TGL PyMT cell lines and development of an orthotopic
Nature Immunology: doi: /ni Supplementary Figure 1. Production of cytokines and chemokines after vaginal HSV-2 infection.
 Supplementary Figure 1 Production of cytokines and chemokines after vaginal HSV-2 infection. C57BL/6 mice were (a) treated intravaginally with 20 µl of PBS or infected with 6.7x10 4 pfu of HSV-2 in the
JCB. Supplemental material. Gu et al.,
 Supplemental material Gu et al., http://www.jcb.org/cgi/content/full/jcb.201010075/dc1 T H E J O U R N A L O F C E L L B I O L O G Y Figure S1. S1P directly induces actin assembly. Actin assembly at the
GFP/Iba1/GFAP. Brain. Liver. Kidney. Lung. Hoechst/Iba1/TLR9!
 Supplementary information a +KA Relative expression d! Tlr9 5!! 5! NSC Neuron Astrocyte Microglia! 5! Tlr7!!!! NSC Neuron Astrocyte! GFP/Sβ/! Iba/Hoechst Microglia e Hoechst/Iba/TLR9! GFP/Iba/GFAP f Brain
Supporting Information
 Supporting Information Desnues et al. 10.1073/pnas.1314121111 SI Materials and Methods Mice. Toll-like receptor (TLR)8 / and TLR9 / mice were generated as described previously (1, 2). TLR9 / mice were
Supplementary Figure 1. Normal T lymphocyte populations in Dapk -/- mice. (a) Normal thymic development in Dapk -/- mice. Thymocytes from WT and Dapk
 Normal thymic development in Dapk -/- mice. Thymocytes from WT and Dapk") Supplementary Figure 1. Normal T lymphocyte populations in Dapk -/- mice. (a) Normal thymic development in Dapk -/- mice. Thymocytes from WT and Dapk -/- mice were stained for expression of CD4 and CD8.
Supplementary Figure 1. Normal T lymphocyte populations in Dapk -/- mice. (a) Normal thymic development in Dapk -/- mice. Thymocytes from WT and Dapk -/- mice were stained for expression of CD4 and CD8.
Supplemental Table 1. Primers used for RT-PCR analysis of inflammatory cytokines Gene Primer Sequence
 Supplemental Table 1. Primers used for RT-PCR analysis of inflammatory cytokines Gene Primer Sequence IL-1α Forward primer 5 -CAAGATGGCCAAAGTTCGTGAC-3' Reverse primer 5 -GTCTCATGAAGTGAGCCATAGC-3 IL-1β
Supplemental Figure 1. Western blot analysis indicated that MIF was detected in the fractions of
 Supplemental Figure Legends Supplemental Figure 1. Western blot analysis indicated that was detected in the fractions of plasma membrane and cytosol but not in nuclear fraction isolated from Pkd1 null
Type of file: PDF Title of file for HTML: Supplementary Information Description: Supplementary Figures
 Type of file: PDF Title of file for HTML: Supplementary Information Description: Supplementary Figures Type of file: MOV Title of file for HTML: Supplementary Movie 1 Description: NLRP3 is moving along
Supplementary Figure 1. EC-specific Deletion of Snail1 Does Not Affect EC Apoptosis. (a,b) Cryo-sections of WT (a) and Snail1 LOF (b) embryos at
 Cryo-sections of WT (a) and Snail1 LOF (b) embryos at") Supplementary Figure 1. EC-specific Deletion of Snail1 Does Not Affect EC Apoptosis. (a,b) Cryo-sections of WT (a) and Snail1 LOF (b) embryos at E10.5 were double-stained for TUNEL (red) and PECAM-1 (green).
Supplementary Figure 1. EC-specific Deletion of Snail1 Does Not Affect EC Apoptosis. (a,b) Cryo-sections of WT (a) and Snail1 LOF (b) embryos at E10.5 were double-stained for TUNEL (red) and PECAM-1 (green).
Supplementary Information
 Supplementary Information TABLE S1. SUBJECT CHARACTERISTICS* Normal Control Subjects Subjects with Asthma p Value Number 23 48 Age (years) 35±10 35±10 0.75 Sex, M:F (% F) 9:12 (57) 17:26 (60) 0.76 FEV1
Nature Neuroscience: doi: /nn Supplementary Figure 1
 Supplementary Figure 1 EGFR inhibition activates signaling pathways (a-b) EGFR inhibition activates signaling pathways (a) U251EGFR cells were treated with erlotinib (1µM) for the indicated times followed
Bone marrow-derived mesenchymal stem cells improve diabetes-induced cognitive impairment by
 Nakano et al. Supplementary information 1. Supplementary Figure 2. Methods 3. References Bone marrow-derived mesenchymal stem cells improve diabetes-induced cognitive impairment by exosome transfer into
Supplementary Figure 1. Expression of EPO and EPOR during self-limited versus delayed
 Supplementary Figure 1. Expression of EPO and EPOR during self-limited versus delayed inflammation resolution. a: Flow cytometry analysis showing the electronic gating strategy used to identify peritoneal
Supplementary Figure 1.TRIM33 binds β-catenin in the nucleus. a & b, Co-IP of endogenous TRIM33 with β-catenin in HT-29 cells (a) and HEK 293T cells
 and HEK 293T cells") Supplementary Figure 1.TRIM33 binds β-catenin in the nucleus. a & b, Co-IP of endogenous TRIM33 with β-catenin in HT-29 cells (a) and HEK 293T cells (b). TRIM33 was immunoprecipitated, and the amount of
Supplementary Figure 1.TRIM33 binds β-catenin in the nucleus. a & b, Co-IP of endogenous TRIM33 with β-catenin in HT-29 cells (a) and HEK 293T cells (b). TRIM33 was immunoprecipitated, and the amount of
SD-1 SD-1: Cathepsin B levels in TNF treated hch
 SD-1 SD-1: Cathepsin B levels in TNF treated hch. A. RNA and B. protein extracts from TNF treated and untreated human chondrocytes (hch) were analyzed via qpcr (left) and immunoblot analyses (right) for
LPS LPS P6 - + Supplementary Fig. 1.
 P6 LPS - - - + + + - LPS + + - - P6 + Supplementary Fig. 1. Pharmacological inhibition of the JAK/STAT blocks LPS-induced HMGB1 nuclear translocation. RAW 267.4 cells were stimulated with LPS in the absence
Supplemental Information. Tissue Myeloid Progenitors Differentiate. into Pericytes through TGF-b Signaling. in Developing Skin Vasculature
 Cell Reports, Volume 18 Supplemental Information Tissue Myeloid Progenitors Differentiate into Pericytes through TGF-b Signaling in Developing Skin Vasculature Tomoko Yamazaki, Ani Nalbandian, Yutaka Uchida,
Supplementary Information File
 Supplementary Information File Supplementary Table 1. List of synthesized sirna sequences for target genes sirna Species Sequence Ctrl sirna mouse sense 5 -UUCUCCGAACGUGUCACGUTT-3 Antisense 5 -ACGUGACACGUUCGGAGAATT-3
(a) Significant biological processes (upper panel) and disease biomarkers (lower panel)
 Significant biological processes (upper panel) and disease biomarkers (lower panel)") Supplementary Figure 1. Functional enrichment analyses of secretomic proteins. (a) Significant biological processes (upper panel) and disease biomarkers (lower panel) 2 involved by hrab37-mediated secretory
Supplementary Figure 1. Functional enrichment analyses of secretomic proteins. (a) Significant biological processes (upper panel) and disease biomarkers (lower panel) 2 involved by hrab37-mediated secretory
Supplementary Figure 1. Characterization of human carotid plaques. (a) Flash-frozen human plaques were separated into vulnerable (V) and stable (S),
 Flash-frozen human plaques were separated into vulnerable (V) and stable (S),") Supplementary Figure 1. Characterization of human carotid plaques. (a) Flash-frozen human plaques were separated into vulnerable (V) and stable (S), regions which were then quantified for mean fluorescence
Supplementary Figure 1. Characterization of human carotid plaques. (a) Flash-frozen human plaques were separated into vulnerable (V) and stable (S), regions which were then quantified for mean fluorescence
a 10 4 Link et al. Supplementary Figure 1 Nature Immunology: doi: /ni.1842 Cells per mouse ( 10 5 ) TRPV2KO anti-gr1 anti-gr anti-f4/80
 TRPV2KO anti-gr1 anti-gr anti-f4/80") a 10 4 WT 10 4 TRPV2KO 10 3 10 3 anti-gr1 10 2 10 1 anti-gr1 10 2 10 1 10 0 10 0 10 1 10 2 10 3 10 4 anti-f4/80 42.3 45.2 10 0 10 0 10 1 10 2 10 3 10 4 anti-f4/80 10 4 10 4 40 42.5 anti-cd11b 10 3 10 2
a 10 4 WT 10 4 TRPV2KO 10 3 10 3 anti-gr1 10 2 10 1 anti-gr1 10 2 10 1 10 0 10 0 10 1 10 2 10 3 10 4 anti-f4/80 42.3 45.2 10 0 10 0 10 1 10 2 10 3 10 4 anti-f4/80 10 4 10 4 40 42.5 anti-cd11b 10 3 10 2
Title: Smooth muscle cell-specific Tgfbr1 deficiency promotes aortic aneurysm formation by stimulating multiple signaling events
 Title: Smooth muscle cell-specific Tgfbr1 deficiency promotes aortic aneurysm formation by stimulating multiple signaling events Pu Yang 1, 3, radley M. Schmit 1, Chunhua Fu 1, Kenneth DeSart 1, S. Paul
Role of Tyk-2 in Th9 and Th17 cells in allergic asthma
 Supplementary File Role of Tyk-2 in Th9 and Th17 cells in allergic asthma Caroline Übel 1*, Anna Graser 1*, Sonja Koch 1, Ralf J. Rieker 2, Hans A. Lehr 3, Mathias Müller 4 and Susetta Finotto 1** 1 Laboratory
Integrin CD11b negatively regulates TLR-triggered inflammatory responses by. activating Syk and promoting MyD88 and TRIF degradation via cbl-b
 Integrin CD11b negatively regulates TLR-triggered inflammatory responses by activating Syk and promoting MyD88 and TRIF degradation via cbl-b Chaofeng Han, Jing Jin, Sheng Xu, Haibo Liu, Nan Li, and Xuetao
!! INL!!!! ONL!! IS/OS!!
 SUPPLEMENTARY FIGURES GCL INL ONL IS/OS RPE Choroid GR MR A B C HSD2 Cc RPE CV D Cc RPE CV E RPE Cc CV F RPE Cc CV Figure S1 Figure S1: Immunohistochemistry eidence for glucocorticoid receptor (GR), mineralocorticoid
Supplementary Figure 1. Expression of CUGBP1 in non-parenchymal liver cells treated with TGF-β
 Supplementary Figures Supplementary Figure 1. Expression of CUGBP1 in non-parenchymal liver cells treated with TGF-β and LPS. Non-parenchymal liver cells were isolated and treated with or without TGF-β
Hypothalamic TLR2 triggers sickness behavior via a microglia-neuronal axis
 Hypothalamic TLR triggers sickness behavior via a microglia-neuronal axis Sungho Jin, *, Jae Geun Kim,, *, Jeong Woo Park, Marco Koch,, Tamas L. Horvath and Byung Ju Lee Department of Biological Sciences,
Supplementary Figure 1.
 Supplementary Figure 1. Increased β cell mass and islet diameter in βtsc2 -/- mice up to 35 weeks A: Reconstruction of multiple anti-insulin immunofluorescence images showing differences in β cell mass
Receptor-interacting Protein Kinases Mediate Necroptosis In Neural Tissue Damage After Spinal Cord Injury
 Receptor-interacting Protein Kinases Mediate Necroptosis In Neural Tissue Damage After Spinal Cord Injury Haruo Kanno, M.D., Ph.D., Hiroshi Ozawa, M.D., Ph.D., Satoshi Tateda, M.D., Kenichiro Yahata, M.D.,
Supplemental Materials. STK16 regulates actin dynamics to control Golgi organization and cell cycle
 Supplemental Materials STK16 regulates actin dynamics to control Golgi organization and cell cycle Juanjuan Liu 1,2,3, Xingxing Yang 1,3, Binhua Li 1, Junjun Wang 1,2, Wenchao Wang 1, Jing Liu 1, Qingsong
Page 39 of 44. 8h LTA & AT h PepG & AT h LTA
 Page 39 of 44 Fig. S1 A: B: C: D: 8h LTA 8h LTA & AT7519 E: F: 8h PepG G: 8h PepG & AT7519 Fig. S1. AT7519 overrides the survival effects of lipoteichoic acid (LTA) and peptidoglycan (PepG). (A) Human
F-actin VWF Vinculin. F-actin. Vinculin VWF
 a F-actin VWF Vinculin b F-actin VWF Vinculin Supplementary Fig. 1. WPBs in HUVECs are located along stress fibers and at focal adhesions. (a) Immunofluorescence images of f-actin (cyan), VWF (yellow),
J. Cell Sci. 129: doi: /jcs : Supplementary information
 Movie 1. AgLDL is contained in small sub-regions of the lysosomal synapse that are acidic. J774 cells were incubated with agldl dual labeled with a ph sensitive and a ph insensitive fluorophore for 1 hr.
genome edited transient transfection, CMV promoter
 Supplementary Figure 1. In the absence of new protein translation, overexpressed caveolin-1-gfp is degraded faster than caveolin-1-gfp expressed from the endogenous caveolin 1 locus % loss of total caveolin-1-gfp
SUPPLEMENTARY FIGURES AND TABLE
 SUPPLEMENTARY FIGURES AND TABLE Supplementary Figure S1: Characterization of IRE1α mutants. A. U87-LUC cells were transduced with the lentiviral vector containing the GFP sequence (U87-LUC Tet-ON GFP).
Supplementary Figure 1. IDH1 and IDH2 mutation site sequences on WHO grade III
 Supplementary Materials: Supplementary Figure 1. IDH1 and IDH2 mutation site sequences on WHO grade III patient samples. Genomic DNA samples extracted from punch biopsies from either FFPE or frozen tumor
Nature Immunology: doi: /ni.3866
 Nature Immunology: doi:10.1038/ni.3866 Supplementary Figure 1 The effect of TIPE2 on chemotaxis. a, The expression of TIPE2 in dhl-60c, dhl-60t, TIPE2-expressing and 15/16Q-expressing dhl-60t neutrophils
Evaluation of directed and random motility in microslides Assessment of leukocyte adhesion in flow chambers
 Evaluation of directed and random motility in microslides Motility experiments in IBIDI microslides, image acquisition and processing were performed as described. PMN, which ended up in an angle < 180
Supplementary Figure 1. Ent inhibits LPO activity in a dose- and time-dependent fashion.
 Supplementary Information Supplementary Figure 1. Ent inhibits LPO activity in a dose- and time-dependent fashion. Various concentrations of Ent, DHBA or ABAH were pre-incubated for 10 min with LPO (50
Supplementary Materials for
 www.sciencesignaling.org/cgi/content/full/4/199/ra75/dc1 Supplementary Materials for Signaling by the Matrix Proteoglycan Decorin Controls Inflammation and Cancer Through PDCD4 and MicroRNA-21 Rosetta
Supplementary Figure 1:
 Supplementary Figure 1: (A) Whole aortic cross-sections stained with Hematoxylin and Eosin (H&E), 7 days after porcine-pancreatic-elastase (PPE)-induced AAA compared to untreated, healthy control aortas
Supplementary Information. Tissue-wide immunity against Leishmania. through collective production of nitric oxide
 Supplementary Information Tissue-wide immunity against Leishmania through collective production of nitric oxide Romain Olekhnovitch, Bernhard Ryffel, Andreas J. Müller and Philippe Bousso Supplementary
L1 on PyMT tumor cells but Py117 cells are more responsive to IFN-γ. (A) Flow
 Flow") A MHCI B PD-L1 Fold expression 8 6 4 2 Fold expression 3 2 1 No tx 1Gy 2Gy IFN Py117 Py117 Supplementary Figure 1. Radiation and IFN-γ enhance MHCI expression and PD- L1 on PyMT tumor cells but Py117 cells
A MHCI B PD-L1 Fold expression 8 6 4 2 Fold expression 3 2 1 No tx 1Gy 2Gy IFN Py117 Py117 Supplementary Figure 1. Radiation and IFN-γ enhance MHCI expression and PD- L1 on PyMT tumor cells but Py117 cells
Effective Targeting of Quiescent Chronic Myelogenous
 Cancer Cell, Volume 7 Supplemental Information Effective Targeting of Quiescent Chronic Myelogenous Leukemia Stem Cells by Histone Deacetylase Inhibitors in Combination with Imatinib Mesylate Bin Zhang,
fig. S1 Gene silencing of LC3B by sirna enhances IL-1β secretion. Peritoneal
 15 Scramble sirna LC3B sirna IL-1β (pg/ml) 1 5 LC3B (kda) - 18 (LC3B I) - 16 (LC3B II) β-actin - 42 ( _ ) LPS LPS ATP fig. S1 Gene silencing of LC3B by sirna enhances IL-1β secretion. Peritoneal macrophages
Figure S1. Western blot analysis of clathrin RNA interference in human DCs Human immature DCs were transfected with 100 nm Clathrin SMARTpool or
 Figure S1. Western blot analysis of clathrin RNA interference in human DCs Human immature DCs were transfected with 100 nm Clathrin SMARTpool or control nontargeting sirnas. At 90 hr after transfection,
Role of Th17 cells in the immunopathogenesis of dry eye disease
 Role of Th17 cells in the immunopathogenesis of dry eye disease The Harvard community has made this article openly available. Please share how this access benefits you. Your story matters Citation Chauhan,
Supplementary Figure 1. mrna expression of chitinase and chitinase-like protein in splenic immune cells. Each splenic immune cell population was
 Supplementary Figure 1. mrna expression of chitinase and chitinase-like protein in splenic immune cells. Each splenic immune cell population was sorted by FACS. Surface markers for sorting were CD11c +
Supplementary Figure 1. DNA methylation of the adiponectin promoter R1, Pparg2, and Tnfa promoter in adipocytes is not affected by obesity.
 Supplementary Figure 1. DNA methylation of the adiponectin promoter R1, Pparg2, and Tnfa promoter in adipocytes is not affected by obesity. (a) Relative amounts of adiponectin, Ppar 2, C/ebp, and Tnf mrna
Figure S1 Genetic or pharmacologic COX-2 inhibition led to increased kidney
 SUPPLEMENTAL FIGURE LEGENDS Figure S1 Genetic or pharmacologic COX-2 inhibition led to increased kidney macrophage infiltration. Wild type or COX-2 -/- mice (2 months old, C57/Bl6 background) were treated
Aggregated neutrophil extracellular traps limit inflammation by degrading cytokines and chemokines
 CORRECTION NOTICE Nat. Med. doi:10.1038/nm.3547; corrected online 25 August 2014 Aggregated neutrophil extracellular traps limit inflammation by degrading cytokines and chemokines Christine Schauer, Christina
effect on the upregulation of these cell surface markers. The mean peak fluorescence intensity
 SUPPLEMENTARY FIGURE 1 Supplementary Figure 1 ASIC1 disruption or blockade does not effect in vitro and in vivo antigen-presenting cell activation. (a) Flow cytometric analysis of cell surface molecules
Prolonged mitotic arrest induces a caspase-dependent DNA damage
 SUPPLEMENTARY INFORMATION Prolonged mitotic arrest induces a caspase-dependent DNA damage response at telomeres that determines cell survival Karolina O. Hain, Didier J. Colin, Shubhra Rastogi, Lindsey
Supplementary Figures
 Supplementary Figures Supplementary Figure 1 Increased ABHD5 expression in human colon cancer associated macrophages. (a) Murine peritoneal macrophages were treated with regular culture medium (Ctrl) or
A263 A352 A204. Pan CK. pstat STAT3 pstat3 STAT3 pstat3. Columns Columns 1-6 Positive control. Omentum. Rectosigmoid A195.
 pstat3 75 Pan CK A A263 A352 A24 B Columns 1-6 Positive control A195 A22 A24 A183 Rectal Nodule STAT3 pstat3 STAT3 pstat3 Columns 7-12 Omentum Rectosigmoid Left Ovary Right Ovary Omentum Uterus Uterus
Title of file for HTML: Supplementary Information Description: Supplementary Figures and Supplementary Table
 Title of file for HTML: Supplementary Information Description: Supplementary Figures and Supplementary Table Title of file for HTML: Peer Review File Description: Innate Scavenger Receptor-A regulates
Supporting Information. FADD regulates NF-кB activation and promotes ubiquitination of cflip L to induce. apoptosis
 1 2 Supporting Information 3 4 5 FADD regulates NF-кB activation and promotes ubiquitination of cflip L to induce apoptosis 6 7 Kishu Ranjan and Chandramani Pathak* 8 9 Department of Cell Biology, School
Trim29 gene-targeting strategy. (a) Genotyping of wildtype mice (+/+), Trim29 heterozygous mice (+/ ) and homozygous mice ( / ).
 Genotyping of wildtype mice (+/+), Trim29 heterozygous mice (+/ ) and homozygous mice ( / ).") Supplementary Figure 1 Trim29 gene-targeting strategy. (a) Genotyping of wildtype mice (+/+), Trim29 heterozygous mice (+/ ) and homozygous mice ( / ). (b) Immunoblot analysis of TRIM29 in lung primary
Supplementary Figure 1 Trim29 gene-targeting strategy. (a) Genotyping of wildtype mice (+/+), Trim29 heterozygous mice (+/ ) and homozygous mice ( / ). (b) Immunoblot analysis of TRIM29 in lung primary
Supplementary Figure S1. Flow cytometric analysis of the expression of Thy1 in NH cells. Flow cytometric analysis of the expression of T1/ST2 and
 Supplementary Figure S1. Flow cytometric analysis of the expression of Thy1 in NH cells. Flow cytometric analysis of the expression of T1/ST2 and Thy1 in NH cells derived from the lungs of naïve mice.
Supplementary Figure 1. H-PGDS deficiency does not affect GI tract functions and anaphylactic reaction. (a) Representative pictures of H&E-stained
 Representative pictures of H&E-stained") 1 2 3 4 5 6 7 8 9 10 11 Supplementary Figure 1. H-PGDS deficiency does not affect GI tract functions and anaphylactic reaction. (a) Representative pictures of H&E-stained jejunum sections ( 200 magnification;
1 2 3 4 5 6 7 8 9 10 11 Supplementary Figure 1. H-PGDS deficiency does not affect GI tract functions and anaphylactic reaction. (a) Representative pictures of H&E-stained jejunum sections ( 200 magnification;
Nature Immunology: doi: /ni eee Supplementary Figure 1
 eee Supplementary Figure 1 Hyphae induce NET release, but yeast do not. (a) NET release by human peripheral neutrophils stimulated with a hgc1 yeast-locked C. albicans mutant (yeast) or pre-formed WT C.
Supplementary Table 1. List of primers used in this study
 Supplementary Table 1. List of primers used in this study Gene Forward primer Reverse primer Rat Met 5 -aggtcgcttcatgcaggt-3 5 -tccggagacacaggatgg-3 Rat Runx1 5 -cctccttgaaccactccact-3 5 -ctggatctgcctggcatc-3
Supplementary Figure (OH) 22 nanoparticles did not affect cell viability and apoposis. MDA-MB-231, MCF-7, MCF-10A and BT549 cells were
 22 nanoparticles did not affect cell viability and apoposis. MDA-MB-231, MCF-7, MCF-10A and BT549 cells were") Supplementary Figure 1. Gd@C 82 (OH) 22 nanoparticles did not affect cell viability and apoposis. MDA-MB-231, MCF-7, MCF-10A and BT549 cells were treated with PBS, Gd@C 82 (OH) 22, C 60 (OH) 22 or GdCl
Supplementary Figure 1. Gd@C 82 (OH) 22 nanoparticles did not affect cell viability and apoposis. MDA-MB-231, MCF-7, MCF-10A and BT549 cells were treated with PBS, Gd@C 82 (OH) 22, C 60 (OH) 22 or GdCl
SUPPLEMENTARY INFORMATION
 SUPPLEMENTARY INFORMATION doi:1.138/nature9814 a A SHARPIN FL B SHARPIN ΔNZF C SHARPIN T38L, F39V b His-SHARPIN FL -1xUb -2xUb -4xUb α-his c Linear 4xUb -SHARPIN FL -SHARPIN TF_LV -SHARPINΔNZF -SHARPIN
Supplementary Figure 1. Deletion of Smad3 prevents B16F10 melanoma invasion and metastasis in a mouse s.c. tumor model.
 A B16F1 s.c. Lung LN Distant lymph nodes Colon B B16F1 s.c. Supplementary Figure 1. Deletion of Smad3 prevents B16F1 melanoma invasion and metastasis in a mouse s.c. tumor model. Highly invasive growth
Supplementary Figures
 Supplementary Figures Supplementary Figure 1 Characterization of stable expression of GlucB and sshbira in the CT26 cell line (a) Live cell imaging of stable CT26 cells expressing green fluorescent protein
ROCK/Cdc42-mediated microglial motility and gliapse formation lead to phagocytosis of degenerating dopaminergic neurons in vivo
 Supplementary Information ROCK/Cdc42-mediated microglial motility and gliapse formation lead to phagocytosis of degenerating dopaminergic neurons in vivo Carlos Barcia* 1,2, Carmen M Ros 1,2, Valentina
Supplementary Figure 1 Expression of Crb3 in mouse sciatic nerve: biochemical analysis (a) Schematic of Crb3 isoforms, ERLI and CLPI, indicating the
 Schematic of Crb3 isoforms, ERLI and CLPI, indicating the") Supplementary Figure 1 Expression of Crb3 in mouse sciatic nerve: biochemical analysis (a) Schematic of Crb3 isoforms, ERLI and CLPI, indicating the location of the transmembrane (TM), FRM binding (FB)
Supplementary Figure 1 Expression of Crb3 in mouse sciatic nerve: biochemical analysis (a) Schematic of Crb3 isoforms, ERLI and CLPI, indicating the location of the transmembrane (TM), FRM binding (FB)
Supplementary Figure 1: TSLP receptor skin expression in dcssc. A: Healthy control (HC) skin with TSLP receptor expression in brown (10x
 skin with TSLP receptor expression in brown (10x") Supplementary Figure 1: TSLP receptor skin expression in dcssc. A: Healthy control (HC) skin with TSLP receptor expression in brown (10x magnification). B: Second HC skin stained for TSLP receptor in brown
Supplementary Figure 1: TSLP receptor skin expression in dcssc. A: Healthy control (HC) skin with TSLP receptor expression in brown (10x magnification). B: Second HC skin stained for TSLP receptor in brown
Title: NLRP3 plays a protective role during the development of age related macular degeneration through the induction of IL-18 by drusen components.
 Title: NLRP3 plays a protective role during the development of age related macular degeneration through the induction of IL-18 by drusen components. Sarah L. Doyle 1*, Matthew Campbell 2*, Ema Ozaki 2,
A. Generation and characterization of Ras-expressing autophagycompetent
 Supplemental Material Supplemental Figure Legends Fig. S1 A. Generation and characterization of Ras-expressing autophagycompetent and -deficient cell lines. HA-tagged H-ras V12 was stably expressed in
Supplementary Figure 1. AdipoR1 silencing and overexpression controls. (a) Representative blots (upper and lower panels) showing the AdipoR1 protein
 Representative blots (upper and lower panels) showing the AdipoR1 protein") Supplementary Figure 1. AdipoR1 silencing and overexpression controls. (a) Representative blots (upper and lower panels) showing the AdipoR1 protein content relative to GAPDH in two independent experiments.
Supplementary Figure 1. AdipoR1 silencing and overexpression controls. (a) Representative blots (upper and lower panels) showing the AdipoR1 protein content relative to GAPDH in two independent experiments.
Impact of hyper-o-glcnacylation on apoptosis and NF-κB activity SUPPLEMENTARY METHODS
 SUPPLEMENTARY METHODS 3D culture and cell proliferation- MiaPaCa-2 cell culture in 3D was performed as described previously (1). Briefly, 8-well glass chamber slides were evenly coated with 50 µl/well
- 1 - Cell types Monocytes THP-1 cells Macrophages. LPS Treatment time (Hour) IL-6 level (pg/ml)
 IL-6 level (pg/ml)") Supplementary Table ST1: The dynamic effect of LPS on IL-6 production in monocytes and THP-1 cells after GdA treatment. Monocytes, THP-1 cells and macrophages (5x10 5 ) were incubated with 10 μg/ml of
Supplementary Table ST1: The dynamic effect of LPS on IL-6 production in monocytes and THP-1 cells after GdA treatment. Monocytes, THP-1 cells and macrophages (5x10 5 ) were incubated with 10 μg/ml of
p = formed with HCI-001 p = Relative # of blood vessels that formed with HCI-002 Control Bevacizumab + 17AAG Bevacizumab 17AAG
 A.. Relative # of ECs associated with HCI-001 1.4 1.2 1.0 0.8 0.6 0.4 0.2 0.0 ol b p < 0.001 Relative # of blood vessels that formed with HCI-001 1.4 1.2 1.0 0.8 0.6 0.4 0.2 0.0 l b p = 0.002 Control IHC:
Nature Medicine: doi: /nm.4078
 Supplementary Figure 1. Cetuximab induces ER stress response in DiFi cells. (a) Scheme of SILAC proteome. (b) MS-base read out of SILAC experiment. The histogram of log 2 -transformed normalized H/L ratios
Supplementary Figure 1
 Combination index (CI) Supplementary Figure 1 2. 1.5 1. Ishikawa AN3CA Nou-1 Hec-18.5...2.4.6.8 1. Fraction affected (Fa) Supplementary Figure 1. The synergistic effect of PARP inhibitor and PI3K inhibitor
HCC1937 is the HCC1937-pcDNA3 cell line, which was derived from a breast cancer with a mutation
 SUPPLEMENTARY INFORMATION Materials and Methods Human cell lines and culture conditions HCC1937 is the HCC1937-pcDNA3 cell line, which was derived from a breast cancer with a mutation in exon 20 of BRCA1
Electron micrograph of phosphotungstanic acid-stained exosomes derived from murine
 1 SUPPLEMENTARY INFORMATION SUPPLEMENTARY FIGURES Supplementary Figure 1. Physical properties of murine DC-derived exosomes. a, Electron micrograph of phosphotungstanic acid-stained exosomes derived from
SUPPLEMENTARY INFORMATION
 DOI:.38/ncb3399 a b c d FSP DAPI 5mm mm 5mm 5mm e Correspond to melanoma in-situ Figure a DCT FSP- f MITF mm mm MlanaA melanoma in-situ DCT 5mm FSP- mm mm mm mm mm g melanoma in-situ MITF MlanaA mm mm
Stewart et al. CD36 ligands promote sterile inflammation through assembly of a TLR 4 and 6 heterodimer
 NFκB (fold induction) Stewart et al. ligands promote sterile inflammation through assembly of a TLR 4 and 6 heterodimer a. mrna (fold induction) 5 4 3 2 1 LDL oxldl Gro1a MIP-2 RANTES mrna (fold induction)