Supplementary Figure 1. A. Bar graph representing the expression levels of the 19 indicated genes in the microarrays analyses comparing human lung
|
|
|
- Austin Lester
- 6 years ago
- Views:
Transcription
1
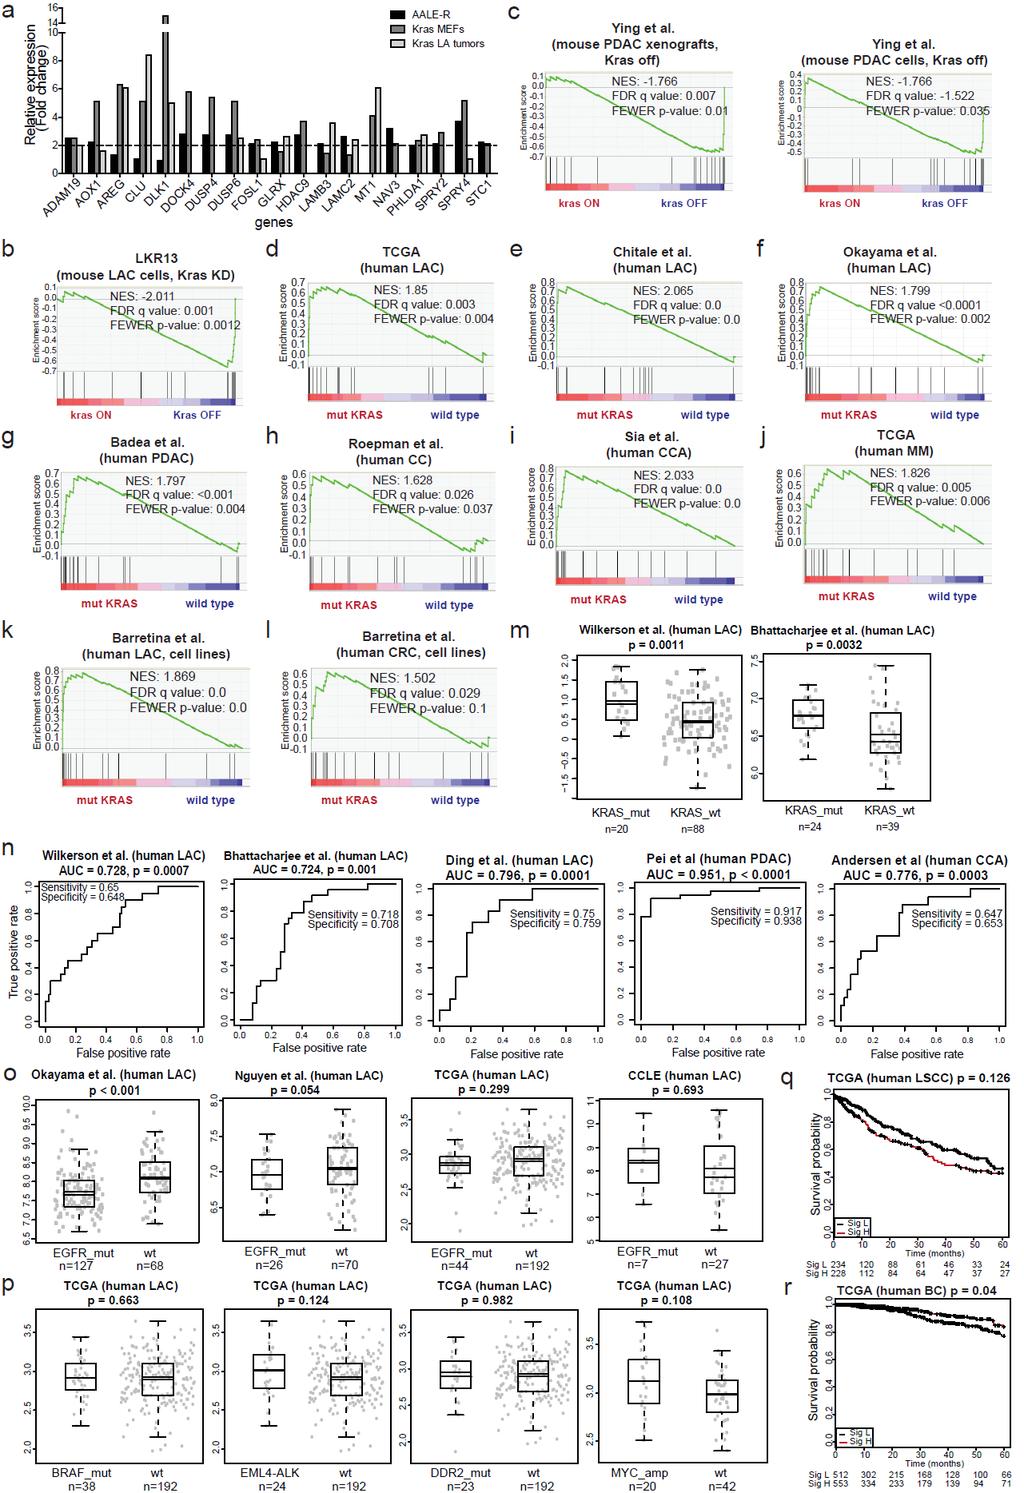
2 Supplementary Figure 1. A. Bar graph representing the expression levels of the 19 indicated genes in the microarrays analyses comparing human lung immortalized broncho-epithelial cells (AALE cells) expressing exogenous KRAS G12D over wild-type KRAS-expressing cell (black), mutant KRAS MEFs over wild-type MEFs (dark grey) and Kras LA2 mouse lung adenocarcinoma tumors over normal lung tissue (light grey). B-L. Gene set enrichment analysis of mouse (B and C) and human (D-L) cancer data sets comparing either active mutant KRAS cells to KRAS-inhibited cells (B and C) or mutant KRAS patients to wild-type KRAS patients (D-L). +, positive; -, negative. M. Box and whiskers plots summarizing the geometric mean of the 8-gene signature in mutant and wild-type KRAS LAC data sets. Each dot is a sample. N. Performance of a univariate classification model for predicting mutant vs. wild-type KRAS of LAC, PDAC and CCA patients based on gene expression of the 8-gene signature measured by area under receiver operator characteristics (AUC). O. Box and whiskers plots summarizing the geometric mean of the 8-gene signature in mutant and wild-type EGFR LAC. P values obtained using Student s t test. P. Box and whiskers plots summarizing the geometric mean of the 8-gene signature in mutant BRAF, EML4-ALK, DDR2 or amplified MYC and wild-type LAC. P values obtained using Student s t test. Q and R. Kaplan-Meier plot of lung squamous carcinoma (Q) or breast cancer (R) patients (TCGA data set) stratified by the mean expression of the 8-gene crosstumors signature. P values obtained using log-rank test (Mantel-Cox).
 or breast cancer (B) patients (TCGA data set) stratified by the mean FOSL1 expression.")
3 Supplementary Figure 2. A and B. Kaplan-Meier plot of lung squamous carcinoma (A) or breast cancer (B) patients (TCGA data set) stratified by the mean FOSL1 expression. P values obtained using log-rank test (Mantel-Cox). C. Immunohistochemistry of FOSL1 protein in mutant (n=2) and
4 wild-type (n=2) KRAS patient-derived xenografts. D. Western blot of H358 cells treated with U0126 (MEKi, 10 μm), BIX02189 (MEK5i, 10 μm), SB (JNKi, 20 μm), LY (AKTi, 10 μm) and SB (p38i, 20 μm) and probed with indicated antibodies. The experiment was done 3 times. E. Western blot in mouse Kras-driven lung cancer cells for indicated antibodies to show specificity of a FOSL1 antibody in mouse samples. Western blot was done in 3 independent protein lysates for each sample. F. Expression of FOSL1 (red) and Ki67 (green) by immunofluorescence in tumors from Kras LSLG12D, p53 f/f mice. Scale bar 50 μm. Bar graph indicates percentage of double FOSL1 and Ki67 positive cells in FOSL1-positive tumors. G. qrt-pcr on mutant Kras LAC cells, wild-type Kras squamous carcinoma cells (UNSCC680) and normal lung. Error bars correspond to s.d. mrna was obtained from at 3 independent isolates per sample.

5 Supplementary Figure 3. A. Western blot for indicated antibodies in mutant and wild-type KRAS LAC cell lines after infection with indicated shrnas. B. Cumulative (left) and average (right) population doubling time of mutant (H358 and H2347) and wild-type (H1568 and H1650) KRAS cells.
6 C. Relative cell number of mutant RAS, human large cell carcinoma cell lines assessed by an MTS assay after 3 days in culture. Experiment was performed in triplicate. D. Relative cell number of mutant Kras, mouse LAC cell lines (LSZ2 and LSZ3) expressing a control GFP shrna or two independent shrnas against Fosl1 assessed by MTS. Experiment was done 3 times. P values obtained using Student s t test. E. Western blot analysis for indicated antibodies in mutant and wildtype KRAS cell lines carrying an inducible FOSL1 shrna (TET_FOSL1 sh1). Cells were treated with 1 μg/ml doxycycline for 96 h prior to protein collection. Results were similar between 2 different protein isolates. F. Relative cell number of H358 cell line expressing an inducible FOSL1 shrna. Error bars correspond to s.d. G and H. Representative images of xenografted tumors derived from mutant (H358 and H2347) or wild-type (H1650 and H1568) KRAS LAC cells expressing a doxycycline-inducible FOSL1 shrna or a control GFP shrna (TET_GFP sh). Error bars correspond to s.e.m. I. Analysis of Ki67 positive cells in representative areas (n=15) from tumors in G (H358). Error bars correspond to s.e.m. P values obtained using Student s t test. **, p< J. Analysis of cleaved caspase 3 positive cells in representative areas (n=10) of tumors in G. Error bars correspond to s.e.m. P values obtained using Student s t test. ***, p< K. Immunohistochemistry to detect FOSL1 expression in representative sections of the same tumors as in G. Scale bar 50 μm. *, p<0.05; **, p<0.01; ***, p< L. Representative images of xenografted tumors derived from mouse mutant Kras LAC cells (LSZ3) expressing a Fosl1 or a control GFP shrna. M. Representative images of xenografted tumors derived from mutant H358 KRAS LAC cells expressing a doxycycline-inducible FOSL1 shrna or a control GFP shrna. Doxicicline was administered when tumor volume reached 80 to 100 mm 3.
 and Kras LSL-G12D/+ ; Trp53 flox/flox ; Fosl1 flox/flox (KPF) groups. B.")
7 Supplementary Figure 4. A. Genotyping PCR of a mouse from the Kras LSL-G12D/+ ; Trp53 flox/flox ; Fosl1 +/+ (KP) and Kras LSL-G12D/+ ; Trp53 flox/flox ; Fosl1 flox/flox (KPF) groups. B. PCR to assess the degree of Fosl1 recombined allele in microdissected tumors from KPF mice. C. Tumor size analysis of KP and KPF mice by quartiles.
 and normal pancreatic tissue (grey). C.")
8 Supplementary Figure 5. A. Western blot for indicated antibodies in immortalized normal epithelial pancreatic cells (KF07) and KRAS-driven PDAC cells (CFPac1 and HPAFII). B. Western blot for indicated proteins in mouse pancreatic cancer cells (black) and normal pancreatic tissue (grey). C. Western blot for indicated antibodies in mutant KRAS PDAC cells (CFPac1) carrying a doxyxycline-
9 inducible KRAS or GFP shrna. Expression of the shrna was induced with 1 μg/ml doxycycline for 96 h prior to protein collection. D. Western blot for indicated proteins with a FOSL1 antibody (Santa Cruz Biotech., sc ) specifically used for immunohistochemistry studies to confirm specificity of antibody against human FOSL1 protein. E. Representative images of mouse and human PDAC samples stained with the same FOSL1 antibody as in D. F. Kaplan-Meier plot of PDAC patients for the expression of the 8-gene cross-tumors signature. P values obtained using log-rank test (Mantel- Cox). G. Ck19 mrna expression in acinar cells from Kras LSLG12D mice treated with control adenovirus (AdE), adenovirus Cre (AdCre) and AdCre plus a shrna targeting Fosl1. H. Ck19 mrna expression in acinar cells from Kras LSLG12D mice expressing an empty (ctrl) and a Fosl1-expressing vector.
10
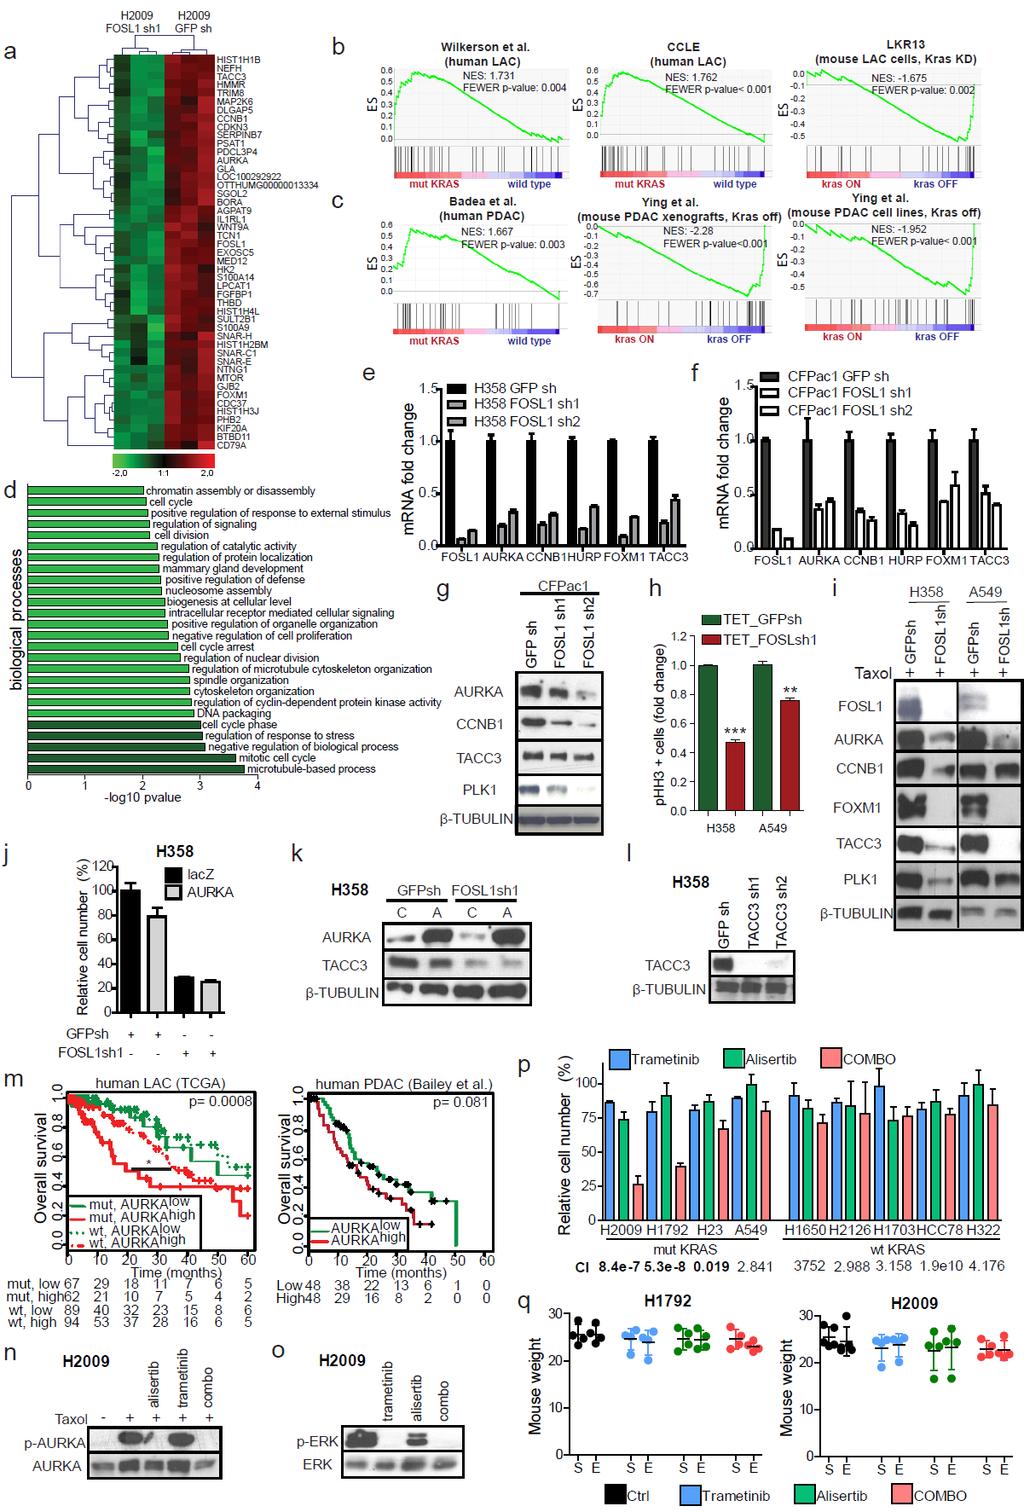
11 Supplementary Figure 6. A. Heat map of 45 down-regulated genes upon inhibition of FOSL1 in mutant KRAS cells (H2009) by a specific shrna. B and C. Gene set enrichment analysis of human LAC (B) and PDAC (C) data sets comparing mutant KRAS patients to wild-type KRAS patients. D. Bar graph representing the Gene Ontology analysis of the biological pathways enriched in genes down-regulated after FOSL1 inhibition. E and F. Q-PCR analysis of mitotic genes in human LAC (E) and PDAC (F) cells transduced with 2 shrnas to FOSL1.G. Western blot analysis of mitotic genes in CFPac1 PDAC cells after FOSL1 inhibition. H. Cell cycle analysis of phh3 positive cells in mutant KRAS LAC (H358 and A549) cell lines expressing an inducible GFP or FOSL1 shrna (1 μg/ml doxycycline) upon treatment with taxol (0.5 μm). I. Western blot analysis for indicated antibodies in mutant KRAS LAC cells (H358 and A549) carrying an inducible FOSL1 or GFP shrna. Expression of the shrna was induced with 1 μg/ml doxycycline for 96 h prior to protein collection. J. Cell proliferation assay (MTS) of H358 cells overexpressing lacz or AURKA and transduced with a shrna to FOSL1 and a shrna control (GFP). K. Western blot of indicated proteins in cell lysates from J. C: lacz; A: AURKA. L. Western blot of indicated proteins in H358 cells transduced two shrnas targeting TACC3. M. Survival analysis of LAC patients stratified by KRAS status and expression of AURKA, and PDAC patients stratified by expression of AURKA. P values obtained using log-rank test (Mantel- Cox). N. Western blot for phospho (p)-aurka and AURKA in H2009 cells treated with alisertib (500 nm), trametinib (500 nm) and both for 3 days. Cells were treated with taxol for the last 20 hours of the experiment to induce mitotic arrest and p-aurka activation. O. Western blot for phospho (p)-erk and ERK in H2009 cells treated with alisertib (500 nm), trametinib (nm) and their combination. P. MTS analysis of mutant and wild-type KRAS cells lines treated with alisertib (1 μm), trametinib (1 μm) or both. CI: combination index. Results are average of 4 different independent treatment experiments performed in triplicate. Q. Average tumor weight of mice injected with H2009 or H1792 cell lines and orally administered vehicle, alisertib (25 mg/kg), trametinib (1 mg/kg) or both. S: start of experiment; E: end of experiment.
12
13 Supplementary Figure 7. Uncropped blots corresponding to Figure 2.
14 Supplementary Figure 8. Uncropped blots corresponding to Figure 5.
15 Supplementary Figure 9. Uncropped blots corresponding to Figure 6.
 expressing exogenous KRAS G12D over wildtype KRAS-expressing cell, mutant KRAS MEFs over")
16 Supplementary Table 1. Meta-analysis of mouse and human data sets identifies 19 upregulated genes dependent on mutant KRAS expression. Summary of microarray analysis comparing human lung immortalized broncho-epithelial cells (AALE cells) expressing exogenous KRAS G12D over wildtype KRAS-expressing cell, mutant KRAS MEFs over wild-type MEFs and Kras LA2 mouse lung adenocarcinoma tumors over normal lung tissue. Selected genes include those with a LogFC>1 and B>0 in at least 2 out of the 3 microarray analyses.
17
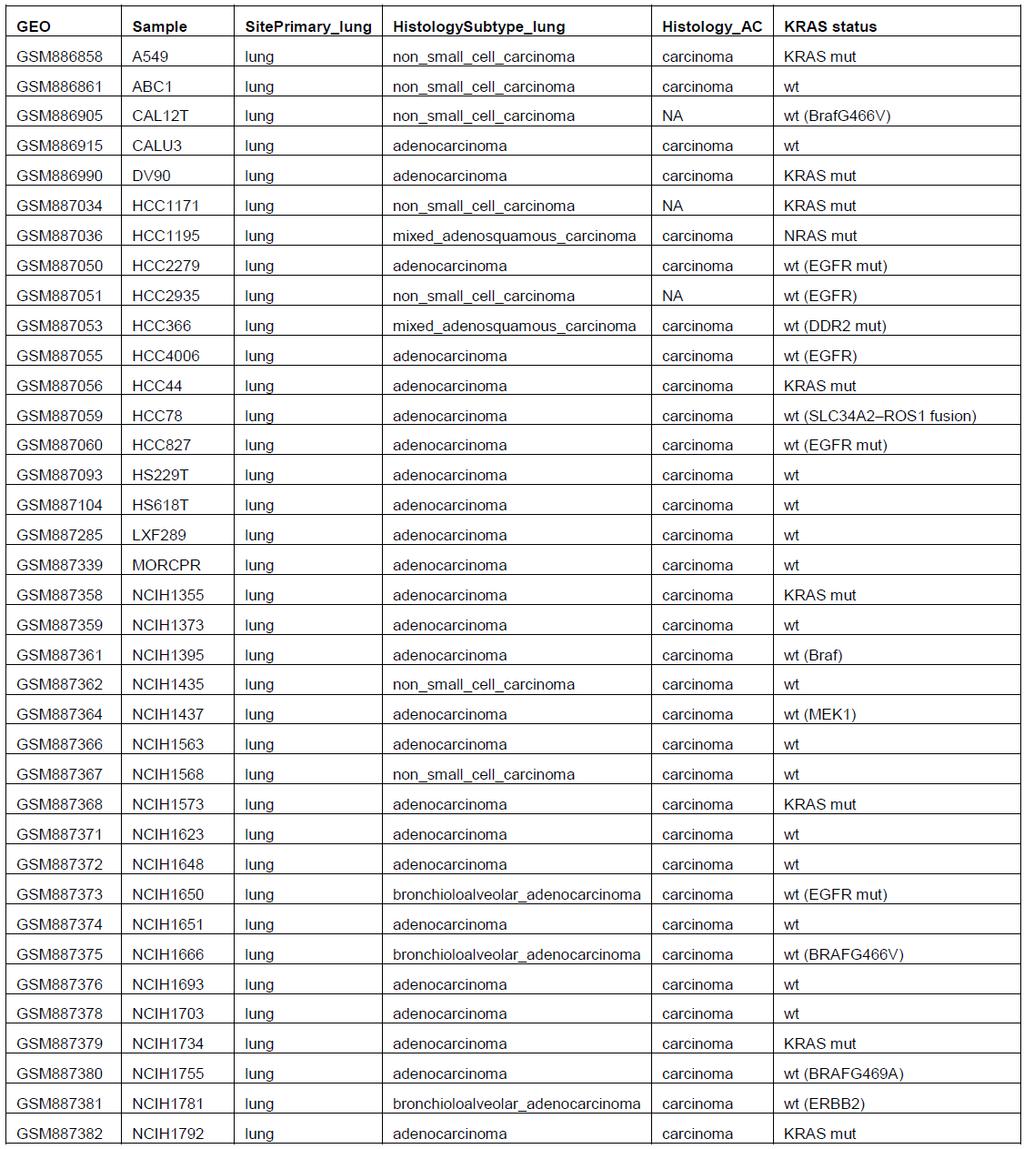
18 Supplementary Table 2. Annotation of LAC and CRC cell lines from the Cancer Cell line Encyclopedia.
19

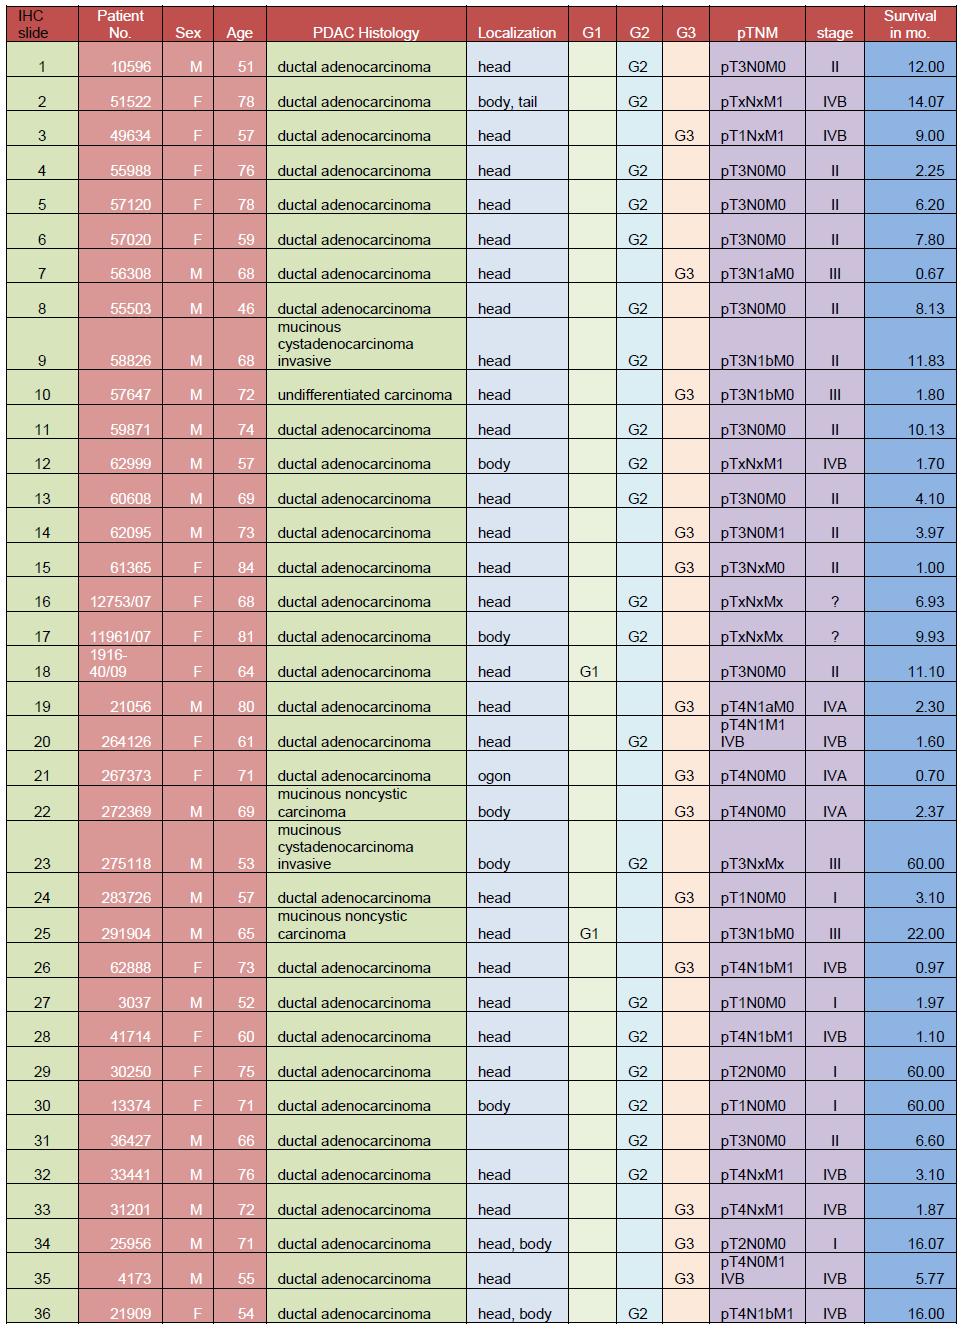
20 Supplementary Table 3. Information on PDAC patients clinical data.
EPIGENETIC RE-EXPRESSION OF HIF-2α SUPPRESSES SOFT TISSUE SARCOMA GROWTH
 EPIGENETIC RE-EXPRESSION OF HIF-2α SUPPRESSES SOFT TISSUE SARCOMA GROWTH Supplementary Figure 1. Supplementary Figure 1. Characterization of KP and KPH2 autochthonous UPS tumors. a) Genotyping of KPH2
SUPPLEMENTARY INFORMATION
 DOI: 10.1038/ncb2607 Figure S1 Elf5 loss promotes EMT in mammary epithelium while Elf5 overexpression inhibits TGFβ induced EMT. (a, c) Different confocal slices through the Z stack image. (b, d) 3D rendering
Supplementary Figure 1: STAT3 suppresses Kras-induced lung tumorigenesis
 Supplementary Figure 1: STAT3 suppresses Kras-induced lung tumorigenesis (a) Immunohistochemical (IHC) analysis of tyrosine 705 phosphorylation status of STAT3 (P- STAT3) in tumors and stroma (all-time
Supplemental Figure S1. RANK expression on human lung cancer cells.
 Supplemental Figure S1. RANK expression on human lung cancer cells. (A) Incidence and H-Scores of RANK expression determined from IHC in the indicated primary lung cancer subgroups. The overall expression
Supplemental Figure 1. Western blot analysis indicated that MIF was detected in the fractions of
 Supplemental Figure Legends Supplemental Figure 1. Western blot analysis indicated that was detected in the fractions of plasma membrane and cytosol but not in nuclear fraction isolated from Pkd1 null
File Name: Supplementary Information Description: Supplementary Figures and Supplementary Tables. File Name: Peer Review File Description:
 File Name: Supplementary Information Description: Supplementary Figures and Supplementary Tables File Name: Peer Review File Description: Primer Name Sequence (5'-3') AT ( C) RT-PCR USP21 F 5'-TTCCCATGGCTCCTTCCACATGAT-3'
Supplementary Figures
 Supplementary Figures Supplementary Figure 1 DOT1L regulates the expression of epithelial and mesenchymal markers. (a) The expression levels and cellular localizations of EMT markers were confirmed by
SUPPLEMENTARY INFORMATION
 DOI: 1.138/ncb3355 a S1A8 + cells/ total.1.8.6.4.2 b S1A8/?-Actin c % T-cell proliferation 3 25 2 15 1 5 T cells Supplementary Figure 1 Inter-tumoral heterogeneity of MDSC accumulation in mammary tumor
mtor Inhibition Specifically Sensitizes Colorectal Cancers with KRAS or BRAF Mutations to BCL-2/BCL-
 Supplementary Material for mtor Inhibition Specifically Sensitizes Colorectal Cancers with KRAS or BRAF Mutations to BCL-2/BCL- XL Inhibition by Suppressing MCL-1 Anthony C. Faber 1,2 *, Erin M. Coffee
Supplementary Fig. 1. GPRC5A post-transcriptionally down-regulates EGFR expression. (a) Plot of the changes in steady state mrna levels versus
 Plot of the changes in steady state mrna levels versus") Supplementary Fig. 1. GPRC5A post-transcriptionally down-regulates EGFR expression. (a) Plot of the changes in steady state mrna levels versus changes in corresponding proteins between wild type and Gprc5a-/-
Supplementary Fig. 1. GPRC5A post-transcriptionally down-regulates EGFR expression. (a) Plot of the changes in steady state mrna levels versus changes in corresponding proteins between wild type and Gprc5a-/-
Supplementary Figure 1: si-craf but not si-braf sensitizes tumor cells to radiation.
 Supplementary Figure 1: si-craf but not si-braf sensitizes tumor cells to radiation. (a) Embryonic fibroblasts isolated from wildtype (WT), BRAF -/-, or CRAF -/- mice were irradiated (6 Gy) and DNA damage
fl/+ KRas;Atg5 fl/+ KRas;Atg5 fl/fl KRas;Atg5 fl/fl KRas;Atg5 Supplementary Figure 1. Gene set enrichment analyses. (a) (b)
 (b)") KRas;At KRas;At KRas;At KRas;At a b Supplementary Figure 1. Gene set enrichment analyses. (a) GO gene sets (MSigDB v3. c5) enriched in KRas;Atg5 fl/+ as compared to KRas;Atg5 fl/fl tumors using gene set
KRas;At KRas;At KRas;At KRas;At a b Supplementary Figure 1. Gene set enrichment analyses. (a) GO gene sets (MSigDB v3. c5) enriched in KRas;Atg5 fl/+ as compared to KRas;Atg5 fl/fl tumors using gene set
Type of file: PDF Size of file: 0 KB Title of file for HTML: Supplementary Information Description: Supplementary Figures
 Type of file: PDF Size of file: 0 KB Title of file for HTML: Supplementary Information Description: Supplementary Figures Supplementary Figure 1 mir-128-3p is highly expressed in chemoresistant, metastatic
TEB. Id4 p63 DAPI Merge. Id4 CK8 DAPI Merge
 a Duct TEB b Id4 p63 DAPI Merge Id4 CK8 DAPI Merge c d e Supplementary Figure 1. Identification of Id4-positive MECs and characterization of the Comma-D model. (a) IHC analysis of ID4 expression in the
Supplementary Figure S1 Expression of mir-181b in EOC (A) Kaplan-Meier
 Kaplan-Meier") Supplementary Figure S1 Expression of mir-181b in EOC (A) Kaplan-Meier curves for progression-free survival (PFS) and overall survival (OS) in a cohort of patients (N=52) with stage III primary ovarian
Supplementary Figure S1 Expression of mir-181b in EOC (A) Kaplan-Meier curves for progression-free survival (PFS) and overall survival (OS) in a cohort of patients (N=52) with stage III primary ovarian
Supplementary Information Titles Journal: Nature Medicine
 Supplementary Information Titles Journal: Nature Medicine Article Title: Corresponding Author: Supplementary Item & Number Supplementary Fig.1 Fig.2 Fig.3 Fig.4 Fig.5 Fig.6 Fig.7 Fig.8 Fig.9 Fig. Fig.11
Figure S1: Effects on haptotaxis are independent of effects on cell velocity A)
") Supplemental Figures Figure S1: Effects on haptotaxis are independent of effects on cell velocity A) Velocity of MV D7 fibroblasts expressing different GFP-tagged Ena/VASP family proteins in the haptotaxis
Supplemental Figures Figure S1: Effects on haptotaxis are independent of effects on cell velocity A) Velocity of MV D7 fibroblasts expressing different GFP-tagged Ena/VASP family proteins in the haptotaxis
Supplementary Information
 Supplementary Information Supplementary Figure 1. Effect of mir mimics and anti-mirs on DTPs a, Representative fluorescence microscopy images of GFP vector control or mir mimicexpressing parental and DTP
SUPPLEMENTARY FIGURE LEGENDS. atypical adenomatous hyperplasias (AAH); Grade II: adenomas; Grade III: adenocarcinomas;
; Grade II: adenomas; Grade III: adenocarcinomas;") SUPPLEMENTARY FIGURE LEGENDS Supplementary Figure S1: Tumor grades in Ras G12D ; p53 / lung tumors. Representative histology (H&E) of K-Ras G12D ; p53 / lung tumors 13 weeks after tumor initiation. Grade
SUPPLEMENTARY FIGURE LEGENDS Supplementary Figure S1: Tumor grades in Ras G12D ; p53 / lung tumors. Representative histology (H&E) of K-Ras G12D ; p53 / lung tumors 13 weeks after tumor initiation. Grade
SUPPLEMENTARY INFORMATION
 SUPPLEMENTARY INFORMATION doi:10.1038/nature11429 S1a 6 7 8 9 Nlrc4 allele S1b Nlrc4 +/+ Nlrc4 +/F Nlrc4 F/F 9 Targeting construct 422 bp 273 bp FRT-neo-gb-PGK-FRT 3x.STOP S1c Nlrc4 +/+ Nlrc4 F/F casp1
Supplementary Figure S1. Generation of LSL-EZH2 conditional transgenic mice.
 Downstream Col1A locus S P P P EP Genotyping with P1, P2 frt PGKneopA + frt hygro-pa Targeting vector Genotyping with P3, P4 P1 pcag-flpe P2 P3 P4 frt SApA CAG LSL PGKATG frt hygro-pa C. D. E. ormal KRAS
MicroRNA-31 initiates lung tumorigenesis and promotes mutant KRAS-driven lung cancer
 The Journal of Clinical Investigation Research article MicroRNA-31 initiates lung tumorigenesis and promotes mutant KRAS-driven lung cancer Mick D. Edmonds, 1 Kelli L. Boyd, 1 Tamara Moyo, 2 Ramkrishna
Breeding scheme, transgenes, histological analysis and site distribution of SB-mutagenized osteosarcoma.
 Supplementary Figure 1 Breeding scheme, transgenes, histological analysis and site distribution of SB-mutagenized osteosarcoma. (a) Breeding scheme. R26-LSL-SB11 homozygous mice were bred to Trp53 LSL-R270H/+
SUPPLEMENTARY FIGURES
 SUPPLEMENTARY FIGURES 1 Supplementary Figure 1, Adult hippocampal QNPs and TAPs uniformly express REST a-b) Confocal images of adult hippocampal mouse sections showing GFAP (green), Sox2 (red), and REST
stability and tumor suppression
 Supplementary information The stress kinase MKK7 couples oncogenic stress to p53 stability and tumor suppression Daniel Schramek 1, Athanassios Kotsinas 2, Arabella Meixner 1, Teiji Wada 1, Ulrich Elling
(a) Significant biological processes (upper panel) and disease biomarkers (lower panel)
 Significant biological processes (upper panel) and disease biomarkers (lower panel)") Supplementary Figure 1. Functional enrichment analyses of secretomic proteins. (a) Significant biological processes (upper panel) and disease biomarkers (lower panel) 2 involved by hrab37-mediated secretory
Supplementary Figure 1. Functional enrichment analyses of secretomic proteins. (a) Significant biological processes (upper panel) and disease biomarkers (lower panel) 2 involved by hrab37-mediated secretory
Supplementary Figure 1. IHC and proliferation analysis of pten-deficient mammary tumors
 Wang et al LEGENDS TO SUPPLEMENTARY INFORMATION Supplementary Figure 1. IHC and proliferation analysis of pten-deficient mammary tumors A. Induced expression of estrogen receptor α (ERα) in AME vs PDA
Supplementary Figure 1
 Supplementary Figure 1 Supplementary Figure 1 Schematic depiction of the tandem Fc GDF15. Supplementary Figure 2 Supplementary Figure 2 Gfral mrna levels in the brains of both wild-type and knockout Gfral
Supplemental Information. NRF2 Is a Major Target of ARF. in p53-independent Tumor Suppression
 Molecular Cell, Volume 68 Supplemental Information NRF2 Is a Major Target of ARF in p53-independent Tumor Suppression Delin Chen, Omid Tavana, Bo Chu, Luke Erber, Yue Chen, Richard Baer, and Wei Gu Figure
Supplementary Information Supplementary Fig. 1. Elevated Usp9x in melanoma and NRAS mutant melanoma cells are dependent on NRAS for 3D growth.
 Supplementary Information Supplementary Fig. 1. Elevated Usp9x in melanoma and NRAS mutant melanoma cells are dependent on NRAS for 3D growth. a. Immunoblot for Usp9x protein in NRAS mutant melanoma cells
Kidney. Heart. Lung. Sirt1. Gapdh. Mouse IgG DAPI. Rabbit IgG DAPI
 a e Na V 1.5 Ad-LacZ Ad- 110KD b Scn5a/ (relative to Ad-LacZ) f 150 100 50 0 p = 0.65 Ad-LacZ Ad- c Heart Lung Kidney Spleen 110KD d fl/fl c -/- DAPI 20 µm Na v 1.5 250KD fl/fl Rabbit IgG DAPI fl/fl Mouse
Supplementary Figure 1. HOPX is hypermethylated in NPC. (a) Methylation levels of HOPX in Normal (n = 24) and NPC (n = 24) tissues from the
 Methylation levels of HOPX in Normal (n = 24) and NPC (n = 24) tissues from the") Supplementary Figure 1. HOPX is hypermethylated in NPC. (a) Methylation levels of HOPX in Normal (n = 24) and NPC (n = 24) tissues from the genome-wide methylation microarray data. Mean ± s.d.; Student
Supplementary Figure 1. HOPX is hypermethylated in NPC. (a) Methylation levels of HOPX in Normal (n = 24) and NPC (n = 24) tissues from the genome-wide methylation microarray data. Mean ± s.d.; Student
SUPPLEMENTARY INFORMATION
 DOI: 10.1038/ncb2535 Figure S1 SOX10 is expressed in human giant congenital nevi and its expression in human melanoma samples suggests that SOX10 functions in a MITF-independent manner. a, b, Representative
Supplementary Figure 1. BMS enhances human T cell activation in vitro in a
 Supplementary Figure 1. BMS98662 enhances human T cell activation in vitro in a concentration-dependent manner. Jurkat T cells were activated with anti-cd3 and anti-cd28 antibody in the presence of titrated
mir-509-5p and mir-1243 increase the sensitivity to gemcitabine by inhibiting
 mir-509-5p and mir-1243 increase the sensitivity to gemcitabine by inhibiting epithelial-mesenchymal transition in pancreatic cancer Hidekazu Hiramoto, M.D. 1,3, Tomoki Muramatsu, Ph.D. 1, Daisuke Ichikawa,
Supplementary Figure 1. a. b. Relative cell viability. Nature Genetics: doi: /ng SCR shyap1-1 shyap
 Supplementary Figure 1. a. b. p-value for depletion in vehicle (DMSO) 1e-05 1e-03 1e-01 1 0 1000 2000 3000 4000 5000 Genes log2 normalized shrna counts in T0 0 2 4 6 8 sh1 shluc 0 2 4 6 8 log2 normalized
Nature Biotechnology: doi: /nbt Supplementary Figure 1
 Supplementary Figure 1 Overview of the transplant procedure and supplementary data to Figure 1. a. Under isofluorane anesthesia, the lumen of the colon is washed by a gentle PBS enema. b. Using a p200
Hunk is required for HER2/neu-induced mammary tumorigenesis
 Research article Hunk is required for HER2/neu-induced mammary tumorigenesis Elizabeth S. Yeh, 1 Thomas W. Yang, 1 Jason J. Jung, 1 Heather P. Gardner, 1 Robert D. Cardiff, 2 and Lewis A. Chodosh 1 1 Department
Nature Genetics: doi: /ng Supplementary Figure 1. Details of sequencing analysis.
 Supplementary Figure 1 Details of sequencing analysis. (a) Flow chart showing which patients fall into each category and were used for analysis. (b) Graph showing the average and median coverage for all
BRaf V600E cooperates with Pten silencing to elicit metastatic melanoma (Nature Genetics Supplementary Information)
") BRaf V600E cooperates with Pten silencing to elicit metastatic melanoma (Nature Genetics Supplementary Information) David Dankort, David P. Curley, Robert A. Cartlidge, Betsy Nelson, Anthony N. Karnezis,
BRaf V600E cooperates with Pten silencing to elicit metastatic melanoma (Nature Genetics Supplementary Information) David Dankort, David P. Curley, Robert A. Cartlidge, Betsy Nelson, Anthony N. Karnezis,
1.5 ASK1KO fed. fasted 16 hrs w/o water. Fed. 4th. 4th WT ASK1KO N=29, 11(WT), ,5(ASK1KO) ASK1KO ASK1KO **** Time [h]
![1.5 ASK1KO fed. fasted 16 hrs w/o water. Fed. 4th. 4th WT ASK1KO N=29, 11(WT), ,5(ASK1KO) ASK1KO ASK1KO **** Time [h]](/thumbs/87/97258189.jpg "1.5 ASK1KO fed. fasted 16 hrs w/o water. Fed. 4th. 4th WT ASK1KO N=29, 11(WT), ,5(ASK1KO) ASK1KO ASK1KO **** Time [h]") 7: 13: 19: 1: 7: 151117 a 151117 4th 4th b c RQ.95 KO.9.85.8.75.7 light dark light dark.65 7: 19: 7: 19: 7: Means ± SEM, N=6 RQ 1..9.8.7.6.6 KO CL (-) CL (+) ibat weight ratio (/body weight) [%].5.4.3.2.1
7: 13: 19: 1: 7: 151117 a 151117 4th 4th b c RQ.95 KO.9.85.8.75.7 light dark light dark.65 7: 19: 7: 19: 7: Means ± SEM, N=6 RQ 1..9.8.7.6.6 KO CL (-) CL (+) ibat weight ratio (/body weight) [%].5.4.3.2.1
Supplemental Figure 1. Intracranial transduction of a modified ptomo lentiviral vector in the mouse
 Supplemental figure legends Supplemental Figure 1. Intracranial transduction of a modified ptomo lentiviral vector in the mouse hippocampus targets GFAP-positive but not NeuN-positive cells. (A) Stereotaxic
Supplementary Figure 1: Expression of NFAT proteins in Nfat2-deleted B cells (a+b) Protein expression of NFAT2 (a) and NFAT1 (b) in isolated splenic
 Protein expression of NFAT2 (a) and NFAT1 (b) in isolated splenic") Supplementary Figure 1: Expression of NFAT proteins in Nfat2-deleted B cells (a+b) Protein expression of NFAT2 (a) and NFAT1 (b) in isolated splenic B cells from WT Nfat2 +/+, TCL1 Nfat2 +/+ and TCL1 Nfat2
Supplementary Figure 1: Expression of NFAT proteins in Nfat2-deleted B cells (a+b) Protein expression of NFAT2 (a) and NFAT1 (b) in isolated splenic B cells from WT Nfat2 +/+, TCL1 Nfat2 +/+ and TCL1 Nfat2
Supplementary Figure 1
 Supplementary Figure 1 a γ-h2ax MDC1 RNF8 FK2 BRCA1 U2OS Cells sgrna-1 ** 60 sgrna 40 20 0 % positive Cells (>5 foci per cell) b ** 80 sgrna sgrna γ-h2ax MDC1 γ-h2ax RNF8 FK2 MDC1 BRCA1 RNF8 FK2 BRCA1
Supplementary Figure 1 (Related with Figure 4). Molecular consequences of Eed deletion. (a) ChIP analysis identifies 3925 genes that are associated
. Molecular consequences of Eed deletion. (a) ChIP analysis identifies 3925 genes that are associated") Supplementary Figure 1 (Related with Figure 4). Molecular consequences of Eed deletion. (a) ChIP analysis identifies 3925 genes that are associated with the H3K27me3 mark in chondrocytes (see Table S1,
Supplementary Figure 1 (Related with Figure 4). Molecular consequences of Eed deletion. (a) ChIP analysis identifies 3925 genes that are associated with the H3K27me3 mark in chondrocytes (see Table S1,
Supplementary Figures
 Supplementary Figures Supplementary Figure 1 Characterization of stable expression of GlucB and sshbira in the CT26 cell line (a) Live cell imaging of stable CT26 cells expressing green fluorescent protein
Supplementary Figures
 Supplementary Figures Supplementary Figure 1 Correlation between LKB1 and YAP expression in human lung cancer samples. (a) Representative photos showing LKB1 and YAP immunohistochemical staining in human
Supplementary Figure 1. Basal level EGFR across a panel of ESCC lines. Immunoblots demonstrate the expression of phosphorylated and total EGFR as
 Supplementary Figure 1. Basal level EGFR across a panel of ESCC lines. Immunoblots demonstrate the expression of phosphorylated and total EGFR as well as their downstream effectors across a panel of ESCC
Supplementary Figure 1.TRIM33 binds β-catenin in the nucleus. a & b, Co-IP of endogenous TRIM33 with β-catenin in HT-29 cells (a) and HEK 293T cells
 and HEK 293T cells") Supplementary Figure 1.TRIM33 binds β-catenin in the nucleus. a & b, Co-IP of endogenous TRIM33 with β-catenin in HT-29 cells (a) and HEK 293T cells (b). TRIM33 was immunoprecipitated, and the amount of
Supplementary Figure 1.TRIM33 binds β-catenin in the nucleus. a & b, Co-IP of endogenous TRIM33 with β-catenin in HT-29 cells (a) and HEK 293T cells (b). TRIM33 was immunoprecipitated, and the amount of
Supplementary Table 1. List of primers used in this study
 Supplementary Table 1. List of primers used in this study Gene Forward primer Reverse primer Rat Met 5 -aggtcgcttcatgcaggt-3 5 -tccggagacacaggatgg-3 Rat Runx1 5 -cctccttgaaccactccact-3 5 -ctggatctgcctggcatc-3
File Name: Supplementary Information Description: Supplementary Figures and Supplementary Table. File Name: Peer Review File Description:
 File Name: Supplementary Information Description: Supplementary Figures and Supplementary Table File Name: Peer Review File Description: Supplementary Table 1 Primers and taqman probes used were the following:
a) Primary cultures derived from the pancreas of an 11-week-old Pdx1-Cre; K-MADM-p53
 Primary cultures derived from the pancreas of an 11-week-old Pdx1-Cre; K-MADM-p53") 1 2 3 4 5 6 7 8 9 10 Supplementary Figure 1. Induction of p53 LOH by MADM. a) Primary cultures derived from the pancreas of an 11-week-old Pdx1-Cre; K-MADM-p53 mouse revealed increased p53 KO/KO (green,
1 2 3 4 5 6 7 8 9 10 Supplementary Figure 1. Induction of p53 LOH by MADM. a) Primary cultures derived from the pancreas of an 11-week-old Pdx1-Cre; K-MADM-p53 mouse revealed increased p53 KO/KO (green,
(A) RT-PCR for components of the Shh/Gli pathway in normal fetus cell (MRC-5) and a
 RT-PCR for components of the Shh/Gli pathway in normal fetus cell (MRC-5) and a") Supplementary figure legends Supplementary Figure 1. Expression of Shh signaling components in a panel of gastric cancer. (A) RT-PCR for components of the Shh/Gli pathway in normal fetus cell (MRC-5) and
Supplementary figure legends Supplementary Figure 1. Expression of Shh signaling components in a panel of gastric cancer. (A) RT-PCR for components of the Shh/Gli pathway in normal fetus cell (MRC-5) and
Supplementary Table 1. Characterization of HNSCC PDX models established at MSKCC
 Supplementary Table 1. Characterization of HNSCC PDX models established at MSKCC Supplementary Table 2. Drug content and loading efficiency estimated with F-NMR and UV- Vis Supplementary Table 3. Complete
Nature Neuroscience: doi: /nn Supplementary Figure 1
 Supplementary Figure 1 EGFR inhibition activates signaling pathways (a-b) EGFR inhibition activates signaling pathways (a) U251EGFR cells were treated with erlotinib (1µM) for the indicated times followed
SUPPLEMENTARY INFORMATION
 doi:10.1038/nature12652 Supplementary Figure 1. PRDM16 interacts with endogenous EHMT1 in brown adipocytes. Immunoprecipitation of PRDM16 complex by flag antibody (M2) followed by Western blot analysis
Figure S1, related to Figure 1. Escaper p38a-expressing cancer cells repopulate the tumors (A) Scheme of the mt/mg reporter that expresses a
 Scheme of the mt/mg reporter that expresses a") Cancer Cell, Volume 33 Supplemental Information Targeting p38a Increases DNA Damage, Chromosome Instability, and the Anti-tumoral Response to Taxanes in Breast Cancer Cells Begoña Cánovas, Ana Igea, Alessandro
Cancer Cell, Volume 33 Supplemental Information Targeting p38a Increases DNA Damage, Chromosome Instability, and the Anti-tumoral Response to Taxanes in Breast Cancer Cells Begoña Cánovas, Ana Igea, Alessandro
(A) SW480, DLD1, RKO and HCT116 cells were treated with DMSO or XAV939 (5 µm)
 SW480, DLD1, RKO and HCT116 cells were treated with DMSO or XAV939 (5 µm)") Supplementary Figure Legends Figure S1. Tankyrase inhibition suppresses cell proliferation in an axin/β-catenin independent manner. (A) SW480, DLD1, RKO and HCT116 cells were treated with DMSO or XAV939
Supplementary Figure Legends Figure S1. Tankyrase inhibition suppresses cell proliferation in an axin/β-catenin independent manner. (A) SW480, DLD1, RKO and HCT116 cells were treated with DMSO or XAV939
Supplemental Table 1 Molecular Profile of the SCLC Cell Line Panel
 Supplemental Table 1 Molecular Profile of the SCLC Cell Line Panel p53 RB Myc Cell Line Mutation A Mutation A Amplification B COR-L103 C p.y234c p.d584e L-Myc NCI-H526 p.s33_splice None N-Myc NCI-H1048
Supplementary Materials and Methods
 Supplementary Materials and Methods Hepatocyte toxicity assay. Freshly isolated hepatocytes were incubated for overnight with varying concentrations (-25 µm) of sodium glycochenodeoxycholate (GCDC) or
Nature Genetics: doi: /ng Supplementary Figure 1. HOX fusions enhance self-renewal capacity.
 Supplementary Figure 1 HOX fusions enhance self-renewal capacity. Mouse bone marrow was transduced with a retrovirus carrying one of three HOX fusion genes or the empty mcherry reporter construct as described
Nature Medicine: doi: /nm.4078
 Supplementary Figure 1. Cetuximab induces ER stress response in DiFi cells. (a) Scheme of SILAC proteome. (b) MS-base read out of SILAC experiment. The histogram of log 2 -transformed normalized H/L ratios
SUPPLEMENTARY FIGURES AND TABLE
 SUPPLEMENTARY FIGURES AND TABLE Supplementary Figure S1: Characterization of IRE1α mutants. A. U87-LUC cells were transduced with the lentiviral vector containing the GFP sequence (U87-LUC Tet-ON GFP).
Supplementary methods:
 Supplementary methods: Primers sequences used in real-time PCR analyses: β-actin F: GACCTCTATGCCAACACAGT β-actin [11] R: AGTACTTGCGCTCAGGAGGA MMP13 F: TTCTGGTCTTCTGGCACACGCTTT MMP13 R: CCAAGCTCATGGGCAGCAACAATA
Targeted mass spectrometry (LC/MS/MS) for Olaparib pharmacokinetics. For LC/MS/MS of Olaparib pharmacokinetics metabolites were extracted from
 for Olaparib pharmacokinetics. For LC/MS/MS of Olaparib pharmacokinetics metabolites were extracted from") Supplementary Methods: Targeted mass spectrometry (LC/MS/MS) for Olaparib pharmacokinetics For LC/MS/MS of Olaparib pharmacokinetics metabolites were extracted from mouse tumor samples and analyzed as
Supplementary Methods: Targeted mass spectrometry (LC/MS/MS) for Olaparib pharmacokinetics For LC/MS/MS of Olaparib pharmacokinetics metabolites were extracted from mouse tumor samples and analyzed as
SUPPLEMENTARY FIGURES
 SUPPLEMENTARY FIGURES Figure S1. Clinical significance of ZNF322A overexpression in Caucasian lung cancer patients. (A) Representative immunohistochemistry images of ZNF322A protein expression in tissue
Nature Immunology: doi: /ni Supplementary Figure 1. Huwe1 has high expression in HSCs and is necessary for quiescence.
 Supplementary Figure 1 Huwe1 has high expression in HSCs and is necessary for quiescence. (a) Heat map visualizing expression of genes with a known function in ubiquitin-mediated proteolysis (KEGG: Ubiquitin
Fig. S1. Upregulation of K18 and K14 mrna levels during ectoderm specification of hescs. Quantitative real-time PCR analysis of mrna levels of OCT4
 Fig. S1. Upregulation of K18 and K14 mrna levels during ectoderm specification of hescs. Quantitative real-time PCR analysis of mrna levels of OCT4 (n=3 independent differentiation experiments for each
SUPPLEMENTARY INFORMATION
 DOI:.38/ncb2822 a MTC02 FAO cells EEA1 b +/+ MEFs /DAPI -/- MEFs /DAPI -/- MEFs //DAPI c HEK 293 cells WCE N M C P AKT TBC1D7 Lamin A/C EEA1 VDAC d HeLa cells WCE N M C P AKT Lamin A/C EEA1 VDAC Figure
Nature Structural and Molecular Biology: doi: /nsmb Supplementary Figure 1
 Supplementary Figure 1 Mutational analysis of the SA2-Scc1 interaction in vitro and in human cells. (a) Autoradiograph (top) and Coomassie stained gel (bottom) of 35 S-labeled Myc-SA2 proteins (input)
BCL-W has a fundamental role in B cell survival and lymphomagenesis.
 Thomas Jefferson University Jefferson Digital Commons Department of Cancer Biology Faculty Papers Department of Cancer Biology 2-1-2017 BCL-W has a fundamental role in B cell survival and lymphomagenesis.
Supplementary Figure 1: Tissue of Origin analysis on 152 cell lines. (a) Heatmap representation of the 30 Tissue scores for the 152 cell lines.
 Heatmap representation of the 30 Tissue scores for the 152 cell lines.") Supplementary Figure 1: Tissue of Origin analysis on 152 cell lines. (a) Heatmap representation of the 30 Tissue scores for the 152 cell lines. The scores summarize the global expression of the tissue
Supplementary Figure 1: Tissue of Origin analysis on 152 cell lines. (a) Heatmap representation of the 30 Tissue scores for the 152 cell lines. The scores summarize the global expression of the tissue
Supplementary Materials for
 www.sciencesignaling.org/cgi/content/full/7/322/ra38/dc1 Supplementary Materials for Dynamic Reprogramming of Signaling Upon Met Inhibition Reveals a Mechanism of Drug Resistance in Gastric Cancer Andrea
Supplementary Materials for
 www.sciencesignaling.org/cgi/content/full/7/308/ra4/dc1 Supplementary Materials for Antipsychotics Activate mtorc1-dependent Translation to Enhance Neuronal Morphological Complexity Heather Bowling, Guoan
Supplementary Figure 1: Digitoxin induces apoptosis in primary human melanoma cells but not in normal melanocytes, which express lower levels of the
 Supplementary Figure 1: Digitoxin induces apoptosis in primary human melanoma cells but not in normal melanocytes, which express lower levels of the cardiac glycoside target, ATP1A1. (a) The percentage
Complexity of intra- and inter-pathway loops in colon cancer and melanoma: implications for targeted therapies
 Complexity of intra- and inter-pathway loops in colon cancer and melanoma: implications for targeted therapies René Bernards The Netherlands Cancer Institute Amsterdam The Netherlands Molecular versus
Supplementary Figure 1:
 Supplementary Figure 1: (A) Whole aortic cross-sections stained with Hematoxylin and Eosin (H&E), 7 days after porcine-pancreatic-elastase (PPE)-induced AAA compared to untreated, healthy control aortas
SUPPLEMENTARY FIGURES AND TABLES
 SUPPLEMENTARY FIGURES AND TABLES Supplementary Figure S1: CaSR expression in neuroblastoma models. A. Proteins were isolated from three neuroblastoma cell lines and from the liver metastasis of a MYCN-non
Supplementary Figures
 Supplementary Figures Supplementary Figure 1. Confirmation of Dnmt1 conditional knockout out mice. a, Representative images of sorted stem (Lin - CD49f high CD24 + ), luminal (Lin - CD49f low CD24 + )
Supplementary Fig. 1: ATM is phosphorylated in HER2 breast cancer cell lines. (A) ATM is phosphorylated in SKBR3 cells depending on ATM and HER2
 ATM is phosphorylated in SKBR3 cells depending on ATM and HER2") Supplementary Fig. 1: ATM is phosphorylated in HER2 breast cancer cell lines. (A) ATM is phosphorylated in SKBR3 cells depending on ATM and HER2 activity. Upper panel: Representative histograms for FACS
Supplementary Fig. 1: ATM is phosphorylated in HER2 breast cancer cell lines. (A) ATM is phosphorylated in SKBR3 cells depending on ATM and HER2 activity. Upper panel: Representative histograms for FACS
SHREE ET AL, SUPPLEMENTAL MATERIALS. (A) Workflow for tumor cell line derivation and orthotopic implantation.
 Workflow for tumor cell line derivation and orthotopic implantation.") SHREE ET AL, SUPPLEMENTAL MATERIALS SUPPLEMENTAL FIGURE AND TABLE LEGENDS Supplemental Figure 1. Derivation and characterization of TS1-TGL and TS2-TGL PyMT cell lines and development of an orthotopic
SHREE ET AL, SUPPLEMENTAL MATERIALS SUPPLEMENTAL FIGURE AND TABLE LEGENDS Supplemental Figure 1. Derivation and characterization of TS1-TGL and TS2-TGL PyMT cell lines and development of an orthotopic
SSM signature genes are highly expressed in residual scar tissues after preoperative radiotherapy of rectal cancer.
 Supplementary Figure 1 SSM signature genes are highly expressed in residual scar tissues after preoperative radiotherapy of rectal cancer. Scatter plots comparing expression profiles of matched pretreatment
SOPten flox/flox (KO) Pten flox/flox (WT) flox allele 6.0 kb. Pten. Actin. ! allele 2.3 kb. Supplementary Figure S1. Yanagi, et al.
 Pten flox/flox (WT) flox allele 6.0 kb. Pten. Actin. ! allele 2.3 kb. Supplementary Figure S1. Yanagi, et al.") s1 A Pten flox/flox () SOPten flox/flox () flox allele 6. kb B Pten flox/flox () SOPten flox/flox () Pten Actin! allele 2.3 kb Supplementary Figure S1. Yanagi, et al. A B BrdU BrdU positive cells ( ) 3
s1 A Pten flox/flox () SOPten flox/flox () flox allele 6. kb B Pten flox/flox () SOPten flox/flox () Pten Actin! allele 2.3 kb Supplementary Figure S1. Yanagi, et al. A B BrdU BrdU positive cells ( ) 3
293T cells were transfected with indicated expression vectors and the whole-cell extracts were subjected
 SUPPLEMENTARY INFORMATION Supplementary Figure 1. Formation of a complex between Slo1 and CRL4A CRBN E3 ligase. (a) HEK 293T cells were transfected with indicated expression vectors and the whole-cell
m 6 A mrna methylation regulates AKT activity to promote the proliferation and tumorigenicity of endometrial cancer
 SUPPLEMENTARY INFORMATION Articles https://doi.org/10.1038/s41556-018-0174-4 In the format provided by the authors and unedited. m 6 A mrna methylation regulates AKT activity to promote the proliferation
Bezzi et al., Supplementary Figure 1 *** Nature Medicine: doi: /nm Pten pc-/- ;Zbtb7a pc-/- Pten pc-/- ;Pml pc-/- Pten pc-/- ;Trp53 pc-/-
 Gr-1 Gr-1 Gr-1 Bezzi et al., Supplementary Figure 1 a Gr1-CD11b 3 months Spleen T cells 3 months Spleen B cells 3 months Spleen Macrophages 3 months Spleen 15 4 8 6 c CD11b+/Gr1+ cells [%] 1 5 b T cells
hexahistidine tagged GRP78 devoid of the KDEL motif (GRP78-His) on SDS-PAGE. This
 on SDS-PAGE. This") SUPPLEMENTAL FIGURE LEGEND Fig. S1. Generation and characterization of. (A) Coomassie staining of soluble hexahistidine tagged GRP78 devoid of the KDEL motif (GRP78-His) on SDS-PAGE. This protein was expressed
SUPPLEMENTAL FIGURE LEGEND Fig. S1. Generation and characterization of. (A) Coomassie staining of soluble hexahistidine tagged GRP78 devoid of the KDEL motif (GRP78-His) on SDS-PAGE. This protein was expressed
Supplementary Figure (OH) 22 nanoparticles did not affect cell viability and apoposis. MDA-MB-231, MCF-7, MCF-10A and BT549 cells were
 22 nanoparticles did not affect cell viability and apoposis. MDA-MB-231, MCF-7, MCF-10A and BT549 cells were") Supplementary Figure 1. Gd@C 82 (OH) 22 nanoparticles did not affect cell viability and apoposis. MDA-MB-231, MCF-7, MCF-10A and BT549 cells were treated with PBS, Gd@C 82 (OH) 22, C 60 (OH) 22 or GdCl
Supplementary Figure 1. Gd@C 82 (OH) 22 nanoparticles did not affect cell viability and apoposis. MDA-MB-231, MCF-7, MCF-10A and BT549 cells were treated with PBS, Gd@C 82 (OH) 22, C 60 (OH) 22 or GdCl
Figure S1. Reduction in glomerular mir-146a levels correlate with progression to higher albuminuria in diabetic patients.
 Supplementary Materials Supplementary Figures Figure S1. Reduction in glomerular mir-146a levels correlate with progression to higher albuminuria in diabetic patients. Figure S2. Expression level of podocyte
(A) Dose response curves of HMLE_shGFP (blue circle), HMLE_shEcad (red square),
 Dose response curves of HMLE_shGFP (blue circle), HMLE_shEcad (red square),") Supplementary Figures and Tables Figure S1. Validation of EMT-selective small molecules (A) Dose response curves of HMLE_shGFP (blue circle), HMLE_shEcad (red square), and HMLE_Twist (black diamond) cells
Supplementary Figures and Tables Figure S1. Validation of EMT-selective small molecules (A) Dose response curves of HMLE_shGFP (blue circle), HMLE_shEcad (red square), and HMLE_Twist (black diamond) cells
Supplementary Fig. 1 eif6 +/- mice show a reduction in white adipose tissue, blood lipids and normal glycogen synthesis. The cohort of the original
 Supplementary Fig. 1 eif6 +/- mice show a reduction in white adipose tissue, blood lipids and normal glycogen synthesis. The cohort of the original phenotypic screening was n=40. For specific tests, the
Supplementary Figure S1 Supplementary Figure S2
 Supplementary Figure S A) The blots shown in Figure B were qualified by using Gel-Pro analyzer software (Rockville, MD, USA). The ratio of LC3II/LC3I to actin was then calculated. The data are represented
SUPPLEMENTARY INFORMATION. Supplementary Figures S1-S9. Supplementary Methods
 SUPPLEMENTARY INFORMATION SUMO1 modification of PTEN regulates tumorigenesis by controlling its association with the plasma membrane Jian Huang 1,2#, Jie Yan 1,2#, Jian Zhang 3#, Shiguo Zhu 1, Yanli Wang
Supplementary Information
 Supplementary Information mediates STAT3 activation at retromer-positive structures to promote colitis and colitis-associated carcinogenesis Zhang et al. a b d e g h Rel. Luc. Act. Rel. mrna Rel. mrna
(a) Schematic diagram of the FS mutation of UVRAG in exon 8 containing the highly instable
 Schematic diagram of the FS mutation of UVRAG in exon 8 containing the highly instable") Supplementary Figure 1. Frameshift (FS) mutation in UVRAG. (a) Schematic diagram of the FS mutation of UVRAG in exon 8 containing the highly instable A 10 DNA repeat, generating a premature stop codon
Supplementary Figure 1. Frameshift (FS) mutation in UVRAG. (a) Schematic diagram of the FS mutation of UVRAG in exon 8 containing the highly instable A 10 DNA repeat, generating a premature stop codon
Supplementary Figure 1
 Supplementary Figure 1 14 12 SEM4C PLXN2 8 SEM4C C 3 Cancer Cell Non Cancer Cell Expression 1 8 6 6 4 log2 ratio Expression 2 1 4 2 2 p value.1 D Supplementary Figure 1. Expression of Sema4C and Plexin2
Rescue of mutant rhodopsin traffic by metformin-induced AMPK activation accelerates photoreceptor degeneration Athanasiou et al
 Supplementary Material Rescue of mutant rhodopsin traffic by metformin-induced AMPK activation accelerates photoreceptor degeneration Athanasiou et al Supplementary Figure 1. AICAR improves P23H rod opsin
Supplementary Figures
 Supplementary Figures Supplementary Fig. 1. Galectin-3 is present within tumors. (A) mrna expression levels of Lgals3 (galectin-3) and Lgals8 (galectin-8) in the four classes of cell lines as determined
SUPPLEMENTARY INFORMATION
 DOI:.38/ncb3399 a b c d FSP DAPI 5mm mm 5mm 5mm e Correspond to melanoma in-situ Figure a DCT FSP- f MITF mm mm MlanaA melanoma in-situ DCT 5mm FSP- mm mm mm mm mm g melanoma in-situ MITF MlanaA mm mm
Pathologic Stage. Lymph node Stage
 ASC ASC a c Patient ID BMI Age Gleason score Non-obese PBMC 1 22.1 81 6 (3+3) PBMC 2 21.9 6 6 (3+3) PBMC 3 22 84 8 (4+4) PBMC 4 24.6 68 7 (3+4) PBMC 24. 6 (3+3) PBMC 6 24.7 73 7 (3+4) PBMC 7 23. 67 7 (3+4)