Relative Rates. SUM159 CB- 839-Resistant *** n.s Intracellular % Labeled by U- 13 C-Asn 0.
|
|
|
- Damian Kelly
- 5 years ago
- Views:
Transcription

1 A Relative Growth Rates B Relative Rates LPS2 Parental LPS2 Q-Independent SUM159 Parental SUM159 CB-839-Resistant LPS2 Parental LPS2 Q- Independent SUM159 Parental SUM159 CB- 839-Resistant Glutamine Consumption Glutamate Production C D n.s. n.s. 3.5 Intracellular % Labeled by U- 13 C-Asn LPS2 Parental LPS2 Q-Independent SUM2159PT Parental SUM2159PT CB-839-Resistant Aspartate Malate E Intracellular % Labeled by U- 15 N-Asn * LPS2 Parental LPS2 Q-Independent F Extracellular Aspartate % Change from Blank Medium LPS2 LPS2 SUM159PT SUM159PT Parental Q-Independent Parental CB-839-Resistant ADP ATP -4 **
2 Supplementary Figure 1. Glutamine-independent and CB-839-resistant cells exhibit minimal asparagine metabolism. (a) Relative growth rates of LPS2 parental, LPS2 glutamine (Q)-independent, SUM159PT parental, and SUM159PT CB-839-resistant cells, normalized to the respective parental cell line. (b) Relative glutamine consumption and glutamate production rates for LPS2 parental, LPS2 glutamine (Q)-independent, SUM159PT parental, and SUM159PT CB-839-resistant cells, normalized to the respective parental cell line. (c) Immunoblot showing levels of glutamine synthetase (GS) and tubulin in parental and glutamine-independent LPS2 cells. (d) Percentages of intracellular 13 C-labeled aspartate and malate in LPS2 parental and glutamineindependent as well as SUM159PT parental and CB-839-resistant cells labeled with U- 13 C-asparagine in the medium for 24 hours as determined by LC-MS. (e) Percentages of intracellular 15 N-labeled ADP and ATP in LPS2 parental and glutamine-independent cells labeled with U- 15 N-asparagine in the medium for 24 hours as determined by LC-MS. (f) Changes in extracellular aspartate levels during a 24 hour incubation with the indicated cell line. Values are shown as percent change from aspartate measurements from identical medium incubated on plates lacking cells, with negative bars indicating cellular consumption and positive bars indicating production. Error bars denote standard deviation of the mean (n = 3). P values were calculated by the Student s t-test: *p <.5; **p <.1; p <.1; n.s., not significant.
 Peak area for exported asparagine, glutamine, and glycine following amino acid stimulation of pre-loaded LPS2 cells.")
 Relative intracellular glutamine and asparagine levels as measured by LC-MS in serum- and amino acid-starved LPS2 cells before (- AA) and")
 Changes in extracellular amino acid levels during a 24 hour incubation with HeLa cells.")


3 A B C Supplementary Figure 2. Intracellular asparagine exchanges with extracellular amino acids to promote amino acid uptake. (a) Peak area for exported asparagine, glutamine, and glycine following amino acid stimulation of pre-loaded LPS2 cells. Glycine export was not detected. Cells were pre-loaded with 2 mm asparagine, glutamine, or glycine, respectively. (b) Relative intracellular glutamine and asparagine levels as measured by LC-MS in serum- and amino acid-starved LPS2 cells before (- AA) and after (+ AA) amino acid stimulation for 3 minutes. No Pre indicates lack of glutamine or asparagine pre-load. (c) Changes in extracellular amino acid levels during a 24 hour incubation with HeLa cells. The 24 hour incubation began 48 hours post-doxycycline-induced expression of a scrambled shrna (Scr) or ASNS shrna. Values are shown as percent change from amino acid measurements from identical medium incubated on plates lacking cells, with negative bars indicating cellular consumption and positive bars indicating production. Reduced import of certain amino acids upon asparagine supplementation may indicate competition with asparagine for a common transporter for import. For (a) and (b), error bars denote standard deviation of the mean (n = 3). For (c), error bars denote standard error of the mean (n = 6). P values were calculated by the Student s t-test: *p <.5; **p <.1; p <.1; ns, not significant.


4 Relative mrna Levels A Serine Synthesis Glycine/Folate Metabolism B C ** Ctrl shasns ** ** n.s. ASNS PHGDH PSAT1 PSPH SHMT1 SHMT2 MTHFD2 ATF4 D E
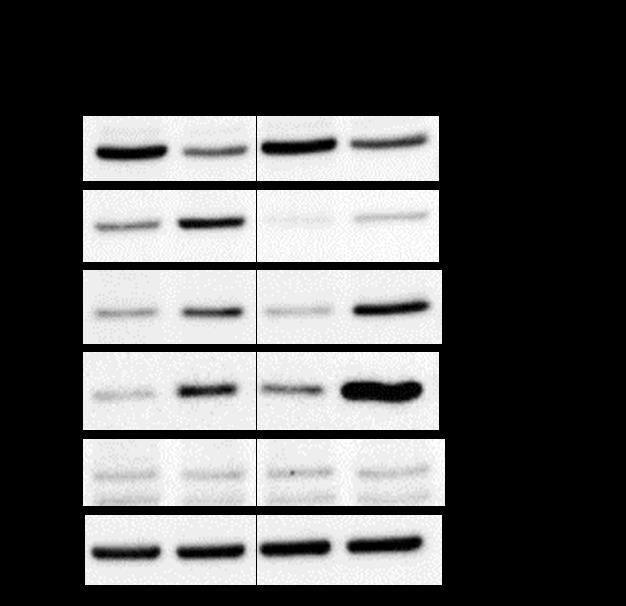
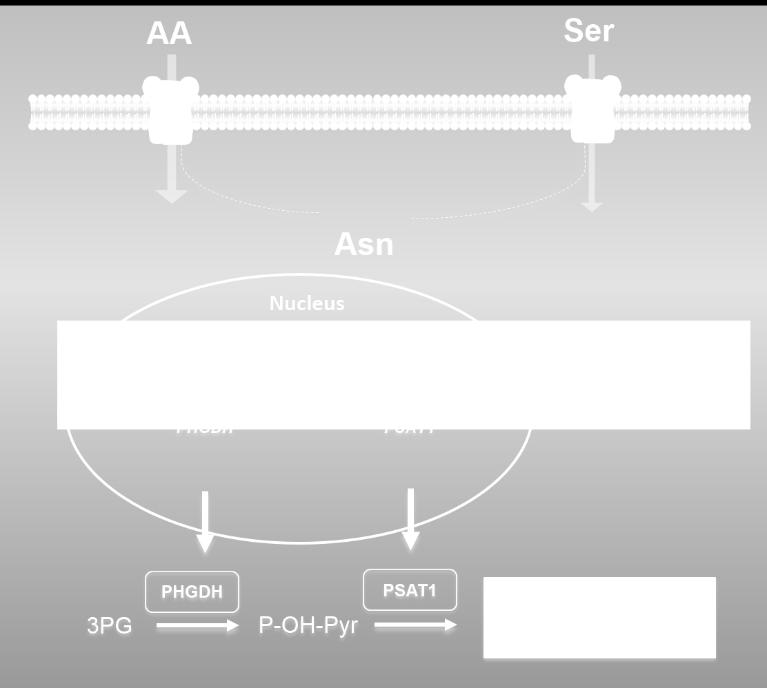
5 Supplementary Figure 3. Intracellular asparagine levels influence serine metabolism. (a) Correlations between ASNS expression and expression of genes involved in serine/glycine metabolism in human tumors. Listed values are Pearson s correlation coefficients between ASNS mrna levels and mrna levels for the listed gene and for the indicated tumor. Blank cells indicate that expression is not substantially correlated with ASNS expression with a Pearson s correlation coefficient greater than.3 or less than -.3. PHGDH, phosphoglycerate dehydrogenase; PSAT1, phosphoserine aminotransferase 1; SHMT1 and SHMT2, serine hydroxymethyltransferase 1 and 2; MTHFD1L, Methylenetetrahydrofolate dehydrogenase 1-like; MTHFD2L, Methylenetetrahydrofolate dehydrogenase 2-like; MTHFD1 and MTFHD2, methylenetetrathydrofolate dehydrogenase 1 and 2; MTHFR, methylenetetrahydrofolate reductase. (b) Immunoblots comparing levels of proteins involved in serine/glycine biosynthesis in HS578T and MDAMB231 cells stably expressing scrambled shrna (Scr) or ASNS shrna (kd). Lysates were generated from cells cultured in DMEM ( mm Asn) and were probed for ASNS, phosphoglycerate dehydrogenase (PHGDH), phosphoserine aminotransferase 1 (PSAT1), phosphoserine phosphatase (PSPH), serine hydroxymethyltransferase 2 (SHMT2), and tubulin. (c) Relative mrna levels of genes involved in serine/glycine metabolism from HeLa cells 48 hours post-doxycycline induction of scrambled shrna or ASNS shrna. Quantitative real-time PCR was performed with primers specific to ASNS, PHGDH, PSAT1, PSPH, SHMT1, SHMT2, methylenetetrahydrofolate dehydrogenase 2 (MTHFD2), and activating transcription factor 4 (ATF4). (d) Percentages of intracellular 13 C-labeled serine and glycine in HeLa cells labeled with U- 13 C- glucose for 24 hours at 24 hours post-induction of scrambled shrna (Scr) or ASNS shrna expression, as determined by LC-MS. Error bars denote standard deviation of the mean (n =3). P values were calculated by the Student s t-test: *p <.5; **p <.1; p <.1. (e) Schematic illustrating ATF4 activation of serine synthesis pathway gene expression and serine synthesis pathway flux in response to low intracellular asparagine levels.


6 A B HeLa A431 C D LPS2 Parental LPS2 Q-Independent E F A431 A431 G H HeLa
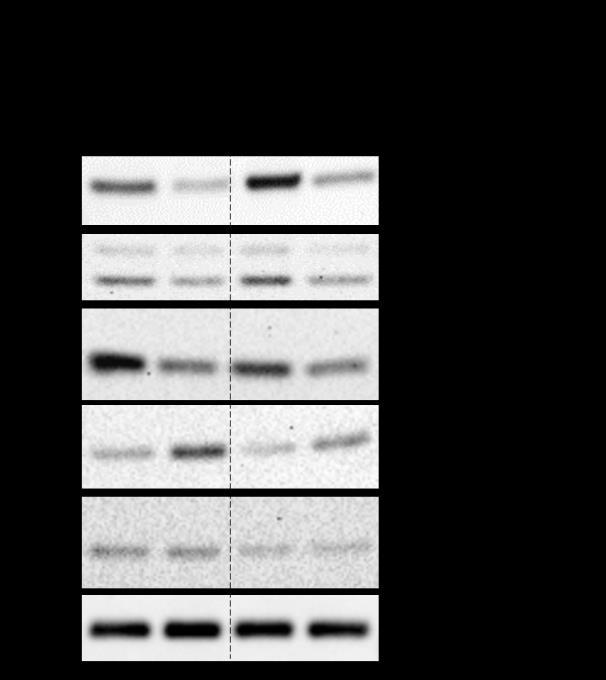
7 Supplementary Figure 4. Intracellular asparagine levels regulate mtorc1 activation. (a,b) Immunoblotting of lysates from starved HeLa and A431 cells pre-loaded with starve medium (No Pre) or asparagine (Pre N) following amino acid stimulation for the indicated times. Lysates were probed for phosphorylation of S6K at T389 and total S6K. (c) Immunoblot showing phosphorylation of S6K (T389) and S6 ribosomal protein (S235/236) following stimulation of starved LPS2 parental cells with amino acids for the indicated times. Starved cells were stimulated with serum-free m-dmem (Complete), serum-free m-dmem lacking glutamine (-Q), serum-free m-dmem lacking asparagine (-N), or left unstimulated (Starve). (d) Immunoblot showing phosphorylation of S6K phosphorylation (T389) and S6 ribosomal protein (S235/236) following stimulation of starved LPS2 glutamine-independent cells with amino acids for the indicated times. Starved cells were stimulated with serum- and glutamine-free m-dmem (Complete), serum- and glutaminefree m-dmem lacking asparagine (-N), serum-free m-dmem lacking asparagine (-N), or left unstimulated (Starve). (e) Immunoblot showing S6K phosphorylation (T389) following starvation of A431 cells of glutamine (- Q) or asparagine (-N) for 6 hours. Prior to starvation, cells were cultured for 7 days in DMEM supplemented with the indicated concentration of asparagine. (f) Immunoblot showing phosphorylation of S6K (T389) in A431 cells stably expressing scrambled shrna or ASNS shrna with and without (Ctl) starvation of glutamine (-Q) or asparagine (-N) for the indicated times. (g) Immunoblot showing ASNS, S6K phosphorylation (T389), S6 phosphorylation (S235/236), AMPKα phosphorylation (T172), and total S6K, S6, and AMPKα in HeLa cells at the indicated times post-doxycycline induction of scrambled shrna (Scr) or ASNS shrna expression. (h) Immunoblot showing ASNS, S6K phosphorylation (T389), S6 phosphorylation (S235/236), AMPKα phosphorylation (T172), and total AMPKα protein levels with or without a 48 hour doxycycline induction of ASNS shrna in HeLa cells stably expressing scrambled or AMPKα shrna.


8 A B C D E
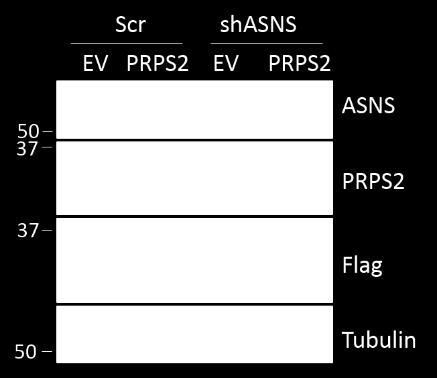
9 Supplementary Figure 5. Intracellular asparagine levels regulate purine and pyrimidine synthesis. (a) Relative PRPS1 and PRPS2 mrna levels from HeLa cells 48 hours post-doxycycline induction of scrambled shrna or ASNS shrna. Quantitative real-time PCR was performed with primers specific to PRPS1 and PRPS2. (b) Relative levels of the indicated intracellular metabolites extracted from HeLa cells 48 hours after doxycycline induction of scrambled shrna (Scr) or ASNS shrna expression as measured by LC-MS. (c) Relative levels of the indicated intracellular metabolites extracted from HeLa cells stably expressing PRPS2 or possessing empty plhcx vector (EV) 72 hours after doxycycline induction of scrambled shrna (Scr) or ASNS shrna expression as measured by LC-MS. (d) Immunoblot confirming PRPS2 expression in HeLa cells indicated in (c). (e) Relative levels of the indicated intracellular metabolites extracted from HeLa cells 48 hours post-doxycycline induction of scrambled shrna or ASNS shrna in the presence of.1 mm asparagine (+ N),.2 mm serine methyl-ester (+ e-ser), or unsupplemented DMEM..Error bars denote standard deviation of the mean (n = 3). P values were calculated by the Student s t-test: *p <.5; **p <.1; n.s., not significant.


10 Fig. 2b Fig. 4d Fig. 4f Fig. 5a Fig. 5b Fig. 5c Fig. 5d Supplementary Figure 6. Uncropped western blot images presented in this manuscript. Labeling above each image indicates the corresponding figure in the main manuscript.


11 Fig. 5e Fig. 5f Fig. 5g Fig. 5h Fig. 5i Fig. 5j Fig. 6a Fig. 6b Fig. 7a Fig. 7b Supplementary Figure 6. Uncropped western blot images presented in this manuscript. Labeling above each image indicates the corresponding figure in the main manuscript.
Supplementary Material. Contents include:
 Supplementary Material Contents include: 1. Supplementary Figures (p. 2-7) 2. Supplementary Figure Legends (p. 8-9) 3. Supplementary Tables (p. 10-12) 4. Supplementary Table Legends (p. 13) 1 Wellen_FigS1
Supplementary Fig. 1 eif6 +/- mice show a reduction in white adipose tissue, blood lipids and normal glycogen synthesis. The cohort of the original
 Supplementary Fig. 1 eif6 +/- mice show a reduction in white adipose tissue, blood lipids and normal glycogen synthesis. The cohort of the original phenotypic screening was n=40. For specific tests, the
Supplementary Figure 1
 Supplementary Figure 1 Constitutive EGFR signaling does not activate canonical EGFR signals (a) U251EGFRInd cells with or without tetracycline exposure (24h, 1µg/ml) were treated with EGF for 15 minutes
Supplementary Figure 1. Procedures for p38 activity imaging in living cells. (a) Schematic model of the p38 activity reporter. The reporter consists
 Schematic model of the p38 activity reporter. The reporter consists") Supplementary Figure 1. Procedures for p38 activity imaging in living cells. (a) Schematic model of the p38 activity reporter. The reporter consists of: (i) the YPet domain (an enhanced YFP); (ii) the
Supplementary Figure 1. Procedures for p38 activity imaging in living cells. (a) Schematic model of the p38 activity reporter. The reporter consists of: (i) the YPet domain (an enhanced YFP); (ii) the
Metabolism of amino acids. Vladimíra Kvasnicová
 Metabolism of amino acids Vladimíra Kvasnicová Classification of proteinogenic AAs -metabolic point of view 1) biosynthesis in a human body nonessential (are synthesized) essential (must be present in
Midterm 2. Low: 14 Mean: 61.3 High: 98. Standard Deviation: 17.7
 Midterm 2 Low: 14 Mean: 61.3 High: 98 Standard Deviation: 17.7 Lecture 17 Amino Acid Metabolism Review of Urea Cycle N and S assimilation Last cofactors: THF and SAM Synthesis of few amino acids Dietary
Nitrogen Metabolism. Overview
 Nitrogen Metabolism Pratt and Cornely Chapter 18 Overview Nitrogen assimilation Amino acid biosynthesis Nonessential aa Essential aa Nucleotide biosynthesis Amino Acid Catabolism Urea Cycle Juicy Steak
p = formed with HCI-001 p = Relative # of blood vessels that formed with HCI-002 Control Bevacizumab + 17AAG Bevacizumab 17AAG
 A.. Relative # of ECs associated with HCI-001 1.4 1.2 1.0 0.8 0.6 0.4 0.2 0.0 ol b p < 0.001 Relative # of blood vessels that formed with HCI-001 1.4 1.2 1.0 0.8 0.6 0.4 0.2 0.0 l b p = 0.002 Control IHC:
SUPPLEMENTARY INFORMATION
 DOI: 10.1038/ncb3076 Supplementary Figure 1 btrcp targets Cep68 for degradation during mitosis. a) Cep68 immunofluorescence in interphase and metaphase. U-2OS cells were transfected with control sirna
Midterm 2 Results. Standard Deviation:
 Midterm 2 Results High: Low: Mean: Standard Deviation: 97.5% 16% 58% 16.3 Lecture 17 Amino Acid Metabolism Urea Cycle N and S assimilation Last cofactors: THF and SAM Dietary (Exogenous) Proteins Hydrolyzed
Lecture 11 - Biosynthesis of Amino Acids
 Lecture 11 - Biosynthesis of Amino Acids Chem 454: Regulatory Mechanisms in Biochemistry University of Wisconsin-Eau Claire 1 Introduction Biosynthetic pathways for amino acids, nucleotides and lipids
Figure 1. Stepwise approach of treating patients with rheumatoid arthritis.
 Establish diagnosis early Document baseline disease activity and damage Estimate prognosis Initiate therapy Begin patient education Start DMARD therapy within 3 months Consider NSAID Consider local or
Nitrogen Metabolism. Pratt and Cornely Chapter 18
 Nitrogen Metabolism Pratt and Cornely Chapter 18 Overview Nitrogen assimilation Amino acid biosynthesis Nonessential aa Essential aa Nucleotide biosynthesis Amino Acid Catabolism Urea Cycle Juicy Steak
J. A. Mayfield et al. FIGURE S1. Methionine Salvage. Methylthioadenosine. Methionine. AdoMet. Folate Biosynthesis. Methylation SAH.
 FIGURE S1 Methionine Salvage Methionine Methylthioadenosine AdoMet Folate Biosynthesis Methylation SAH Homocysteine Homocystine CBS Cystathionine Cysteine Glutathione Figure S1 Biochemical pathway of relevant
Nitrogen Assimilation
 Nitrogen Assimilation 1. Introduction and Overview Importance of nitrogen to plant metabolism: often the limiting nutrient in plants (& agriculture) nitrogen can regulates growth processes, due to integration
Supplementary Information. Induction of p53-independent apoptosis by ectopic expression of HOXA5
 Supplementary Information Induction of p53-independent apoptosis by ectopic expression of in human liposarcomas Dhong Hyun Lee 1, *, Charles Forscher 1, Dolores Di Vizio 2, 3, and H. Phillip Koeffler 1,
Supplementary Materials for
 www.sciencesignaling.org/cgi/content/full/7/308/ra4/dc1 Supplementary Materials for Antipsychotics Activate mtorc1-dependent Translation to Enhance Neuronal Morphological Complexity Heather Bowling, Guoan
Supplementary Figure 1. The CagA-dependent wound healing or transwell migration of gastric cancer cell. AGS cells transfected with vector control or
 Supplementary Figure 1. The CagA-dependent wound healing or transwell migration of gastric cancer cell. AGS cells transfected with vector control or 3xflag-CagA expression vector were wounded using a pipette
Supplementary Figure 1. Characterization of NMuMG-ErbB2 and NIC breast cancer cells expressing shrnas targeting LPP. NMuMG-ErbB2 cells (a) and NIC
 and NIC") Supplementary Figure 1. Characterization of NMuMG-ErbB2 and NIC breast cancer cells expressing shrnas targeting LPP. NMuMG-ErbB2 cells (a) and NIC cells (b) were engineered to stably express either a LucA-shRNA
Supplementary Figure 1. Characterization of NMuMG-ErbB2 and NIC breast cancer cells expressing shrnas targeting LPP. NMuMG-ErbB2 cells (a) and NIC cells (b) were engineered to stably express either a LucA-shRNA
Nitrogen Metabolism. Overview
 Nitrogen Metabolism Pratt and Cornely Chapter 18 Overview Nitrogen assimilation Amino acid biosynthesis Nonessential aa Essential aa Nucleotide biosynthesis Amino Acid Catabolism Urea Cycle Juicy Steak
Supplementary Figure 1.TRIM33 binds β-catenin in the nucleus. a & b, Co-IP of endogenous TRIM33 with β-catenin in HT-29 cells (a) and HEK 293T cells
 and HEK 293T cells") Supplementary Figure 1.TRIM33 binds β-catenin in the nucleus. a & b, Co-IP of endogenous TRIM33 with β-catenin in HT-29 cells (a) and HEK 293T cells (b). TRIM33 was immunoprecipitated, and the amount of
Supplementary Figure 1.TRIM33 binds β-catenin in the nucleus. a & b, Co-IP of endogenous TRIM33 with β-catenin in HT-29 cells (a) and HEK 293T cells (b). TRIM33 was immunoprecipitated, and the amount of
E.coli Core Model: Metabolic Core
 1 E.coli Core Model: Metabolic Core 2 LEARNING OBJECTIVES Each student should be able to: Describe the glycolysis pathway in the core model. Describe the TCA cycle in the core model. Explain gluconeogenesis.
New tools bring greater understanding to cellular metabolism research
 New tools bring greater understanding to cellular metabolism research Mourad Ferhat, Ph.D, 7 Juin 2017 FDSS Users Meeting, Hamamatsu mourad.ferhat@promega.com Today s talk : focus on new cell-based assays
Functional genomics reveal that the serine synthesis pathway is essential in breast cancer
 Functional genomics reveal that the serine synthesis pathway is essential in breast cancer Results Presented by Stacey Lin Lloyd Lab http://www.amsbio.com/expression-ready-lentiviral-particles.aspx Overview
[U- 13 C5] glutamine. Glutamate. Acetyl-coA. Citrate. Citrate. Malate. Malate. Isocitrate OXIDATIVE METABOLISM. Oxaloacetate CO2.
![[U- 13 C5] glutamine. Glutamate. Acetyl-coA. Citrate. Citrate. Malate. Malate. Isocitrate OXIDATIVE METABOLISM. Oxaloacetate CO2.](/thumbs/76/74112154.jpg "[U- 13 C5] glutamine. Glutamate. Acetyl-coA. Citrate. Citrate. Malate. Malate. Isocitrate OXIDATIVE METABOLISM. Oxaloacetate CO2.") Supplementary Figures a. Relative mrna levels Supplementary Figure 1 (Christofk) 3.0 2.5 2.0 1.5 1.0 0.5 0.0 LAT1 Fumarate Succinate Palmitate Acetyl-coA Oxaloacetate OXIDATIVE METABOLISM α-ketoglutarate
Supplementary Figures a. Relative mrna levels Supplementary Figure 1 (Christofk) 3.0 2.5 2.0 1.5 1.0 0.5 0.0 LAT1 Fumarate Succinate Palmitate Acetyl-coA Oxaloacetate OXIDATIVE METABOLISM α-ketoglutarate
Integration of Metabolism
 Integration of Metabolism Metabolism is a continuous process. Thousands of reactions occur simultaneously in order to maintain homeostasis. It ensures a supply of fuel, to tissues at all times, in fed
Normal Skin. Tissue Samples and Melanoma Cell Lines. BRAF Mut. RAS Mut RAS WT /BRAF WT
 Supplemental Figure 1. MERTK gene expression in melanoma cell line panel from Cancer Cell Line Encyclopedia. A. Microarray analysis of melanoma cell lines from UNC collection grouped by oncogenic mutation.
SUPPLEMENTARY FIGURES AND TABLE
 SUPPLEMENTARY FIGURES AND TABLE Supplementary Figure S1: Characterization of IRE1α mutants. A. U87-LUC cells were transduced with the lentiviral vector containing the GFP sequence (U87-LUC Tet-ON GFP).
Supplementary Figure 1. PD-L1 is glycosylated in cancer cells. (a) Western blot analysis of PD-L1 in breast cancer cells. (b) Western blot analysis
 Western blot analysis of PD-L1 in breast cancer cells. (b) Western blot analysis") Supplementary Figure 1. PD-L1 is glycosylated in cancer cells. (a) Western blot analysis of PD-L1 in breast cancer cells. (b) Western blot analysis of PD-L1 in ovarian cancer cells. (c) Western blot analysis
Supplementary Figure 1. PD-L1 is glycosylated in cancer cells. (a) Western blot analysis of PD-L1 in breast cancer cells. (b) Western blot analysis of PD-L1 in ovarian cancer cells. (c) Western blot analysis
Biochemistry: A Short Course
 Tymoczko Berg Stryer Biochemistry: A Short Course Second Edition CHAPTER 31 Amino Acid Synthesis 2013 W. H. Freeman and Company Chapter 31 Outline Although the atmosphere is approximately 80% nitrogen,
Serine Is an Essential Metabolite for Effector T Cell Expansion
 Article Serine Is an Essential Metabolite for Effector T Cell Expansion Graphical Abstract Authors Eric H. Ma, Glenn Bantug, Takla Griss,..., Martin J. Richer, Christoph Hess, Russell G. Jones Correspondence
Supporting Information
 Supporting Information Palmisano et al. 10.1073/pnas.1202174109 Fig. S1. Expression of different transgenes, driven by either viral or human promoters, is up-regulated by amino acid starvation. (A) Quantification
SUPPLEMENTARY INFORMATION
 DOI:.38/ncb2822 a MTC02 FAO cells EEA1 b +/+ MEFs /DAPI -/- MEFs /DAPI -/- MEFs //DAPI c HEK 293 cells WCE N M C P AKT TBC1D7 Lamin A/C EEA1 VDAC d HeLa cells WCE N M C P AKT Lamin A/C EEA1 VDAC Figure
Supplementary Figure 1. Normal T lymphocyte populations in Dapk -/- mice. (a) Normal thymic development in Dapk -/- mice. Thymocytes from WT and Dapk
 Normal thymic development in Dapk -/- mice. Thymocytes from WT and Dapk") Supplementary Figure 1. Normal T lymphocyte populations in Dapk -/- mice. (a) Normal thymic development in Dapk -/- mice. Thymocytes from WT and Dapk -/- mice were stained for expression of CD4 and CD8.
Supplementary Figure 1. Normal T lymphocyte populations in Dapk -/- mice. (a) Normal thymic development in Dapk -/- mice. Thymocytes from WT and Dapk -/- mice were stained for expression of CD4 and CD8.
Supplementary Fig. 1. Delivery of mirnas via Red Fluorescent Protein.
 prfp-vector RFP Exon1 Intron RFP Exon2 prfp-mir-124 mir-93/124 RFP Exon1 Intron RFP Exon2 Untransfected prfp-vector prfp-mir-93 prfp-mir-124 Supplementary Fig. 1. Delivery of mirnas via Red Fluorescent
m 6 A mrna methylation regulates AKT activity to promote the proliferation and tumorigenicity of endometrial cancer
 SUPPLEMENTARY INFORMATION Articles https://doi.org/10.1038/s41556-018-0174-4 In the format provided by the authors and unedited. m 6 A mrna methylation regulates AKT activity to promote the proliferation
Supplemental Information. Increased 4E-BP1 Expression Protects. against Diet-Induced Obesity and Insulin. Resistance in Male Mice
 Cell Reports, Volume 16 Supplemental Information Increased 4E-BP1 Expression Protects against Diet-Induced Obesity and Insulin Resistance in Male Mice Shih-Yin Tsai, Ariana A. Rodriguez, Somasish G. Dastidar,
Pyruvate Alanine 0.15 *** ** ***
 SUPPLEMENTARY FIGURES Glucose ΔµM from fresh media / mg protein -1-2 -3 - -.1 -.3 -.5 Lactate Alanine Formate ΔµM from fresh media / mg protein 5 3 2 1.15.1.5.6..2.. NS-3 WT-NS G93A-NS Supplementary Figure
SUPPLEMENTARY INFORMATION
 doi:10.1038/nature12652 Supplementary Figure 1. PRDM16 interacts with endogenous EHMT1 in brown adipocytes. Immunoprecipitation of PRDM16 complex by flag antibody (M2) followed by Western blot analysis
Amino acid Catabolism
 Enzymatic digestion of dietary proteins in gastrointestinal-tract. Amino acid Catabolism Amino acids: 1. There are 20 different amino acid, they are monomeric constituents of proteins 2. They act as precursors
It is all in the enzymes
 Enzyme regulation 1 It is all in the enzymes Enzymes can enhance the rates of metabolic (or other) reactions by many orders of magnitude. A rate enhancement of 10 17 means that what would occur in 1 second
LPS LPS P6 - + Supplementary Fig. 1.
 P6 LPS - - - + + + - LPS + + - - P6 + Supplementary Fig. 1. Pharmacological inhibition of the JAK/STAT blocks LPS-induced HMGB1 nuclear translocation. RAW 267.4 cells were stimulated with LPS in the absence
Biological systems interact, and these systems and their interactions possess complex properties. STOP at enduring understanding 4A
 Biological systems interact, and these systems and their interactions possess complex properties. STOP at enduring understanding 4A Homework Watch the Bozeman video called, Biological Molecules Objective:
Metabolic requirements for cancer cell proliferation
 Keibler et al. Cancer & Metabolism (2016) 4:16 DOI 10.1186/s40170-016-0156-6 RESEARCH Open Access Metabolic requirements for cancer cell proliferation Mark A. Keibler 1, Thomas M. Wasylenko 1,3, Joanne
Biochemistry and Physiology ID #:
 BM 463 Your Name: Biochemistry and Physiology ID #: Final Exam, December 18, 2002 Prof. Jason Kahn You have 115 minutes for this exam. It is worth 250 points, so you are getting more points per minute
a b c d e C 3 ]Aspartate [ 20 minutes C 3 ]Hexose-P * * *
![a b c d e C 3 ]Aspartate [ 20 minutes C 3 ]Hexose-P * * *](/thumbs/92/110334219.jpg "a b c d e C 3 ]Aspartate [ 20 minutes C 3 ]Hexose-P * * *") Supplemental Figure 1 Metabolic flux with [U- C]Lactate - [ 12 C]Glutamine in primary hepatocytes a b c d e [ C 3 ]Pyruvate [ C 3 ]Malate [ C 3 ]Aspartate [ C 3 ]Citrate [ C 2 ] -Ketoglutarate f g h [
Supplemental Figure 1 Metabolic flux with [U- C]Lactate - [ 12 C]Glutamine in primary hepatocytes a b c d e [ C 3 ]Pyruvate [ C 3 ]Malate [ C 3 ]Aspartate [ C 3 ]Citrate [ C 2 ] -Ketoglutarate f g h [
SUPPLEMENTARY INFORMATION
 DOI: 10.1038/ncb3311 A B TSC2 -/- MEFs C Rapa Hours WCL 0 6 12 24 36 pakt.s473 AKT ps6k S6K CM IGF-1 Recipient WCL - + - + - + pigf-1r IGF-1R pakt ps6 AKT D 1 st SILAC 2 nd SILAC E GAPDH FGF21 ALKPGVIQILGVK
Objective: You will be able to explain how the subcomponents of
 Objective: You will be able to explain how the subcomponents of nucleic acids determine the properties of that polymer. Do Now: Read the first two paragraphs from enduring understanding 4.A Essential knowledge:
Supplementary Figure 1 hlrrk2 promotes CAP dependent protein translation.
 ` Supplementary Figure 1 hlrrk2 promotes CAP dependent protein translation. (a) Overexpression of hlrrk2 in HeLa cells enhances total protein synthesis in [35S] methionine/cysteine incorporation assays.
SUPPLEMENTARY DATA Supplementary Figure 1. Body weight and fat mass of AdicerKO mice.
 SUPPLEMENTARY DATA Supplementary Figure 1. Body weight and fat mass of AdicerKO mice. Twelve week old mice were subjected to ad libitum (AL) or dietary restriction (DR) regimens for three months. (A) Body
MicroRNA sponges: competitive inhibitors of small RNAs in mammalian cells
 MicroRNA sponges: competitive inhibitors of small RNAs in mammalian cells Margaret S Ebert, Joel R Neilson & Phillip A Sharp Supplementary figures and text: Supplementary Figure 1. Effect of sponges on
doi: /nature14508 Rappsilber et al.
 SUPPLEMENTARY INFORMATION doi:1.138/nature1458 Grosso et al. Barbosa et al. 74 72 45 33 47 7 51 Rappsilber et al. Supplementary Figure 1 a, Venn-Diagram of identified splice factors in the work of Barbossa
glucose glucose 6-phospho fructose 6-phosphate fructose 1,6-bisphosphate glyceraldehyde 3-phosphate 1,3-bisphosphoglycerate 3-phosphoglycerate
 Cells glucose glucose glucose 6-phospho glycogen pentose phosphate T 1-phosphate 6-phosphate gluconate CC T CC+PD-1 pathway Isobar: fructose 1,6-diphosphate; glucose 1,6-diphosphate DHAP lactate fructose
Supplementary Figure 1. Establishment of prostacyclin-secreting hmscs. (a) PCR showed the integration of the COX-1-10aa-PGIS transgene into the
 PCR showed the integration of the COX-1-10aa-PGIS transgene into the") Supplementary Figure 1. Establishment of prostacyclin-secreting hmscs. (a) PCR showed the integration of the COX-1-10aa-PGIS transgene into the genomic DNA of hmscs (PGI2- hmscs). Native hmscs and plasmid
Supplementary Figure 1. Establishment of prostacyclin-secreting hmscs. (a) PCR showed the integration of the COX-1-10aa-PGIS transgene into the genomic DNA of hmscs (PGI2- hmscs). Native hmscs and plasmid
A. List of selected proteins with high SILAC (H/L) ratios identified in mass
 ratios identified in mass") Supplementary material Figure S1. Interaction between UBL5 and FANCI A. List of selected proteins with high SILAC (H/L) ratios identified in mass spectrometry (MS)-based analysis of UBL5-interacting proteins,
Supplementary material Figure S1. Interaction between UBL5 and FANCI A. List of selected proteins with high SILAC (H/L) ratios identified in mass spectrometry (MS)-based analysis of UBL5-interacting proteins,
File Name: Supplementary Information Description: Supplementary Figures and Supplementary Tables. File Name: Peer Review File Description:
 File Name: Supplementary Information Description: Supplementary Figures and Supplementary Tables File Name: Peer Review File Description: Primer Name Sequence (5'-3') AT ( C) RT-PCR USP21 F 5'-TTCCCATGGCTCCTTCCACATGAT-3'
EPIGENETIC RE-EXPRESSION OF HIF-2α SUPPRESSES SOFT TISSUE SARCOMA GROWTH
 EPIGENETIC RE-EXPRESSION OF HIF-2α SUPPRESSES SOFT TISSUE SARCOMA GROWTH Supplementary Figure 1. Supplementary Figure 1. Characterization of KP and KPH2 autochthonous UPS tumors. a) Genotyping of KPH2
Lecture 17: Nitrogen metabolism 1. Urea cycle detoxification of NH 3 2. Amino acid degradation
 Lecture 17: Nitrogen metabolism 1. Urea cycle detoxification of NH 3 2. Amino acid degradation Reference material Biochemistry 4 th edition, Mathews, Van Holde, Appling, Anthony Cahill. Pearson ISBN:978
Discussion of Prism modules and predicted interactions (Fig. 4)
") SUPPLEMENTARY NOTES Discussion of Prism modules and predicted interactions (Fig. 4) a. Interactions of the TCA-cycle, respiratory chain, and ATP synthetase with the amino acid biosynthesis modules. Given
SUPPLEMENTARY NOTES Discussion of Prism modules and predicted interactions (Fig. 4) a. Interactions of the TCA-cycle, respiratory chain, and ATP synthetase with the amino acid biosynthesis modules. Given
Biochemistry 423 Final Examination NAME:
 Biochemistry 423 Final Examination NAME: 1 Circle the single BEST answer (3 points each) 1. At equilibrium the free energy of a reaction G A. depends only on the temperature B. is positive C. is 0 D. is
Biochemistry: A Short Course
 Tymoczko Berg Stryer Biochemistry: A Short Course Second Edition CHAPTER 30 Amino Acid Degradation and the Urea Cycle 2013 W. H. Freeman and Company Chapter 30 Outline Amino acids are obtained from the
BIOINFORMATICS. Cambridge, MA USA, 3 Department of Plant Biology, University of Florence, Via La Pira, Florence, Italy,
 BIOINFORMATICS Vol. no. Pages Robust and Pareto-Efficient Enzyme Partitions for the Optimisation of CO Uptake and Nitrogen Consumption in C Photosynthetic Carbon Metabolism Supplementary information G.
Welcome to Class 14! Class 14: Outline and Objectives. Overview of amino acid catabolism! Introductory Biochemistry!
 Welcome to Class 14 Introductory Biochemistry Class 14: Outline and Objectives Amino Acid Catabolism Fates of amino groups transamination urea cycle Fates of carbon skeletons important cofactors metabolic
How to Integrate Cellular Metabolism Assays Into Your Research: Considerations and Challenges
 How to Integrate Cellular Metabolism Assays Into Your Research: Considerations and Challenges Donna Leippe Sr Research Scientist Outline for Today s Webinar Introduction to Cell Metabolism Metabolite Detection
Supplementary Materials for
 www.sciencesignaling.org/cgi/content/full/6/305/ra106/dc1 Supplementary Materials for Controlling Long-Term Signaling: Receptor Dynamics Determine Attenuation and Refractory Behavior of the TGF-β Pathway
SUPPLEMENTARY FIGURES AND TABLES
 SUPPLEMENTARY FIGURES AND TABLES Supplementary Figure S1: CaSR expression in neuroblastoma models. A. Proteins were isolated from three neuroblastoma cell lines and from the liver metastasis of a MYCN-non
METABOLISM OF AMINO ACIDS
 Dr. M. Sasvari METABOLISM OF AMINO AIDS 1. The fate of the amino group OO - 3 N 24 1 Key structure s Glutamine (Gln), 5 Gln Glutamate (Glu), 5 Glu a-keto-glutarate, 5 akg AMIDE N 2 O - O - 2 2 2 3 N 2
SUPPLEMENTARY FIGURES
 SUPPLEMENTARY FIGURES Supplementary Figure 1. (A) Left, western blot analysis of ISGylated proteins in Jurkat T cells treated with 1000U ml -1 IFN for 16h (IFN) or left untreated (CONT); right, western
CH395G FINAL (3 rd ) EXAM Kitto/Hackert - Fall 2003
 EXAM Kitto/Hackert - Fall 2003") CH395G FINAL (3 rd ) EXAM Kitto/Hackert - Fall 2003 1. A cell in an active, catabolic state has a. a high (ATP/ADP) and a high (NADH/NAD + ) ratio b. a high (ATP/ADP) and a low (NADH/NAD + ) ratio c. a
CH395G FINAL (3 rd ) EXAM Kitto/Hackert - Fall 2003 1. A cell in an active, catabolic state has a. a high (ATP/ADP) and a high (NADH/NAD + ) ratio b. a high (ATP/ADP) and a low (NADH/NAD + ) ratio c. a
Signaling in the Nitrogen Assimilation Pathway of Arabidopsis Thaliana
 Biochemistry: Signaling in the Nitrogen Assimilation Pathway of Arabidopsis Thaliana 38 CAMERON E. NIENABER ʻ04 Abstract Long recognized as essential plant nutrients and metabolites, inorganic and organic
Supplementary Figure 1:
 Supplementary Figure 1: (A) Whole aortic cross-sections stained with Hematoxylin and Eosin (H&E), 7 days after porcine-pancreatic-elastase (PPE)-induced AAA compared to untreated, healthy control aortas
Supplementary Information
 Supplementary Information - chimeric fusion transcript in human gastric cancer promotes tumorigenesis through activation of PI3K/AKT signaling Sun Mi Yun, Kwiyeom Yoon, Sunghoon Lee, Eunjeong Kim, Seong-Ho
SYNTHESIS OF NON-ESSENTIAL AMINO ACIDS [LIPPINCOTT S ] Deeba S. Jairajpuri
![SYNTHESIS OF NON-ESSENTIAL AMINO ACIDS [LIPPINCOTT S ] Deeba S. Jairajpuri](/thumbs/80/80689583.jpg "SYNTHESIS OF NON-ESSENTIAL AMINO ACIDS [LIPPINCOTT S ] Deeba S. Jairajpuri") SYNTHESIS OF NON-ESSENTIAL AMINO ACIDS [LIPPINCOTT S 267-274] Deeba S. Jairajpuri TYPES OF AMINO ACIDS Amino acids that cannot be synthesized by the human body and are required to be taken in the diet
SYNTHESIS OF NON-ESSENTIAL AMINO ACIDS [LIPPINCOTT S 267-274] Deeba S. Jairajpuri TYPES OF AMINO ACIDS Amino acids that cannot be synthesized by the human body and are required to be taken in the diet
Supplementary Figure 1
 Supplementary Figure 1 a γ-h2ax MDC1 RNF8 FK2 BRCA1 U2OS Cells sgrna-1 ** 60 sgrna 40 20 0 % positive Cells (>5 foci per cell) b ** 80 sgrna sgrna γ-h2ax MDC1 γ-h2ax RNF8 FK2 MDC1 BRCA1 RNF8 FK2 BRCA1
S1a S1b S1c. S1d. S1f S1g S1h SUPPLEMENTARY FIGURE 1. - si sc Il17rd Il17ra bp. rig/s IL-17RD (ng) -100 IL-17RD
 -100 IL-17RD") SUPPLEMENTARY FIGURE 1 0 20 50 80 100 IL-17RD (ng) S1a S1b S1c IL-17RD β-actin kda S1d - si sc Il17rd Il17ra rig/s15-574 - 458-361 bp S1f S1g S1h S1i S1j Supplementary Figure 1. Knockdown of IL-17RD enhances
SUPPLEMENTARY FIGURE 1 0 20 50 80 100 IL-17RD (ng) S1a S1b S1c IL-17RD β-actin kda S1d - si sc Il17rd Il17ra rig/s15-574 - 458-361 bp S1f S1g S1h S1i S1j Supplementary Figure 1. Knockdown of IL-17RD enhances
Loss of succinate dehydrogenase activity results in dependency on pyruvate carboxylation for cellular anabolism
 Loss of succinate dehydrogenase activity results in dependency on pyruvate carboxylation for cellular anabolism Charlotte Lussey-Lepoutre, Kate ER Hollinshead, Christian Ludwig, Mélanie Menara, Aurélie
Predictive PP1Ca binding region in BIG3 : 1,228 1,232aa (-KAVSF-) HEK293T cells *** *** *** KPL-3C cells - E E2 treatment time (h)
 HEK293T cells *** *** *** KPL-3C cells - E E2 treatment time (h)") Relative expression ERE-luciferase activity activity (pmole/min) activity (pmole/min) activity (pmole/min) activity (pmole/min) MCF-7 KPL-3C ZR--1 BT-474 T47D HCC15 KPL-1 HBC4 activity (pmole/min) a d
Relative expression ERE-luciferase activity activity (pmole/min) activity (pmole/min) activity (pmole/min) activity (pmole/min) MCF-7 KPL-3C ZR--1 BT-474 T47D HCC15 KPL-1 HBC4 activity (pmole/min) a d
a b G75 G60 Sw-2 Sw-1 Supplementary Figure 1. Structure predictions by I-TASSER Server.
 a b G75 2 2 G60 Sw-2 Sw-1 Supplementary Figure 1. Structure predictions by I-TASSER Server. a. Overlay of top 10 models generated by I-TASSER illustrates the potential effect of 7 amino acid insertion
MTC-TT and TPC-1 cell lines were cultured in RPMI medium (Gibco, Breda, The Netherlands)
") Supplemental data Materials and Methods Cell culture MTC-TT and TPC-1 cell lines were cultured in RPMI medium (Gibco, Breda, The Netherlands) supplemented with 15% or 10% (for TPC-1) fetal bovine serum
Supplemental data Materials and Methods Cell culture MTC-TT and TPC-1 cell lines were cultured in RPMI medium (Gibco, Breda, The Netherlands) supplemented with 15% or 10% (for TPC-1) fetal bovine serum
Krebs cycle Energy Petr Tůma Eva Samcová
 Krebs cycle Energy - 215 Petr Tůma Eva Samcová Overview of Citric Acid Cycle Key Concepts The citric acid cycle (Krebs cycle) is a multistep catalytic process that converts acetyl groups derived from carbohydrates,
doi: /nature10642
 doi:10.1038/nature10642 Supplementary Fig. 1. Citric acid cycle (CAC) metabolism in WT 143B and CYTB 143B cells. a, Proliferation of WT 143B and CYTB 143B cells. Doubling times were 28±1 and 33±2 hrs for
Amino Acid Metabolism
 Amino Acid Metabolism Last Week Most of the Animal Kingdom = Lazy - Most higher organisms in the animal kindom don t bother to make all of the amino acids. - Instead, we eat things that make the essential
RAW264.7 cells stably expressing control shrna (Con) or GSK3b-specific shrna (sh-
 or GSK3b-specific shrna (sh-") 1 a b Supplementary Figure 1. Effects of GSK3b knockdown on poly I:C-induced cytokine production. RAW264.7 cells stably expressing control shrna (Con) or GSK3b-specific shrna (sh- GSK3b) were stimulated
1 a b Supplementary Figure 1. Effects of GSK3b knockdown on poly I:C-induced cytokine production. RAW264.7 cells stably expressing control shrna (Con) or GSK3b-specific shrna (sh- GSK3b) were stimulated
Supplementary Figure 1
 A B D Relative TAp73 mrna p73 Supplementary Figure 1 25 2 15 1 5 p63 _-tub. MDA-468 HCC1143 HCC38 SUM149 MDA-468 HCC1143 HCC38 SUM149 HCC-1937 MDA-MB-468 ΔNp63_ TAp73_ TAp73β E C Relative ΔNp63 mrna TAp73
Amino Acid Oxidation and the Urea Cycle
 Amino Acid Oxidation and the Urea Cycle Amino Acids: Final class of biomolecules whose oxidation contributes significantly to the generation of energy Undergo oxidation in three metabolic circumstances
HEK293FT cells were transiently transfected with reporters, N3-ICD construct and
 Supplementary Information Luciferase reporter assay HEK293FT cells were transiently transfected with reporters, N3-ICD construct and increased amounts of wild type or kinase inactive EGFR. Transfections
SUPPLEMENTARY INFORMATION
 doi:10.1038/nature12215 Supplementary Figure 1. The effects of full and dissociated GR agonists in supporting BFU-E self-renewal divisions. BFU-Es were cultured in self-renewal medium with indicated GR
Supplementary Information. Glycogen shortage during fasting triggers liver-brain-adipose. neurocircuitry to facilitate fat utilization
 Supplementary Information Glycogen shortage during fasting triggers liver-brain-adipose neurocircuitry to facilitate fat utilization Supplementary Figure S1. Liver-Brain-Adipose neurocircuitry Starvation
Supplementary material. Supplementary Figure legends
 Supplementary material Supplementary Figure legends Supplementary Figure 1: Senescence-associated proliferation stop in response to oncogenic N-RAS expression Proliferation of NHEM cells without (ctrl.)
Supplementary Figure 1. Supernatants electrophoresis from CD14+ and dendritic cells. Supernatants were resolved by SDS-PAGE and stained with
 Supplementary Figure 1. Supernatants electrophoresis from CD14+ and dendritic cells. Supernatants were resolved by SDS-PAGE and stained with Coomassie brilliant blue. One µg/ml recombinant human (rh) apo-e
Amino Acids. Amino Acids. Fundamentals. While their name implies that amino acids are compounds that contain an NH. 3 and CO NH 3
 Fundamentals While their name implies that amino acids are compounds that contain an 2 group and a 2 group, these groups are actually present as 3 and 2 respectively. They are classified as α, β, γ, etc..
Lecture 29: Membrane Transport and metabolism
 Chem*3560 Lecture 29: Membrane Transport and metabolism Insulin controls glucose uptake Adipose tissue and muscles contain a passive glucose transporter GluT4 which takes up glucose from blood. (This is
Biological oxidation II. The Cytric acid cycle
 Biological oxidation II The Cytric acid cycle Outline The Cytric acid cycle (TCA tricarboxylic acid) Central role of Acetyl-CoA Regulation of the TCA cycle Anaplerotic reactions The Glyoxylate cycle Localization
Supplementary Information. Table of contents
 Supplementary Information Table of contents Fig. S1. Inhibition of specific upstream kinases affects the activity of the analyzed readouts Fig. S2. Down-regulation of INCENP gene induces the formation
Amino acids-incorporated nanoflowers with an
 Amino acids-incorporated nanoflowers with an intrinsic peroxidase-like activity Zhuo-Fu Wu 1,2,+, Zhi Wang 1,+, Ye Zhang 3, Ya-Li Ma 3, Cheng-Yan He 4, Heng Li 1, Lei Chen 1, Qi-Sheng Huo 3, Lei Wang 1,*
NIH Public Access Author Manuscript Science. Author manuscript; available in PMC 2013 September 15.
 NIH Public Access Author Manuscript Published in final edited form as: Science. 2013 March 15; 339(6125): 1323 1328. doi:10.1126/science.1228792. Stimulation of de novo pyrimidine synthesis by growth signaling
Supplementary Materials for
 www.sciencesignaling.org/cgi/content/full/2/1/ra81/dc1 Supplementary Materials for Delivery of MicroRNA-126 by Apoptotic Bodies Induces CXCL12- Dependent Vascular Protection Alma Zernecke,* Kiril Bidzhekov,
Supplementary Information
 Supplementary Information mediates STAT3 activation at retromer-positive structures to promote colitis and colitis-associated carcinogenesis Zhang et al. a b d e g h Rel. Luc. Act. Rel. mrna Rel. mrna
Supplementary Material
 Supplementary Material accompanying the manuscript Interleukin 37 is a fundamental inhibitor of innate immunity Marcel F Nold, Claudia A Nold-Petry, Jarod A Zepp, Brent E Palmer, Philip Bufler & Charles
AMINO ACIDS NON-ESSENTIAL ESSENTIAL
 Edith Frederika Introduction A major component of food is PROTEIN The protein ingested as part of our diet are not the same protein required by the body Only 40 to 50 gr of protein is required by a normal