Involvement of FKBP6 in hepatitis C virus replication
|
|
|
- Julianna Patterson
- 5 years ago
- Views:
Transcription
1 Supplementary Information Involvement of FKBP6 in hepatitis C virus replication Hirotake Kasai 1,*, Kunihiro Kawakami 2,*, Hiromasa Yokoe 3, Kentaro Yoshimura 4, Masanori Matsuda 5, Jun Yasumoto 1, Shinya Maekawa 6, Atsuya Yamashita 1, Tomohisa Tanaka 1, Masanori Ikeda 7, Nobuyuki Kato 7, Toru Okamoto 8, Yoshiharu Matsuura 8, Naoya Sakamoto 9, Nobuyuki Enomoto 6, Sen Takeda 4, Hideki Fujii 5, Masayoshi Tsubuki 3, Masami Kusunoki 2, and Kohji Moriishi 1 1 Department of Microbiology, Faculty of Medicine, University of Yamanashi, Chuo-shi, Yamanashi , Japan 2 Faculty of Life and Environmental Sciences, University of Yamanashi, Kofu-shi, Yamanashi , Japan 3 Institute of Medical Chemistry, Hoshi University, Ebara, Shinagawa-ku, Tokyo , Japan 4 Department of Anatomy and Cell Biology, Division of Medicine, Interdisciplinary Graduate School of Medicine and Engineering, University of Yamanashi, Chuo-shi, Yamanashi , Japan 5 Department of First Surgery, Faculty of Medicine, University of Yamanashi, Chuo-shi, Yamanashi , Japan 6 First Department of Internal Medicine, Faculty of Medicine, University of Yamanashi, Chuoshi, Yamanashi , Japan 7 Department of Tumor Virology, Graduate School of Medicine, Dentistry, and Pharmaceutical Sciences, Okayama University, Okayama, Okayama , Japan 8 Department of Molecular Virology, Research Institute for Microbial Diseases, Osaka University, Suita, Osaka , Japan 9 Department of Gastroenterology and Hepatology, Hokkaido University Graduate School of Medicine, Sapporo, Hokkaido , Japan


!")


2 FKBP8 NS5A IP:anti-FLAG! NS5A FKBP4 FKBP8 FKBP5 IP:anti-FLAG! NS5A IP:anti-HA! FKBP4 FKBP8 FKBP5 β-actin-! (reblotted)! IB:anti-β-actin! IP:anti-HA! Supplementary Figure 1. Original data of Figure 1B.


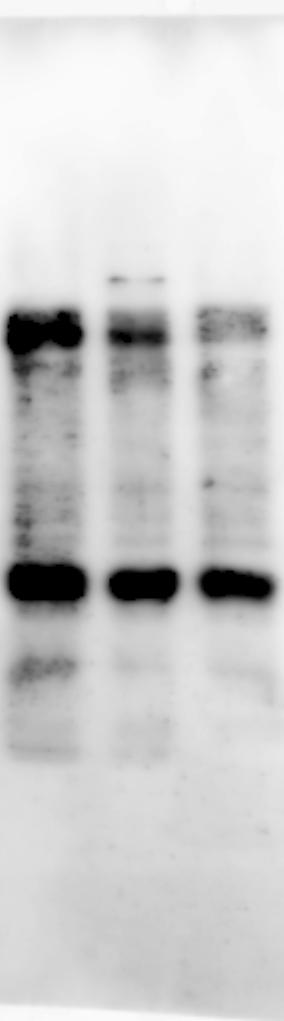
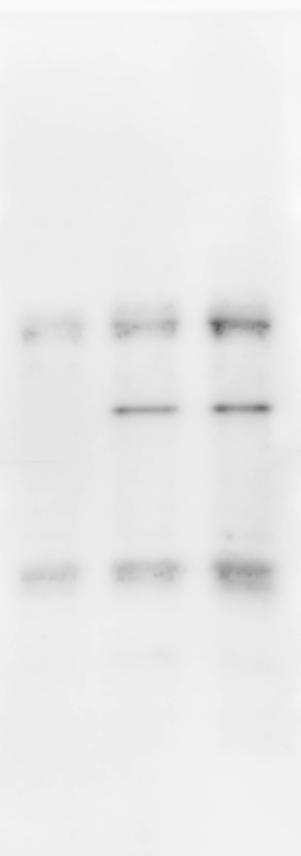
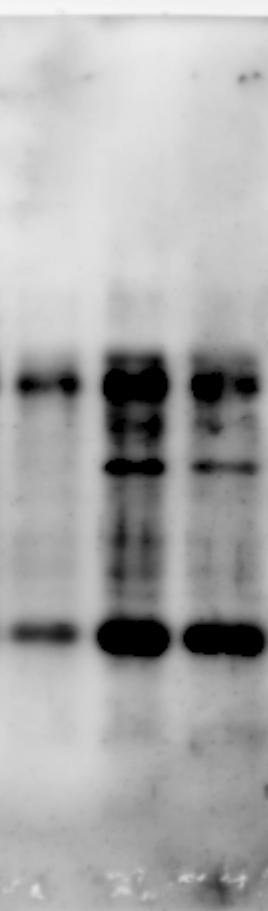
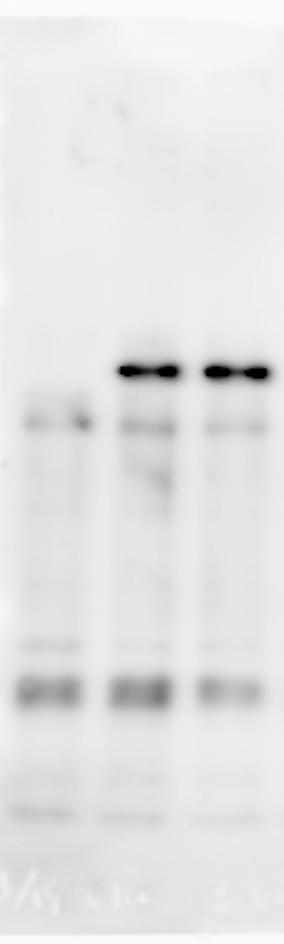
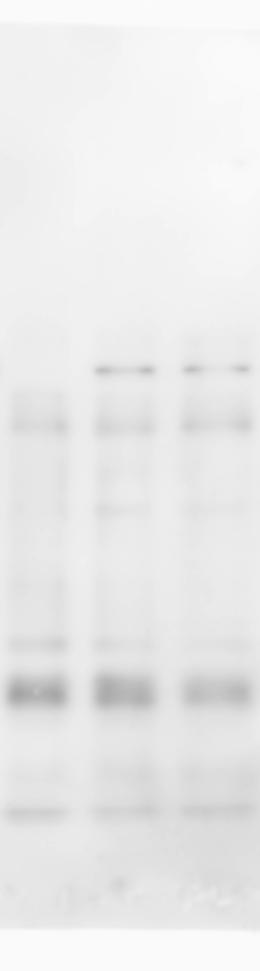
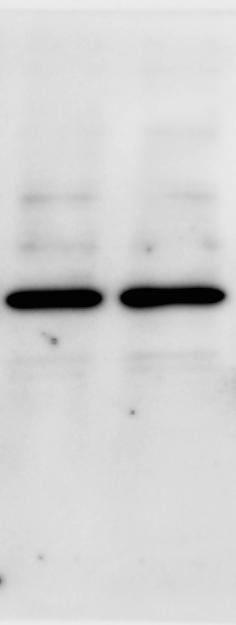
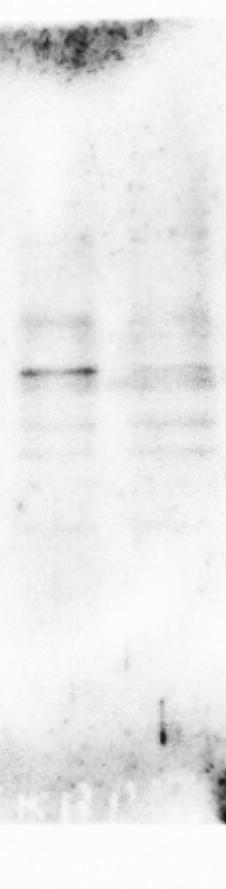
3 NS5A! FKBP8! FKBP5! FKBP6! IP:anti-HA! IP:anti-HA! NS5A! FKBP8! FKBP5! FKBP6! β-actin -! (reblotted)! IB:anti-β-actin! reblotted right panel)! Supplementary Figure 2. Original data of Figure 1C.


4 IB:anti-NS5A - NS5A IB:anti-FKBP6 - FKBP6 Lysate IB:anti-NS5A - NS5A IB:anti-FKBP6 - FKBP6 IB: anti-β-actin - β-actin Supplementary Figure 3. Original data of Figure 1D.


5 FLAG-FKBP6: HA-NS5A125: WT V121A WT V121A FKBP6 NS5A-125 IP:anti-FLAG! IP:anti-FLAG! FLAG-FKBP6: HA-NS5A125: WT V121A WT V121A WT V121A β-actin - (reblotted)" Supplementary Figure 4. Original data of Figure 3A.


6 IP:anti-FLAG IB:anti-HA IP:anti-FLAG IB:anti-FLAG IP:anti-HA IB:antiFLAG IP:anti-HA IB:anti-HA Lysate IB:anti-HA Lysate IB:anti-FLAG Lysate IB: anti-b-actin Supplementary Figure 5. Original data of Figure 3 C.


7 FKBP8 FKBP6 FKBP6 FKBP6 FKBP5 FKBP8 FKBP6 IP: anti-flag! IB: anti-ha! IP: anti-flag! IB: anti-flag! IP: anti-ha! IB: anti-flag! IP: anti-ha! IB: anti-ha! FKBP6 FKBP5 FKBP8 FKBP6 β-actin (reblotted) IB: anti-flag! IB: anti-ha! IB: anti-β-actin! Supplementary Figure 6. Original data of Figure 4A.


8 FLAG-FKBP6: HA-FKBP6: FLAG-FKBP8: HA-FKBP8: DM-CHX: DMSO: - FKBP6 - FKBP8 - FKBP8 IP:anti-FLAG! - FKBP8 - FKBP6 - FKBP6 IP:anti-FLAG! - FKBP8 - FKBP6 - FKBP6 IP:anti-HA! - FKBP6 - FKBP8 - FKBP8 IP:anti-HA! Supplementary Figure 7. Original data of Figure 4D.


9 FKBP8! NS3! NS5B! β-actin! O! FKBP8 -! NS3 -! NS5B -! β-actin -! NS3 -! NS5B -! FKBP8 -! β-actin -! N! Supplementary Figure 8. Original data of Figure 5B.
 20 0 5 10 sifkbp8 (nm) 20 Supplementary Figure 9. Dose dependency of sirna targeting FKBP6 or FKBP8 on HCV replication.")


10 a % of control b ! sifkbp6! sifkbp8! Luciferase activity! Cell viability! ** 2 ** ** ** ** ** 5! 1 2 5! 1 2 sifkbp6 (nm)! sifkbp8 (nm)! FKBP6 1.2! FKBP8 FKBP/GAPDH 0.8! 0.6! 0.4! 0.2! 0.8! 0.6! 0.4! 0.2! sifkbp6 (nm) sifkbp8 (nm) 20 Supplementary Figure 9. Dose dependency of sirna targeting FKBP6 or FKBP8 on HCV replication. a: Effect of FKBP knockdown on HCV replication. Luciferase activity and cell viability were measured in the O replicon cell line transfected with various amounts of sifkbp6 or sifkbp8. The total amount of transfected sirna was adjusted with sicontrol. Transfected cells were harvested at 72 h post-transfection in order to measure luciferase activity and cell viability. The values obtained were standardized with a value of 0 nm (control) and represented as percentages. Asterisks indicate a significant difference from the control value (**: P < 0.01). The data shown in this figure are representative of three independent experiments. b: The amounts of FKBP6 and FKBP8 in knockdwon cells. The amounts of mrnas of FKBP6, FKBP8 and GAPDH were estimated by qrt-pcr.
 and FKBP6-knockout Huh7OK1 cells (FKBP6KO) were infected with HCVcc at an m.o.i. of 0.5 and then harvested 4 days post-infection.")
11 (log 10 )! 1 HCV RNA/GAPDH WT! FKBP6KO! Supplementary Figure 10. Effect of FKBP6 knockout on HCV infection. Huh7OK1 cells (WT) and FKBP6-knockout Huh7OK1 cells (FKBP6KO) were infected with HCVcc at an m.o.i. of 0.5 and then harvested 4 days post-infection. The HCV RNA and GAPDH mrna were estimated by qrt-pcr. The value of HCV RNA was normalized with the value of GAPDH mrna. Asterisks indicate a significant difference of a pair (*: P < 0.05). The data shown in this figure are representative of three independent experiments.

12 % of control Luciferase activity Cell viability 2 sicontrol sicontrol sifkbp6 sifkbp6 sifkbp6+wt sifkbp6+ WT sifkbp6+dtrp sifkbp6 + dtpr Supplementary Figure 11. Expression of FKBP6 lacking TPR domains did not recover HCV replication in FKBP6-knockdown replicon cells. HCV replicon cell lines were transfected with sifkbp6 or sicontrol at a final concentration of 10 nm. The resulting cells were incubated for 16 hours and then transfected with 1 µg of the plasmid encoding HA- FKBP6 (WT) or HA-dTPR3 (dtpr). The transfected cells were incubated for 56 h and then harvested in order to estimate luciferase activity and cell viability.
13 O replicon! N replicon! IB:FKBP6! FKBP6 -! sicontrol sifkbp6 sifkbp8 sifkbp6 +sifkbp8 (kda)! 45 sicontrol sifkbp6 sifkbp8 sifkbp6 +sifkbp8 (kda)! 45 IB:FKBP8! FKBP8 -! IB:β-actin! β-actin -! Supplementary Figure 12. Immunoblotting analysis of FKBP6 and FKBP8 protein in knockdown cells. Immunoblotting data were shown using samples of Figure 5d.

14 FKBP6/GAPDH FKBP6 ** ** mock HCVcc Cured HCV RNA/GAPDH HCV RNA ND! ND! mock! HCVcc! Cured! upplementary Figure 13. Effects of HCV elimination on FKBP6 expression in HCV infected cells. HuhOK1 cells persistently infected with HCV were treated with 1 µm daclatasvir for 3 weeks in order to eliminate HCV. HCV RNA and FKBP6, FKBP8, and GAPDH mrnas in naïve (mock), HCVccinfected cells (HCVcc) and cured cells (Cured) were estimated by qrt-pcr. Asterisks indicate a significant difference from the value of HCVcc (**: P < 0.01). ND means not detected.


. Three aliquots (no.")

.")
15 FKBP8/GAPDH FKBP6/GAPDH HCV RNA/GAPDH 2.5! 2! 1.5! 0.5! 2! 1.5! 0.5! 1.5! 0.5! Donor Donor2! Donor3! * ** 2! 3! * * 2! 1.5! 0.5! 4! 3! * * 2! 3! ** * 2! 2! 3! 2! 3! 1.5! 0.5! 2! 3! 2! 3! 6! 5! 4! 3! 2! 2! 1.5! 0.5! 1.2! 0.8! 0.6! 0.4! 0.2! ** * 2! 3! * 2! 3! 2! 3! Liver sample No.! Supplementary Figure 14. Effect of HCV infection on expression of FKBP6. Human non-cancerous liver tissues were collected from three independent donors (Donor 1, 2 and 3). Three aliquots (no. 1, 2 and 3) were cut from different corresponding positions of a liver sample of each donor. HCV RNA and mrnas of FKBP6, FKBP8, and GAPDH were estimated by qrt-pcr. The values obtained were normalized with GAPDH mrna. Asterisks indicate a significant difference of a pair (*: P < 0.05, **: P < 0.01). The data shown in this figure are representative of three independent experiments.
TRAF6 ubiquitinates TGFβ type I receptor to promote its cleavage and nuclear translocation in cancer
 Supplementary Information TRAF6 ubiquitinates TGFβ type I receptor to promote its cleavage and nuclear translocation in cancer Yabing Mu, Reshma Sundar, Noopur Thakur, Maria Ekman, Shyam Kumar Gudey, Mariya
Supplementary Information
 Supplementary Information An orally available, small-molecule interferon inhibits viral replication Hideyuki Konishi 1, Koichi Okamoto 1, Yusuke Ohmori 1, Hitoshi Yoshino 2, Hiroshi Ohmori 1, Motooki Ashihara
Figure S1. Reduction in glomerular mir-146a levels correlate with progression to higher albuminuria in diabetic patients.
 Supplementary Materials Supplementary Figures Figure S1. Reduction in glomerular mir-146a levels correlate with progression to higher albuminuria in diabetic patients. Figure S2. Expression level of podocyte
Supplementary information. MARCH8 inhibits HIV-1 infection by reducing virion incorporation of envelope glycoproteins
 Supplementary information inhibits HIV-1 infection by reducing virion incorporation of envelope glycoproteins Takuya Tada, Yanzhao Zhang, Takayoshi Koyama, Minoru Tobiume, Yasuko Tsunetsugu-Yokota, Shoji
condition. Left panel, the HCT-116 cells were lysed with RIPA buffer containing 0.1%
 FIGURE LEGENDS Supplementary Fig 1 (A) sumoylation pattern detected under denaturing condition. Left panel, the HCT-116 cells were lysed with RIPA buffer containing 0.1% SDS in the presence and absence
S1a S1b S1c. S1d. S1f S1g S1h SUPPLEMENTARY FIGURE 1. - si sc Il17rd Il17ra bp. rig/s IL-17RD (ng) -100 IL-17RD
 -100 IL-17RD") SUPPLEMENTARY FIGURE 1 0 20 50 80 100 IL-17RD (ng) S1a S1b S1c IL-17RD β-actin kda S1d - si sc Il17rd Il17ra rig/s15-574 - 458-361 bp S1f S1g S1h S1i S1j Supplementary Figure 1. Knockdown of IL-17RD enhances
SUPPLEMENTARY FIGURE 1 0 20 50 80 100 IL-17RD (ng) S1a S1b S1c IL-17RD β-actin kda S1d - si sc Il17rd Il17ra rig/s15-574 - 458-361 bp S1f S1g S1h S1i S1j Supplementary Figure 1. Knockdown of IL-17RD enhances
Supplementary Figure 1. MAT IIα is Acetylated at Lysine 81.
 IP: Flag a Mascot PTM Modified Mass Error Position Gene Names Score Score Sequence m/z [ppm] 81 MAT2A;AMS2;MATA2 35.6 137.28 _AAVDYQK(ac)VVR_ 595.83-2.28 b Pre-immu After-immu Flag- WT K81R WT K81R / Flag
A. List of selected proteins with high SILAC (H/L) ratios identified in mass
 ratios identified in mass") Supplementary material Figure S1. Interaction between UBL5 and FANCI A. List of selected proteins with high SILAC (H/L) ratios identified in mass spectrometry (MS)-based analysis of UBL5-interacting proteins,
Supplementary material Figure S1. Interaction between UBL5 and FANCI A. List of selected proteins with high SILAC (H/L) ratios identified in mass spectrometry (MS)-based analysis of UBL5-interacting proteins,
Supplementary Figure 1. Prevalence of U539C and G540A nucleotide and E172K amino acid substitutions among H9N2 viruses. Full-length H9N2 NS
 Supplementary Figure 1. Prevalence of U539C and G540A nucleotide and E172K amino acid substitutions among H9N2 viruses. Full-length H9N2 NS nucleotide sequences (a, b) or amino acid sequences (c) from
Plasma exposure levels from individual mice 4 hours post IP administration at the
 Supplemental Figure Legends Figure S1. Plasma exposure levels of MKC-3946 in mice. Plasma exposure levels from individual mice 4 hours post IP administration at the indicated dose mg/kg. Data represent
Supplementary Figure 1.TRIM33 binds β-catenin in the nucleus. a & b, Co-IP of endogenous TRIM33 with β-catenin in HT-29 cells (a) and HEK 293T cells
 and HEK 293T cells") Supplementary Figure 1.TRIM33 binds β-catenin in the nucleus. a & b, Co-IP of endogenous TRIM33 with β-catenin in HT-29 cells (a) and HEK 293T cells (b). TRIM33 was immunoprecipitated, and the amount of
Supplementary Figure 1.TRIM33 binds β-catenin in the nucleus. a & b, Co-IP of endogenous TRIM33 with β-catenin in HT-29 cells (a) and HEK 293T cells (b). TRIM33 was immunoprecipitated, and the amount of
Supplementary Figure 1. Normal T lymphocyte populations in Dapk -/- mice. (a) Normal thymic development in Dapk -/- mice. Thymocytes from WT and Dapk
 Normal thymic development in Dapk -/- mice. Thymocytes from WT and Dapk") Supplementary Figure 1. Normal T lymphocyte populations in Dapk -/- mice. (a) Normal thymic development in Dapk -/- mice. Thymocytes from WT and Dapk -/- mice were stained for expression of CD4 and CD8.
Supplementary Figure 1. Normal T lymphocyte populations in Dapk -/- mice. (a) Normal thymic development in Dapk -/- mice. Thymocytes from WT and Dapk -/- mice were stained for expression of CD4 and CD8.
HEK293FT cells were transiently transfected with reporters, N3-ICD construct and
 Supplementary Information Luciferase reporter assay HEK293FT cells were transiently transfected with reporters, N3-ICD construct and increased amounts of wild type or kinase inactive EGFR. Transfections
T H E J O U R N A L O F C E L L B I O L O G Y
 Supplemental material Chairoungdua et al., http://www.jcb.org/cgi/content/full/jcb.201002049/dc1 T H E J O U R N A L O F C E L L B I O L O G Y Figure S1. Expression of CD9 and CD82 inhibits Wnt/ -catenin
Doctoral Degree Program in Marine Biotechnology, College of Marine Sciences, Doctoral Degree Program in Marine Biotechnology, Academia Sinica, Taipei,
 Cyclooxygenase 2 facilitates dengue virus replication and serves as a potential target for developing antiviral agents Chun-Kuang Lin 1,2, Chin-Kai Tseng 3,4, Yu-Hsuan Wu 3,4, Chih-Chuang Liaw 1,5, Chun-
Title: Cytosolic DNA-mediated, STING-dependent pro-inflammatory gene. Fig. S1. STING ligands-mediated signaling response in MEFs. (A) Primary MEFs (1
 Primary MEFs (1") 1 Supporting Information 2 3 4 Title: Cytosolic DNA-mediated, STING-dependent pro-inflammatory gene induction necessitates canonical NF-κB activation through TBK1 5 6 Authors: Abe et al. 7 8 9 Supporting
1 Supporting Information 2 3 4 Title: Cytosolic DNA-mediated, STING-dependent pro-inflammatory gene induction necessitates canonical NF-κB activation through TBK1 5 6 Authors: Abe et al. 7 8 9 Supporting
RAW264.7 cells stably expressing control shrna (Con) or GSK3b-specific shrna (sh-
 or GSK3b-specific shrna (sh-") 1 a b Supplementary Figure 1. Effects of GSK3b knockdown on poly I:C-induced cytokine production. RAW264.7 cells stably expressing control shrna (Con) or GSK3b-specific shrna (sh- GSK3b) were stimulated
1 a b Supplementary Figure 1. Effects of GSK3b knockdown on poly I:C-induced cytokine production. RAW264.7 cells stably expressing control shrna (Con) or GSK3b-specific shrna (sh- GSK3b) were stimulated
Supplementary information
 Supplementary information Exosomes mediate the cell-to-cell transmission of interferon alpha-induced antiviral activity Jianhua Li, Kuancheng Liu, Yang Liu, Yan Xu, Fei Zhang, Huijuan Yang, Jiangxia Liu,
Supplementary information
 Supplementary information Human Cytomegalovirus MicroRNA mir-us4-1 Inhibits CD8 + T Cell Response by Targeting ERAP1 Sungchul Kim, Sanghyun Lee, Jinwook Shin, Youngkyun Kim, Irini Evnouchidou, Donghyun
Tel: ; Fax: ;
 Tel.: +98 216 696 9291; Fax: +98 216 696 9291; E-mail: mrasadeghi@pasteur.ac.ir Tel: +98 916 113 7679; Fax: +98 613 333 6380; E-mail: abakhshi_e@ajums.ac.ir A Soluble Chromatin-bound MOI 0 1 5 0 1 5 HDAC2
Supplementary Fig. 1. GPRC5A post-transcriptionally down-regulates EGFR expression. (a) Plot of the changes in steady state mrna levels versus
 Plot of the changes in steady state mrna levels versus") Supplementary Fig. 1. GPRC5A post-transcriptionally down-regulates EGFR expression. (a) Plot of the changes in steady state mrna levels versus changes in corresponding proteins between wild type and Gprc5a-/-
Supplementary Fig. 1. GPRC5A post-transcriptionally down-regulates EGFR expression. (a) Plot of the changes in steady state mrna levels versus changes in corresponding proteins between wild type and Gprc5a-/-
Supplement Figure S1. Real Time PCR analysis of mrna levels of C/EBPα and PU.1 in wild type (WT) and NQO1-null (NQO1-/-) mice.
 and NQO1-null (NQO1-/-) mice.") competes with 20S proteasome for binding with C/EBP leading to its stabilization and Relative mrna levels Supplement Figure S1. Real Time PCR analysis of mrna levels of C/EBPα and PU.1 in wild type (WT)
competes with 20S proteasome for binding with C/EBP leading to its stabilization and Relative mrna levels Supplement Figure S1. Real Time PCR analysis of mrna levels of C/EBPα and PU.1 in wild type (WT)
p47 negatively regulates IKK activation by inducing the lysosomal degradation of polyubiquitinated NEMO
 Supplementary Information p47 negatively regulates IKK activation by inducing the lysosomal degradation of polyubiquitinated NEMO Yuri Shibata, Masaaki Oyama, Hiroko Kozuka-Hata, Xiao Han, Yuetsu Tanaka,
Mitochondrial impairment triggers cytosolic oxidative stress and cell death following proteasome inhibition
 Supplementary Information Mitochondrial impairment triggers cytosolic oxidative stress and cell death following proteasome inhibition Sunita Maharjan, Masahide Oku, Masashi Tsuda, Jun Hoseki 2 & Yasuyoshi
Supplemental Figure 1
 Supplemental Figure 1 1a 1c PD-1 MFI fold change 6 5 4 3 2 1 IL-1α IL-2 IL-4 IL-6 IL-1 IL-12 IL-13 IL-15 IL-17 IL-18 IL-21 IL-23 IFN-α Mut Human PD-1 promoter SBE-D 5 -GTCTG- -1.2kb SBE-P -CAGAC- -1.kb
Supplementary Figure 1. Repression of hepcidin expression in the liver of mice treated with
 Supplementary Figure 1. Repression of hepcidin expression in the liver of mice treated with DMN Immunohistochemistry for hepcidin and H&E staining (left). qrt-pcr assays for hepcidin in the liver (right).
2.5. AMPK activity
 Supplement Fig. A 3 B phos-ampk 2.5 * Control AICAR AMPK AMPK activity (Absorbance at 45 nm) 2.5.5 Control AICAR Supplement Fig. Effects of AICAR on AMPK activation in macrophages. J774. macrophages were
ACC ELOVL MCAD. CPT1α 1.5 *** 0.5. Reverbα *** *** 0.5. Fasted. Refed
 Supplementary Figure A 8 SREBPc 6 5 FASN ELOVL6.5.5.5 ACC.5.5 CLOCK.5.5 CRY.5.5 PPARα.5.5 ACSL CPTα.5.5.5.5 MCAD.5.5 PEPCK.5.5 G6Pase 5.5.5.5 BMAL.5.5 Reverbα.5.5 Reverbβ.5.5 PER.5.5 PER B Fasted Refed
Ephrin receptor A2 is an epithelial cell receptor for Epstein Barr virus entry
 SUPPLEMENTARY INFORMATION Letters https://doi.org/10.1038/s41564-017-0080-8 In the format provided by the authors and unedited. Ephrin receptor A2 is an epithelial cell receptor for Epstein Barr virus
Supplementary Figure 1
 A B D Relative TAp73 mrna p73 Supplementary Figure 1 25 2 15 1 5 p63 _-tub. MDA-468 HCC1143 HCC38 SUM149 MDA-468 HCC1143 HCC38 SUM149 HCC-1937 MDA-MB-468 ΔNp63_ TAp73_ TAp73β E C Relative ΔNp63 mrna TAp73
Supplementary Information
 Supplementary Information mediates STAT3 activation at retromer-positive structures to promote colitis and colitis-associated carcinogenesis Zhang et al. a b d e g h Rel. Luc. Act. Rel. mrna Rel. mrna
Supplementary Figure 1. PAQR3 knockdown inhibits SREBP-2 processing in CHO-7 cells CHO-7 cells were transfected with control sirna or a sirna
 Supplementary Figure 1. PAQR3 knockdown inhibits SREBP-2 processing in CHO-7 cells CHO-7 cells were transfected with control sirna or a sirna targeted for hamster PAQR3. At 24 h after the transfection,
Supplementary Fig. S1. Schematic diagram of minigenome segments.
 open reading frame 1565 (segment 5) 47 (-) 3 5 (+) 76 101 125 149 173 197 221 246 287 open reading frame 890 (segment 8) 60 (-) 3 5 (+) 172 Supplementary Fig. S1. Schematic diagram of minigenome segments.
ISG15 sirna # Ctrl sirna+ifn+wt. Virus titer (Pfu/ml) hours post infection. d USP18 sirna #2 IFN
 hours post infection. d USP18 sirna #2 IFN") a ISG15 sirna Ctrl #1 #2 ISG15 conjugates IB: ISG15 Virus titer (Pfu/ml) b ISG15 sirna #2 10 7 Ctrl sirna+ifn+wt Ctrl sirna+ifn+67 10 6 ISG15 sirna+ifn+wt ISG15 sirna+ifn+67 10 5 10 4 10 3 Free ISG15 10
a ISG15 sirna Ctrl #1 #2 ISG15 conjugates IB: ISG15 Virus titer (Pfu/ml) b ISG15 sirna #2 10 7 Ctrl sirna+ifn+wt Ctrl sirna+ifn+67 10 6 ISG15 sirna+ifn+wt ISG15 sirna+ifn+67 10 5 10 4 10 3 Free ISG15 10
Dynamic Interaction of Stress Granule, DDX3X and IKK-α Mediates Multiple Functions in
 Dynamic Interaction of Stress Granule, and Mediates Multiple Functions in Hepatitis C Virus Infection Véronique Pène, Qisheng Li#, Catherine Sodroski, Ching-Sheng Hsu, T. Jake Liang# Liver Diseases Branch,
Supplementary Figure 1. Establishment of prostacyclin-secreting hmscs. (a) PCR showed the integration of the COX-1-10aa-PGIS transgene into the
 PCR showed the integration of the COX-1-10aa-PGIS transgene into the") Supplementary Figure 1. Establishment of prostacyclin-secreting hmscs. (a) PCR showed the integration of the COX-1-10aa-PGIS transgene into the genomic DNA of hmscs (PGI2- hmscs). Native hmscs and plasmid
Supplementary Figure 1. Establishment of prostacyclin-secreting hmscs. (a) PCR showed the integration of the COX-1-10aa-PGIS transgene into the genomic DNA of hmscs (PGI2- hmscs). Native hmscs and plasmid
FIG S1 Examination of eif4b expression after virus infection. (A) A549 cells
 A549 cells") Supplementary Figure Legends FIG S1 Examination of expression after virus infection. () 549 cells were infected with herpes simplex virus (HSV) (MOI = 1), and harvested at the indicated times, followed
Supplementary Figure Legends FIG S1 Examination of expression after virus infection. () 549 cells were infected with herpes simplex virus (HSV) (MOI = 1), and harvested at the indicated times, followed
Table S1. Primer sequences used for qrt-pcr. CACCATTGGCAATGAGCGGTTC AGGTCTTTGCGGATGTCCACGT ACTB AAGTCCATGTGCTGGCAGCACT ATCACCACTCCGAAGTCCGTCT LCOR
 Table S1. Primer sequences used for qrt-pcr. ACTB LCOR KLF6 CTBP1 CDKN1A CDH1 ATF3 PLAU MMP9 TFPI2 CACCATTGGCAATGAGCGGTTC AGGTCTTTGCGGATGTCCACGT AAGTCCATGTGCTGGCAGCACT ATCACCACTCCGAAGTCCGTCT CGGCTGCAGGAAAGTTTACA
SUPPLEMENTARY INFORMATION
 doi: 10.1038/nature05732 SUPPLEMENTARY INFORMATION Supplemental Data Supplement Figure Legends Figure S1. RIG-I 2CARD undergo robust ubiquitination a, (top) At 48 h posttransfection with a GST, GST-RIG-I-2CARD
m 6 A mrna methylation regulates AKT activity to promote the proliferation and tumorigenicity of endometrial cancer
 SUPPLEMENTARY INFORMATION Articles https://doi.org/10.1038/s41556-018-0174-4 In the format provided by the authors and unedited. m 6 A mrna methylation regulates AKT activity to promote the proliferation
Title page. Title: MicroRNA-155 Controls Exosome Synthesis and Promotes Gemcitabine Resistance in
 Title page Title: MicroRNA- Controls Synthesis and Promotes Gemcitabine Resistance in Pancreatic Ductal Adenocarcinoma Authors Manabu Mikamori, Daisaku Yamada, Hidetoshi Eguchi, Shinichiro Hasegawa, Tomoya
Supplementary Figure 1. Confocal immunofluorescence showing mitochondrial translocation of Drp1. Cardiomyocytes treated with H 2 O 2 were prestained
 Supplementary Figure 1. Confocal immunofluorescence showing mitochondrial translocation of Drp1. Cardiomyocytes treated with H 2 O 2 were prestained with MitoTracker (red), then were immunostained with
Supplementary Figure S1 Supplementary Figure S2
 Supplementary Figure S A) The blots shown in Figure B were qualified by using Gel-Pro analyzer software (Rockville, MD, USA). The ratio of LC3II/LC3I to actin was then calculated. The data are represented
Supplemental information contains 7 movies and 4 supplemental Figures
 1 2 3 4 5 6 7 8 9 10 11 12 13 14 15 16 17 18 19 20 21 22 23 24 25 26 27 Supplemental information contains 7 movies and 4 supplemental Figures Movies: Movie 1. Single virus tracking of A4-mCherry-WR MV
Elimination of Hepatitis C Virus from Hepatocytes by a Selective Activation of Therapeutic Molecules
 Elimination of Hepatitis C Virus from Hepatocytes by a Selective Activation of Therapeutic Molecules Xiaoyu Wen 1., Takayuki Abe 1., Hiroshi Kukihara 1, Shuhei Taguwa 1, Yoshio Mori 1, Hideki Tani 1, Nobuyuki
Supplementary Figure 1. SC35M polymerase activity in the presence of Bat or SC35M NP encoded from the phw2000 rescue plasmid.
 1 2 3 4 5 6 7 8 9 10 11 12 13 14 15 16 17 18 19 20 21 22 23 24 25 26 27 Supplementary Figure 1. SC35M polymerase activity in the presence of Bat or SC35M NP encoded from the phw2000 rescue plasmid. HEK293T
mir-509-5p and mir-1243 increase the sensitivity to gemcitabine by inhibiting
 mir-509-5p and mir-1243 increase the sensitivity to gemcitabine by inhibiting epithelial-mesenchymal transition in pancreatic cancer Hidekazu Hiramoto, M.D. 1,3, Tomoki Muramatsu, Ph.D. 1, Daisuke Ichikawa,
Nature Genetics: doi: /ng.3731
 Supplementary Figure 1 Circadian profiles of Adarb1 transcript and ADARB1 protein in mouse tissues. (a) Overlap of rhythmic transcripts identified in the previous transcriptome analyses. The mouse liver
SUPPLEMENTARY INFORMATION
 DOI: 10.1038/ncb2566 Figure S1 CDKL5 protein expression pattern and localization in mouse brain. (a) Multiple-tissue western blot from a postnatal day (P) 21 mouse probed with an antibody against CDKL5.
Supplementary Table 1. Metabolic parameters in GFP and OGT-treated mice
 Supplementary Table 1. Metabolic parameters in GFP and OGT-treated mice Fasted Refed GFP OGT GFP OGT Liver G6P (mmol/g) 0.03±0.01 0.04±0.02 0.60±0.04 0.42±0.10 A TGs (mg/g of liver) 20.08±5.17 16.29±0.8
Supplementary Information
 Supplementary Information Supplementary Figure 1. EBV-gB 23-431 mainly exists as trimer in HEK 293FT cells. (a) Western blotting analysis for DSS crosslinked FLAG-gB 23-431. HEK 293FT cells transfected
(a) Significant biological processes (upper panel) and disease biomarkers (lower panel)
 Significant biological processes (upper panel) and disease biomarkers (lower panel)") Supplementary Figure 1. Functional enrichment analyses of secretomic proteins. (a) Significant biological processes (upper panel) and disease biomarkers (lower panel) 2 involved by hrab37-mediated secretory
Supplementary Figure 1. Functional enrichment analyses of secretomic proteins. (a) Significant biological processes (upper panel) and disease biomarkers (lower panel) 2 involved by hrab37-mediated secretory
Pro-apoptotic signalling through Toll-like receptor 3 involves TRIF-dependent
 Pro-apoptotic signalling through Toll-like receptor 3 involves TRIF-dependent activation of caspase-8 and is under the control of inhibitor of apoptosis proteins in melanoma cells Arnim Weber, Zofia Kirejczyk,
Ubiquitination and deubiquitination of NP protein regulates influenza A virus RNA replication
 Manuscript EMBO-2010-74756 Ubiquitination and deubiquitination of NP protein regulates influenza A virus RNA replication Tsai-Ling Liao, Chung-Yi Wu, Wen-Chi Su, King-Song Jeng and Michael Lai Corresponding
supplementary information
 DOI: 1.138/ncb1 Control Atg7 / NAC 1 1 1 1 (mm) Control Atg7 / NAC 1 1 1 1 (mm) Lamin B Gstm1 Figure S1 Neither the translocation of into the nucleus nor the induction of antioxidant proteins in autophagydeficient
Hepatitis C Resistance Associated Variants (RAVs)
") Hepatitis C Resistance Associated Variants (RAVs) Atif Zaman, MD MPH Oregon Health & Science University Professor of Medicine Division of Gastroenterology and Hepatology Nothing to disclose Disclosure
Hepatitis C Resistance Associated Variants (RAVs) Atif Zaman, MD MPH Oregon Health & Science University Professor of Medicine Division of Gastroenterology and Hepatology Nothing to disclose Disclosure
SUPPLEMENTARY INFORMATION
 doi:10.1038/nature12652 Supplementary Figure 1. PRDM16 interacts with endogenous EHMT1 in brown adipocytes. Immunoprecipitation of PRDM16 complex by flag antibody (M2) followed by Western blot analysis
Neocortex Zbtb20 / NFIA / Sox9
 Neocortex / NFIA / Sox9 Supplementary Figure 1. Expression of, NFIA, and Sox9 in the mouse neocortex at. The lower panels are higher magnification views of the oxed area. Arrowheads indicate triple-positive
SUPPLEMENTARY FIGURES
 SUPPLEMENTARY FIGURES Figure S1. Clinical significance of ZNF322A overexpression in Caucasian lung cancer patients. (A) Representative immunohistochemistry images of ZNF322A protein expression in tissue
Supplementary Figure 1: Digitoxin induces apoptosis in primary human melanoma cells but not in normal melanocytes, which express lower levels of the
 Supplementary Figure 1: Digitoxin induces apoptosis in primary human melanoma cells but not in normal melanocytes, which express lower levels of the cardiac glycoside target, ATP1A1. (a) The percentage
MANUSCRIPT TITLE: Protein kinase C δ signaling is required for dietary prebiotic-induced strengthening of intestinal epithelial barrier function
 MANUSCRIPT TITLE: Protein kinase C δ signaling is required for dietary prebiotic-induced strengthening of intestinal epithelial barrier function Authors: Richard Y. Wu 1,2, Majd Abdullah 1, Pekka Määttänen
Supplemental Data. Short Article. ATF4-Mediated Induction of 4E-BP1. Contributes to Pancreatic β Cell Survival. under Endoplasmic Reticulum Stress
 Cell Metabolism, Volume 7 Supplemental Data Short Article ATF4-Mediated Induction of 4E-BP1 Contributes to Pancreatic β Cell Survival under Endoplasmic Reticulum Stress Suguru Yamaguchi, Hisamitsu Ishihara,
Supplementary Information
 Supplementary Information Temozolomide suppresses MYC via activation of TAp63 to inhibit progression of human glioblastoma Tomohiro Yamaki, Yusuke Suenaga, Toshihiko Iuchi, Jennifer Alagu, Atsushi Takatori,
Predictive PP1Ca binding region in BIG3 : 1,228 1,232aa (-KAVSF-) HEK293T cells *** *** *** KPL-3C cells - E E2 treatment time (h)
 HEK293T cells *** *** *** KPL-3C cells - E E2 treatment time (h)") Relative expression ERE-luciferase activity activity (pmole/min) activity (pmole/min) activity (pmole/min) activity (pmole/min) MCF-7 KPL-3C ZR--1 BT-474 T47D HCC15 KPL-1 HBC4 activity (pmole/min) a d
Relative expression ERE-luciferase activity activity (pmole/min) activity (pmole/min) activity (pmole/min) activity (pmole/min) MCF-7 KPL-3C ZR--1 BT-474 T47D HCC15 KPL-1 HBC4 activity (pmole/min) a d
The Alphabet Soup of Viral Hepatitis Testing
 The Alphabet Soup of Viral Hepatitis Testing August 18, 2011 Patricia Slev, PhD, DABCC Medical Director, Serologic Hepatitis and Retrovirus Laboratory, ARUP Laboratories Assistant Professor of Pathology,
Figures S1-S5, Figure Legends, Table S1 List of primers used in the study
 Insulin receptor alternative splicing is regulated by insulin signaling and modulates beta cell survival Pushkar Malakar,4, Lital Chartarifsky,4, Ayat Hija, Gil Leibowitz 3, Benjamin Glaser 3, Yuval Dor,
SUPPLEMENTAL FIGURE LEGENDS
 SUPPLEMENTAL FIGURE LEGENDS Supplemental Figure S1: Endogenous interaction between RNF2 and H2AX: Whole cell extracts from 293T were subjected to immunoprecipitation with anti-rnf2 or anti-γ-h2ax antibodies
Supplementary Figures for
 Supplementary Figures for SOX2 suppresses CDKN1A to sustain growth of lung squamous cell carcinoma Takuya Fukazawa 1, Minzhe Guo 4, 5, Naomasa Ishida 1, Tomoki Yamatsuji 1, Munenori Takaoka 1, Etsuko Yokota
Supplementary Figure 1: Co-localization of reconstituted L-PTC and dendritic cells
 a CD11c Na + K + ATPase Na + K + ATPase CD11c x-y CD11c Na + K + ATPase Na + K + ATPase CD11c x-z c b x-y view BoNT NAPs CD11c BoNT CD11c NAPs BoNT NAPs CD11c 90 x-z view Apical Basolateral Supplementary
Supplementary Figure 1
 Supplementary Figure 1 YAP negatively regulates IFN- signaling. (a) Immunoblot analysis of Yap knockdown efficiency with sh-yap (#1 to #4 independent constructs) in Raw264.7 cells. (b) IFN- -Luc and PRDs
Supplementary Figures
 Supplementary Figures Supplementary Figure 1 Characterization of stable expression of GlucB and sshbira in the CT26 cell line (a) Live cell imaging of stable CT26 cells expressing green fluorescent protein
mtor Inhibition Specifically Sensitizes Colorectal Cancers with KRAS or BRAF Mutations to BCL-2/BCL-
 Supplementary Material for mtor Inhibition Specifically Sensitizes Colorectal Cancers with KRAS or BRAF Mutations to BCL-2/BCL- XL Inhibition by Suppressing MCL-1 Anthony C. Faber 1,2 *, Erin M. Coffee
The Ufm1-activating enzyme Uba5 is indispensable for erythroid differentiation in mice
 Supplementary information The Ufm1-activating enzyme Uba5 is indispensable for erythroid differentiation in mice Kanako Tatsumi 1, 2, Harumi Yamamoto-Mukai 2, Ritsuko Shimizu 3, Satoshi Waguri 4, Yu-Shin
Tbk1-TKO! DN cells (%)! 15! 10!
! 15! 10!") a! T Cells! TKO! B Cells! TKO! b! CD4! 8.9 85.2 3.4 2.88 CD8! Tbk1-TKO! 1.1 84.8 2.51 2.54 c! DN cells (%)! 4 3 2 1 DP cells (%)! 9 8 7 6 CD4 + SP cells (%)! 5 4 3 2 1 5 TKO! TKO! TKO! TKO! 15 1 5 CD8
a! T Cells! TKO! B Cells! TKO! b! CD4! 8.9 85.2 3.4 2.88 CD8! Tbk1-TKO! 1.1 84.8 2.51 2.54 c! DN cells (%)! 4 3 2 1 DP cells (%)! 9 8 7 6 CD4 + SP cells (%)! 5 4 3 2 1 5 TKO! TKO! TKO! TKO! 15 1 5 CD8
(A) RT-PCR for components of the Shh/Gli pathway in normal fetus cell (MRC-5) and a
 RT-PCR for components of the Shh/Gli pathway in normal fetus cell (MRC-5) and a") Supplementary figure legends Supplementary Figure 1. Expression of Shh signaling components in a panel of gastric cancer. (A) RT-PCR for components of the Shh/Gli pathway in normal fetus cell (MRC-5) and
Supplementary figure legends Supplementary Figure 1. Expression of Shh signaling components in a panel of gastric cancer. (A) RT-PCR for components of the Shh/Gli pathway in normal fetus cell (MRC-5) and
Tumor suppressor Spred2 interaction with LC3 promotes autophagosome maturation and induces autophagy-dependent cell death
 www.impactjournals.com/oncotarget/ Oncotarget, Supplementary Materials 2016 Tumor suppressor Spred2 interaction with LC3 promotes autophagosome maturation and induces autophagy-dependent cell death Supplementary
T H E J O U R N A L O F C E L L B I O L O G Y
 Supplemental material Jewell et al., http://www.jcb.org/cgi/content/full/jcb.201007176/dc1 T H E J O U R N A L O F C E L L B I O L O G Y Figure S1. IR Munc18c association is independent of IRS-1. (A and
Stewart et al. CD36 ligands promote sterile inflammation through assembly of a TLR 4 and 6 heterodimer
 NFκB (fold induction) Stewart et al. ligands promote sterile inflammation through assembly of a TLR 4 and 6 heterodimer a. mrna (fold induction) 5 4 3 2 1 LDL oxldl Gro1a MIP-2 RANTES mrna (fold induction)
Virological assessment of patients candidate to DAA
 Virological assessment of patients candidate to DAA Patients characteristics Italian male patient Diagnosis of chronic HCV infection in 1994 Genotype 1b defined in 1998 Non-responder to IFN+RBV He developed
Inhibition of TGFβ enhances chemotherapy action against triple negative breast cancer by abrogation of
 SUPPLEMENTAL DATA Inhibition of TGFβ enhances chemotherapy action against triple negative breast cancer by abrogation of cancer stem cells and interleukin-8 Neil E. Bhola 1, Justin M. Balko 1, Teresa C.
Glecaprevir-Pibrentasvir in HCV GT 1 or 4 & Prior DAA Treatment MAGELLAN-1 (Part 2)
") Phase 3 Treatment-Experienced in HCV GT 1 or 4 & Prior DAA Treatment MAGELLAN-1 (Part 2) in HCV GT 1 or 4 & Prior DAA Treatment MAGELLAN-1 (Part 2): Study Features MAGELLAN-1 (Part 2) Trial Design: Randomized,
Phase 3 Treatment-Experienced in HCV GT 1 or 4 & Prior DAA Treatment MAGELLAN-1 (Part 2) in HCV GT 1 or 4 & Prior DAA Treatment MAGELLAN-1 (Part 2): Study Features MAGELLAN-1 (Part 2) Trial Design: Randomized,
Integrin CD11b negatively regulates TLR-triggered inflammatory responses by. activating Syk and promoting MyD88 and TRIF degradation via cbl-b
 Integrin CD11b negatively regulates TLR-triggered inflammatory responses by activating Syk and promoting MyD88 and TRIF degradation via cbl-b Chaofeng Han, Jing Jin, Sheng Xu, Haibo Liu, Nan Li, and Xuetao
Supplementary Figure 1. Expression of CUGBP1 in non-parenchymal liver cells treated with TGF-β
 Supplementary Figures Supplementary Figure 1. Expression of CUGBP1 in non-parenchymal liver cells treated with TGF-β and LPS. Non-parenchymal liver cells were isolated and treated with or without TGF-β
Received 26 April 2011/Accepted 9 August 2011
 JOURNAL OF VIROLOGY, Nov. 2011, p. 10976 10988 Vol. 85, No. 21 0022-538X/11/$12.00 doi:10.1128/jvi.00846-11 Copyright 2011, American Society for Microbiology. All Rights Reserved. Heterogeneous Nuclear
Hiromichi Dansako 1,2, Daisuke Yamane 1, Christoph Welsch 1, David R. McGivern 1, Fengyu Hu 1, Nobuyuki Kato 2, Stanley M. Lemon 1 * Abstract
 Class A Scavenger Receptor 1 (MSR1) Restricts Hepatitis C Virus Replication by Mediating Toll-like Receptor 3 Recognition of Viral RNAs Produced in Neighboring Cells Hiromichi Dansako 1,2, Daisuke Yamane
CYLD Negatively Regulates Transforming Growth Factor-β Signaling via Deubiquitinating Akt
 Supplementary Information CYLD Negatively Regulates Transforming Growth Factor-β Signaling via Deubiquitinating Akt Jae Hyang Lim, Hirofumi Jono, Kensei Komatsu, Chang-Hoon Woo, Jiyun Lee, Masanori Miyata,
NOTES. Nonhepatic Cell Lines HeLa and 293 Support Efficient Replication of the Hepatitis C Virus Genotype 2a Subgenomic Replicon
 JOURNAL OF VIROLOGY, Jan. 2005, p. 592 596 Vol. 79, No. 1 0022-538X/05/$08.00 0 doi:10.1128/jvi.79.1.592 596.2005 Copyright 2005, American Society for Microbiology. All Rights Reserved. NOTES Nonhepatic
FH- FH+ DM. 52 Volunteers. Oral & IV Glucose Tolerance Test Hyperinsulinemic Euglycemic Clamp in Non-DM Subjects ACADSB MYSM1. Mouse Skeletal Muscle
 A 52 Volunteers B 6 5 4 3 2 FH- FH+ DM 1 Oral & IV Glucose Tolerance Test Hyperinsulinemic Euglycemic Clamp in Non-DM Subjects ZYX EGR2 NR4A1 SRF target TPM1 ACADSB MYSM1 Non SRF target FH- FH+ DM2 C SRF
Correspondence should be addressed to Shilin Li; and Limin Chen; limin chen
 Mediators of Inflammation Volume 25, Article ID 58989, 5 pages http://dx.doi.org/.55/25/58989 Research Article Vitamin D Potentiates the Inhibitory Effect of MicroRNA-3a in Hepatitis C Virus Replication
Activation of Nrf2 by the dengue virus causes an increase in CLEC5A, which enhances TNF-α production by mononuclear phagocytes
 Nrf2 mediates induced CLEC5A and TNFα Activation of Nrf2 by the dengue virus causes an increase in CLEC5A, which enhances TNFα production by mononuclear phagocytes YiLin Cheng 1,2, YeeShin Lin 1,2,3, ChiaLing
supplementary information
 DOI: 10.1038/ncb1875 Figure S1 (a) The 79 surgical specimens from NSCLC patients were analysed by immunohistochemistry with an anti-p53 antibody and control serum (data not shown). The normal bronchi served
Downregulation of the small GTPase SAR1A: a key event underlying alcohol-induced Golgi fragmentation in hepatocytes
 Downregulation of the small GTPase SAR1A: a key event underlying alcohol-induced Golgi fragmentation in hepatocytes Armen Petrosyan 1*, Pi-Wan Cheng 1,3, Dahn L. Clemens 2,3 & Carol A. Casey 2,3 1 Department
Peli1 negatively regulates T-cell activation and prevents autoimmunity
 Peli1 negatively regulates T-cell activation and prevents autoimmunity Mikyoung Chang 1,*, Wei Jin 1,5,*, Jae-Hoon Chang 1, Yi-chuan Xiao 1, George Brittain 1, Jiayi Yu 1, Xiaofei Zhou 1, Yi-Hong Wang
Supplementary Figure 1
 Supplementary Figure 1 14 12 SEM4C PLXN2 8 SEM4C C 3 Cancer Cell Non Cancer Cell Expression 1 8 6 6 4 log2 ratio Expression 2 1 4 2 2 p value.1 D Supplementary Figure 1. Expression of Sema4C and Plexin2
Xiangde Liu, Amy Nelson, Xingqi Wang, MahaFarid, Yoko Gunji, Jun Ikari, ShunIwasawa, HeshamBasma, Carol Feghali-Bostwick, Stephen I.
 Online Data Supplement Vitamin D Modulates PGE 2 Synthesis and Degradation in Human Lung Fibroblasts Xiangde Liu, Amy Nelson, Xingqi Wang, MahaFarid, Yoko Gunji, Jun Ikari, ShunIwasawa, HeshamBasma, Carol
Supplementary Figure 1
 Supplementary Figure 1 a γ-h2ax MDC1 RNF8 FK2 BRCA1 U2OS Cells sgrna-1 ** 60 sgrna 40 20 0 % positive Cells (>5 foci per cell) b ** 80 sgrna sgrna γ-h2ax MDC1 γ-h2ax RNF8 FK2 MDC1 BRCA1 RNF8 FK2 BRCA1
Trim29 gene-targeting strategy. (a) Genotyping of wildtype mice (+/+), Trim29 heterozygous mice (+/ ) and homozygous mice ( / ).
 Genotyping of wildtype mice (+/+), Trim29 heterozygous mice (+/ ) and homozygous mice ( / ).") Supplementary Figure 1 Trim29 gene-targeting strategy. (a) Genotyping of wildtype mice (+/+), Trim29 heterozygous mice (+/ ) and homozygous mice ( / ). (b) Immunoblot analysis of TRIM29 in lung primary
Supplementary Figure 1 Trim29 gene-targeting strategy. (a) Genotyping of wildtype mice (+/+), Trim29 heterozygous mice (+/ ) and homozygous mice ( / ). (b) Immunoblot analysis of TRIM29 in lung primary
Interferon- induction and related signaling pathways in human hepatocyte cell lines
 81 1, *, 2, *, 1, 2, 1, 2, 1, 2 1. /, 200032; 2. ( ), 201508 : ( IFN- ), IFN-, ( HBV), 3 PH5CH8 Huh7 HepG2, IFN- ( NDV) - poly( I C), IFN-, Huh7 HepG2, PH5CH8 NDV poly( I C) IFN- 3 IFN-,, PH5CH8, Huh7
Supplementary Information
 Supplementary Information Supplementary Figure 1. Effect of mir mimics and anti-mirs on DTPs a, Representative fluorescence microscopy images of GFP vector control or mir mimicexpressing parental and DTP
SUPPLEMENTARY FIGURES AND TABLE
 SUPPLEMENTARY FIGURES AND TABLE Supplementary Figure S1: Characterization of IRE1α mutants. A. U87-LUC cells were transduced with the lentiviral vector containing the GFP sequence (U87-LUC Tet-ON GFP).