Neocortex Zbtb20 / NFIA / Sox9
|
|
|
- Candice McGee
- 5 years ago
- Views:
Transcription


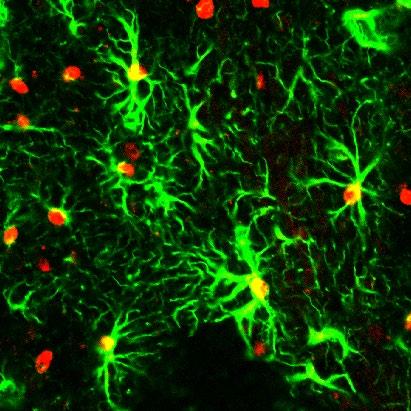
1 Neocortex / NFIA / Sox9 Supplementary Figure 1. Expression of, NFIA, and Sox9 in the mouse neocortex at. The lower panels are higher magnification views of the oxed area. Arrowheads indicate triple-positive cells. Scale ars, 5 and 25 μm in the main panel and higher magnification images, respectively. 5 μm


 Coexpression of and either S1β")


 or for oth GFP and")


2 Forerain Higher-magnification Forerain Higher-magnification / S1β Sep Sep / FoxJ1 Sep Sep c GFP / FoxJ1 / Hoechst Sep GFP / FoxJ1 / Hoechst Sep Supplementary Figure 2. Expression of in ependymal cells. (a) Coexpression of and either S1β or FoxJ1 in the and adult forerain. Right panels of each pair are higher magnification views of the oxed areas. (, c) Expression plasmids for GFP alone (control) or for oth GFP and were injected into the lateral ventricle of the E15.5 mouse forerain in utero and were introduced into the dorsolateral region of the neocortex () and the medial dorsoventral oundary of rains (c) y electroporation. The rain was isolated at and sujected to immunostaining for FoxJ1 and GFP., lateral ventricle; Sep, septum. Arrowheads indicate doule-positive cells (a, c). Scale ars, 5 μm (a, c), 1 μm (), and 25 μm (higher magnification images in a).


3 Neocortex Neocortex / HuC/D P3 / NeuN a / NeuN / NeuN Supplementary Figure 3. Transient expression of in NeuN+ neurons and HuC/D+ immature neurons. (a) Coexpression of and NeuN in the P3,, and adult neocortex. () Coexpression of and HuC/D in the neocortex. Arrowheads indicate doule-positive cells. Scale ars, 5 μm.


 NPCs derived from E16.")
 or oth GFP and.")


 or cleaved caspase 3 + (e) cells")
4 GFP / Sox9 GFP / GFAP GFP / TuJ TuJ1 GFAP O4 Sox9 c d e GFP / EdU GFP / cl-casp3 EdU + cells among GFP + cells (%) NS cl-casp3 + cells among GFP + cells (%) NS Supplementary Figure 4. Effects of on the proliferation, survival, and differentiation of NPCs in vitro. (a, ) NPCs derived from E16.5 mouse forerain were infected with retroviruses encoding GFP alone (control) or oth GFP and. Two days after infection, the cells were induced to differentiate for 6 days and then stained for TuJ1, GFAP, O4, Sox9, and GFP (a). Arrows indicate marker + /GFP + cells. The percentages of marker + cells among total GFP + cells were determined as means ± s.d. (n = 3) (). (c e) E16.5 NPCs infected with control or retroviruses were laeled with EdU for 2 h in the presence of FGF2 and EGF. The cells were stained for EdU and cleaved caspase 3 (cl-casp3) 1 day after plating (c). Arrows indicate EdU + /GFP + cells or cleaved caspase 3 + /GFP + cells. The percentages of EdU + (d) or cleaved caspase 3 + (e) cells among GFP + cells were determined as means ± s.d. (n = 3). P <.1 versus the corresponding control value; NS, non-significant; P =.45 (d) and.53 (e) versus corresponding control value. Scale ars, 5 μm.
 sh- #1 i 14 8 6 4 2 N NA A NS 8 6 4 2 N NS NO O 8 6 4 2 A AO O Cell numer / clone 12 1 8 6 4 2 NS sh- (sh-luc) #1 Supplementary Figure 5.")
 The control, -overexpressing or knockdown cells were plated at a clonal density and cultured with FGF2 for 3 days and without FGF2 for 4 days.")
 which contain GFAP + cells and do not contain TuJ1 + cells among total clones were quantified (, f).")
5 GFP / TuJ1 / GFAP GFP / GalC / TuJ1 GFP / GalC / GFAP NA NO AO N NA A c N NO O d A AO O e Cell numer / clone NS f 1 (sh-luc) sh- #1 g 1 (sh-luc) sh- #1 h 1 (sh-luc) sh- #1 i N NA A NS N NS NO O A AO O Cell numer / clone NS sh- (sh-luc) #1 Supplementary Figure 5. Clonal analysis of -overexpressing and knockdown cells. (a i) The control, -overexpressing or knockdown cells were plated at a clonal density and cultured with FGF2 for 3 days and without FGF2 for 4 days. The percentages of neuron clones (N) which contain TuJ1 + cells and do not contain GFAP + cells, neuron and astrocyte clones (NA) which contain oth TuJ1 + cells and GFAP + cells, or astrocyte clones (A) which contain GFAP + cells and do not contain TuJ1 + cells among total clones were quantified (, f). The percentages of neuron clones (N) which contain TuJ1 + cells and do not contain GalC + cells, neuron and oligodendrocyte clones (NO) which contain oth TuJ1 + cells and GalC + cells, or oligodendrocyte clones (O) which contain GalC + cells and do not contain TuJ1 + cells among total clones were quantified (c, g). The percentages of astrocyte clones (A) which contain GFAP + cells and do not contain GalC + cells, astrocyte and oligodendrocyte clones (AO) which contain oth GFAP + cells and GalC + cells, or oligodendrocyte clones (O) which contain GalC + cells and do not contain GFAP + cells among total clones were quantified (d, h). The cell numer per clone was also determined (e, i). Data are means ± s.d. (n = 3). P <.1, P <.5 versus corresponding control value; NS, non-significant; P =.92 (e),.19 (f),.15 (g) and.75 (i) versus corresponding control value. Scale ar, 5 μm.


6 VZ/SVZ GFP / Hoechst VZ/SVZ Forerain E18.5 GFP / Hoechst VZ/SVZ Supplementary Figure 6. The distriution pattern of -overexpressing cells around the VZ/SVZ and in the neocortex. (a, ) Expression plasmids for GFP alone (control) or for oth GFP and were injected into the lateral ventricle of E15.5 mouse forerain in utero and were introduced into the dorsolateral region of the neocortex y electroporation. The rains were isolated at (a) or E18.5 () and sujected to immunostaining for GFP., lateral ventricle; SVZ, suventricular zone; VZ, ventricular zone. Scale ars, 75 μm (a) and 1 μm ().
7 TuJ1 # E11.5 NPC culture GFAP + sh-sox9 #1 # O TuJ1 # E11.5 NPC culture GFAP + sh-nfia #1 # O4 # Supplementary Figure 7. Effects of knockdown of Sox9 or NFIA on the promotion of astrocyte differentiation y. (a, ) E11.5 NPCs were infected with control,, or plus either sh-sox9 #1 (a) or sh-nfia #1 () retroviruses, cultured without FGF2 and EGF for 6 days, and sujected to immunostaining for TuJ1, GFAP, O4, and GFP. The percentages of marker + cells among total GFP + cells were determined as means ± s.d. (n = 3). P <.1 versus corresponding control value; #P <.1 versus value for alone.
8 TuJ1 GFAP NICD CNTF NICD + CNTF NICD + sh- #1 NICD + CNTF + sh- #1 Supplementary Figure 8. Effect of knockdown on astrocyte differentiation induced y NICD and CNTF. E16.5 NPCs were infected with control, NICD, or NICD plus sh- #1 retroviruses, cultured without or with CNTF for 6 days, and then stained for TuJ1, GFAP, and GFP for determination of the percentages of marker + cells among total GFP + cells (means ± s.d., n = 3). P <.1 versus corresponding control value.
9 4. E11.5 NPC culture GFAP promoter-luc Luciferase activity (fold) STAT3-C (μg) Supplementary Figure 9. Effect of on the activity of the Gfap promoter. Luciferase reporter assay of relative Gfap promoter activity in NPCs transfected with the indicated amounts of expression plasmids for or STAT3-C (positive control). Data are means ± s.d. (n = 3). P <.1 versus corresponding control.
10 Astrocytic genes Aldh1L1 Aldoc CNTFR FGFR3 GFAP GLAST GLT-1 gp13 NFIA NFIX S1β Sox9 STAT1 STAT3 Fold change (/) Downregulated neuronal genes Brn2 (Pou3f2) Brn4 (Pou3f4) NFIB Sox4 Sox11 Fold change (/) Supplementary Figure 1. Microarray analysis of -overexpressing NPCs. (a, ) E11.5 NPCs were infected with control or viruses. The virus-infected NPCs were isolated 3 days after infection and sujected to microarray analysis. Fold changes in the expression level of the indicated astrocytic (a) and neuronal () genes in -overexpressing NPCs relative to control are shown.


11 FLAG- FLAG- NFIA Sox9 NFIA IP: FLAG- Sox9 IP: FLAG- FLAG- FLAG- NFIA WCL Sox9 WCL FLAG- FLAG- Supplementary Figure 11. interacts with NFIA. (a, ) 293T cells were transfected with plasmids for FLAG-tagged, Sox9, or NFIA, as indicated. The cell lysates were sujected to co-immunoprecipitation and western lot analysis. IP, immunoprecipitation; WCL, whole cell lysate.


 or")


12 Ventral forerain Hippocampus Spinal cord GM Spinal cord WM / Aldh1L1 P14 CA1 P14 P14 P14 Ventral forerain Hippocampus Spinal cord GM Spinal cord WM CA1 / GFAP c Ventral forerain Hippocampus Spinal cord GM Spinal cord WM CA1 / S1β Supplementary Figure 12. Expression of in the CNS regions other than neocortex. (a) Doule staining for and Aldh1L1-GFP in the P14 ventral forerain, hippocampus, and spinal cord. (, c) Doule staining for and either GFAP () or S1β (c) in the adult ventral forerain, hippocampus, and spinal cord. CA1, hippocampal CA1 sector; GM, gray matter; WM, white matter. Arrowheads indicate doule-positive cells. Scale ars, 5 μm.


.")

13 E11.5 NPC culture E11.5 NPC culture GFP / GalC GFP / GFAP GFP / TuJ TuJ1 GFAP GalC Supplementary Figure 13. Effects of on the differentiation of spinal cord NPCs in vitro. (a, ) NPCs derived from E11.5 mouse spinal cord were infected with retroviruses encoding GFP alone (control) or oth GFP and. Two days after infection, the cells were induced to differentiate for 6 days and then stained for TuJ1, GFAP, GalC, and GFP (a). Arrows indicate marker + /GFP + cells. The percentages of marker + cells among total GFP + cells were determined as means ± s.d. (n = 3) (). P <.1 versus the corresponding control value. Scale ar, 5 μm.

 Quantitative RT-PCR analysis of relative Sox1 mrna aundance in -overexpressing and control NPCs. Data are means ± s.d. (n = 3).")
.")
 Expression plasmids for GFP alone (control) or for oth GFP and were injected into the lateral ventricle of the E15.")
 (e). (f) ChIP analysis of inding to the Sox1 gene region in NPCs.")
14 E11.5 NPC culture 1.2 c Sox1 mrna / GAPDH mrna GFP / Sox1 Sox1 + cells among GFP + cells (%) d. Forerain Higher-magnification e Day 1 Day 2 GFP / Sox1 / Hoechst f Fold enrichment P3 SVZ E11.5 NPC culture, mouse IgG, TY1 A TY1-, mouse IgG TY1-, TY1 A Sox1 + cells among GFP + cells (%) ~ ~ ~ ~ -181 Sox1 gene region (p) -11 ~ ~ +37 Supplementary Figure 14. suppresses oligodendrocyte differentiation. (a) Quantitative RT-PCR analysis of relative Sox1 mrna aundance in -overexpressing and control NPCs. Data are means ± s.d. (n = 3). (, c) E16.5 NPCs were infected with retroviruses encoding GFP alone (control) or oth GFP and. Two days after infection, the cells were induced to differentiate for 1 or 2 days and then stained for Sox1 and GFP (). The percentages of Sox1 + cells among total GFP + cells were determined as means ± s.d. (n = 3) (c). (d, e) Expression plasmids for GFP alone (control) or for oth GFP and were injected into the lateral ventricle of the E15.5 mouse forerain in utero and were introduced into the lateral dorsoventral oundary of rains y electroporation. The rain was isolated at P3 and sujected to immunostaining for Sox1 and GFP (d). The percentages of Sox1 + cells among total GFP + cells were determined as means ± s.d. (n = 1) (e). (f) ChIP analysis of inding to the Sox1 gene region in NPCs. Six different regions of the Sox1 locus were tested in control cells and cells expressing TY1-tagged. Data are expressed as fold enrichment relative to the corresponding value for control cells and normal mouse immunogloulin G (IgG). Data are means ± s.d. (n = 3). SVZ, suventricular zone; p, ase pair; A, antiody. The oxed region in d is shown at higher magnification in the right-most panel. Arrows indicate Sox1 + /GFP + cells (, d). Scale ars, 5 μm (d) and 25 μm ( and higher magnification image in d). P <.1 versus the corresponding control value.


 in the P3 neocortex.")
 in the P3 neocortex.")

15 Forerain / Sox1 / Olig2 Neocortex / Ki67 / Olig2 P3 P3 CC SVZ Supplementary Figure /Olig2 + cells are astrocyte precursors in the developing neocortex. (a) + /Olig2 + /Sox1 cells (arrowheads) and /Olig2 + /Sox1 + cells (arrows) in the P3 neocortex. () + /Olig2 + /Ki67 + cells (arrowheads) and /Olig2 + /Ki67 + cells (arrows) in the P3 neocortex. CC, corpus callosum;, lateral ventricle; SVZ, suventricular zone. The lower panels are higher magnification views of the oxed areas. Scale ars, 5 μm or 25 μm (higher magnification images).
16 8 Zt16 mrna / GAPDH mrna Zt TuJ1 GFAP O4 sh- #1 Zt16 sh- #1 + Zt16 Nestin ## c d 8 Zt45 mrna / GAPDH mrna Zt TuJ1 GFAP sh- #1 Zt45 sh- #1 + Zt45 O4 Supplementary Figure 16. Zt16 and Zt45 fail to rescue the knockdown phenotypes in NPC cultures. (a, c) E16.5 NPCs were infected with retroviruses encoding GFP alone (control) or GFP plus either Zt16 (a) or Zt45 (c). The expression level of Zt16 (a) or Zt45 (c) mrna was determined y quantitative RT-PCR analysis. Data are expressed relative to the control value and are means ± s.d. (n = 3). (, d) E16.5 NPCs were infected with retroviruses for control, sh- #1, Zt16, or sh- #1 plus Zt16 (), or for control, sh- #1, Zt45, or sh- #1 plus Zt45 (d). The cells were induced to differentiate for 6 days, after which the cells were immunostained for TuJ1, GFAP, O4, nestin, and GFP. The percentages of marker + cells among total GFP + cells were quantified as means ± s.d. (n = 3). P <.1, P <.5 versus corresponding control value; ##P <.5 versus value for sh- #1 alone.
SUPPLEMENTARY INFORMATION
 DOI: 10.1038/ncb2566 Figure S1 CDKL5 protein expression pattern and localization in mouse brain. (a) Multiple-tissue western blot from a postnatal day (P) 21 mouse probed with an antibody against CDKL5.
SUPPLEMENTARY FIGURES
 SUPPLEMENTARY FIGURES 1 Supplementary Figure 1, Adult hippocampal QNPs and TAPs uniformly express REST a-b) Confocal images of adult hippocampal mouse sections showing GFAP (green), Sox2 (red), and REST
Supplemental Information. Induction of Expansion and Folding. in Human Cerebral Organoids
 Cell Stem Cell, Volume 20 Supplemental Information Induction of Expansion and Folding in Human Cerebral Organoids Yun Li, Julien Muffat, Attya Omer, Irene Bosch, Madeline A. Lancaster, Mriganka Sur, Lee
Supplementary Figure 1
 Supplementary Figure 1 Kif1a RNAi effect on basal progenitor differentiation Related to Figure 2. Representative confocal images of the VZ and SVZ of rat cortices transfected at E16 with scrambled or Kif1a
supplementary information
 DOI: 10.1038/ncb2153 Figure S1 Ectopic expression of HAUSP up-regulates REST protein. (a) Immunoblotting showed that ectopic expression of HAUSP increased REST protein levels in ENStemA NPCs. (b) Immunofluorescent
Control of CNS Cell-Fate Decisions by SHP-2 and Its Dysregulation in Noonan Syndrome
 Article Control of CNS Cell-Fate Decisions by SHP-2 and Its Dysregulation in Noonan Syndrome Andrée S. Gauthier, 1,2,3 Olivia Furstoss, 1,2 Toshiyuki Araki, 5 Richard Chan, 5 Benjamin G. Neel, 5 David
Supplementary information. Nkx2.1 regulates the generation of telencephalic astrocytes during embryonic
 Supplementary information Nkx2.1 regulates the generation of telencephalic astrocytes during embryonic development Shilpi Minocha 1*, Delphine Valloton 1*, Yvan Arsenijevic 2, Jean-René Cardinaux 3, Raffaella
Supplementary Figure 1. Electroporation of a stable form of β-catenin causes masses protruding into the IV ventricle. HH12 chicken embryos were
 Supplementary Figure 1. Electroporation of a stable form of β-catenin causes masses protruding into the IV ventricle. HH12 chicken embryos were electroporated with β- Catenin S33Y in PiggyBac expression
Supplemental Figure 1. Intracranial transduction of a modified ptomo lentiviral vector in the mouse
 Supplemental figure legends Supplemental Figure 1. Intracranial transduction of a modified ptomo lentiviral vector in the mouse hippocampus targets GFAP-positive but not NeuN-positive cells. (A) Stereotaxic
Supplemental information
 Carcinoemryonic antigen-related cell adhesion molecule 6 (CEACAM6) promotes EGF receptor signaling of oral squamous cell carcinoma metastasis via the complex N-glycosylation y Chiang et al. Supplemental
IP: anti-gfp VPS29-GFP. IP: anti-vps26. IP: anti-gfp - + +
 FAM21 Strump. WASH1 IP: anti- 1 2 3 4 5 6 FAM21 Strump. FKBP IP: anti-gfp VPS29- GFP GFP-FAM21 tail H H/P P H H/P P c FAM21 FKBP Strump. VPS29-GFP IP: anti-gfp 1 2 3 FKBP VPS VPS VPS VPS29 1 = VPS29-GFP
SUPPLEMENTARY FIGURES AND TABLE
 SUPPLEMENTARY FIGURES AND TABLE Supplementary Figure S1: Characterization of IRE1α mutants. A. U87-LUC cells were transduced with the lentiviral vector containing the GFP sequence (U87-LUC Tet-ON GFP).
Supplementary Information
 Supplementary Information Astrocytes regulate adult hippocampal neurogenesis through ephrin-b signaling Randolph S. Ashton, Anthony Conway, Chinmay Pangarkar, Jamie Bergen, Kwang-Il Lim, Priya Shah, Mina
(a) Significant biological processes (upper panel) and disease biomarkers (lower panel)
 Significant biological processes (upper panel) and disease biomarkers (lower panel)") Supplementary Figure 1. Functional enrichment analyses of secretomic proteins. (a) Significant biological processes (upper panel) and disease biomarkers (lower panel) 2 involved by hrab37-mediated secretory
Supplementary Figure 1. Functional enrichment analyses of secretomic proteins. (a) Significant biological processes (upper panel) and disease biomarkers (lower panel) 2 involved by hrab37-mediated secretory
Supplemental Information. Menin Deficiency Leads to Depressive-like. Behaviors in Mice by Modulating. Astrocyte-Mediated Neuroinflammation
 Neuron, Volume 100 Supplemental Information Menin Deficiency Leads to Depressive-like Behaviors in Mice by Modulating Astrocyte-Mediated Neuroinflammation Lige Leng, Kai Zhuang, Zeyue Liu, Changquan Huang,
Supplementary Figure S1: Tanycytes are restricted to the central/posterior hypothalamus
 Supplementary Figure S1: Tanycytes are restricted to the central/posterior hypothalamus a: Expression of Vimentin, GFAP, Sox2 and Nestin in anterior, central and posterior hypothalamus. In the anterior
SUPPLEMENTARY FIG. S2. Representative counting fields used in quantification of the in vitro neural differentiation of pattern of dnscs.
 Supplementary Data SUPPLEMENTARY FIG. S1. Representative counting fields used in quantification of the in vitro neural differentiation of pattern of anpcs. A panel of lineage-specific markers were used
Supplementary information. MARCH8 inhibits HIV-1 infection by reducing virion incorporation of envelope glycoproteins
 Supplementary information inhibits HIV-1 infection by reducing virion incorporation of envelope glycoproteins Takuya Tada, Yanzhao Zhang, Takayoshi Koyama, Minoru Tobiume, Yasuko Tsunetsugu-Yokota, Shoji
RAW264.7 cells stably expressing control shrna (Con) or GSK3b-specific shrna (sh-
 or GSK3b-specific shrna (sh-") 1 a b Supplementary Figure 1. Effects of GSK3b knockdown on poly I:C-induced cytokine production. RAW264.7 cells stably expressing control shrna (Con) or GSK3b-specific shrna (sh- GSK3b) were stimulated
1 a b Supplementary Figure 1. Effects of GSK3b knockdown on poly I:C-induced cytokine production. RAW264.7 cells stably expressing control shrna (Con) or GSK3b-specific shrna (sh- GSK3b) were stimulated
Sirt1 Hmg20b Gm (0.17) 24 (17.3) 877 (857)
 24 (17.3) 877 (857)") 3 (0.17) 24 (17.3) Sirt1 Hmg20 Gm4763 877 (857) c d Suppl. Figure 1. Screen validation for top candidate antagonists of Dot1L (a) Numer of genes with one (gray), two (cyan) or three (red) shrna scored
3 (0.17) 24 (17.3) Sirt1 Hmg20 Gm4763 877 (857) c d Suppl. Figure 1. Screen validation for top candidate antagonists of Dot1L (a) Numer of genes with one (gray), two (cyan) or three (red) shrna scored
SUPPLEMENTARY FIGURE LEGENDS
 SUPPLEMENTARY FIGURE LEGENDS Supplemental FIG. 1. Localization of myosin Vb in cultured neurons varies with maturation stage. A and B, localization of myosin Vb in cultured hippocampal neurons. A, in DIV
Soft Agar Assay. For each cell pool, 100,000 cells were resuspended in 0.35% (w/v)
") SUPPLEMENTARY MATERIAL AND METHODS Soft Agar Assay. For each cell pool, 100,000 cells were resuspended in 0.35% (w/v) top agar (LONZA, SeaKem LE Agarose cat.5004) and plated onto 0.5% (w/v) basal agar.
SUPPLEMENTARY MATERIAL AND METHODS Soft Agar Assay. For each cell pool, 100,000 cells were resuspended in 0.35% (w/v) top agar (LONZA, SeaKem LE Agarose cat.5004) and plated onto 0.5% (w/v) basal agar.
Prss56, a novel marker of adult neurogenesis in the mouse brain. - Supplemental Figures 1 to 5- Brain Structure and Function
 Prss56, a novel marker of adult neurogenesis in the mouse brain - Supplemental Figures 1 to 5- Brain Structure and Function Alexandre Jourdon 1,2, Aurélie Gresset 1, Nathalie Spassky 1, Patrick Charnay
FIG S1 Examination of eif4b expression after virus infection. (A) A549 cells
 A549 cells") Supplementary Figure Legends FIG S1 Examination of expression after virus infection. () 549 cells were infected with herpes simplex virus (HSV) (MOI = 1), and harvested at the indicated times, followed
Supplementary Figure Legends FIG S1 Examination of expression after virus infection. () 549 cells were infected with herpes simplex virus (HSV) (MOI = 1), and harvested at the indicated times, followed
Supplementary Figure 1.TRIM33 binds β-catenin in the nucleus. a & b, Co-IP of endogenous TRIM33 with β-catenin in HT-29 cells (a) and HEK 293T cells
 and HEK 293T cells") Supplementary Figure 1.TRIM33 binds β-catenin in the nucleus. a & b, Co-IP of endogenous TRIM33 with β-catenin in HT-29 cells (a) and HEK 293T cells (b). TRIM33 was immunoprecipitated, and the amount of
Supplementary Figure 1.TRIM33 binds β-catenin in the nucleus. a & b, Co-IP of endogenous TRIM33 with β-catenin in HT-29 cells (a) and HEK 293T cells (b). TRIM33 was immunoprecipitated, and the amount of
Primary Mouse Cerebral Cortex Neurons V: 80% TE: 70%
 Primary Mouse Cerebral Cortex Neurons V: 80% TE: 70% Pictures: 9 days after electroporation Red: MAP2 Blue: GFAP Green: GFP The cells were from Embryonic Day 14 Mouse Cerebral Cortex Primary Mouse Hippocampal
Supplementary Information
 Supplementary Information Title Degeneration and impaired regeneration of gray matter oligodendrocytes in amyotrophic lateral sclerosis Authors Shin H. Kang, Ying Li, Masahiro Fukaya, Ileana Lorenzini,
SUPPLEMENTARY INFORMATION
 doi:10.1038/nature12652 Supplementary Figure 1. PRDM16 interacts with endogenous EHMT1 in brown adipocytes. Immunoprecipitation of PRDM16 complex by flag antibody (M2) followed by Western blot analysis
Genesis of cerebellar interneurons and the prevention of neural DNA damage require XRCC1.
 Genesis of cerebellar interneurons and the prevention of neural DNA damage require XRCC1. Youngsoo Lee, Sachin Katyal, Yang Li, Sherif F. El-Khamisy, Helen R. Russell, Keith W. Caldecott and Peter J. McKinnon.
Supplementary Figure 1. HOPX is hypermethylated in NPC. (a) Methylation levels of HOPX in Normal (n = 24) and NPC (n = 24) tissues from the
 Methylation levels of HOPX in Normal (n = 24) and NPC (n = 24) tissues from the") Supplementary Figure 1. HOPX is hypermethylated in NPC. (a) Methylation levels of HOPX in Normal (n = 24) and NPC (n = 24) tissues from the genome-wide methylation microarray data. Mean ± s.d.; Student
Supplementary Figure 1. HOPX is hypermethylated in NPC. (a) Methylation levels of HOPX in Normal (n = 24) and NPC (n = 24) tissues from the genome-wide methylation microarray data. Mean ± s.d.; Student
Supplementary Figure 1 (Related with Figure 4). Molecular consequences of Eed deletion. (a) ChIP analysis identifies 3925 genes that are associated
. Molecular consequences of Eed deletion. (a) ChIP analysis identifies 3925 genes that are associated") Supplementary Figure 1 (Related with Figure 4). Molecular consequences of Eed deletion. (a) ChIP analysis identifies 3925 genes that are associated with the H3K27me3 mark in chondrocytes (see Table S1,
Supplementary Figure 1 (Related with Figure 4). Molecular consequences of Eed deletion. (a) ChIP analysis identifies 3925 genes that are associated with the H3K27me3 mark in chondrocytes (see Table S1,
SUPPLEMENTARY INFORMATION
 doi:10.1038/nature12215 Supplementary Figure 1. The effects of full and dissociated GR agonists in supporting BFU-E self-renewal divisions. BFU-Es were cultured in self-renewal medium with indicated GR
mir-7a regulation of Pax6 in neural stem cells controls the spatial origin of forebrain dopaminergic neurons
 Supplemental Material mir-7a regulation of Pax6 in neural stem cells controls the spatial origin of forebrain dopaminergic neurons Antoine de Chevigny, Nathalie Coré, Philipp Follert, Marion Gaudin, Pascal
Supplementary Table 1. List of primers used in this study
 Supplementary Table 1. List of primers used in this study Gene Forward primer Reverse primer Rat Met 5 -aggtcgcttcatgcaggt-3 5 -tccggagacacaggatgg-3 Rat Runx1 5 -cctccttgaaccactccact-3 5 -ctggatctgcctggcatc-3
Electron micrograph of phosphotungstanic acid-stained exosomes derived from murine
 1 SUPPLEMENTARY INFORMATION SUPPLEMENTARY FIGURES Supplementary Figure 1. Physical properties of murine DC-derived exosomes. a, Electron micrograph of phosphotungstanic acid-stained exosomes derived from
SUPPLEMENTARY INFORMATION
 Suppl. Fig. 1 in vivo expression of ISL1 in the human fetal heart. a, Hematoxylin eosin staining showing structures of left atrium and left atrium appendage (*) of a human fetal heart at 11 weeks of gestation.
GFP/Iba1/GFAP. Brain. Liver. Kidney. Lung. Hoechst/Iba1/TLR9!
 Supplementary information a +KA Relative expression d! Tlr9 5!! 5! NSC Neuron Astrocyte Microglia! 5! Tlr7!!!! NSC Neuron Astrocyte! GFP/Sβ/! Iba/Hoechst Microglia e Hoechst/Iba/TLR9! GFP/Iba/GFAP f Brain
SUPPLEMENTARY INFORMATION
 doi:10.1038/nature10353 Supplementary Figure 1. Mutations of UBQLN2 in patients with ALS and ALS/dementia. (a) A mutation, c.1489c>t (p.p497s), was identified in F#9975. The pedigree is shown on the left
Supplementary Fig. 1 Blocking shh function at the protein level confirms its role as a guidance cue for postcommissural axons.
 Supplementary Fig. 1 Blocking shh function at the protein level confirms its role as a guidance cue for postcommissural axons. As an alternative method to demonstrate the role of shh as a guidance cue
effects on organ development. a-f, Eye and wing discs with clones of ε j2b10 show no
 Supplementary Figure 1. Loss of function clones of 14-3-3 or 14-3-3 show no significant effects on organ development. a-f, Eye and wing discs with clones of 14-3-3ε j2b10 show no obvious defects in Elav
marker. DAPI labels nuclei. Flies were 20 days old. Scale bar is 5 µm. Ctrl is
 Supplementary Figure 1. (a) Nos is detected in glial cells in both control and GFAP R79H transgenic flies (arrows), but not in deletion mutant Nos Δ15 animals. Repo is a glial cell marker. DAPI labels
Supplementary Figure 1
 Supplementary Figure 1 AAV-GFP injection in the MEC of the mouse brain C57Bl/6 mice at 4 months of age were injected with AAV-GFP into the MEC and sacrificed at 7 days post injection (dpi). (a) Brains
Ophthalmology, Radiation Oncology,
 Supporting Online Material Journal: Nature Neuroscience Article Title: Corresponding Author: All Authors: Affiliations: Tanycytes of the Hypothalamic Median Eminence Form a Diet- Responsive Neurogenic
Address: Department of Biomedical Genetics, University of Rochester Medical Center, 601 Elmwood Avenue, Rochester, NY 14642, USA.
 Journal of Biology BioMed Central Research article CNS progenitor cells and oligodendrocytes are targets of chemotherapeutic agents in vitro and in vivo Joerg Dietrich, Ruolan Han, Yin Yang, Margot Mayer-Pröschel
293T cells were transfected with indicated expression vectors and the whole-cell extracts were subjected
 SUPPLEMENTARY INFORMATION Supplementary Figure 1. Formation of a complex between Slo1 and CRL4A CRBN E3 ligase. (a) HEK 293T cells were transfected with indicated expression vectors and the whole-cell
Supplementary Figure 1. PAQR3 knockdown inhibits SREBP-2 processing in CHO-7 cells CHO-7 cells were transfected with control sirna or a sirna
 Supplementary Figure 1. PAQR3 knockdown inhibits SREBP-2 processing in CHO-7 cells CHO-7 cells were transfected with control sirna or a sirna targeted for hamster PAQR3. At 24 h after the transfection,
Metformin Activates an Atypical PKC-CBP Pathway to Promote Neurogenesis and Enhance Spatial Memory Formation
 rticle formin ctivates an typical PKC-CBP Pathway to Promote Neurogenesis and Enhance Spatial Memory Formation Jing Wang, 1,2 Denis Gallagher, 1,2,4,9 Loren M. DeVito, 3,9 Gonzalo I. Cancino, 1,2 David
Supplementary Figure 1. Chimeric analysis of inner ears. (A-H) Chimeric inner ears with fluorescent ES cells and (I,J) Rainbow inner ears.
 Chimeric inner ears with fluorescent ES cells and (I,J) Rainbow inner ears.") Supplementary Figure 1. himeric analysis of inner ears. (A-H) himeric inner ears with fluorescent ES cells and (I,J) Rainbow inner ears. (A,B) omposite images showing three colors in different vestibular
Supplementary Figure 1. himeric analysis of inner ears. (A-H) himeric inner ears with fluorescent ES cells and (I,J) Rainbow inner ears. (A,B) omposite images showing three colors in different vestibular
Supplementary Information
 Supplementary Information Supplementary Figure 1. EBV-gB 23-431 mainly exists as trimer in HEK 293FT cells. (a) Western blotting analysis for DSS crosslinked FLAG-gB 23-431. HEK 293FT cells transfected
SUPPLEMENTARY FIGURES
 SUPPLEMENTARY FIGURES Supplementary Figure S1: Fibroblast-induced elongation of cancer cells requires direct contact with living fibroblasts. A. Representative images of HT29-GFP cultured in the presence
Supplementary Information and Figure legends
 Supplementary Information and Figure legends Table S1. Primers for quantitative RT-PCR Target Sequence (5 -> 3 ) Target Sequence (5 -> 3 ) DAB2IP F:TGGACGATGTGCTCTATGCC R:GGATGGTGATGGTTTGGTAG Snail F:CCTCCCTGTCAGATGAGGAC
Supplementary Figure 1. Normal T lymphocyte populations in Dapk -/- mice. (a) Normal thymic development in Dapk -/- mice. Thymocytes from WT and Dapk
 Normal thymic development in Dapk -/- mice. Thymocytes from WT and Dapk") Supplementary Figure 1. Normal T lymphocyte populations in Dapk -/- mice. (a) Normal thymic development in Dapk -/- mice. Thymocytes from WT and Dapk -/- mice were stained for expression of CD4 and CD8.
Supplementary Figure 1. Normal T lymphocyte populations in Dapk -/- mice. (a) Normal thymic development in Dapk -/- mice. Thymocytes from WT and Dapk -/- mice were stained for expression of CD4 and CD8.
Nature Neuroscience: doi: /nn Supplementary Figure 1. MADM labeling of thalamic clones.
 Supplementary Figure 1 MADM labeling of thalamic clones. (a) Confocal images of an E12 Nestin-CreERT2;Ai9-tdTomato brain treated with TM at E10 and stained for BLBP (green), a radial glial progenitor-specific
Supplementary Figure 1. mir124 does not change neuron morphology and synaptic
 Supplementary Figure 1. mir124 does not change neuron morphology and synaptic density. Hippocampal neurons were transfected with mir124 (containing DsRed) or DsRed as a control. 2 d after transfection,
OSVZ progenitors of human and ferret neocortex are epithelial-like and
 OSVZ progenitors of human and ferret neocortex are epithelial-like and expand by integrin signaling Simone A Fietz, Iva Kelava, Johannes Vogt, Michaela Wilsch-Bräuninger, Denise Stenzel, Jennifer L Fish,
Supplementary Figure 1 IL-27 IL
 Tim-3 Supplementary Figure 1 Tc0 49.5 0.6 Tc1 63.5 0.84 Un 49.8 0.16 35.5 0.16 10 4 61.2 5.53 10 3 64.5 5.66 10 2 10 1 10 0 31 2.22 10 0 10 1 10 2 10 3 10 4 IL-10 28.2 1.69 IL-27 Supplementary Figure 1.
Supplementary Figure 1. SC35M polymerase activity in the presence of Bat or SC35M NP encoded from the phw2000 rescue plasmid.
 1 2 3 4 5 6 7 8 9 10 11 12 13 14 15 16 17 18 19 20 21 22 23 24 25 26 27 Supplementary Figure 1. SC35M polymerase activity in the presence of Bat or SC35M NP encoded from the phw2000 rescue plasmid. HEK293T
SUPPLEMENTARY INFORMATION
 DOI: 10.1038/ncb2607 Figure S1 Elf5 loss promotes EMT in mammary epithelium while Elf5 overexpression inhibits TGFβ induced EMT. (a, c) Different confocal slices through the Z stack image. (b, d) 3D rendering
Nature Structural & Molecular Biology: doi: /nsmb Supplementary Figure 1. Differential expression of mirnas from the pri-mir-17-92a locus.
 Supplementary Figure 1 Differential expression of mirnas from the pri-mir-17-92a locus. (a) The mir-17-92a expression unit in the third intron of the host mir-17hg transcript. (b,c) Impact of knockdown
SOPten flox/flox (KO) Pten flox/flox (WT) flox allele 6.0 kb. Pten. Actin. ! allele 2.3 kb. Supplementary Figure S1. Yanagi, et al.
 Pten flox/flox (WT) flox allele 6.0 kb. Pten. Actin. ! allele 2.3 kb. Supplementary Figure S1. Yanagi, et al.") s1 A Pten flox/flox () SOPten flox/flox () flox allele 6. kb B Pten flox/flox () SOPten flox/flox () Pten Actin! allele 2.3 kb Supplementary Figure S1. Yanagi, et al. A B BrdU BrdU positive cells ( ) 3
s1 A Pten flox/flox () SOPten flox/flox () flox allele 6. kb B Pten flox/flox () SOPten flox/flox () Pten Actin! allele 2.3 kb Supplementary Figure S1. Yanagi, et al. A B BrdU BrdU positive cells ( ) 3
(A) SW480, DLD1, RKO and HCT116 cells were treated with DMSO or XAV939 (5 µm)
 SW480, DLD1, RKO and HCT116 cells were treated with DMSO or XAV939 (5 µm)") Supplementary Figure Legends Figure S1. Tankyrase inhibition suppresses cell proliferation in an axin/β-catenin independent manner. (A) SW480, DLD1, RKO and HCT116 cells were treated with DMSO or XAV939
Supplementary Figure Legends Figure S1. Tankyrase inhibition suppresses cell proliferation in an axin/β-catenin independent manner. (A) SW480, DLD1, RKO and HCT116 cells were treated with DMSO or XAV939
Visualization of embryonic neural stem cells using Hes promoters in transgenic mice
 www.elsevier.com/locate/ymcne Mol. Cell. Neurosci. 31 (2006) 109 122 Visualization of embryonic neural stem cells using Hes promoters in transgenic mice Toshiyuki Ohtsuka, a,b, * Itaru Imayoshi, b Hiromi
Type of file: PDF Title of file for HTML: Supplementary Information Description: Supplementary Figures and Supplementary Table.
 Type of file: PDF Title of file for HTML: Supplementary Information Description: Supplementary Figures and Supplementary Tale. Type of file: VI Title of file for HTML: Supplementary Movie 1 Description:
Supplementary Figures
 Supplementary Figures Supplementary Fig. 1. Galectin-3 is present within tumors. (A) mrna expression levels of Lgals3 (galectin-3) and Lgals8 (galectin-8) in the four classes of cell lines as determined
PREPARED FOR: U.S. Army Medical Research and Materiel Command Fort Detrick, Maryland
 AWARD NUMBER: W81XWH-14-1-0524 TITLE:Oligodendroglial MCT1 and Metabolic Support of Axons in Multiple Sclerosis PRINCIPAL INVESTIGATOR: Jeffrey D. Rothstein MD, PhD CONTRACTING ORGANIZATION: Johns Hopkins
In vivo reprogramming reactive glia into ipscs to produce new neurons in the
 In vivo reprogramming reactive glia into ipscs to produce new neurons in the cortex following traumatic brain injury Xiang Gao 1, Xiaoting Wang 1, Wenhui Xiong 1, Jinhui Chen 1, * 1 Spinal Cord and Brain
Supplementary Figure S1. Monolayer differentiation of mouse ESCs into telencephalic neural precursors. (a) Schematic representation of the protocols
 Schematic representation of the protocols") Supplementary Figure S1. Monolayer differentiation of mouse ESCs into telencephalic neural precursors. (a) Schematic representation of the protocols used to differentiate mouse ESCs. (b) Representative
Supplementary Figure S1. Monolayer differentiation of mouse ESCs into telencephalic neural precursors. (a) Schematic representation of the protocols used to differentiate mouse ESCs. (b) Representative
Supplementary Information
 Supplementary Information mediates STAT3 activation at retromer-positive structures to promote colitis and colitis-associated carcinogenesis Zhang et al. a b d e g h Rel. Luc. Act. Rel. mrna Rel. mrna
A new subtype of progenitor cell in the mouse embryonic neocortex. Xiaoqun Wang, Jin-Wu Tsai, Bridget LaMonica & Arnold R.
 A new subtype of progenitor cell in the mouse embryonic neocortex Xiaoqun Wang, Jin-Wu Tsai, Bridget LaMonica & Arnold R. Kriegstein Supplementary Figures 1-6: Supplementary Movies 1-9: Supplementary
well for 2 h at rt. Each dot represents an individual mouse and bar is the mean ±
 Supplementary data: Control DC Blimp-1 ko DC 8 6 4 2-2 IL-1β p=.5 medium 8 6 4 2 IL-2 Medium p=.16 8 6 4 2 IL-6 medium p=.3 5 4 3 2 1-1 medium IL-1 n.s. 25 2 15 1 5 IL-12(p7) p=.15 5 IFNγ p=.65 4 3 2 1
Supplementary Figure 1: STAT3 suppresses Kras-induced lung tumorigenesis
 Supplementary Figure 1: STAT3 suppresses Kras-induced lung tumorigenesis (a) Immunohistochemical (IHC) analysis of tyrosine 705 phosphorylation status of STAT3 (P- STAT3) in tumors and stroma (all-time
Supplementary Figure 1. Baf60c and baf180 are induced during cardiac regeneration in zebrafish. RNA in situ hybridization was performed on paraffin
 Supplementary Figure 1. Baf60c and baf180 are induced during cardiac regeneration in zebrafish. RNA in situ hybridization was performed on paraffin sections from sham-operated adult hearts (a and i) and
Nature Neuroscience: doi: /nn Supplementary Figure 1. Splenic atrophy and leucopenia caused by T3 SCI.
 Supplementary Figure 1 Splenic atrophy and leucopenia caused by T3 SCI. (a) Gross anatomy of representative spleens from control and T3 SCI mice at 28 days post-injury. (b and c) Hematoxylin and eosin
Supplementary Materials for
 www.sciencesignaling.org/cgi/content/full/9/439/ra78/dc1 Supplementary Materials for Small heterodimer partner mediates liver X receptor (LXR) dependent suppression of inflammatory signaling by promoting
SUPPLEMENTARY INFORMATION
 DOI: 10.1038/ncb2535 Figure S1 SOX10 is expressed in human giant congenital nevi and its expression in human melanoma samples suggests that SOX10 functions in a MITF-independent manner. a, b, Representative
SUPPLEMENTARY FIGURE LEGENDS
 SUPPLEMENTARY FIGURE LEGENDS Supplementary Figure 1. Hippocampal sections from new-born Pten+/+ and PtenFV/FV pups were stained with haematoxylin and eosin (H&E) and were imaged at (a) low and (b) high
SUPPLEMENTARY INFORMATION
 doi:10.1038/nature11095 Supplementary Table 1. Summary of the binding between Angptls and various Igdomain containing receptors as determined by flow cytometry analysis. The results were summarized from
Cord blood monocytes as a source of cell therapy products for treatment of brain injuries ISCT/CBA 2015 Cord Blood Workshop Wednesday, May 27, 2015
 Cord blood monocytes as a source of cell therapy products for treatment of brain injuries ISCT/CBA 2015 Cord Blood Workshop Wednesday, May 27, 2015 Andrew E. Balber, PhD Senior Scientific Advisor CT 2,
ANGPTL2 increases bone metastasis of breast cancer cells through. Tetsuro Masuda, Motoyoshi Endo, Yutaka Yamamoto, Haruki Odagiri, Tsuyoshi
 Masuda et al. Supplementary information for ANGPTL2 increases bone metastasis of breast cancer cells through enhancing CXCR4 signaling Tetsuro Masuda, Motoyoshi Endo, Yutaka Yamamoto, Haruki Odagiri, Tsuyoshi
c Ischemia (30 min) Reperfusion (8 w) Supplementary Figure bp 300 bp Ischemia (30 min) Reperfusion (4 h) Dox 20 mg/kg i.p.
 Reperfusion (8 w) Supplementary Figure bp 300 bp Ischemia (30 min) Reperfusion (4 h) Dox 20 mg/kg i.p.") a Marker Ripk3 +/ 5 bp 3 bp b Ischemia (3 min) Reperfusion (4 h) d 2 mg/kg i.p. 1 w 5 w Sacrifice for IF size A subset for echocardiography and morphological analysis c Ischemia (3 min) Reperfusion (8
a Marker Ripk3 +/ 5 bp 3 bp b Ischemia (3 min) Reperfusion (4 h) d 2 mg/kg i.p. 1 w 5 w Sacrifice for IF size A subset for echocardiography and morphological analysis c Ischemia (3 min) Reperfusion (8
Fragile X Mental Retardation Protein Regulates Proliferation and Differentiation of Adult Neural Stem/ Progenitor Cells
 Fragile X Mental Retardation Protein Regulates Proliferation and Differentiation of Adult Neural Stem/ Progenitor Cells Yuping Luo 1., Ge Shan 2., Weixiang Guo 1., Richard D. Smrt 1", Eric B. Johnson 1",
TISSUE-SPECIFIC STEM CELLS
 TISSUE-SPECIFIC STEM CELLS Epidermal Growth Factor Signaling Mediated by Grb2 Associated Binder1 Is Required for the Spatiotemporally Regulated Proliferation of Olig2-Expressing Progenitors in the Embryonic
SUPPLEMENTARY LEGENDS...
 TABLE OF CONTENTS SUPPLEMENTARY LEGENDS... 2 11 MOVIE S1... 2 FIGURE S1 LEGEND... 3 FIGURE S2 LEGEND... 4 FIGURE S3 LEGEND... 5 FIGURE S4 LEGEND... 6 FIGURE S5 LEGEND... 7 FIGURE S6 LEGEND... 8 FIGURE
Nature Medicine: doi: /nm.4322
 1 2 3 4 5 6 7 8 9 10 11 Supplementary Figure 1. Predicted RNA structure of 3 UTR and sequence alignment of deleted nucleotides. (a) Predicted RNA secondary structure of ZIKV 3 UTR. The stem-loop structure
Supplementary Figure S1
 Supplementary Figure S1 Supplementary Figure S1. PARP localization patterns using GFP-PARP and PARP-specific antibody libraries GFP-PARP localization in non-fixed (A) and formaldehyde fixed (B) GFP-PARPx
p47 negatively regulates IKK activation by inducing the lysosomal degradation of polyubiquitinated NEMO
 Supplementary Information p47 negatively regulates IKK activation by inducing the lysosomal degradation of polyubiquitinated NEMO Yuri Shibata, Masaaki Oyama, Hiroko Kozuka-Hata, Xiao Han, Yuetsu Tanaka,
supplementary information
 DOI: 10.1038/ncb1875 Figure S1 (a) The 79 surgical specimens from NSCLC patients were analysed by immunohistochemistry with an anti-p53 antibody and control serum (data not shown). The normal bronchi served
SUPPLEMENTARY INFORMATION
 Figure S1 Treatment with both Sema6D and Plexin-A1 sirnas induces the phenotype essentially identical to that induced by treatment with Sema6D sirna alone or Plexin-A1 sirna alone. (a,b) The cardiac tube
SUPPLEMENTARY FIGURES
 SUPPLEMENTARY FIGURES 1 2 3 4 SUPPLEMENTARY TABLES Supplementary Table S1. Brain Tumors used in the study Code Tumor Classification Age Gender HuTuP51 Glioblastoma 57 Male HuTuP52 Glioblastoma 53 Male
Supplementary Materials for
 www.sciencesignaling.org/cgi/content/full/6/283/ra57/dc1 Supplementary Materials for JNK3 Couples the Neuronal Stress Response to Inhibition of Secretory Trafficking Guang Yang,* Xun Zhou, Jingyan Zhu,
File Name: Supplementary Information Description: Supplementary Figures and Supplementary Tables. File Name: Peer Review File Description:
 File Name: Supplementary Information Description: Supplementary Figures and Supplementary Tables File Name: Peer Review File Description: Primer Name Sequence (5'-3') AT ( C) RT-PCR USP21 F 5'-TTCCCATGGCTCCTTCCACATGAT-3'
Supplementary Figure 1: si-craf but not si-braf sensitizes tumor cells to radiation.
 Supplementary Figure 1: si-craf but not si-braf sensitizes tumor cells to radiation. (a) Embryonic fibroblasts isolated from wildtype (WT), BRAF -/-, or CRAF -/- mice were irradiated (6 Gy) and DNA damage
Supplementary Materials for. c-abl Activation Plays a Role in α-synucleinopathy Induced Neurodegeneration
 Supplementary Materials for c-abl Activation Plays a Role in α-synucleinopathy Induced Neurodegeneration Saurav Brahmachari, Preston Ge, Su Hyun Lee, Donghoon Kim, Senthilkumar S. Karuppagounder, Manoj
Zhu et al, page 1. Supplementary Figures
 Zhu et al, page 1 Supplementary Figures Supplementary Figure 1: Visual behavior and avoidance behavioral response in EPM trials. (a) Measures of visual behavior that performed the light avoidance behavior
Supplementary Figure 1. PD-L1 is glycosylated in cancer cells. (a) Western blot analysis of PD-L1 in breast cancer cells. (b) Western blot analysis
 Western blot analysis of PD-L1 in breast cancer cells. (b) Western blot analysis") Supplementary Figure 1. PD-L1 is glycosylated in cancer cells. (a) Western blot analysis of PD-L1 in breast cancer cells. (b) Western blot analysis of PD-L1 in ovarian cancer cells. (c) Western blot analysis
Supplementary Figure 1. PD-L1 is glycosylated in cancer cells. (a) Western blot analysis of PD-L1 in breast cancer cells. (b) Western blot analysis of PD-L1 in ovarian cancer cells. (c) Western blot analysis
Figure S1. Reduction in glomerular mir-146a levels correlate with progression to higher albuminuria in diabetic patients.
 Supplementary Materials Supplementary Figures Figure S1. Reduction in glomerular mir-146a levels correlate with progression to higher albuminuria in diabetic patients. Figure S2. Expression level of podocyte
An unconventional role for mirna: let-7 activates Toll-like receptor 7 and causes neurodegeneration
 An unconventional role for mirna: let-7 activates Toll-like receptor 7 and causes neurodegeneration Sabrina M. Lehmann, Christina Krüger, Boyoun Park, Katja Derkow, Karen Rosenberger, Jan Baumgart, Thorsten
Table S1. Primer sequences used for qrt-pcr. CACCATTGGCAATGAGCGGTTC AGGTCTTTGCGGATGTCCACGT ACTB AAGTCCATGTGCTGGCAGCACT ATCACCACTCCGAAGTCCGTCT LCOR
 Table S1. Primer sequences used for qrt-pcr. ACTB LCOR KLF6 CTBP1 CDKN1A CDH1 ATF3 PLAU MMP9 TFPI2 CACCATTGGCAATGAGCGGTTC AGGTCTTTGCGGATGTCCACGT AAGTCCATGTGCTGGCAGCACT ATCACCACTCCGAAGTCCGTCT CGGCTGCAGGAAAGTTTACA
TISSUE-SPECIFIC STEM CELLS
 TISSUE-SPECIFIC STEM CELLS Prox1 Is Required for Oligodendrocyte Cell Identity in Adult Neural Stem Cells of the Subventricular Zone : a Institute of Cell Biology, ZMBE, University of M unster, M unster,
Nature Immunology: doi: /ni Supplementary Figure 1. IC261 inhibits a virus-induced type I interferon response.
 Supplementary Figure 1 IC261 inhibits a virus-induced type I interferon response. (a) HEK293T cells were cultured in 384 wells and transiently transfected with 50 ng of the IFN-β promoter-luc construct