SUPPLEMENTAL MATERIALS
|
|
|
- Alexander Wheeler
- 5 years ago
- Views:
Transcription
1 Supplementary Methods SUPPLEMENTAL MATERIALS Supplementary References Supplementary Video Legends Supplementary Figures and Legends SUPPLEMENTARY METHODS Additional animals and cell lines used for the Supplementary Figures. C3H/HeN mice were purchased from the National Cancer Institute (Frederick, MD), and AKR, FVB/NJ, and Cd247 -/- mice were purchased from Jackson Labs (Bar Harbor, ME). The BALB/c Thy1.1 mice were obtained from the Scripps Research Institute (La Jolla, CA). The OT-1/Rag1 -/- 1, 2, germ-free and conventional-housed Swiss Webster mice were purchased from Taconic Farms (Hudson, NY). Most experiments were performed on mice 8-12 weeks old, although mice up to 6 months old were also tested with similar results. To reconstitute the Tcrd -/- mice with γδ DETC precursors, unfractionated day 14, 15, or 16 fetal thymocytes from wild-type IL2p8-GFP mice were injected intraperitoneally into newborn Tcrd -/- pups ( cells/mouse) and the mice were analyzed after 6 weeks. The 7-17 DETC cells 3 were provided by W. Havran (The Scripps Research Institute, CA). Antibodies and reagents. The following antibodies and reagents were used for immunofluorescence microscopy and/or flow cytometry: V γ 5-FITC (nomenclature according to Tonegawa, clone 536), γδ TCR-biotin (GL3), CD3ε-biotin (145-2C11), CD3-AF647 (17A2), CD103-FITC (M290) and py 142 -CD3ζ- AF647 (K ) from BD Pharmingen (San Diego, CA); γδ TCR-AF647 (UC7-13D5), LFA- 1/CD11a-AF647 (M17/4) and CD45.2-AF647 (104) from BioLegend (San Diego, CA); LAMP-1-AF647 (1D4B) from ebioscience (San Diego, CA); 4G10-biotin and FcεR1γ from Millipore-Upstate (Billerica, MA); py 418 -Src from GenScript (Piscataway, NJ); py 493 -ZAP70 from Signalway Antibody (Pearland, TX); NKG2D (H-15) from Santa Cruz Biotechnology (Santa Cruz, CA); ZO-1 (Z-R1), tricellulin ( ), anti-rabbit IgG, and anti-goat IgG (labeled with AF555 or AF647) from Invitrogen (Carlsbad, CA). FM4-64 and fluorescently labeled cholera toxin subunit B, phalloidin and streptavidin were from Invitrogen. DETC activation in vitro and in vivo. The epidermal cell suspensions were cultured in the Iscove s modified Dulbecco s medium (HyClone, Logan UT) with 10% FBS, 25 mm HEPES, 6 mm L-glutamine, 1
2 50 µm 2-ME, penicillin (100 U/ml), streptomycin (100 µg/ml), and IL-2 (50 U/ml). After 24 h, the cells were transferred into plates coated with streptavidin and biotinylated anti-cd3ε antibody (2C11, 5 µg/ml). After 3 days, the cells were detached using 2 mm EDTA in PBS and analyzed by flow cytometry. For the analysis of γδ TCR and CD45 distribution the 7-17 DETC line was cultured on glass cover slips in the medium described above. For the kinase inhibition studies, ears were harvested from the mice and split into dorsal and ventral sides. Sections of skin (40-50 mm 2 ) were floated on the Hank s balanced salt solution with PP2, PP3 or (an Lck-specific inhibitor) (all at 20 µm; EMD Chemicals, Inc., Gibbstown, NJ) for 3 h at 37 C. The skin sections were then fixed, stained, and imaged by confocal microscopy. The activity of each compound was analyzed in comparison with untreated skin sample from the same mouse. The vehicle control (DMSO) gave similar results as the not treated condition. To induce TCR cross-linking in DETC in vivo, 40 µl of biotinylated anti-cd3ε antibody (2C11, 2.5 µg/ml) and fluorescently labeled streptavidin (5 µg/ml) were injected into the dorsal ear dermis in anesthetized mice. The ears were harvested after h or after 7 days and analyzed by immunofluorescence microscopy. Full-thickness skin wounding was performed by 1 mm diameter ear punch. Topical PMA was applied at µg/ml in acetone. The skin was either imaged in vivo or processed for immunofluorescent staining at different time points. TLR9 agonist CpG-A 2216 ( µm; sequence: 5' G*G*G GGA CGA TCG TCG* G*G*G* G*G, where * indicates a phosphothioate linkage; Trilink Biotechnologies, Inc., San Diego, CA) was injected intradermally. The same fields of view in the injected ear were imaged in anesthetized mice for up to 9 days after the injection. Spatiotemporal analysis. The whole-cell masks (WCM) were generated by thresholding the GFP or CD3ε channels, and the mid-body region was obtained by erosion followed by dilation. The dendrite regions were obtained by subtracting the mid-body regions from the WCM. The local background was read out from DETC-adjacent regions obtained by dilating and subtracting the WCM. Alternatively, for the PALP number analysis, local background channel was created by median filtering the image with a radius of 8.9 µm. The dendrite regions of interest were set by circles of a radius ( µm) at the end or beginning of the dendrite shaft. The dendricity index 4 (= Perimeter 2 / Area 4Π) was determined in maximum intensity projection images based on the WCM statistics in the Slidebook software; the 3D dendricity was calculated based on the reciprocal of the sphericity parameter in the Imaris software version 6 and 7 (Bitplane AG, Saint Paul, MN). The PALPs were identified using an automated macro 2
3 procedure based on a three-fold increase in py signal over the local background followed by size filtering. The CD3ε polarization was calculated as the ratio of the mean CD3ε fluorescence intensity at the distal halves of dendrites to the mean CD3ε intensity at the mid-body. Alternatively, the polarization index (CD3ε, py 142 -CD3ζ, NKG2D, and CD103) was calculated within the dendrite region as the ratio of the mean fluorescence intensity of a molecule of interest at the dendrite end region to that of at the beginning of the dendrite. Three-dimensional visualization and cell tracking were performed using Imaris. For short-term motility and shape-retention analysis (1-2 hours), six frames, equally spaced in time, were binarized and added (time projection). Therefore, pixels with the intensity value of 6 (red in pseudocolor scale) indicated that the structure was immobilized throughout the recording time. The DETC shape retention index was calculated as a ratio of the immobilized area (pixels with the intensity value of 6) to the total cell area during the recorded time (pixels with the intensities 1). Quantification of dendrite motility. Based on 2 h video recordings of DETC motility (spaced 2 min apart) kymographs were created using the reslice function in the ImageJ software. After thresholding coordinates of dendrite membrane position (x, t) were read out using the ImageJ software and the instantaneous velocity was calculated according to the equation: v = (x n+1 x n )/(t n+1 t n ). Next, the average and maximum velocity were determined for each analyzed dendrite. SUPPLEMENTAL REFERENCES 1. Hogquist, K.A. et al. T cell receptor antagonist peptides induce positive selection. Cell 76, (1994). 2. Mombaerts, P. et al. RAG-1-deficient mice have no mature B and T lymphocytes. Cell 68, (1992). 3. Kuziel, W.A. et al. Regulation of T-cell receptor gamma-chain RNA expression in murine Thy-1+ dendritic epidermal cells. Nature 328, (1987). 4. Baxter, C.S., Andringa, A., Chalfin, K. & Miller, M.L. Effect of tumor-promoting agents on density and morphometric parameters of mouse epidermal Langerhans and Thy-1+ cells. Carcinogenesis 12, (1991). 3


4 Supplementary Fig. 1 a Stratum corneum Stratum granulosum Stratum spinosum Basal lamina XZ view - skin Epidermis Dermis Subcutaneous fat Stratum corneum Squamous/stratum granulosum Tip of dendrite XY views z = 0 µm z = 3 µm Cuboidal/stratum spinosum z = 6 µm z = 7.5 µm z = 9 µm z = 11 µm z = 13.5 µm z = 15 µm XZ view - epidermis GFP FM4-64 b Intravital GFP-depth z = 0 bulbous swellings -11 µm 4
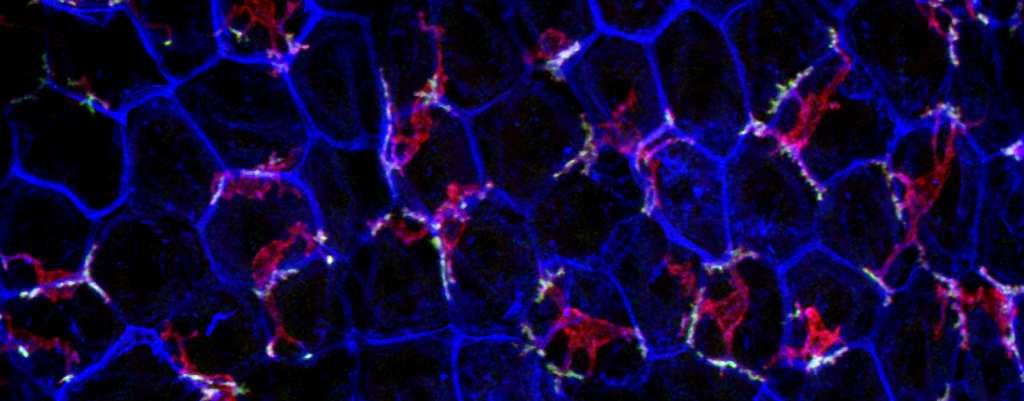
5 Supplementary Figure 1. Morphological polarity of DETCs in epidermis. (a) Position of DETCs relative to the skin and epidermal keratinocyte layers revealed by confocal microscopy of wild-type IL2p8-GFP mouse skin stained with FM4-64. The perpendicular projection was reconstructed from a stack of confocal images (z step = 0.2 µm). The inset and selected XY planes show the localization of a GFP + DETC in the epidermis (Supplementary Video 2). (b) Intravital images, represented as a color-coded depth projection (based on GFP signal), show apical dendrites ending with bulbous swellings (arrows). Scale bars, 10 µm. 5


6 Supplementary Fig. 2 Immediate fixation γδ TCR py Phosphatase pre-treated γδ TCR py 6
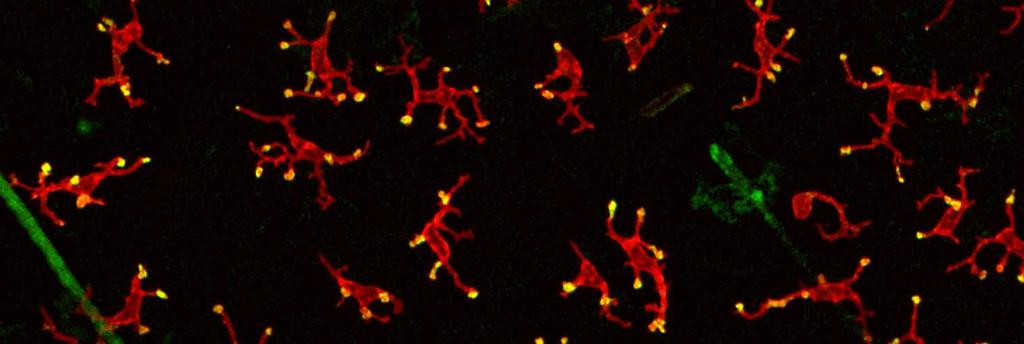
7 Supplementary Figure 2. Specificity control for py staining. Left: Fixed C57BL/6 mouse skin was stained for γδ TCR (red) and py (green). Fluorescence overlap results in the yellow color. The arrowheads indicate py clusters (PALPs). Right: A similar specimen was pre-treated with alkaline phosphatase before identical staining. Scale bar, 10 µm. 7


8 Supplementary Fig. 3 Tcrd / CD3ε # CD3ε (FAU) * Distance (µm) * CD3ε (FAU) a Distance (µm) WT & # CD3ε (FAU) & CD3ε WT b Tcrd / CD3ε py(142)-cd3ζ Distance (µm) Rare WT-like e Typical Tcrd / CD3ε py c WT d CD3ε py(142)-cd3ζ Tcrd / WT-like 1 Tcrd / WT-like WT GFP py(142)-cd3ζ CD3ε 2 py(142)-cd3ζ Overlay Overlay MIP z=6 µm Time projection 0 2h
9 Supplementary Figure 3. The epidermis of Tcrd -/- mice contains rare V γ 5-like αβ DETC clusters. (a) Confocal microscopy of non-treated skin of Tcrd -/- mice stained for CD3ε showing a rare wild-typelike clone of αβ TCR DETCs. The graphs represent profiles of CD3ε fluorescence intensity along the dashed lines in the indicated cells. An area of similarly stained wild-type skin and one magnified wildtype DETC is shown for comparison. (b) Rare V γ 5-like αβ DETCs in Tcrd -/- mice form PALPs including CD3ζ tyrosine phosphorylation. Note that the Tcrd -/- cells in the upper left marked with the symbol resemble wild-type cells, magnified in panel c. (c) The cells indicated in panel b, two wild-type and two Tcrd -/- wild-type-like, are shown in higher magnification. Bottom panel represents py(142)-cd3ζ levels of the DETCs in fire color scale. (d) Close-ups of highlighted PALPs from the panel c. Images in c and d are maximum intensity projections (MIP) from the confocal stacks with indicated z-span. (e) Using idisc approach in IL2p8-GFP Tcrd -/- mice we identified rare αβ DETCs with wild-type-like TCR and py polarization and immobilized dendrites during a 2-h time lapse (white arrowheads). White scale bars, 10 µm; yellow scale bar, 1 µm. Data show one representative of at least two independent experiments. 9


 # cell")


10 Supplementary Fig. 4 a 28 day tracking #8 #4 #14.5 # #8 #16 #20 #20 # * # #2.5 b Older than 48h Settlement Migration A Newly divided B Days after cell division: A - 26, 16 B - 14 C - 8 D - 17 #5 2 nd B D C #23.5 C D #23 A e cell division (day) # cell disappearance (day) c Displacement (µm) *** 0 0 Older Newly than 48 h divided 28 d Live Day 21 Day 27 Day 28 d Dendrite label * 1 week 2 weeks 3 weeks 4 weeks Time point a b c d e f g h i j k l m n o p Fixed z = 0-11 µm o * j i GFP-depth o * j o i * j i γδ TCR py * Overlay 10
11 Supplementary Figure 4. Long-term in vivo anchoring and post-cytokinesis migration of DETCs at steady state. (a) Color-coded time projection of DETC tracks in an IL2p8-GFP reporter mouse visualized every 12 h over the course of 28 days. The arrows represent net displacements and identify cell divisions. The asterisk indicates an example cell analyzed in detail in d and e. (b) DETCs migrate for several days after dividing. All cell tracks are divided into two groups: cells that did not recently divide (older than 48 h), and cells that divided during the observation (newly divided). The tracks are translated to a common origin. The letters identify daughter cell pairs. (c) Comparison of the 28-day displacements of nondividing versus dividing cells. (d) 28-day history of dendrite anchoring in the cell marked with the asterisk in panel a. Dendrite anchoring was identified based on 30-min recordings every 12 h; the letters represent individual sites of dendrite anchoring in the order of appearance. (e) The three frames from Supplementary Video 6 showing time points on days 21, 27 and 28, represented as depth projections, and the same area imaged with confocal microscopy after staining for γδ TCR and py at the conclusion of 28 day-long intravital monitoring. The arrowheads and arrows indicate the dendrites that remained anchored for the last 7 days or 24 h, respectively. The inset shows a close-up of a dendrite end containing a central TCR cluster (arrow) in a dendrite that persisted 7 days. Scale bars, 20 µm; ***P <


12 Supplementary Fig. 5 V a γ 5 NKG2D Overlay * V γ 5-depth b V γ 5 NKG2D 60 z = 0 NFI * - 8 µm Distance (µm) 12
13 Supplementary Figure 5. Unlike Vγ5 TCR, NKG2D is not polarized toward the ends of dendrites at steady state. (a) Confocal microscopy of a wild-type mouse skin stained for Vγ5 TCR (red) and NKG2D (green). The arrowheads indicate the apical dendrites. (b) Fluorescence intensity profiles for Vγ5 TCR and NKG2D staining normalized to the local maximum (NFI) along the dashed line drawn along the dendrite marked with an asterisk in a. Scale bar, 5 µm. Data show one representative of at least two independent experiments. 13


14 Supplementary Fig. 6 a Cd247 / WT CD3ε py(142)-cd3ζ py(142)-cd3ζ CD3ε py(142)-cd3ζ py(142)-cd3ζ b C57BL/6 AKR C3H/HeN Vγ5 py(142)-cd3ζ BALB/c FVB/NJ py(142)-cd3ζ c XY view apical dendrite XZ view YZ view γδ TCR-depth Vγ5 py(142)-cd3ζ F-actin downward/horizontal dendrite T-shaped ends Vγ5 py(142)-cd3ζ elongated PALPs d z=0-14 µm Overlay py-free TCR cluster Conventional Vγ5 py(142)-cd3ζ Germ-free py(142)-cd3ζ Vγ5 py(142)-cd3ζ 14 py(142)-cd3ζ
15 Supplementary Figure 6. TCR/CD3ζ tyrosine phosphorylation at the ends of dendrites is common in different mouse strains and does not depend on microbiota. (a) Specificity control for py(142)-cd3ζ staining by comparing signals upon staining the skin from wildtype or Cd247 -/- mice. (b) Confocal microscopy of untreated skin biopsies from different strains of mice showing steady-state apical phosphorylation of CD3ζ. (c) Confocal microscopy of skin biopsies from AKR mice. Left top panel: Color-coded depth projections of a DETC (based on γδ TCR staining). Left bottom panel: AKR PALPs are elongated and some contain non-phosphorylated TCR clusters (arrows). Right panel: AKR PALPs align with squamous keratinocyte junctions (arrows). (d) Tyrosine phosphorylation of CD3ζ is unaffected in the skin in germ-free Swiss Webster mice. Scale bars, 10 µm. 15


16 Supplementary Fig. 7 a FcεR1γ CD3ε py(142)-cd3ζ Overlay b WT Tcrd / chimera CD3ε py(142)-cd3ζ Vγ5 NT 1 Overlay CD3 XL WT NT 1 XZ view of cell 1 Sc py(142)-cd3ζ ( 104) (FAU) CD3 XL Tcrd / 6 **** Vγ5+ 16 Vγ5
17 Supplementary Figure 7. TCR functionality in DETCs in wild-type, Tcrd -/- and wild-type Tcrd -/- chimeric mice. (a) Intradermal injection of biotinylated anti-cd3ε cross-linking antibody induces extensive phosphorylation of CD3ζ both in wild-type and Tcrd -/- DETCs. The skin was fixed after 4 h and stained with py(142)-cd3ζ. In addition, fluorescent-labeled streptavidin confirms intravital CD3ε binding. The cell body is visualized based on for FcεR1γ. Note that FcεR1γ, which is known to incorporate in γδ TCR complexes, is recruited to PALPs as expected. Since py(142)-cd3ζ is induced across the cell membrane, including outside PALPs in wild-type and in Tcrd -/- DETCs, all TCRs are accessible for ligand binding and functional. Data show one representative of at least two independent experiments. (b) Putative apical ligand for V γ 5 TCR is present in Tcrd -/- epidermis and the microenvironment supports PALP formation. Wild-type fetal thymocytes were transferred into newborn Tcrd -/- recipient, and six weeks later the ear skin of the recipient was stained for V γ 5, CD3ε, and py(142)-cd3ζ. Note that unlike the host-derived V γ 5 - CD3 + DETCs, the donor-derived V γ 5 + cell has an apically directed dendrite that ends with a PALP including py(142)-cd3ζ. The graph quantifies the results in terms of py(142)-cd3ζ levels in whole cells. n=13 (V γ 5 + ) and 47 (V γ 5 - ) cells, ****P < Scale bars, 10 µm. 17
 400 300 200 NS d")
18 Supplementary Fig. 8 a V γ 5 LFA-1 Overlay V γ 5-depth z = 0-7µm b NFI V γ 5 LFA-1 c LFA-1 (FAU) NS d WT Tcrd / Distance (µm) 20 0 WT Tcrd / LFA-1 18
19 Supplementary Figure 8. Co-clustering of LFA-1 with V γ 5 TCR at the ends of apical dendrites. (a) Whole-mount fixed skin from a C57BL/6 mouse was stained for V γ 5 TCR and LFA-1. As in all other confocal imaging, fluorescence was excited sequentially and no bleed-through signals were observed in singly stained specimens (not shown). The arrowheads show apical co-clustering. Scale bar, 10 µm. (b) V γ 5 TCR and LFA-1 image intensity profiles in a typical DETC along the dashed line in a. (c, d) LFA-1 levels do not change in the absence of γδ TCR as quantified by flow cytometry in epidermal cell suspensions from wild-type and Tcrd -/- mice, gated on CD3 + cells. Each symbol represents the mean from one mouse. The bars are the overall means. The graph in d shows representative histograms. Data show one representative of at least two independent experiments. 19


 c In")


20 Supplementary Fig. 9 a γδ TCR CD45 Overlay γδ TCR-depth C57BL/6 z = 0-11µm AKR z = 0-14µm b γδ TCR CD45 Overlay C57BL/6 V γ 5 CD45 Overlay AKR NFI NFI 100 γδ TCR 80 CD Distance (µm) V γ 5 CD Distance (µm) c In epidermis In vitro TCR/CD45 ratio A A B C D *** B C D γδ TCR CD A B C D A B C D 20
21 Supplementary Figure 9. CD45 patterning in C57BL/6 and AKR mice. (a) Confocal microscopy of skin biopsies from C57BL/6 and AKR mice stained for γδ TCR (red) and CD45 (green) showing CD45 separation from γδ TCR in apical dendrites in DETCs visible as orange rather than yellow tint in the overlay. The depth is color-coded based on the TCR signal, and the arrowheads indicate the apical dendrites. (b) Maximum intensity projections of three to five confocal sections (z-step, 0.2 µm) of the stained skin as in a. The fluorescence intensity profiles were drawn along the indicated lines. (c) The differential distribution of CD45 and γδ TCR is evident in skin-resident but not in vitro-cultured DETCs. The TCR to CD45 ratios were quantified in four regions along dendrites as marked with the capital letters. The in vitro DETC is the 7-17 DETC line. The data was analyzed with the Friedman test, followed by Page s trend test. ***P < 0.001, n=41 (epidermis) and 12 (in vitro cultured) cells. The white scale bars, 5 µm; the yellow scale bars, 1 µm. Data show one representative of at least two independent experiments. 21
22 LEGENDS FOR SUPPLEMENTARY VIDEOS Supplementary Video 1 Apical dendrites are stably anchored. A 3.5-h time lapse shows the motility of DETCs in an IL2p8- GFP mouse. The GFP signal is represented as a color-coded depth projection. Note the dichotomy of dendrite anchoring depending on the vertical position of the dendrites. The DETC mid-bodies are immobilized. The fast moving cell is a GFP low dermal T cell. Supplementary Video 2 Three-dimensional confocal visualization of DETCs forming apical PALPs in healthy epidermis. Part 1: Travel through a confocal z-stack from the apical stratum corneum down through the epidermis and into the dermis in the skin from an IL2p8-GFP transgenic mouse. Cell boundaries were visualized by staining with FM4-64. The color-coded projection is based on the GFP signal. Note that DETCs extend projections toward squamous keratinocytes, ending with bulbous swellings. Asterisks indicate apical dendrites (blue tint). See also Supplementary Fig. 1b. Part 2: Three-dimensional visualization of DETC morphology in an AKR mouse using iso-surface rendering. The cell surface of the DETCs (red) was reconstructed from the γδ TCR signal. The green signal represents CD45 fluorescence of Langerhans cells. Part 3: Three-dimensional visualization of a group of DETCs in an IL2p8-GFP mouse stained for py. Note that the massive clusters of tyrosine-phosphorylated proteins are only present at the ends of apical dendrites. Part 4: A single DETC stained for γδ TCR and py. Supplementary Video 3 Intravital dynamics-immunosignal correlative microscopy shows that DETC dendrites are anchored in the apical epidermis through PALPs depending on γδ TCR. In a side-by-side representation, the first part shows the in vivo dynamics of several DETCs in wild-type (left) or Tcrd -/- mouse (right) over the course of 60 min. This dynamics is also represented in color-coded scale whereby the red represents persistence for at least 50 min, and the orange, yellow, green, and cyan colors represent areas of decreasing persistence in 10 min steps. Immediately after the recording, the skin was fixed, analyzed by immunofluorescence for CD3ε and phosphoproteins, and aligned with the intravital video. Note that the sites of dendrite anchoring that are apically located and enriched in TCR(CD3ε) and py are numerous in wild-type and infrequent in Tcrd -/- mice. Corresponds to Fig. 1a. 22
23 Supplementary Video 4 Anchoring of apical dendrites depends on γδ TCR. Comparison of DETC motility in wild-type- and Tcrd -/- - IL2p8-GFP reporter mice. Two color-coded time lapses are shown in a sequence. The arrows indicate anchored points that persisted during the 2-h recording. Supplementary Video 5 Anchoring of apical dendrites depends on V γ 5 TCR. Using the intravital dynamics-immunosignal correlative microscopy, the dynamics of DETCs in a wild-type IL2p8-GFP mouse was recorded followed by skin fixation and staining for V γ 5 γδ TCR. The cells that were immobilized throughout the 2-h recording (labeled with asterisks) express V γ 5 TCR, as shown in the last frame. See also Fig 1i, j. Supplementary Video 6 DETCs remain anchored for days. The movie shows the 28-day DETC persistence experiment in which the same group of cells was tracked over time every 12 h in a repeatedly anesthetized IL2p8- GFP mouse. The red asterisk in the first frame indicates the cell that is represented in more detail in Supplementary Fig. 3d, e. The white arrowheads indicate DETCs about to undergo division and the red arrowheads indicate the resulting daughter cells. Immediately after the last intravital recording, the skin was fixed and analyzed for py levels (shown is a composite of several images). In the tracking analysis image, green spheres correspond to the DETCs; the track lines are time-coded, and arrows show the track displacements. Cells that disappeared or underwent a division are labeled with symbols, with a number indicating a time point when the event occurred. Supplementary Video 7 DETC dynamics in response to stress stimuli. The analysis of DETC motility in stressed tissue. The movie contains a series of 2-h (or longer) intravital recordings of DETC motility at steady state, after punch biopsy and after applying two different doses of PMA in anesthetized IL2p8-GFP mice. The stress-affected areas were imaged 6 min, 24 h or 72 h after the stress stimulus was applied. The 2-h recordings are followed by a time-projection image based on six movie frames (every 24 min) showing DETC immobilization (immobilized area in red). The asterisk indicates a wound border-proximal DETC, with bulbous swellings at the dendrite ends (characteristic of PALPs) that detaches the dendrites after punch biopsy. The second steady-state movie and PMA (20 µg/ml) present in the same field of view 23
24 before and 24 h after the treatment. Arrowheads indicate the anchored dendrites at steady state that persisted despite PMA application and the detachment of the majority of dendrites. Supplementary Video 8 Skin inflammation after TLR9 stimulation induces redistribution of TCR signaling. Untreated or CpG-A 2219 injected skin from an IL2p8-GFP mouse (9 days after treatment) was stained for py(142)- CD3ζ (green) and F-actin (white); the GFP signal is in red. In addition, collagen fibers in the dermis were visualized by second harmonic generation using 2-photon microscopy. The three-dimensional rendering is based on XY stacks of images using the Imaris software. Supplementary Video 9 DETC-Langerhans cell synapse. This movie shows a 3D rotation of a DETC-LC conjugate that formed 9 days after intradermal injection of CpG-A 2219 into a CD11c-YFP mouse. The skin was harvested and stained for py(142)-cd3ζ (green) and V γ 5 TCR (red). The YFP signal from a LC is in blue. 24
Nature Immunology: doi: /ni.3631
 Supplementary Figure 1 SPT analyses of Zap70 at the T cell plasma membrane. (a) Total internal reflection fluorescent (TIRF) excitation at 64-68 degrees limits single molecule detection to 100-150 nm above
CD4 and CD8 T cells show a similar accumulation in the tumor stroma.
 Fig S1 CD4 Fibronectin EpCM CD8 CD4 and CD8 T cells show a similar accumulation in the tumor stroma. Fluorescently-labeled CD4 (CMFD, green) and CD8 (Hoechst, yellow) T cells were added to a human lung
Endogenous TNFα orchestrates the trafficking of neutrophils into and within lymphatic vessels during acute inflammation
 SUPPLEMENTARY INFORMATION Endogenous TNFα orchestrates the trafficking of neutrophils into and within lymphatic vessels during acute inflammation Samantha Arokiasamy 1,2, Christian Zakian 1, Jessica Dilliway
Type of file: PDF Title of file for HTML: Supplementary Information Description: Supplementary Figures
 Type of file: PDF Title of file for HTML: Supplementary Information Description: Supplementary Figures Type of file: MOV Title of file for HTML: Supplementary Movie 1 Description: NLRP3 is moving along
Supplementary Information. Tissue-wide immunity against Leishmania. through collective production of nitric oxide
 Supplementary Information Tissue-wide immunity against Leishmania through collective production of nitric oxide Romain Olekhnovitch, Bernhard Ryffel, Andreas J. Müller and Philippe Bousso Supplementary
Supplementary Figure 1
 Supplementary Figure 1 The average sigmoid parametric curves of capillary dilation time courses and average time to 50% peak capillary diameter dilation computed from individual capillary responses averaged
Supplementary Figure 1 Lymphocytes can be tracked for at least 4 weeks after
 Supplementary Figure 1 Lymphocytes can be tracked for at least 4 weeks after photoconversion by using H2B-Dendra2. 4-5 PPs of H2B-Dendra2 BM chimeras were photoconverted and analyzed 7 days (upper panel)
Supplementary Figure 1 IMQ-Induced Mouse Model of Psoriasis. IMQ cream was
 Supplementary Figure 1 IMQ-Induced Mouse Model of Psoriasis. IMQ cream was painted on the shaved back skin of CBL/J and BALB/c mice for consecutive days. (a, b) Phenotypic presentation of mouse back skin
Suppl Video: Tumor cells (green) and monocytes (white) are seeded on a confluent endothelial
 and monocytes (white) are seeded on a confluent endothelial") Supplementary Information Häuselmann et al. Monocyte induction of E-selectin-mediated endothelial activation releases VE-cadherin junctions to promote tumor cell extravasation in the metastasis cascade
Supplementary Information Häuselmann et al. Monocyte induction of E-selectin-mediated endothelial activation releases VE-cadherin junctions to promote tumor cell extravasation in the metastasis cascade
Supplementary Information
 Nature Immunology doi:1.138/ni.2477 Supplementary Information Capillary and arteriolar pericytes attract innate leukocytes exiting through venules and instruct them with pattern recognition and motility
Hua Tang, Weiping Cao, Sudhir Pai Kasturi, Rajesh Ravindran, Helder I Nakaya, Kousik
 SUPPLEMENTARY FIGURES 1-19 T H 2 response to cysteine-proteases requires dendritic cell-basophil cooperation via ROS mediated signaling Hua Tang, Weiping Cao, Sudhir Pai Kasturi, Rajesh Ravindran, Helder
Nature Biotechnology: doi: /nbt.3828
 Supplementary Figure 1 Development of a FRET-based MCS. (a) Linker and MA2 modification are indicated by single letter amino acid code. indicates deletion of amino acids and N or C indicate the terminus
PHENOTYPIC DYNAMICS OF MICROGLIAL AND MONOCYTE-DERIVED CELLS IN GLIOBLASTOMA-BEARING MICE.
 SUPPLEMENTARY FIGURES, TABLES AND VIDEOS PHENOTYPIC DYNAMICS OF MICROGLIAL AND MONOCYTE-DERIVED CELLS IN GLIOBLASTOMA-BEARING MICE. Clément Ricard 1,2,3,4, Aurélie Tchoghandjian 2,4, Hervé Luche 5, Pierre
Supplementary Figure 1. Nature Neuroscience: doi: /nn.4547
 Supplementary Figure 1 Characterization of the Microfetti mouse model. (a) Gating strategy for 8-color flow analysis of peripheral Ly-6C + monocytes from Microfetti mice 5-7 days after TAM treatment. Living
SUPPLEMENTARY INFORMATION
 1. Supplementary Figures and Legends Supplementary Fig. 1. S1P-mediated transcriptional regulation of integrins expressed in OP/monocytoid cells. Real-time quantitative PCR analyses of mrna for two integrins,
CD3 coated cover slips indicating stimulatory contact site, F-actin polymerization and
 SUPPLEMENTAL FIGURES FIGURE S1. Detection of MCs. A, Schematic representation of T cells stimulated on anti- CD3 coated cover slips indicating stimulatory contact site, F-actin polymerization and microclusters.
Supplemental Data Figure S1 Effect of TS2/4 and R6.5 antibodies on the kinetics of CD16.NK-92-mediated specific lysis of SKBR-3 target cells.
 Supplemental Data Figure S1. Effect of TS2/4 and R6.5 antibodies on the kinetics of CD16.NK-92-mediated specific lysis of SKBR-3 target cells. (A) Specific lysis of IFN-γ-treated SKBR-3 cells in the absence
(a) Significant biological processes (upper panel) and disease biomarkers (lower panel)
 Significant biological processes (upper panel) and disease biomarkers (lower panel)") Supplementary Figure 1. Functional enrichment analyses of secretomic proteins. (a) Significant biological processes (upper panel) and disease biomarkers (lower panel) 2 involved by hrab37-mediated secretory
Supplementary Figure 1. Functional enrichment analyses of secretomic proteins. (a) Significant biological processes (upper panel) and disease biomarkers (lower panel) 2 involved by hrab37-mediated secretory
MATERIALS AND METHODS. Neutralizing antibodies specific to mouse Dll1, Dll4, J1 and J2 were prepared as described. 1,2 All
 MATERIALS AND METHODS Antibodies (Abs), flow cytometry analysis and cell lines Neutralizing antibodies specific to mouse Dll1, Dll4, J1 and J2 were prepared as described. 1,2 All other antibodies used
Nature Immunology: doi: /ni Supplementary Figure 1. Cytokine pattern in skin in response to urushiol.
 Supplementary Figure 1 Cytokine pattern in skin in response to urushiol. Wild-type (WT) and CD1a-tg mice (n = 3 per group) were sensitized and challenged with urushiol (uru) or vehicle (veh). Quantitative
Supplementary Figure 1 Expression of Crb3 in mouse sciatic nerve: biochemical analysis (a) Schematic of Crb3 isoforms, ERLI and CLPI, indicating the
 Schematic of Crb3 isoforms, ERLI and CLPI, indicating the") Supplementary Figure 1 Expression of Crb3 in mouse sciatic nerve: biochemical analysis (a) Schematic of Crb3 isoforms, ERLI and CLPI, indicating the location of the transmembrane (TM), FRM binding (FB)
Supplementary Figure 1 Expression of Crb3 in mouse sciatic nerve: biochemical analysis (a) Schematic of Crb3 isoforms, ERLI and CLPI, indicating the location of the transmembrane (TM), FRM binding (FB)
SUPPLEMENTARY INFORMATION
 DOI: 10.1038/ncb2294 Figure S1 Localization and function of cell wall polysaccharides in root hair cells. (a) Spinning-disk confocal sections of seven day-old A. thaliana seedlings stained with 0.1% S4B
Supplementary Figure 1. Mother centrioles can reduplicate while in the close association
 C1-GFP distance (nm) C1-GFP distance (nm) a arrested HeLa cell expressing C1-GFP and Plk1TD-RFP -3 s 1 2 3 4 5 6 7 8 9 11 12 13 14 16 17 18 19 2 21 22 23 24 26 27 28 29 3 b 9 8 7 6 5 4 3 2 arrested HeLa
Supplementary Figure 1. Characterization of NMuMG-ErbB2 and NIC breast cancer cells expressing shrnas targeting LPP. NMuMG-ErbB2 cells (a) and NIC
 and NIC") Supplementary Figure 1. Characterization of NMuMG-ErbB2 and NIC breast cancer cells expressing shrnas targeting LPP. NMuMG-ErbB2 cells (a) and NIC cells (b) were engineered to stably express either a LucA-shRNA
Supplementary Figure 1. Characterization of NMuMG-ErbB2 and NIC breast cancer cells expressing shrnas targeting LPP. NMuMG-ErbB2 cells (a) and NIC cells (b) were engineered to stably express either a LucA-shRNA
Supplementary table and figures
 3D single molecule tracking with multifocal plane microscopy reveals rapid intercellular transferrin transport at epithelial cell barriers Sripad Ram, Dongyoung Kim, Raimund J. Ober and E. Sally Ward Supplementary
and follicular helper T cells is Egr2-dependent. (a) Diagrammatic representation of the
 Diagrammatic representation of the") Supplementary Figure 1. LAG3 + Treg-mediated regulation of germinal center B cells and follicular helper T cells is Egr2-dependent. (a) Diagrammatic representation of the experimental protocol for the
Supplementary Figure 1. LAG3 + Treg-mediated regulation of germinal center B cells and follicular helper T cells is Egr2-dependent. (a) Diagrammatic representation of the experimental protocol for the
F-actin VWF Vinculin. F-actin. Vinculin VWF
 a F-actin VWF Vinculin b F-actin VWF Vinculin Supplementary Fig. 1. WPBs in HUVECs are located along stress fibers and at focal adhesions. (a) Immunofluorescence images of f-actin (cyan), VWF (yellow),
Supplementary Figure 1. IDH1 and IDH2 mutation site sequences on WHO grade III
 Supplementary Materials: Supplementary Figure 1. IDH1 and IDH2 mutation site sequences on WHO grade III patient samples. Genomic DNA samples extracted from punch biopsies from either FFPE or frozen tumor
Supplemental Information. Otic Mesenchyme Cells Regulate. Spiral Ganglion Axon Fasciculation. through a Pou3f4/EphA4 Signaling Pathway
 Neuron, Volume 73 Supplemental Information Otic Mesenchyme Cells Regulate Spiral Ganglion Axon Fasciculation through a Pou3f4/EphA4 Signaling Pathway Thomas M. Coate, Steven Raft, Xiumei Zhao, Aimee K.
genome edited transient transfection, CMV promoter
 Supplementary Figure 1. In the absence of new protein translation, overexpressed caveolin-1-gfp is degraded faster than caveolin-1-gfp expressed from the endogenous caveolin 1 locus % loss of total caveolin-1-gfp
Nature Neuroscience: doi: /nn Supplementary Figure 1. ACx plasticity is required for fear conditioning.
 Supplementary Figure 1 ACx plasticity is required for fear conditioning. (a) Freezing time of conditioned and control mice before CS presentation and during CS presentation in a new context. Student s
Ahtiainen et al., http :// /cgi /content /full /jcb /DC1
 Supplemental material JCB Ahtiainen et al., http ://www.jcb.org /cgi /content /full /jcb.201512074 /DC1 THE JOURNAL OF CELL BIOLOGY Figure S1. Distinct distribution of different cell cycle phases in the
were isolated from the freshly drawn blood of healthy donors and ACS patients using the
 Supplemental Figure 1. Quality control of CD4 + T-cell purification. CD4 + T cells were isolated from the freshly drawn blood of healthy donors and ACS patients using the RosetteSep CD4 + T Cell Enrichment
A549 and A549-fLuc cells were maintained in high glucose Dulbecco modified
 Cell culture and animal model A549 and A549-fLuc cells were maintained in high glucose Dulbecco modified Eagle medium supplemented with 10% fetal bovine serum at 37 C in humidified atmosphere containing
Santulli G. et al. A microrna-based strategy to suppress restenosis while preserving endothelial function
 ONLINE DATA SUPPLEMENTS Santulli G. et al. A microrna-based strategy to suppress restenosis while preserving endothelial function Supplementary Figures Figure S1 Effect of Ad-p27-126TS on the expression
Afferent lymph-derived T cells and dendritic cells use different CCR7-dependent routes for lymph node entry and intranodal migration
 Braun et al. Supplementary Information 1 Supplementary Information Afferent lymph-derived T cells and dendritic cells use different CCR7-dependent routes for lymph node entry and intranodal migration Asolina
supplementary information
 DOI: 10.1038/ncb2133 Figure S1 Actomyosin organisation in human squamous cell carcinoma. (a) Three examples of actomyosin organisation around the edges of squamous cell carcinoma biopsies are shown. Myosin
Supplementary Figure 1. SDS-FRL localization of CB 1 in the distal CA3 area of the rat hippocampus. (a-d) Axon terminals (t) in stratum pyramidale
 Axon terminals (t) in stratum pyramidale") Supplementary Figure 1. SDS-FRL localization of CB 1 in the distal CA3 area of the rat hippocampus. (a-d) Axon terminals (t) in stratum pyramidale (b) show stronger immunolabeling for CB 1 than those in
Supplementary Figure 1. SDS-FRL localization of CB 1 in the distal CA3 area of the rat hippocampus. (a-d) Axon terminals (t) in stratum pyramidale (b) show stronger immunolabeling for CB 1 than those in
Supplementary information. The Light Intermediate Chain 2 Subpopulation of Dynein Regulates Mitotic. Spindle Orientation
 Supplementary information The Light Intermediate Chain 2 Subpopulation of Dynein Regulates Mitotic Spindle Orientation Running title: Dynein LICs distribute mitotic functions. Sagar Mahale a, d, *, Megha
J. Cell Sci. 129: doi: /jcs : Supplementary information
 Movie 1. AgLDL is contained in small sub-regions of the lysosomal synapse that are acidic. J774 cells were incubated with agldl dual labeled with a ph sensitive and a ph insensitive fluorophore for 1 hr.
Supplementary Figure 1: GFAP positive nerves in patients with adenocarcinoma of
 SUPPLEMENTARY FIGURES AND MOVIE LEGENDS Supplementary Figure 1: GFAP positive nerves in patients with adenocarcinoma of the pancreas. (A) Images of nerves stained for GFAP (green), S100 (red) and DAPI
Supplementary Material
 Supplementary Material accompanying the manuscript Interleukin 37 is a fundamental inhibitor of innate immunity Marcel F Nold, Claudia A Nold-Petry, Jarod A Zepp, Brent E Palmer, Philip Bufler & Charles
Macrophages form functional vascular mimicry channels in vivo. SI Figures and Legend
 Macrophages form functional vascular mimicry channels in vivo Authors: *Faith H. Barnett, *Mauricio Rosenfeld, Malcolm Wood, William Kiosses, Yoshihiko Usui, Valentina Marchetti, Edith Aguilar, and Martin
Figure S1. Western blot analysis of clathrin RNA interference in human DCs Human immature DCs were transfected with 100 nm Clathrin SMARTpool or
 Figure S1. Western blot analysis of clathrin RNA interference in human DCs Human immature DCs were transfected with 100 nm Clathrin SMARTpool or control nontargeting sirnas. At 90 hr after transfection,
Supplementary Figure 1: TSLP receptor skin expression in dcssc. A: Healthy control (HC) skin with TSLP receptor expression in brown (10x
 skin with TSLP receptor expression in brown (10x") Supplementary Figure 1: TSLP receptor skin expression in dcssc. A: Healthy control (HC) skin with TSLP receptor expression in brown (10x magnification). B: Second HC skin stained for TSLP receptor in brown
Supplementary Figure 1: TSLP receptor skin expression in dcssc. A: Healthy control (HC) skin with TSLP receptor expression in brown (10x magnification). B: Second HC skin stained for TSLP receptor in brown
SUPPLEMENTARY INFORMATION
 Supplemental Figure 1. Furin is efficiently deleted in CD4 + and CD8 + T cells. a, Western blot for furin and actin proteins in CD4cre-fur f/f and fur f/f Th1 cells. Wild-type and furin-deficient CD4 +
Supplementary Materials
 Supplementary Materials 43 Figure S1. CD123 in acute lymphoblastic leukemia and leukemia-initiating cells. A. CD123 (histograms) is highly and homogenously expressed in B-ALL blasts (as defined by live,
Supplemental Figure 1. Quantification of proliferation in thyroid of WT, Ctns -/- and grafted
 Supplemental Figure 1. Quantification of proliferation in thyroid of WT, Ctns -/- and grafted Ctns -/- mice. Cells immunolabeled for the proliferation marker (Ki-67) were counted in sections (n=3 WT, n=4
Tanimoto et al., http ://www.jcb.org /cgi /content /full /jcb /DC1
 Supplemental material JCB Tanimoto et al., http ://www.jcb.org /cgi /content /full /jcb.201510064 /DC1 THE JOURNAL OF CELL BIOLOGY Figure S1. Method for aster 3D tracking, extended characterization of
Supplementary Figure 1 CD4 + T cells from PKC-θ null mice are defective in NF-κB activation during T cell receptor signaling. CD4 + T cells were
 Supplementary Figure 1 CD4 + T cells from PKC-θ null mice are defective in NF-κB activation during T cell receptor signaling. CD4 + T cells were isolated from wild type (PKC-θ- WT) or PKC-θ null (PKC-θ-KO)
Specimen. Humeral Head. Femoral Head. Objective. Femoral Condyle (medial) Supplementary Figure 1
 Supplementary Figure 1") A B Specimen Humeral Head 2 1 µm 76 µm Femoral Head Objective Femoral Condyle (medial) Supplementary Figure 1 A Femoral Head Global Cell Density Superficial Cell Density Cell Number at 1 µm Nuclei /.1
A B Specimen Humeral Head 2 1 µm 76 µm Femoral Head Objective Femoral Condyle (medial) Supplementary Figure 1 A Femoral Head Global Cell Density Superficial Cell Density Cell Number at 1 µm Nuclei /.1
SUPPLEMENTAL INFORMATION FOR. PAX7 expression defines germline stem cells in the adult testis
 SUPPLEMENTAL INFORMATION FOR PAX7 expression defines germline stem cells in the adult testis Gina M. Aloisio, Yuji Nakada, Hatice D. Saatcioglu, Christopher G. Peña, Michael D. Baker, Edward D. Tarnawa,
TFEB-mediated increase in peripheral lysosomes regulates. Store Operated Calcium Entry
 TFEB-mediated increase in peripheral lysosomes regulates Store Operated Calcium Entry Luigi Sbano, Massimo Bonora, Saverio Marchi, Federica Baldassari, Diego L. Medina, Andrea Ballabio, Carlotta Giorgi
Supplementary Data Dll4-containing exosomes induce capillary sprout retraction ina 3D microenvironment
 Supplementary Data Dll4-containing exosomes induce capillary sprout retraction ina 3D microenvironment Soheila Sharghi-Namini 1, Evan Tan 1,2, Lee-Ling Sharon Ong 1, Ruowen Ge 2 * and H. Harry Asada 1,3
Acid sphingomyelinase is a critical regulator of cytotoxic granule secretion by
 Supplementary Data Acid sphingomyelinase is a critical regulator of cytotoxic granule secretion by primary T lymphocytes Jasmin Herz, Julian Pardo, Hamid Kashkar, Michael Schramm, Elza Kuzmenkina, Erik
Supplementary Figure 1. ETBF activate Stat3 in B6 and Min mice colons
 Supplementary Figure 1 ETBF activate Stat3 in B6 and Min mice colons a pstat3 controls Pos Neg ETBF 1 2 3 4 b pstat1 pstat2 pstat3 pstat4 pstat5 pstat6 Actin Figure Legend: (a) ETBF induce predominantly
SUPPLEMENTARY INFORMATION
 doi:1.138/nature1554 a TNF-α + in CD4 + cells [%] 1 GF SPF 6 b IL-1 + in CD4 + cells [%] 5 4 3 2 1 Supplementary Figure 1. Effect of microbiota on cytokine profiles of T cells in GALT. Frequencies of TNF-α
Interferon γ regulates idiopathic pneumonia syndrome, a. Th17 + CD4 + T-cell-mediated GvH disease
 Interferon γ regulates idiopathic pneumonia syndrome, a Th17 + CD4 + T-cell-mediated GvH disease Nora Mauermann, Julia Burian, Christophe von Garnier, Stefan Dirnhofer, Davide Germano, Christine Schuett,
Supporting Information
 Supporting Information Desnues et al. 10.1073/pnas.1314121111 SI Materials and Methods Mice. Toll-like receptor (TLR)8 / and TLR9 / mice were generated as described previously (1, 2). TLR9 / mice were
Fisher et al. Supplemental Figure 1
 Supplemental Figure 1 A TNF IL-1 IL-6 CCL2 CCL5 CXCL10 pg/mg total protein 50 30 10 4,000 3,000 2,000 1,000 n.d. 1 1 14,000 12,000 10,000 8,000 6,000 4,000 2,000 6,000,000 CT26 5,000 16,000 B16 4,000 12,000
Supplements. Figure S1. B Phalloidin Alexa488
 Supplements A, DMSO, PP2, PP3 Crk-myc Figure S1. (A) Src kinase activity is necessary for recruitment of Crk to Nephrin cytoplasmic domain. Human podocytes expressing /7-NephrinCD () were treated with
Supplementary Figures
 Inhibition of Pulmonary Anti Bacterial Defense by IFN γ During Recovery from Influenza Infection By Keer Sun and Dennis W. Metzger Supplementary Figures d a Ly6G Percentage survival f 1 75 5 1 25 1 5 1
GFP/Iba1/GFAP. Brain. Liver. Kidney. Lung. Hoechst/Iba1/TLR9!
 Supplementary information a +KA Relative expression d! Tlr9 5!! 5! NSC Neuron Astrocyte Microglia! 5! Tlr7!!!! NSC Neuron Astrocyte! GFP/Sβ/! Iba/Hoechst Microglia e Hoechst/Iba/TLR9! GFP/Iba/GFAP f Brain
Essential Medium, containing 10% fetal bovine serum, 100 U/ml penicillin and 100 µg/ml streptomycin. Huvec were cultured in
 Supplemental data Methods Cell culture media formulations A-431 and U-87 MG cells were maintained in Dulbecco s Modified Eagle s Medium. FaDu cells were cultured in Eagle's Minimum Essential Medium, containing
a 10 4 Link et al. Supplementary Figure 1 Nature Immunology: doi: /ni.1842 Cells per mouse ( 10 5 ) TRPV2KO anti-gr1 anti-gr anti-f4/80
 TRPV2KO anti-gr1 anti-gr anti-f4/80") a 10 4 WT 10 4 TRPV2KO 10 3 10 3 anti-gr1 10 2 10 1 anti-gr1 10 2 10 1 10 0 10 0 10 1 10 2 10 3 10 4 anti-f4/80 42.3 45.2 10 0 10 0 10 1 10 2 10 3 10 4 anti-f4/80 10 4 10 4 40 42.5 anti-cd11b 10 3 10 2
a 10 4 WT 10 4 TRPV2KO 10 3 10 3 anti-gr1 10 2 10 1 anti-gr1 10 2 10 1 10 0 10 0 10 1 10 2 10 3 10 4 anti-f4/80 42.3 45.2 10 0 10 0 10 1 10 2 10 3 10 4 anti-f4/80 10 4 10 4 40 42.5 anti-cd11b 10 3 10 2
SUPPLEMENTARY INFORMATION
 DOI:.38/ncb3399 a b c d FSP DAPI 5mm mm 5mm 5mm e Correspond to melanoma in-situ Figure a DCT FSP- f MITF mm mm MlanaA melanoma in-situ DCT 5mm FSP- mm mm mm mm mm g melanoma in-situ MITF MlanaA mm mm
Intravital Microscopic Interrogation of Peripheral Taste Sensation
 Supplementary Information Intravital Microscopic Interrogation of Peripheral Taste Sensation Myunghwan Choi 1, Woei Ming Lee 1,2, and Seok-Hyun Yun 1 * 1 Harvard Medical School and Wellman Center for Photomedicine,
Supplementary Figure 1: Co-localization of reconstituted L-PTC and dendritic cells
 a CD11c Na + K + ATPase Na + K + ATPase CD11c x-y CD11c Na + K + ATPase Na + K + ATPase CD11c x-z c b x-y view BoNT NAPs CD11c BoNT CD11c NAPs BoNT NAPs CD11c 90 x-z view Apical Basolateral Supplementary
Supplementary Materials for
 www.sciencetranslationalmedicine.org/cgi/content/full/4/117/117ra8/dc1 Supplementary Materials for Notch4 Normalization Reduces Blood Vessel Size in Arteriovenous Malformations Patrick A. Murphy, Tyson
Supplementary Information. Conformational states of Lck regulate clustering in early T cell signaling
 Supplementary Information Conformational states of Lck regulate clustering in early T cell signaling Jérémie Rossy, Dylan M. Owen, David J. Williamson, Zhengmin Yang and Katharina Gaus Centre for Vascular
T H E J O U R N A L O F C E L L B I O L O G Y
 Supplemental material Brooks and Wallingford, http://www.jcb.org/cgi/content/full/jcb.201204072/dc1 T H E J O U R N A L O F C E L L B I O L O G Y Figure S1. Quantification of ciliary compartments in control
Serafino et al. Thymosin α1 activates complement receptor-mediated phagocytosis in human monocyte-derived macrophages. SUPPLEMENTARY FIGURES
 Supplementary Fig. S1. Evaluation of the purity and maturation of macrophage cultures tested by flow cytometry. The lymphocytic/monocytic cellular fraction was isolated from buffy coats of healthy donors
Supplementary Information
 Supplementary Information Figure S1: Follicular melanocytes in the wound peripheral area migrate to the epidermis in response to wounding stimuli. Dorsal skin of Trp2-LacZ mice stained with X-gal and analyzed
SUPPLEMENTARY INFORMATION
 doi: 10.1038/nature06994 A phosphatase cascade by which rewarding stimuli control nucleosomal response A. Stipanovich*, E. Valjent*, M. Matamales*, A. Nishi, J.H. Ahn, M. Maroteaux, J. Bertran-Gonzalez,
Supporting Online Material for
 www.sciencemag.org/cgi/content/full/1175194/dc1 Supporting Online Material for A Vital Role for Interleukin-21 in the Control of a Chronic Viral Infection John S. Yi, Ming Du, Allan J. Zajac* *To whom
Influenza virus exploits tunneling nanotubes for cell-to-cell spread
 Supplementary Information Influenza virus exploits tunneling nanotubes for cell-to-cell spread Amrita Kumar 1, Jin Hyang Kim 1, Priya Ranjan 1, Maureen G. Metcalfe 2, Weiping Cao 1, Margarita Mishina 1,
SUPPLEMENTARY INFORMATION. Involvement of IL-21 in the epidermal hyperplasia of psoriasis
 SUPPLEMENTARY INFORMATION Involvement of IL-21 in the epidermal hyperplasia of psoriasis Roberta Caruso 1, Elisabetta Botti 2, Massimiliano Sarra 1, Maria Esposito 2, Carmine Stolfi 1, Laura Diluvio 2,
Supplementary Materials for
 immunology.sciencemag.org/cgi/content/full/2/16/eaan6049/dc1 Supplementary Materials for Enzymatic synthesis of core 2 O-glycans governs the tissue-trafficking potential of memory CD8 + T cells Jossef
Programmed necrosis, not apoptosis, is a key mediator of cell loss and DAMP-mediated inflammation in dsrna-induced retinal degeneration
 Programmed necrosis, not apoptosis, is a key mediator of cell loss and DAMP-mediated inflammation in dsrna-induced retinal degeneration The Harvard community has made this article openly available. Please
Nature Neuroscience: doi: /nn Supplementary Figure 1. Large-scale calcium imaging in vivo.
 Supplementary Figure 1 Large-scale calcium imaging in vivo. (a) Schematic illustration of the in vivo camera imaging set-up for large-scale calcium imaging. (b) High-magnification two-photon image from
VEGFR2-Mediated Vascular Dilation as a Mechanism of VEGF-Induced Anemia and Bone Marrow Cell Mobilization
 Cell Reports, Volume 9 Supplemental Information VEGFR2-Mediated Vascular Dilation as a Mechanism of VEGF-Induced Anemia and Bone Marrow Cell Mobilization Sharon Lim, Yin Zhang, Danfang Zhang, Fang Chen,
Nature Biotechnology: doi: /nbt Supplementary Figure 1. Analysis of hair bundle morphology in Ush1c c.216g>a mice at P18 by SEM.
 Supplementary Figure 1 Analysis of hair bundle morphology in Ush1c c.216g>a mice at P18 by SEM. (a-c) Heterozygous c.216ga mice displayed normal hair bundle morphology at P18. (d-i) Disorganized hair bundles
SUPPLEMENTARY INFORMATION
 DOI: 1.138/ncb222 / b. WB anti- WB anti- ulin Mitotic index (%) 14 1 6 2 T (h) 32 48-1 1 2 3 4 6-1 4 16 22 28 3 33 e. 6 4 2 Time (min) 1-6- 11-1 > 1 % cells Figure S1 depletion leads to mitotic defects
Supplementary Figure S1 (a) (b)
 (b)") Supplementary Figure S1: IC87114 does not affect basal Ca 2+ level nor nicotineinduced Ca 2+ influx. (a) Bovine chromaffin cells were loaded with Fluo-4AM (1 μm) in buffer A containing 0.02% of pluronic
Supplementary Figure S1: IC87114 does not affect basal Ca 2+ level nor nicotineinduced Ca 2+ influx. (a) Bovine chromaffin cells were loaded with Fluo-4AM (1 μm) in buffer A containing 0.02% of pluronic
SUPPLEMENTARY INFORMATION
 Complete but curtailed T-cell response to very-low-affinity antigen Dietmar Zehn, Sarah Y. Lee & Michael J. Bevan Supp. Fig. 1: TCR chain usage among endogenous K b /Ova reactive T cells. C57BL/6 mice
SUPPLEMENTAL INFORMATION
 SUPPLEMENTAL INFORMATION EXPERIMENTAL PROCEDURES Tryptic digestion protection experiments - PCSK9 with Ab-3D5 (1:1 molar ratio) in 50 mm Tris, ph 8.0, 150 mm NaCl was incubated overnight at 4 o C. The
activation with anti-cd3/cd28 beads and 3d following transduction. Supplemental Figure 2 shows
 Supplemental Data Supplemental Figure 1 compares CXCR4 expression in untreated CD8 + T cells, following activation with anti-cd3/cd28 beads and 3d following transduction. Supplemental Figure 2 shows the
ROCK/Cdc42-mediated microglial motility and gliapse formation lead to phagocytosis of degenerating dopaminergic neurons in vivo
 Supplementary Information ROCK/Cdc42-mediated microglial motility and gliapse formation lead to phagocytosis of degenerating dopaminergic neurons in vivo Carlos Barcia* 1,2, Carmen M Ros 1,2, Valentina
D CD8 T cell number (x10 6 )
") IFNγ Supplemental Figure 1. CD T cell number (x1 6 ) 18 15 1 9 6 3 CD CD T cells CD6L C CD5 CD T cells CD6L D CD8 T cell number (x1 6 ) 1 8 6 E CD CD8 T cells CD6L F Log(1)CFU/g Feces 1 8 6 p
IFNγ Supplemental Figure 1. CD T cell number (x1 6 ) 18 15 1 9 6 3 CD CD T cells CD6L C CD5 CD T cells CD6L D CD8 T cell number (x1 6 ) 1 8 6 E CD CD8 T cells CD6L F Log(1)CFU/g Feces 1 8 6 p
CD14 + S100A9 + Monocytic Myeloid-Derived Suppressor Cells and Their Clinical Relevance in Non-Small Cell Lung Cancer
 CD14 + S1A9 + Monocytic Myeloid-Derived Suppressor Cells and Their Clinical Relevance in Non-Small Cell Lung Cancer Po-Hao, Feng M.D., Kang-Yun, Lee, M.D. Ph.D., Ya-Ling Chang, Yao-Fei Chan, Lu- Wei, Kuo,Ting-Yu
SUPPLEMENTARY INFORMATION
 doi:10.1038/nature10134 Supplementary Figure 1. Anti-inflammatory activity of sfc. a, Autoantibody immune complexes crosslink activating Fc receptors, promoting activation of macrophages, and WWW.NATURE.COM/NATURE
Supplementary Figure 1: Hsp60 / IEC mice are embryonically lethal (A) Light microscopic pictures show mouse embryos at developmental stage E12.
 Light microscopic pictures show mouse embryos at developmental stage E12.") Supplementary Figure 1: Hsp60 / IEC mice are embryonically lethal (A) Light microscopic pictures show mouse embryos at developmental stage E12.5 and E13.5 prepared from uteri of dams and subsequently genotyped.
Supplementary Figure 1: Hsp60 / IEC mice are embryonically lethal (A) Light microscopic pictures show mouse embryos at developmental stage E12.5 and E13.5 prepared from uteri of dams and subsequently genotyped.
Supplementary Methods: Omalizumab Trial This double-blind, randomized, placebo-controlled trial was conducted at the University of Utah Hospital and
 Supplementary Methods: Omalizumab Trial This double-blind, randomized, placebo-controlled trial was conducted at the University of Utah Hospital and Primary Children s Hospital, Salt Lake City, UT, both
Supplementary Fig. 1 p38 MAPK negatively regulates DC differentiation. (a) Western blot analysis of p38 isoform expression in BM cells, immature DCs
 Western blot analysis of p38 isoform expression in BM cells, immature DCs") Supplementary Fig. 1 p38 MAPK negatively regulates DC differentiation. (a) Western blot analysis of p38 isoform expression in BM cells, immature DCs (idcs) and mature DCs (mdcs). A myeloma cell line expressing
Supplementary Fig. 1 p38 MAPK negatively regulates DC differentiation. (a) Western blot analysis of p38 isoform expression in BM cells, immature DCs (idcs) and mature DCs (mdcs). A myeloma cell line expressing
Supplemental Information. CD4 + CD25 + Foxp3 + Regulatory T Cells Promote. Th17 Cells In Vitro and Enhance Host Resistance
 Immunity, Volume 34 Supplemental Information D4 + D25 + + Regulatory T ells Promote Th17 ells In Vitro and Enhance Host Resistance in Mouse andida albicans Th17 ell Infection Model Pushpa Pandiyan, Heather
B6/COLODR/SPL/11C/83/LAP/#2.006 B6/COLODR/SPL/11C/86/LAP/#2.016 CD11C B6/COLODR/SPL/11C/80/LAP/#2.011 CD11C
 CD3-specific antibody-induced immune tolerance and suppression of autoimmune encephalomyelitis involves TGF-β production through phagocytes digesting apoptotic T cells Sylvain Perruche 1,3, Pin Zhang 1,
Integrin v 3 targeted therapy for Kaposi s sarcoma with an in vitro evolved antibody 1
 Integrin v 3 targeted therapy for Kaposi s sarcoma with an in vitro evolved antibody 1 CHRISTOPH RADER, 2 MIKHAIL POPKOV, JOHN A. NEVES, AND CARLOS F. BARBAS III 2 Department of Molecular Biology and The
SUPPLEMENTARY INFORMATION
 DOI: 10.1038/ncb2988 Supplementary Figure 1 Kif7 L130P encodes a stable protein that does not localize to cilia tips. (a) Immunoblot with KIF7 antibody in cell lysates of wild-type, Kif7 L130P and Kif7
Figure S1: Effects on haptotaxis are independent of effects on cell velocity A)
") Supplemental Figures Figure S1: Effects on haptotaxis are independent of effects on cell velocity A) Velocity of MV D7 fibroblasts expressing different GFP-tagged Ena/VASP family proteins in the haptotaxis
Supplemental Figures Figure S1: Effects on haptotaxis are independent of effects on cell velocity A) Velocity of MV D7 fibroblasts expressing different GFP-tagged Ena/VASP family proteins in the haptotaxis
(A) RT-PCR for components of the Shh/Gli pathway in normal fetus cell (MRC-5) and a
 RT-PCR for components of the Shh/Gli pathway in normal fetus cell (MRC-5) and a") Supplementary figure legends Supplementary Figure 1. Expression of Shh signaling components in a panel of gastric cancer. (A) RT-PCR for components of the Shh/Gli pathway in normal fetus cell (MRC-5) and
Supplementary figure legends Supplementary Figure 1. Expression of Shh signaling components in a panel of gastric cancer. (A) RT-PCR for components of the Shh/Gli pathway in normal fetus cell (MRC-5) and