Win MN, Smolke CD Higher-order cellular information processing with synthetic RNA devices. Science. 322: DOI: /science.
|
|
|
- Bruce Todd
- 5 years ago
- Views:
Transcription

1 Win MN, Smolke CD Higher-order cellular information processing with synthetic RNA devices. Science. 322: DOI: /science Introduction This supplement provides additional detail on the data analysis methods and the raw data for the RNA devices presented in the published manuscript and supporting online material. The information provided in the current supplement is organized as follows: 1. Gating methods for the raw flow cytometry data 2. Correction methods for nonspecific effects on fluorescence of chemical effectors controlling the RNA devices 3. Selection of standard against which to report device performance 4. Relevance to conclusions published in the Science paper 5. Example calculations 6. Raw data for RNA devices 1. Gate for induced cell populations from the flow cytometry histograms. Analyze the mean fluorescence of the induced cell populations. Under the induction conditions used here (2% galactose), the galactose-inducible promoter system results in both induced and uninduced cell populations. We have observed that the distribution between these two populations can vary in a manner that is not correlated with media conditions or overall gene expression activity of the RNA device-containing construct. Since we are only concerned with the gene expression activity of the induced population, we run an uninduced sample (0% galactose) under identical media conditions for each construct and use this sample to set the gate for the induced population (see Figure 1 for an example). As described in the methods section of the published paper, the gene expression activity of an RNA device is reported as the mean fluorescence value of the induced population. Figure 1. The activity of RNA devices is analyzed from the induced cell population. Gates are set to analyze the induced cell population, based on running an uninduced sample under identical media conditions (histograms shown in grey). An example of the gating method is demonstrated here for strsv Contl, where the panels represent histograms for cells under different effector conditions: 0 mm theo, 0 mm tc (A); 10 mm theo (B); 0.5 mm tc (C); and 10 mm theo, 0.5 mm tc (D). A B C D 1
 can have different nonspecific effects on the fluorescence of cells.")
2 2. Correcting for nonspecific effects on fluorescence of chemical effectors for the RNA devices. The chemical effectors controlling the RNA devices (theophylline, tetracycline) can have different nonspecific effects on the fluorescence of cells. These effects are dependent on the concentration of the effectors (ligands) used and also depend on the specific cell types the devices are characterized within. Under the concentrations used here, theophylline exhibits minor nonspecific effects on cellular fluorescence in yeast. However, tetracycline exhibits significant concentration-dependent nonspecific increases on the fluorescence of cells (especially at higher concentrations) that must be corrected for in order to obtain an accurate measurement of the gene regulatory effects specific to the activity of the RNA devices. All ligand concentrations used in this study do not result in significant effects on cell growth rates. We corrected for the nonspecific effects of tetracycline by determining the increase in fluorescence as a function of tetracycline concentrations for non-switch controls that exhibit different basal levels of expression (Figure 2). The non-switch controls are ribozyme constructs harboring sensors that do not bind to tetracycline, in which their transmitter sequences have been modified to exhibit different basal expression levels. Figure 2. Fluorescence increase of non-switch controls as a function of tetracycline concentration. Each non-switch control is an RNA device that is unresponsive to tetracycline and exhibits a different basal expression level. Gene expression activities for non-switch controls are determined as described in section 1. Fluorescence values at each point are reported in the table below the graph. Ratios between the fluorescence signal in the presence and absence of ligand are also shown to highlight that the relative increase in fluorescence due to nonspecific effects of tetracycline are dependent on expression level. The amount of increase in fluorescence observed for a non-switch construct provides a measure of the nonspecific increase in fluorescence due to tetracycline. It should be noted that the correction for the tetracycline effect is dependent on the basal expression of the construct (as 2
3 observed from the data in Figure 2). As such, the appropriate correction was determined for each gate construct by matching to the appropriate non-switch control at a similar expression level (Figure 3). Figure 3. Schematic illustrating the correction for the nonspecific effects of tetracycline on fluorescence. (A) Schematic graph illustrating the relationship between cell fluorescence and tetracycline concentration for a non-switch control. The nonspecific contribution of tetracycline to fluorescence (s nonspec ) is determined as the difference between the measured fluorescence from the nonswitch control in the absence ((s 0 ) con ) and presence ((s t, meas ) con ) of tetracycline. (B) Schematic bar graph illustrating the relationship between measured fluorescence from an RNA device in the presence ((s t, meas ) dev ) and absence ((s 0 ) dev ) of tetracycline and the nonspecific (s nonspec ) and specific (s spec ) contributions of tetracycline to gene expression activity. As described in the methods section of the published paper, the gene expression activity of an RNA device is reported as the mean fluorescence value of the GFP-expressing cell population. The gene expression activity of an RNA device (s) following a correction for nonspecific effects from tetracycline fluorescence is determined by a subtraction method as: s t,spec = s t,meas ( ) dev s nonspec = ( s t,meas ) dev ( s t,meas s 0 ) con where s t,spec represents the expression activity of the device at a tetracycline concentration of t when nonspecific effects of tetracycline are removed; s t,meas represents the expression activity of the device measured under that concentration of tetracycline; s 0 represents the expression activity of the device measured in the absence of tetracycline; s nonspec represents the change in expression activity of the device as a result of nonspecific effects of tetracycline on fluorescence and is measured from a non-switch control exhibiting similar expression levels as the device of interest at that tetracycline concentration; s t,meas and s 0 can also be reported for the non-switch controls and are indicated with a subscript con. As described in the methods section of the published paper, data on RNA device performance is reported as either device signal (S d ) or device response (R d ; defined lower on this page). The device signal is the gene expression activity of an RNA device (s) relative to that of strsv 3
4 Contl (c) (S d = s/c). When using activities corrected for nonspecific effects of tetracycline using the subtraction method this is calculated as: ( ) dev s nonspec S d = s t,spec = s t,meas c t,spec c t,meas c nonspec ( ) dev ( s t,meas s 0 ) con ( ) con = s t,meas c t,meas c t,meas c 0 (eq. 1) where similar definitions apply to c for the inactive strsv Contl ribozyme (which is a nonswitch control and standard used in our system, see section 3 below). As described in the methods of the published paper, device signal is reported as a percentage by multiplying with 100%; device signal is reported in units of expression by dividing S d (as calculated above) by U ex (which represents the gene expression activity of the parental ribozyme strsv relative to that of the inactive ribozyme strsv Contl in the absence of ligands). Device response (R d,l ) is the arithmetic difference between the device signals in the absence and presence of the appropriate ligands and represented as R d,l = S d,l S d,0. Alternatively, one can correct for nonspecific effects of tetracycline through a ratio method as: s t,spec = s t,meas s ( ) 0 dev s t,meas con where terms are defined as above and the ratio of s 0 to s t,meas for the non-switch control represents a correction factor. We refer to this ratio method as the correction factor method. Either correction method ( subtraction or correction factor ) yields similar results. Using the correction factor method, device signal is calculated as: S d = s t,spec c t,spec = s ( s t,meas ) 0 dev s t,meas c c 0 t,meas c t,meas con con (eq. 2) If the correction factors for the device and strsv Contl are similar in value or if the nonspecific effects on cellular fluorescence are small, the corrected device signal can be calculated as: S d = s t,spec c t,spec s t,meas c t,meas (eq. 3) The correction factors for the device and strsv Contl are not generally similar in value for tetracycline (see data in Figure 2 above), although they become closer in value at lower tetracycline concentrations. Equation 3 can be used for theophylline, as theophylline imparts relatively minor effects on cellular fluorescence. We feel it is more accurate to carefully correct for the nonspecific effects of tetracycline using one of the methods described. Either correction may increase the reported function of devices that decrease expression activity in the presence of tetracycline and may decrease the reported function of devices that increase expression activity in the presence of tetracycline. We calculated the corrected device signal for each device construct in the presence of tetracycline 4
5 using the subtraction method described above (eq. 1), and checked the values with the correction factor method (eq. 2). We used equation 3 to calculate the corrected device signal in the presence of theophylline. In the presence of both ligands, we use equation 1 to correct for the effects of tetracycline and theophylline (see examples in section 5). 3. Characterization of device performance relative to a standard We report device activity relative to a standard, which in this work is an inactive ribozyme. As described in the published supporting information for the paper, this standard (strsv Contl) acts as a HIGH reference for the system against which devices can be compared (where HIGH represents the maximum potential gene expression activity from the device) and provides a relative measure that serves several purposes for device characterization. In particular, it provides a measure of the full potential dynamic range of the system when compared to the active ribozyme control (strsv). This measure is important in identifying the activity of the device relative to the full potential device activity and making comparative analyses of device performance across a series of devices. In addition, as recently described by Endy and colleagues (PMID: ) reporting in vivo gene expression activities relative to reference standards serves the purpose of reducing variability introduced by differences in characterization instruments (and their settings), media, and chemicals for assays performed in different laboratories and over different days. While it is acknowledged that absolute measures are useful, particularly when implementing engineered devices in specific applications, relative measures serve as a more consistent and reproducible characterization metric, allow comparison between different devices, and can be used to more efficiently optimize the integration of a device into a larger engineered system. 4. Relevance to the conclusions published in the Science paper We report device behavior by correcting for nonspecific effects of the ligands as appropriate and normalizing the expression activity of the device to that of the selected standard (strsv Contl). The behavior of 48 of the 50 devices presented in the published manuscript is apparent in the raw cytometry data (unnormalized and uncorrected) for each device (see section 6). In addition, the determination of device behavior and relative performance is not affected by the processing or correction method. For two of the devices reported in the paper, NAND1 and NAND2, the behavior of the gate is not observed directly in the raw data. Our reported behavior depends on applying either the subtraction or correction factor method for nonspecific effects of tetracycline. This is a result of the small dynamic range of these devices, the nature of these gates resulting in a decrease in device signal in the presence of tetracycline (and theophylline), and the nature of tetracycline resulting in nonspecific increases in fluorescence. As observed in the raw data (see below), there is a measurable decrease in expression activity in the presence of both ligands as opposed to just tetracycline alone where this effect is significant and reproducible, supporting the NAND gate function. We acknowledge that this device exhibits a relatively low dynamic range (~20% change from its basal level (characteristic of typical reporting practices that internally normalize response of a given device to its high signal), and ~10% change across the full dynamic range of the promoter system), and the application of this gate to regulating a specific cellular function may require optimization of this dynamic range or connection to other devices such as signal amplifiers. We are currently conducting experiments to confirm the activity of this gate through a separate characterization method. 5
6 5. Example calculation for RNA device activity First example: We work through a calculation of device activity on a NAND gate (Figure 3B from published manuscript) as an example. The raw flow cytometry histogram data are shown on page 13 of this supplement. The gene expression activities are determined as the mean fluorescence of the induced population as described earlier and reported on page 13 as well. The uncorrected gene expression activities of the RNA device under different input concentrations are reported in absolute fluorescence units (afu) as: s meas (no input) = s meas (10 mm theo) = s meas (1 mm tc)= s meas (10 mm theo, 1 mm tc) = Based on the expression levels of the device we use non-switch9 to correct for the nonspecific effects of tetracycline in the presence of tetracycline and non-switch8 to correct for the nonspecific effects of tetracycline in the presence of both ligands: s nonspec = (s 1,meas -s 0 ) non-switch9 = = s nonspec = (s 1,meas -s 0 ) non-switch8 = = It should be noted that while we are using a correction term based on the expression level from the device at the ligand concentrations of interest, the values are similar if the same correction term is used and if the correction term is determined based on the basal expression level of the device (expression level in the absence of input; which in this case would be based on nonswitch9). The tetracycline corrected gene expression activities of the device are: s spec (no input) = s spec (10 mm theo) = s spec (1 mm tc) = = s spec (10 mm theo, 1 mm tc) = = A similar calculation is performed on the gene expression activities for the standard strsv Contl as: c meas (no input) = c meas (10 mm theo) = c meas (1 mm tc) = c meas (10 mm theo, 1 mm tc) = strsv Contl is a non-switch control and the data in the absence of tetracycline for this construct can be used to correct for the nonspecific effects of tetracycline through the subtraction method as: c spec (no input) = c spec (10 mm theo) = c spec (1 mm tc) = = c spec (10 mm theo, 1 mm tc) = =
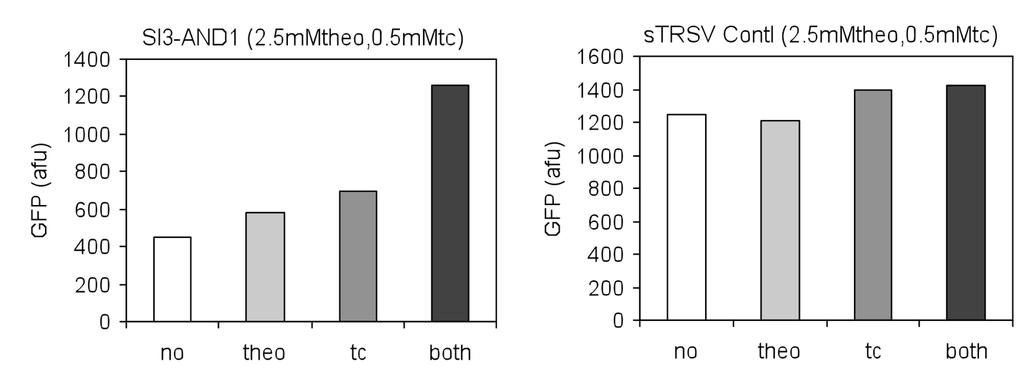
7 It should be noted that we selected to correct the strsv Contl sample with both inputs by the subtraction method for consistency. The calculated device signals are similar in the case where the sample with both inputs is corrected by the sample with theophylline only (i.e., c spec (theo) = c spec (theo, tc)). The device signals are then calculated as the ratio of the device expression activities to the strsv Contl expression activities as: S d,0 (no input) = 0.54 S d,theo (10 mm theo) = 0.52 S d,tet (1 mm tc) = 0.55 S d,theo/tet (10 mm theo, 1 mm tc) = 0.44 These numbers are multiplied by 100 to report device signal as a percentage (as reported in Table S1). These numbers are divided by U ex (U ex.02) to report device signal in units of expression. The device response is reported as the difference between device signal (in units of expression) in the presence of both inputs and that at the indicated ligand conditions (as reported in Figure 3B). Second example: We work through a second example calculation of device activity on a NOR gate (Figure 2F from published manuscript). The raw flow cytometry histogram data are shown on page 12 of this supplement. The gene expression activities are determined as the mean fluorescence of the induced population as described earlier and reported on page 12 as well. The uncorrected gene expression activities of the RNA device under different ligand concentrations are reported in absolute fluorescence units (afu) as: s meas (no input) = s meas (10 mm theo) = s meas (0.5 mm tc) = s meas (10 mm theo, 0.5 mm tc) = Based on the expression levels of the device we use non-switch1 to correct for the nonspecific effects of tetracycline where: s nonspec = (s 0.5,meas -s 0 ) non-switch1 = = 72.9 The tetracycline corrected gene expression activities of the device are: s spec (no input) = s spec (10 mm theo) = s spec (0.5 mm tc) = = s spec (10 mm theo, 0.5 mm tc) = = A similar calculation is performed on the gene expression activities for the standard strsv Contl as: c meas (no input) = c meas (10 mm theo) =
8 c meas (0.5 mm tc) = c meas (10 mm theo, 0.5 mm tc) = strsv Contl is a non-switch control and the data in the absence of tetracycline for this construct can be used to correct for the nonspecific effects of tetracycline as: c spec (no input) = c spec (10 mm theo) = c spec (0.5 mm tc) = = c spec (10 mm theo, 0.5 mm tc) = = The device signals are then calculated as the ratio of the device expression activities to the strsv Contl expression activities as: S d,0 (no input) = 0.27 S d,theo (10 mm theo) = 0.15 S d,tc (0.5 mm tc)= 0.13 S d,theo/tc (10 mm theo, 0.5 mm tc) = 0.11 These numbers are multiplied by 100 to report device signal as a percentage (as reported in Table S1). These numbers are divided by U ex (U ex.02) to report device signal in units of expression. The device response is reported as the difference between device signal (in units of expression) in the presence of both inputs and that at the indicated ligand conditions (as reported in Figure 2F). 6. Raw data for RNA devices We present raw data (representative flow cytometry histograms and averaged mean fluorescence values over triplicates) for all gates presented in the main manuscript text and supporting information. Note, that legends for the raw data reference the function of the devices and the figure names in the Science paper. 8

9
10 10
11 11

12

13
14
15
16

17

18
19

20
21
22
23
24
25
26
27
28
Chapter 7 Conclusions
 VII-1 Chapter 7 Conclusions VII-2 The development of cell-based therapies ranging from well-established practices such as bone marrow transplant to next-generation strategies such as adoptive T-cell therapy
Supplementary Figure 1. BMS enhances human T cell activation in vitro in a
 Supplementary Figure 1. BMS98662 enhances human T cell activation in vitro in a concentration-dependent manner. Jurkat T cells were activated with anti-cd3 and anti-cd28 antibody in the presence of titrated
B220 CD4 CD8. Figure 1. Confocal Image of Sensitized HLN. Representative image of a sensitized HLN
 B220 CD4 CD8 Natarajan et al., unpublished data Figure 1. Confocal Image of Sensitized HLN. Representative image of a sensitized HLN showing B cell follicles and T cell areas. 20 µm thick. Image of magnification
A genetically targeted optical sensor to monitor calcium signals in astrocyte processes
 A genetically targeted optical sensor to monitor calcium signals in astrocyte processes 1 Eiji Shigetomi, 1 Sebastian Kracun, 2 Michael V. Sofroniew & 1,2 *Baljit S. Khakh Ψ 1 Departments of Physiology
Gene expression scaled by distance to the genome replication site. Ying et al. Supporting Information. Contents. Supplementary note I p.
 Gene expression scaled by distance to the genome replication site Ying et al Supporting Information Contents Supplementary note I p. 2 Supplementary note II p. 3-5 Supplementary note III p. 5-7 Supplementary
BRONX COMMUNITY COLLEGE LIBRARY SUGGESTED FOR MTH 01 FUNDAMENTAL CONCEPTS & SKILLS IN ARITHMETIC & ALGEBRA
 BRONX COMMUNITY COLLEGE LIBRARY SUGGESTED FOR MTH 01 FUNDAMENTAL CONCEPTS & SKILLS IN ARITHMETIC & ALGEBRA Textbook: Publisher: Developmental Mathematics, 4th edition by Johnson, Willis, and Hughes Addison
Supplementary Materials for
 www.sciencesignaling.org/cgi/content/full/8/381/ra59/dc1 Supplementary Materials for Analysis of single-cell cytokine secretion reveals a role for paracrine signaling in coordinating macrophage responses
Nature Immunology: doi: /ni Supplementary Figure 1
 Supplementary Figure 1 Fatty acid oxidation is emphasized in 1 macrophages compared with that in macrophages. Gene expression of mitochondrial OXPHOS (Atp5j, Cox4i1, Uqcrc1/2, Ndufs1, Sdhb) and β-oxidation
Lentiviral Delivery of Combinatorial mirna Expression Constructs Provides Efficient Target Gene Repression.
 Supplementary Figure 1 Lentiviral Delivery of Combinatorial mirna Expression Constructs Provides Efficient Target Gene Repression. a, Design for lentiviral combinatorial mirna expression and sensor constructs.
Probability and Statistics. Chapter 1
 Probability and Statistics Chapter 1 Individuals and Variables Individuals and Variables Individuals are objects described by data. Individuals and Variables Individuals are objects described by data.
Supplementary Materials for
 www.sciencesignaling.org/cgi/content/full/6/305/ra106/dc1 Supplementary Materials for Controlling Long-Term Signaling: Receptor Dynamics Determine Attenuation and Refractory Behavior of the TGF-β Pathway
A programmable NOR-based device for transcription profile analyses
 A programmable NOR-based device for transcription profile analyses Tom Ran 1,2, Yehonatan Douek 1, Lilach Milo 1 & Ehud Shapiro 1,2 1 Department of Computer Science and Applied Mathematics 2 Department
Nature Immunology: doi: /ni Supplementary Figure 1. Transcriptional program of the TE and MP CD8 + T cell subsets.
 Supplementary Figure 1 Transcriptional program of the TE and MP CD8 + T cell subsets. (a) Comparison of gene expression of TE and MP CD8 + T cell subsets by microarray. Genes that are 1.5-fold upregulated
Supplementary Fig. 1 No relative growth advantage of Foxp3 negative cells.
 Supplementary Fig. 1 Supplementary Figure S1: No relative growth advantage of Foxp3 negative cells. itreg were induced from WT (A) or FIR (B) CD4 + T cells. FIR itregs were then removed from the TCR signal
(A) RT-PCR for components of the Shh/Gli pathway in normal fetus cell (MRC-5) and a
 RT-PCR for components of the Shh/Gli pathway in normal fetus cell (MRC-5) and a") Supplementary figure legends Supplementary Figure 1. Expression of Shh signaling components in a panel of gastric cancer. (A) RT-PCR for components of the Shh/Gli pathway in normal fetus cell (MRC-5) and
Supplementary figure legends Supplementary Figure 1. Expression of Shh signaling components in a panel of gastric cancer. (A) RT-PCR for components of the Shh/Gli pathway in normal fetus cell (MRC-5) and
Supplementary Information. Supplementary Figure 1
 Supplementary Information Supplementary Figure 1 1 Supplementary Figure 1. Functional assay of the hcas9-2a-mcherry construct (a) Gene correction of a mutant EGFP reporter cell line mediated by hcas9 or
SUPPLEMENT Supplementary Figure 1: (A) (B)
 (B)") SUPPLEMENT Supplementary Figure 1: CD4 + naïve effector T cells (CD4 effector) were labeled with CFSE, stimulated with α-cd2/cd3/cd28 coated beads (at 2 beads/cell) and cultured alone or cocultured with
SUPPLEMENT Supplementary Figure 1: CD4 + naïve effector T cells (CD4 effector) were labeled with CFSE, stimulated with α-cd2/cd3/cd28 coated beads (at 2 beads/cell) and cultured alone or cocultured with
Supplementary Figure S1: Tanycytes are restricted to the central/posterior hypothalamus
 Supplementary Figure S1: Tanycytes are restricted to the central/posterior hypothalamus a: Expression of Vimentin, GFAP, Sox2 and Nestin in anterior, central and posterior hypothalamus. In the anterior
Outline Sensors Controller Measurement Summary. Background. Worry. Idea
 Background Worry Idea Background Worry Idea http://news.ifeng.com http://www.dfdaily.com Outline Sensors Controller Measurement http://news.ifeng.com/mainland/special/chaojibingjun Summary / Background
Prolonged mitotic arrest induces a caspase-dependent DNA damage
 SUPPLEMENTARY INFORMATION Prolonged mitotic arrest induces a caspase-dependent DNA damage response at telomeres that determines cell survival Karolina O. Hain, Didier J. Colin, Shubhra Rastogi, Lindsey
ENZYME ACTIVITY. Readings: Review pp , and in your text (POHS, 5 th ed.).
.") ENZYME ACTIVITY Readings: Review pp. 51-58, and 128-139 in your text (POHS, 5 th ed.). Introduction Enzymes are biological catalysts; that is, enzymes are able to mediate the conversion of substrate into
ENZYME ACTIVITY Readings: Review pp. 51-58, and 128-139 in your text (POHS, 5 th ed.). Introduction Enzymes are biological catalysts; that is, enzymes are able to mediate the conversion of substrate into
Measurement System Analysis Page 1 of 15
 Measurement System Analysis Page 1 of 15 Objective: The goal of this task is to demonstrate the recording data interface and graphical features of the Measurement System Analysis Module (MSA). Three common
MBios 478: Systems Biology and Bayesian Networks, 27 [Dr. Wyrick] Slide #1. Lecture 27: Systems Biology and Bayesian Networks
![MBios 478: Systems Biology and Bayesian Networks, 27 [Dr. Wyrick] Slide #1. Lecture 27: Systems Biology and Bayesian Networks](/thumbs/80/82116384.jpg "MBios 478: Systems Biology and Bayesian Networks, 27 [Dr. Wyrick] Slide #1. Lecture 27: Systems Biology and Bayesian Networks") MBios 478: Systems Biology and Bayesian Networks, 27 [Dr. Wyrick] Slide #1 Lecture 27: Systems Biology and Bayesian Networks Systems Biology and Regulatory Networks o Definitions o Network motifs o Examples
MBios 478: Systems Biology and Bayesian Networks, 27 [Dr. Wyrick] Slide #1 Lecture 27: Systems Biology and Bayesian Networks Systems Biology and Regulatory Networks o Definitions o Network motifs o Examples
Supplemental Figure S1
 Supplemental Figure S1 Children from Nandi (low pathogen burden area) and Kisumu (high pathogen burden area) have significantly different pathogen-specific serological profiles. Serum antibody titers for
RIP1 Negatively Regulates Basal Autophagic Flux through TFEB to Control Sensitivity to Apoptosis
 Manuscript EMBOR-2014-39496 RIP1 Negatively Regulates Basal Autophagic Flux through TFEB to Control Sensitivity to Apoptosis Tohru Yonekawa, Graciela Gamez, Jihye Kim, Aik Choon Tan, Jackie Thorburn, Jacob
Drug Receptor Interactions and Pharmacodynamics
 Drug Receptor Interactions and Pharmacodynamics Dr. Raz Mohammed MSc Pharmacology School of Pharmacy 22.10.2017 Lec 6 Pharmacodynamics definition Pharmacodynamics describes the actions of a drug on the
Suppl Video: Tumor cells (green) and monocytes (white) are seeded on a confluent endothelial
 and monocytes (white) are seeded on a confluent endothelial") Supplementary Information Häuselmann et al. Monocyte induction of E-selectin-mediated endothelial activation releases VE-cadherin junctions to promote tumor cell extravasation in the metastasis cascade
Supplementary Information Häuselmann et al. Monocyte induction of E-selectin-mediated endothelial activation releases VE-cadherin junctions to promote tumor cell extravasation in the metastasis cascade
Supplementary Figure 1. Efficiency of Mll4 deletion and its effect on T cell populations in the periphery. Nature Immunology: doi: /ni.
 Supplementary Figure 1 Efficiency of Mll4 deletion and its effect on T cell populations in the periphery. Expression of Mll4 floxed alleles (16-19) in naive CD4 + T cells isolated from lymph nodes and
Reviewers' comments: Reviewer #1 (Remarks to the Author):
:") Reviewers' comments: Reviewer #1 (Remarks to the Author): In this interesting article, Kondo et al demonstrate that Notch signaling can induce Tscm-like fate in activated T cells. This work extends prior
Reviewers' comments: Reviewer #1 (Remarks to the Author): In this interesting article, Kondo et al demonstrate that Notch signaling can induce Tscm-like fate in activated T cells. This work extends prior
E. coli Automatic Directed Evolution Machine a Universal Framework for Evolutionary Approaches in Synthetic Biology
 E. coli Automatic Directed Evolution Machine a Universal Framework for Evolutionary Approaches in Synthetic Biology University of Science and Technology of China The power of evolution Our inspiration
Supplementary Figure 1 The plasmids used for the GPCR-CRISPR ChaCha and the GPCR-CRISPR Tango systems. (a) The plasmids for the GPCR-CRISPR ChaCha
 The plasmids for the GPCR-CRISPR ChaCha") Supplementary Figure 1 The plasmids used for the GPCR-CRISPR ChaCha and the GPCR-CRISPR Tango systems. (a) The plasmids for the GPCR-CRISPR ChaCha system. The dcas9-vpr effector is fused to the C-terminus
Supplementary Figure 1 The plasmids used for the GPCR-CRISPR ChaCha and the GPCR-CRISPR Tango systems. (a) The plasmids for the GPCR-CRISPR ChaCha system. The dcas9-vpr effector is fused to the C-terminus
Akt and mtor pathways differentially regulate the development of natural and inducible. T H 17 cells
 Akt and mtor pathways differentially regulate the development of natural and inducible T H 17 cells Jiyeon S Kim, Tammarah Sklarz, Lauren Banks, Mercy Gohil, Adam T Waickman, Nicolas Skuli, Bryan L Krock,
Publisher: Pearson Education, Inc. publishing as Prentice Hall
 Section I. Correlation with the Mathematics 2009 SOL and Curriculum Framework Rating 6.1 6.2 6.3 6.4 6.5 6.6 6.7 6.8 6.9 6.10 6.11 6.12 6.13 6.14 6.15 6.16 6.17 6.18 6.19 6.20 Section II. Additional Criteria:
Supplemental Figure S1. Expression of Cirbp mrna in mouse tissues and NIH3T3 cells.
 SUPPLEMENTAL FIGURE AND TABLE LEGENDS Supplemental Figure S1. Expression of Cirbp mrna in mouse tissues and NIH3T3 cells. A) Cirbp mrna expression levels in various mouse tissues collected around the clock
Supplementary Information. A vital role for IL-2 trans-presentation in DC-mediated T cell activation in humans as revealed by daclizumab therapy
 Supplementary Information A vital role for IL-2 trans-presentation in DC-mediated T cell activation in humans as revealed by daclizumab therapy Simone C. Wuest 1, Jehad Edwan 1, Jayne F. Martin 1, Sungpil
Electrophysiology. General Neurophysiology. Action Potentials
 5 Electrophysiology Cochlear implants should aim to reproduce the coding of sound in the auditory system as closely as possible, for best sound perception. The cochlear implant is in part the result of
INTEGRATION OF GENERAL AMINO ACID CONTROL AND TOR REGULATORY PATHWAYS IN NITROGEN ASSIMILATION IN YEAST
 INTEGRATION OF GENERAL AMINO ACID CONTROL AND TOR REGULATORY PATHWAYS IN NITROGEN ASSIMILATION IN YEAST Kirk A. Staschke 1, Souvik Dey 1, John M. Zaborske 2, Lakshmi Reddy Palam 1, Jeanette N. McClintick
P. 274: 1-5, 1-14, P. 286: 1-8, 1-13, P , 1-39
 0 0 7 th Grade Day WELCOME TO 7 TH GRADE 1 Test 3.1 Introduction Integers/ Absolute Value P. 192-198 2 3.2 Adding Integers P. 203-210 (P. 225-227 openers) Bar Models 3 3.3 P. 216-222 Subtracting Integers
Supplementary Figure 1. IL-12 serum levels and frequency of subsets in FL patients. (A) IL-12
 IL-12") 1 Supplementary Data Figure legends Supplementary Figure 1. IL-12 serum levels and frequency of subsets in FL patients. (A) IL-12 serum levels measured by multiplex ELISA (Luminex) in FL patients before
1 Supplementary Data Figure legends Supplementary Figure 1. IL-12 serum levels and frequency of subsets in FL patients. (A) IL-12 serum levels measured by multiplex ELISA (Luminex) in FL patients before
Dynamics of Hodgkin and Huxley Model with Conductance based Synaptic Input
 Proceedings of International Joint Conference on Neural Networks, Dallas, Texas, USA, August 4-9, 2013 Dynamics of Hodgkin and Huxley Model with Conductance based Synaptic Input Priyanka Bajaj and Akhil
Supplementary Information. Tissue-wide immunity against Leishmania. through collective production of nitric oxide
 Supplementary Information Tissue-wide immunity against Leishmania through collective production of nitric oxide Romain Olekhnovitch, Bernhard Ryffel, Andreas J. Müller and Philippe Bousso Supplementary
Find the slope of the line that goes through the given points. 1) (-9, -68) and (8, 51) 1)
 (-9, -68) and (8, 51) 1)") Math 125 Semester Review Problems Name Find the slope of the line that goes through the given points. 1) (-9, -68) and (8, 51) 1) Solve the inequality. Graph the solution set, and state the solution set
Math 125 Semester Review Problems Name Find the slope of the line that goes through the given points. 1) (-9, -68) and (8, 51) 1) Solve the inequality. Graph the solution set, and state the solution set
Nature Immunology: doi: /ni Supplementary Figure 1. Huwe1 has high expression in HSCs and is necessary for quiescence.
 Supplementary Figure 1 Huwe1 has high expression in HSCs and is necessary for quiescence. (a) Heat map visualizing expression of genes with a known function in ubiquitin-mediated proteolysis (KEGG: Ubiquitin
% of live splenocytes. STAT5 deletion. (open shapes) % ROSA + % floxed
 % ROSA + % floxed") Supp. Figure 1. a 14 1 1 8 6 spleen cells (x1 6 ) 16 % of live splenocytes 5 4 3 1 % of live splenocytes 8 6 4 b 1 1 c % of CD11c + splenocytes (closed shapes) 8 6 4 8 6 4 % ROSA + (open shapes) % floxed
Supp. Figure 1. a 14 1 1 8 6 spleen cells (x1 6 ) 16 % of live splenocytes 5 4 3 1 % of live splenocytes 8 6 4 b 1 1 c % of CD11c + splenocytes (closed shapes) 8 6 4 8 6 4 % ROSA + (open shapes) % floxed
Supplemental Information. Genomic Characterization of Murine. Monocytes Reveals C/EBPb Transcription. Factor Dependence of Ly6C Cells
 Immunity, Volume 46 Supplemental Information Genomic Characterization of Murine Monocytes Reveals C/EBPb Transcription Factor Dependence of Ly6C Cells Alexander Mildner, Jörg Schönheit, Amir Giladi, Eyal
Supplemental Information. CD4 + CD25 + Foxp3 + Regulatory T Cells Promote. Th17 Cells In Vitro and Enhance Host Resistance
 Immunity, Volume 34 Supplemental Information D4 + D25 + + Regulatory T ells Promote Th17 ells In Vitro and Enhance Host Resistance in Mouse andida albicans Th17 ell Infection Model Pushpa Pandiyan, Heather
CONTRACTING ORGANIZATION: Johns Hopkins University School of Medicine Baltimore, MD 21205
 AD Award Number: DAMD7---7 TITLE: Development of Artificial Antigen Presenting Cells for Prostate Cancer Immunotherapy PRINCIPAL INVESTIGATOR: Jonathan P. Schneck, M.D., Ph.D. Mathias Oelke, Ph.D. CONTRACTING
Nature Protocols: doi: /nprot Supplementary Figure 1
 Supplementary Figure 1 Traditional electronic gating strategy for analysing cell death based on A5-FITC and 7-AAD. a, Flow cytometry analysis showing the traditional two-stage electronic gating strategy
Supplementary Materials for
 www.sciencesignaling.org/cgi/content/full/3/114/ra23/dc1 Supplementary Materials for Regulation of Zap70 Expression During Thymocyte Development Enables Temporal Separation of CD4 and CD8 Repertoire Selection
Page 32 AP Biology: 2013 Exam Review CONCEPT 6 REGULATION
 Page 32 AP Biology: 2013 Exam Review CONCEPT 6 REGULATION 1. Feedback a. Negative feedback mechanisms maintain dynamic homeostasis for a particular condition (variable) by regulating physiological processes,
Supplementary Figure 1) GABAergic enhancement by leptin hyperpolarizes POMC neurons A) Representative recording samples showing the membrane
 GABAergic enhancement by leptin hyperpolarizes POMC neurons A) Representative recording samples showing the membrane") Supplementary Figure 1) GABAergic enhancement by leptin hyperpolarizes POMC neurons A) Representative recording samples showing the membrane potential recorded from POMC neurons following treatment with
Supplementary Figure 1) GABAergic enhancement by leptin hyperpolarizes POMC neurons A) Representative recording samples showing the membrane potential recorded from POMC neurons following treatment with
STATISTICS AND RESEARCH DESIGN
 Statistics 1 STATISTICS AND RESEARCH DESIGN These are subjects that are frequently confused. Both subjects often evoke student anxiety and avoidance. To further complicate matters, both areas appear have
Supporting Online Material for
 www.sciencemag.org/cgi/content/full/1171320/dc1 Supporting Online Material for A Frazzled/DCC-Dependent Transcriptional Switch Regulates Midline Axon Guidance Long Yang, David S. Garbe, Greg J. Bashaw*
Supplementary Figure 1
 Supplementary Figure 1 Identification of IFN-γ-producing CD8 + and CD4 + T cells with naive phenotype by alternative gating and sample-processing strategies. a. Contour 5% probability plots show definition
Test Equipment Depot Washington Street Melrose, MA TestEquipmentDepot.com
 Test Equipment Depot - 800.517.8431-99 Washington Street Melrose, MA 02176 TestEquipmentDepot.com Table of Contents Table of Contents... iii Preface... viii Getting Started... 9 0.1 Breadboard... 9 0.2
Results & Statistics: Description and Correlation. I. Scales of Measurement A Review
 Results & Statistics: Description and Correlation The description and presentation of results involves a number of topics. These include scales of measurement, descriptive statistics used to summarize
SUPPLEMENTARY INFORMATION
 DOI: 1.138/ncb222 / b. WB anti- WB anti- ulin Mitotic index (%) 14 1 6 2 T (h) 32 48-1 1 2 3 4 6-1 4 16 22 28 3 33 e. 6 4 2 Time (min) 1-6- 11-1 > 1 % cells Figure S1 depletion leads to mitotic defects
Genetic Selection for Context-Dependent Stochastic Phenotypes: Sp1 and TATA Mutations Increase Phenotypic Noise in HIV-1 Gene Expression
 Genetic Selection for Context-Dependent Stochastic Phenotypes: Sp1 and TATA Mutations Increase Phenotypic Noise in HIV-1 Gene Expression Kathryn Miller-Jensen 1,2. *, Ron Skupsky 2., Priya S. Shah 2, Adam
MATERIALS AND METHODS. Neutralizing antibodies specific to mouse Dll1, Dll4, J1 and J2 were prepared as described. 1,2 All
 MATERIALS AND METHODS Antibodies (Abs), flow cytometry analysis and cell lines Neutralizing antibodies specific to mouse Dll1, Dll4, J1 and J2 were prepared as described. 1,2 All other antibodies used
COGNITIVE CONTROL IN MEDIA MULTITASKERS
 COGNITIVE CONTROL IN MEDIA MULTITASKERS Xiaoying Gao 12.01.2015 1 LEARNING GOALS Learn the relationship between chronic media multitasking and cognitive control abilities ability of filtering environment
EXPERIMENT 3 ENZYMATIC QUANTITATION OF GLUCOSE
 EXPERIMENT 3 ENZYMATIC QUANTITATION OF GLUCOSE This is a team experiment. Each team will prepare one set of reagents; each person will do an individual unknown and each team will submit a single report.
Electronic Supplementary Information NOVEL NON-TARGET ANALYSIS FOR FLUORINE COMPOUNDS USING ICPMS/MS AND HPLC-ICPMS/MS
 Electronic Supplementary Material (ESI) for Journal of Analytical Atomic Spectrometry. This journal is The Royal Society of Chemistry 2017 Electronic Supplementary Information NOVEL NON-TARGET ANALYSIS
Supplementary. presence of the. (c) mrna expression. Error. in naive or
 mrna expression. Error. in naive or") Figure 1. (a) Naive CD4 + T cells were activated in the presence of the indicated cytokines for 3 days. Enpp2 mrna expression was measured by qrt-pcrhr, infected with (b, c) Naive CD4 + T cells were activated
Figure 1. (a) Naive CD4 + T cells were activated in the presence of the indicated cytokines for 3 days. Enpp2 mrna expression was measured by qrt-pcrhr, infected with (b, c) Naive CD4 + T cells were activated
FIGHTING DRUG-RESISTANT MALARIA
 FIGHTING DRUG-RESISTANT MALARIA Read the daily message and record notes of important points and deliverables. (5 min) NSEI 1.3.1 WARM-UP Open your pinned Daily Message Notes Add the today s date and the
T H E J O U R N A L O F C E L L B I O L O G Y
 T H E J O U R N A L O F C E L L B I O L O G Y Supplemental material Stelter et al., http://www.jcb.org/cgi/content/full/jcb.201105042/dc1 S1 Figure S1. Dyn2 recruitment to edid-labeled FG domain Nups.
Nature Neuroscience: doi: /nn Supplementary Figure 1. Trial structure for go/no-go behavior
 Supplementary Figure 1 Trial structure for go/no-go behavior a, Overall timeline of experiments. Day 1: A1 mapping, injection of AAV1-SYN-GCAMP6s, cranial window and headpost implantation. Water restriction
CD25-PE (BD Biosciences) and labeled with anti-pe-microbeads (Miltenyi Biotec) for depletion of CD25 +
 and labeled with anti-pe-microbeads (Miltenyi Biotec) for depletion of CD25 +") Supplements Supplemental Materials and Methods Depletion of CD25 + T-cells from PBMC. Fresh or HD precultured PBMC were stained with the conjugate CD25-PE (BD Biosciences) and labeled with anti-pe-microbeads
Supplements Supplemental Materials and Methods Depletion of CD25 + T-cells from PBMC. Fresh or HD precultured PBMC were stained with the conjugate CD25-PE (BD Biosciences) and labeled with anti-pe-microbeads
Iso-inertial dynamometer
 Iso-inertial dynamometer A. Equipment set up B. Data acquisition and export C. Training mode 1 P a g e A. Equipment set up 1. Connect all the devices as depicted below: 2. Launch the software by clicking
Reviewers' comments: Reviewer #1 (Remarks to the Author):
:") Reviewers' comments: Reviewer #1 (Remarks to the Author): The manuscript by Sun et al., provide data showing that short-chain fatty acids produced by intestinal microbiota act through GPR43 to induced
Reviewers' comments: Reviewer #1 (Remarks to the Author): The manuscript by Sun et al., provide data showing that short-chain fatty acids produced by intestinal microbiota act through GPR43 to induced
Q: How do I get the protein concentration in mg/ml from the standard curve if the X-axis is in units of µg.
 Photometry Frequently Asked Questions Q: How do I get the protein concentration in mg/ml from the standard curve if the X-axis is in units of µg. Protein standard curves are traditionally presented as
Physiological Simulations: Plasma Glucose Regulation 1 Physiology Biology 390
 Physiological Simulations: Plasma Glucose Regulation 1 Physiology Biology 390 I. An Introduction to this Lab and to Models 2 in General: The purpose of this exercise is to use a computer simulation to
Supporting Information. Maximizing the Supported Bilayer Phenomenon: LCP Liposomes Comprised Exclusively
 S-1 Supporting Information Maximizing the Supported Bilayer Phenomenon: LCP Liposomes Comprised Exclusively of PEGylated Phospholipids for Enhanced Systemic and Lymphatic Delivery Matthew T. Haynes and
Sum of Neurally Distinct Stimulus- and Task-Related Components.
 SUPPLEMENTARY MATERIAL for Cardoso et al. 22 The Neuroimaging Signal is a Linear Sum of Neurally Distinct Stimulus- and Task-Related Components. : Appendix: Homogeneous Linear ( Null ) and Modified Linear
Appendix Figure S1 A B C D E F G H
 ppendix Figure S1 C D E F G H ppendix Figure S1. RT and chemotherapy alter PD-L1 expression in PDC cells. Flow cytometric analysis of PD-L1 expression in () KPC and () Pan02 cells following treatment with
SUPPLEMENTARY INFORMATION
 SUPPLEENTRY INFORTION DOI: 1.138/ncb2577 Early Telophase Late Telophase B icrotubules within the ICB (percent of total cells in telophase) D G ultinucleate cells (% total) 8 6 4 2 2 15 1 5 T without gaps
Bioluminescence Resonance Energy Transfer (BRET)-based studies of receptor dynamics in living cells with Berthold s Mithras
-based studies of receptor dynamics in living cells with Berthold s Mithras") Bioluminescence Resonance Energy Transfer (BRET)-based studies of receptor dynamics in living cells with Berthold s Mithras Tarik Issad, Ralf Jockers and Stefano Marullo 1 Because they play a pivotal role
Bioluminescence Resonance Energy Transfer (BRET)-based studies of receptor dynamics in living cells with Berthold s Mithras Tarik Issad, Ralf Jockers and Stefano Marullo 1 Because they play a pivotal role
Rapid parallel measurements of macroautophagy and mitophagy in
 Supplemental Figures Rapid parallel measurements of macroautophagy and mitophagy in mammalian cells using a single fluorescent biosensor Sargsyan A, Cai J, Fandino LB, Labasky ME, Forostyan T, Colosimo
TITLE: Development of Antigen Presenting Cells for adoptive immunotherapy in prostate cancer
 AD Award Number: W8-XWH-5-- TITLE: Development of Antigen Presenting Cells for adoptive immunotherapy in prostate cancer PRINCIPAL INVESTIGATOR: Mathias Oelke, Ph.D. CONTRACTING ORGANIZATION: Johns Hopkins
SUPPLEMENTARY METHODS
 SUPPLEMENTARY METHODS Histological analysis. Colonic tissues were collected from 5 parts of the middle colon on day 7 after the start of DSS treatment, and then were cut into segments, fixed with 4% paraformaldehyde,
Nature Immunology: doi: /ni Supplementary Figure 1. Characteristics of SEs in T reg and T conv cells.
 Supplementary Figure 1 Characteristics of SEs in T reg and T conv cells. (a) Patterns of indicated transcription factor-binding at SEs and surrounding regions in T reg and T conv cells. Average normalized
Figure S1. PMVs from THP-1 cells expose phosphatidylserine and carry actin. A) Flow
 Flow") SUPPLEMENTARY DATA Supplementary Figure Legends Figure S1. PMVs from THP-1 cells expose phosphatidylserine and carry actin. A) Flow cytometry analysis of PMVs labelled with annexin-v-pe (Guava technologies)
SUPPLEMENTARY DATA Supplementary Figure Legends Figure S1. PMVs from THP-1 cells expose phosphatidylserine and carry actin. A) Flow cytometry analysis of PMVs labelled with annexin-v-pe (Guava technologies)
Genomic analysis of essentiality within protein networks
 Genomic analysis of essentiality within protein networks Haiyuan Yu, Dov Greenbaum, Hao Xin Lu, Xiaowei Zhu and Mark Gerstein Department of Molecular Biophysics and Biochemistry, 266 Whitney Avenue, Yale
Genetic Circuit for the Early Warning of Lung Cancer using ibiosim
 Genetic Circuit for the Early Warning of Lung Cancer using ibiosim Xiang WANG 1,a, Xiao- Cui WANG1, Jing- Bo JIANG2, Jin- Jing SUN1, Shu- Song PANG1 Han- Hong HE1 and Wei- Ke WANG1 School of Electronic
NK cell flow cytometric assay In vivo DC viability and migration assay
 NK cell flow cytometric assay 6 NK cells were purified, by negative selection with the NK Cell Isolation Kit (Miltenyi iotec), from spleen and lymph nodes of 6 RAG1KO mice, injected the day before with
Penetration Depth of 635 nm Laser Light Into the Biological Tissue
 2017 Published in 5th International Symposium on Innovative Technologies in Engineering and Science 29-30 September 2017 (ISITES2017 Baku - Azerbaijan) Penetration Depth of 635 nm Laser Light Into the
SUPPLEMENTARY INFORMATION
 doi:10.1038/nature23271 Table of Contents S1. Supplementary Methods... 1 S1.1. Description of Plasmids and Ribocomputing Device Evaluation... 1 S1.1.1. OR, AND, and Disjunctive Normal Form Circuits...
What is TMG? TMG is a patented technology and innovative muscle diagnostic technological procedure that is non-invasive, selective and reliable.
 What is TMG? TMG is a patented technology and innovative muscle diagnostic technological procedure that is non-invasive, selective and reliable. It was developed to precisely measure an athlete s individual
SDS-Assisted Protein Transport Through Solid-State Nanopores
 Supplementary Information for: SDS-Assisted Protein Transport Through Solid-State Nanopores Laura Restrepo-Pérez 1, Shalini John 2, Aleksei Aksimentiev 2 *, Chirlmin Joo 1 *, Cees Dekker 1 * 1 Department
Supplemental Figures Supplemental Figure 1:
 Supplemental Figures Supplemental Figure 1: Representative FACS data showing Concurrent Brain cell type Acquisition using either Percoll PLUS (top row) or myelin removal beads (bottom two rows). Debris
Supplementary Table; Supplementary Figures and legends S1-S21; Supplementary Materials and Methods
 Silva et al. PTEN posttranslational inactivation and hyperactivation of the PI3K/Akt pathway sustain primary T cell leukemia viability Supplementary Table; Supplementary Figures and legends S1-S21; Supplementary
PD-1 and its ligand PD-L1 are progressively up-regulated on CD4 and CD8 T-cells. in HIV-2 infection irrespective of the presence of viremia
 Tendeiro et al_ Supplemental Digital ontent_page of PD and its ligand PDL are progressively upregulated on D4 and D8 Tcells in infection irrespective of the presence of viremia Supplemental Digital ontent
Part I. Boolean modelling exercises
 Part I. Boolean modelling exercises. Glucose repression of Icl in yeast In yeast Saccharomyces cerevisiae, expression of enzyme Icl (isocitrate lyase-, involved in the gluconeogenesis pathway) is important
Expanded View Figures
 Gregory T Ellis et al Lung damage by monocyte TRIL allows coinfection EMO reports Expanded View Figures % survival Clinical score Influenza Matrix /HPRT (log ) CFU/L (log ) 3 irway early.7.7 + h Survival
Supplementary Materials for
 www.sciencesignaling.org/cgi/content/full/8/358/ra2/dc1 Supplementary Materials for Localized TRPA1 channel Ca 2+ signals stimulated by reactive oxygen species promote cerebral artery dilation Michelle
SUPPLEMENTARY LEGENDS...
 TABLE OF CONTENTS SUPPLEMENTARY LEGENDS... 2 11 MOVIE S1... 2 FIGURE S1 LEGEND... 3 FIGURE S2 LEGEND... 4 FIGURE S3 LEGEND... 5 FIGURE S4 LEGEND... 6 FIGURE S5 LEGEND... 7 FIGURE S6 LEGEND... 8 FIGURE
Th17 and Th17/Treg ratio at early HIV infection associate with protective HIV-specific CD8 + T-cell responses and disease progression
 Th17 and Th17/Treg ratio at early HIV infection associate with protective HIV-specific CD8 T-cell responses and disease progression Juliana Falivene 1, Yanina Ghiglione 1, Natalia Laufer 1,3, María Eugenia
CHAPTER 3 DATA ANALYSIS: DESCRIBING DATA
 Data Analysis: Describing Data CHAPTER 3 DATA ANALYSIS: DESCRIBING DATA In the analysis process, the researcher tries to evaluate the data collected both from written documents and from other sources such
Lecture 6: Allosteric regulation of enzymes
 Chem*3560 Lecture 6: Allosteric regulation of enzymes Metabolic pathways do not run on a continuous basis, but are regulated according to need Catabolic pathways run if there is demand for ATP; for example
Cytotoxicity assays. Rory D. de Vries, PhD 1. Viroscience lab, Erasmus MC, Rotterdam, the Netherlands
 Cytotoxicity assays Rory D. de Vries, PhD 1 1 Viroscience lab, Erasmus MC, Rotterdam, the Netherlands Anti-influenza immunity Humoral / CD4+ / CD8+ / NK? Function of CTL Elimination of virus-infected cells?