Appendix Figure S1 A B C D E F G H
|
|
|
- Lucinda Randall
- 5 years ago
- Views:
Transcription

1 ppendix Figure S1 C D E F G H
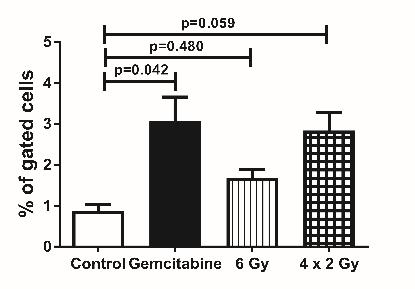
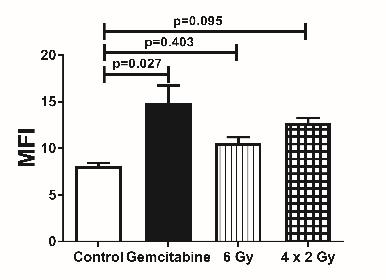
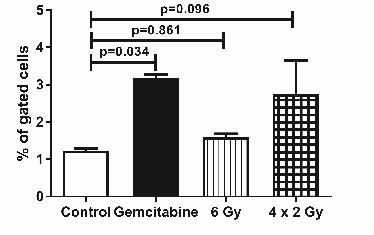
2 ppendix Figure S1. RT and chemotherapy alter PD-L1 expression in PDC cells. Flow cytometric analysis of PD-L1 expression in () KPC and () Pan02 cells following treatment with gemcitabine and RT. Representative dot plots are shown. (C) Flow cytometric analysis of PD-L1 in PSN-1 human PDC cells 24 hrs after RT and gemcitabine. Gemcitabine was diluted in DMSO (vehicle) and hence we used DMSO for the untreated control group and the RT groups as well (means ± SD, n=3, One-way NOV, onferroni test). Conditioned medium from (D) KPC and (E) PSN-1 cells pre-treated with RT and gemcitabine was collected 24 hrs later, added to treatment-naïve PDC cells and PD-L1 expression analysed. Conditioned medium did not alter PD-L1 expression in KPC and PSN-1 cells. Flow cytometry gating for PD-L1 was performed as in main Figure 1 (means ± SD, n=3, One-way NOV, onferroni test). (F-G) Western blot confirmed blockade of Stat1 and Stat3 in KPC and Pan02 cells using sirn (50 nm and 100nM for Stat1; 50 nm for Stat3) as indicated. (H) Flow cytometric analysis of PD-L1 after gemcitabine and RT (as described above) in KPC and Pan02 following Stat3 downregulation by sirn (50 nm). control sirn (c-sirn) was used as well (means ± SD, n=3, Student s t-test).
3 Supplementary Figure 2 F C
4 ppendix Figure S2. () Flow cytometric analysis of IFNγ in KPC and Pan02 cells 24 hrs after RT and gemcitabine. Gemcitabine was diluted in DMSO (vehicle) and hence we used DMSO for the untreated control group and the RT groups as well (means ± SD, n=3, One-way NOV, onferroni test). Flow cytometric analysis of IFNγ in KPC and Pan02 cells treated with gemcitabine and RT after downregulation of () Stat1 (50 nm and 100 nm) and (C) Stat3 by sirn (50 nm). control sirn (c-sirn) was used as well (means ± SD, n=3, Student s t-test). MFI, mean fluorescence intensity.
 PD-L1 and () IFNγ upon addition of recombinant IL-6 (50 ng/ml) in")
 and hence we used DMSO for the control group and the RT")
5 ppendix Figure S3 ppendix Figure S3. Flow cytometric analysis of () PD-L1 and () IFNγ upon addition of recombinant IL-6 (50 ng/ml) in KPC and Pan02 cells. nalysis was performed 24 hrs after RT and gemcitabine. Gemcitabine was diluted in DMSO (vehicle) and hence we used DMSO for the control group and the RT groups as well (means ± SD, n=3, Student s t-test). MFI, mean fluorescence intensity.
6 ppendix Figure S4 ppendix Figure S4. Clonogenic survival assay in () KPC cells and () Pan02 cells after treatment with RT and gemcitabine + anti PD-L1 (2 µg/ml), as indicated. Gemcitabine was diluted in DMSO (vehicle) and hence we used DMSO for the untreated control group as well (means ± SD, n=3, Student s t-test)

7 ppendix Figure S5 ppendix Figure S5. Flow cytometry analysis of either immune activator or immune effectors shown in main Figure 2. Representative plots are shown for the different groups as indicated.

8 ppendix Figure S6 ppendix Figure S6. Flow cytometry analysis of either immune activator or immune effectors shown in main Figure 3. Representative plots are shown for the different groups as indicated.
9 ppendix Figure S7 C D ppendix Figure S7. IFNγ expression was analysed by flow cytometry in () CD8+ T-cells and () CD4+ T-cells in blood samples of KPC tumor bearing mice from the different treatment groups, as indicated (n=5 per group; means ± SD, n=1, One-way NOV, onferroni test). PD-1 expression was also analysed in (C) CD8+ T-cells and (D) CD4+ T-cells using blood samples from the same experiment. Quantitative data are shown (n=5 per group; means ± SD, n=1, One-way NOV, onferroni test)
 and interleukin receptor 1ra (IL-1ra) appeared downregulated in the12 Gy plus anti-pd-l1 group.")
10 ppendix Figure S8 C ppendix Figure S8. (-) Cytokine array analysis using a standard kit in blood serum of KPC allografts obtained 5 days after treatment as indicated. Stromal derived factor 1 (SDF-1) and interleukin receptor 1ra (IL-1ra) appeared downregulated in the12 Gy plus anti-pd-l1 group. (C) ELIS (n=6 mice per group) confirmed significant downregulation of SDF-1 both in the RT and the combination group (means ± SD, n=3, One-way NOV, onferroni test).
11 ppendix Figure S9 C ppendix Figure S9. () KPC tumor growth delay after treatment with either 20 Gy (day 0), anti-pd-l1 (days 0, 3, 6 and 9) or their combination, as indicated. The radiosensitizing effect of anti-pd-l1 after 20 Gy was assessed as shown by the capped line. (n=6 mice per group; means ± SD, n=1, One-way NOV, onferroni test). No weight loss was observed in the in vivo experiments. () Expression of PD-L1 in the syngeneic KPC xenografts following treatment with RT and gemcitabine. PD-L1 expression was analysed 5 days post-treatment in the syngeneic KPC xenografts after either control (vehicle), 12 Gy (as described in Figure 4), 5x3 Gy (as described in Figure 4), 20 Gy (as described in Figure 4D) and gemcitabine (shown in main Figure 5) treatment (means ± SD, n=1, One-way NOV, onferroni test). (C) Similarly, PD-L1 expression was analysed in KPC transgenic mice either short-term (24 hr) or long term (3-7 weeks) after gemcitabine (100 mg/kg i.p. days 0, 3, 6, and 9). (n=5 per group; means ± SD, n=1, One-way NOV, onferroni test).

12 ppendix Figure S10 ppendix Figure S10. Flow cytometry dot plots of CD45+CD8+, CD11b+Gr1+ and CD4+CD25+FOXP3+ cell populations in the livers of the mice from the different treatment groups as shown in main Figure 6.


13 ppendix Figure S11 C D E F G ppendix Figure S11. Mathematical model of immune cells interacting with tumor cells reproduces experimental data and provides insight into the mechanism of the synergy between radiation and anti-pd- L1. () Schematic of mathematical model. RT renders tumor cells susceptible to killing by immune cells. The immune cell compartment is split into CD8+ T cells and other immune cells (see main text). We include the generation of immunosuppressive microenvironment factors that reduce the ability of CD8+ T cells to kill tumor cells. We model anti-pd-l1 therapy as both reducing the formation of suppressive microenvironment factors and by directly increasing the ability of T cells to kill tumor cells. () Calculated tumor growth if RT kills a large fraction of tumor cells. (C) Calculated tumor growth if RT slows down the effective growth rate, i.e. increasing cell death or slowing down cell division. (D) Mathematical model calculations assuming RT converts a large fraction of tumor cells into a state susceptible to killing by immune cells. (E) Mathematical model calculations assuming PD-L1 blockade only increases CD8+ T cellmediated tumor cell killing. (F) Mathematical model calculations assuming PD-L1 blockade only increases CD8+ T cell recruitment compared to experimental data. (G) Calculations of the mathematical model when PD-L1 blockade increases CD8+ T cell killing and reduces the suppressive microenvironment. Experimental data is shown as filled circles and mathematical model calculations are shown as solid or dashed lines.
Supplemental Information. CD4 + CD25 + Foxp3 + Regulatory T Cells Promote. Th17 Cells In Vitro and Enhance Host Resistance
 Immunity, Volume 34 Supplemental Information D4 + D25 + + Regulatory T ells Promote Th17 ells In Vitro and Enhance Host Resistance in Mouse andida albicans Th17 ell Infection Model Pushpa Pandiyan, Heather
Supplemental Figure 1
 Supplemental Figure 1 1a 1c PD-1 MFI fold change 6 5 4 3 2 1 IL-1α IL-2 IL-4 IL-6 IL-1 IL-12 IL-13 IL-15 IL-17 IL-18 IL-21 IL-23 IFN-α Mut Human PD-1 promoter SBE-D 5 -GTCTG- -1.2kb SBE-P -CAGAC- -1.kb
Supplemental Table 1. Primer sequences for transcript analysis
 Supplemental Table 1. Primer sequences for transcript analysis Primer Sequence (5 3 ) Primer Sequence (5 3 ) Mmp2 Forward CCCGTGTGGCCCTC Mmp15 Forward CGGGGCTGGCT Reverse GCTCTCCCGGTTTC Reverse CCTGGTGTGCCTGCTC
supplemental Figure 1
 supplemental Figure 1 A T cell T1 anti-ny-eso-117-16/hla-a*:1 CDζ CH/CH scfv B T cell T1 anti-ny-eso-117-16/hla-a*:1 CDζ CH/CH scfv C T cell BW1/6 anti-cea CDζ CH/CH scfv supplemental Figure 1.79.9.87
L1 on PyMT tumor cells but Py117 cells are more responsive to IFN-γ. (A) Flow
 Flow") A MHCI B PD-L1 Fold expression 8 6 4 2 Fold expression 3 2 1 No tx 1Gy 2Gy IFN Py117 Py117 Supplementary Figure 1. Radiation and IFN-γ enhance MHCI expression and PD- L1 on PyMT tumor cells but Py117 cells
A MHCI B PD-L1 Fold expression 8 6 4 2 Fold expression 3 2 1 No tx 1Gy 2Gy IFN Py117 Py117 Supplementary Figure 1. Radiation and IFN-γ enhance MHCI expression and PD- L1 on PyMT tumor cells but Py117 cells
Control GST GST-RAP. α2-mg. 170 kda. b-actin. 42 kda LRP-1
 % of max Supplementary Figure 1 Control GST GST-RP 17 kda α2-mg 42 kda b-actin Gate: CD11c+ (DCs) Gate: F4/8+ (Mfs) IgG Cd11cCre + Lrp1 fl/fl LRP-1 Supplementary figure 1. () MDCs were pretreated with
well for 2 h at rt. Each dot represents an individual mouse and bar is the mean ±
 Supplementary data: Control DC Blimp-1 ko DC 8 6 4 2-2 IL-1β p=.5 medium 8 6 4 2 IL-2 Medium p=.16 8 6 4 2 IL-6 medium p=.3 5 4 3 2 1-1 medium IL-1 n.s. 25 2 15 1 5 IL-12(p7) p=.15 5 IFNγ p=.65 4 3 2 1
Supplementary Figure S1. Flow cytometric analysis of the expression of Thy1 in NH cells. Flow cytometric analysis of the expression of T1/ST2 and
 Supplementary Figure S1. Flow cytometric analysis of the expression of Thy1 in NH cells. Flow cytometric analysis of the expression of T1/ST2 and Thy1 in NH cells derived from the lungs of naïve mice.
Supplementary Figure 1. BMS enhances human T cell activation in vitro in a
 Supplementary Figure 1. BMS98662 enhances human T cell activation in vitro in a concentration-dependent manner. Jurkat T cells were activated with anti-cd3 and anti-cd28 antibody in the presence of titrated
Supplementary Figure 1. mrna expression of chitinase and chitinase-like protein in splenic immune cells. Each splenic immune cell population was
 Supplementary Figure 1. mrna expression of chitinase and chitinase-like protein in splenic immune cells. Each splenic immune cell population was sorted by FACS. Surface markers for sorting were CD11c +
NK cell flow cytometric assay In vivo DC viability and migration assay
 NK cell flow cytometric assay 6 NK cells were purified, by negative selection with the NK Cell Isolation Kit (Miltenyi iotec), from spleen and lymph nodes of 6 RAG1KO mice, injected the day before with
Supplementary Figure Legends. group) and analyzed for Siglec-G expression utilizing a monoclonal antibody to Siglec-G (clone SH2.1).
 and analyzed for Siglec-G expression utilizing a monoclonal antibody to Siglec-G (clone SH2.1).") Supplementary Figure Legends Supplemental Figure : Naïve T cells express Siglec-G. Splenocytes were isolated from WT B or Siglec-G -/- animals that have not been transplanted (n= per group) and analyzed
Supplementary Figure Legends Supplemental Figure : Naïve T cells express Siglec-G. Splenocytes were isolated from WT B or Siglec-G -/- animals that have not been transplanted (n= per group) and analyzed
a surface permeabilized
 a surface permeabilized RAW 64.7 P388D1 J774 b CD11b + Ly-6G - Blood Monocytes WT Supplementary Figure 1. Cell surface expression on macrophages and DCs. (a) RAW64.7, P388D1, and J774 cells were subjected
Therapeutic PD L1 and LAG 3 blockade rapidly clears established blood stage Plasmodium infection
 Supplementary Information Therapeutic PD L1 and LAG 3 blockade rapidly clears established blood stage Plasmodium infection Noah S. Butler, Jacqueline Moebius, Lecia L. Pewe, Boubacar Traore, Ogobara K.
pplementary Figur Supplementary Figure 1. a.
 pplementary Figur Supplementary Figure 1. a. Quantification by RT-qPCR of YFV-17D and YFV-17D pol- (+) RNA in the supernatant of cultured Huh7.5 cells following viral RNA electroporation of respective
Supplementary Figure 1. Immune profiles of untreated and PD-1 blockade resistant EGFR and Kras mouse lung tumors (a) Total lung weight of untreated
 Total lung weight of untreated") 1 Supplementary Figure 1. Immune profiles of untreated and PD-1 blockade resistant EGFR and Kras mouse lung tumors (a) Total lung weight of untreated (U) EGFR TL mice (n=7), Kras mice (n=7), PD-1 blockade
1 Supplementary Figure 1. Immune profiles of untreated and PD-1 blockade resistant EGFR and Kras mouse lung tumors (a) Total lung weight of untreated (U) EGFR TL mice (n=7), Kras mice (n=7), PD-1 blockade
Dual Targeting Nanoparticle Stimulates the Immune
 Dual Targeting Nanoparticle Stimulates the Immune System to Inhibit Tumor Growth Alyssa K. Kosmides, John-William Sidhom, Andrew Fraser, Catherine A. Bessell, Jonathan P. Schneck * Supplemental Figure
Supplementary Figure 1. Efficient DC depletion in CD11c.DOG transgenic mice
 Supplementary Figure 1. Efficient DC depletion in CD11c.DOG transgenic mice (a) CD11c.DOG transgenic mice (tg) were treated with 8 ng/g body weight (b.w.) diphtheria toxin (DT) i.p. on day -1 and every
Supplementary Figure 1. IL-12 serum levels and frequency of subsets in FL patients. (A) IL-12
 IL-12") 1 Supplementary Data Figure legends Supplementary Figure 1. IL-12 serum levels and frequency of subsets in FL patients. (A) IL-12 serum levels measured by multiplex ELISA (Luminex) in FL patients before
1 Supplementary Data Figure legends Supplementary Figure 1. IL-12 serum levels and frequency of subsets in FL patients. (A) IL-12 serum levels measured by multiplex ELISA (Luminex) in FL patients before
Supplemental Information. Checkpoint Blockade Immunotherapy. Induces Dynamic Changes. in PD-1 CD8 + Tumor-Infiltrating T Cells
 Immunity, Volume 50 Supplemental Information Checkpoint Blockade Immunotherapy Induces Dynamic Changes in PD-1 CD8 + Tumor-Infiltrating T Cells Sema Kurtulus, Asaf Madi, Giulia Escobar, Max Klapholz, Jackson
Supplementary Materials for
 www.sciencesignaling.org/cgi/content/full/3/114/ra23/dc1 Supplementary Materials for Regulation of Zap70 Expression During Thymocyte Development Enables Temporal Separation of CD4 and CD8 Repertoire Selection
Inhibition of E-Selectin or E-selectin together with CXCR4 Re-sensitizes Multiple Myeloma to Treatment
 Inhibition of E-Selectin or E-selectin together with CXCR4 Re-sensitizes Multiple Myeloma to Treatment 1, Ph.D. Henna Bazai 1, Anita Sekula 1, William Fogler 2, Ted Smith 2, John Magnani 2 and Abdel Kareem
D CD8 T cell number (x10 6 )
") IFNγ Supplemental Figure 1. CD T cell number (x1 6 ) 18 15 1 9 6 3 CD CD T cells CD6L C CD5 CD T cells CD6L D CD8 T cell number (x1 6 ) 1 8 6 E CD CD8 T cells CD6L F Log(1)CFU/g Feces 1 8 6 p
IFNγ Supplemental Figure 1. CD T cell number (x1 6 ) 18 15 1 9 6 3 CD CD T cells CD6L C CD5 CD T cells CD6L D CD8 T cell number (x1 6 ) 1 8 6 E CD CD8 T cells CD6L F Log(1)CFU/g Feces 1 8 6 p
mtor and MEK1/2 inhibition differentially modulate tumor growth and the immune microenvironment in syngeneic models of oral cavity cancer
 Washington University School of Medicine Digital Commons@Becker Open Access Publications 2015 mtor and MEK1/2 inhibition differentially modulate tumor growth and the immune microenvironment in syngeneic
Supplementary Figure 1. Efficiency of Mll4 deletion and its effect on T cell populations in the periphery. Nature Immunology: doi: /ni.
 Supplementary Figure 1 Efficiency of Mll4 deletion and its effect on T cell populations in the periphery. Expression of Mll4 floxed alleles (16-19) in naive CD4 + T cells isolated from lymph nodes and
% of live splenocytes. STAT5 deletion. (open shapes) % ROSA + % floxed
 % ROSA + % floxed") Supp. Figure 1. a 14 1 1 8 6 spleen cells (x1 6 ) 16 % of live splenocytes 5 4 3 1 % of live splenocytes 8 6 4 b 1 1 c % of CD11c + splenocytes (closed shapes) 8 6 4 8 6 4 % ROSA + (open shapes) % floxed
Supp. Figure 1. a 14 1 1 8 6 spleen cells (x1 6 ) 16 % of live splenocytes 5 4 3 1 % of live splenocytes 8 6 4 b 1 1 c % of CD11c + splenocytes (closed shapes) 8 6 4 8 6 4 % ROSA + (open shapes) % floxed
NKTR-255: Accessing The Immunotherapeutic Potential Of IL-15 for NK Cell Therapies
 NKTR-255: Accessing The Immunotherapeutic Potential Of IL-15 for NK Cell Therapies Saul Kivimäe Senior Scientist, Research Biology Nektar Therapeutics NK Cell-Based Cancer Immunotherapy, September 26-27,
Supplemental Materials for. Effects of sphingosine-1-phosphate receptor 1 phosphorylation in response to. FTY720 during neuroinflammation
 Supplemental Materials for Effects of sphingosine-1-phosphate receptor 1 phosphorylation in response to FTY7 during neuroinflammation This file includes: Supplemental Table 1. EAE clinical parameters of
Page 39 of 44. 8h LTA & AT h PepG & AT h LTA
 Page 39 of 44 Fig. S1 A: B: C: D: 8h LTA 8h LTA & AT7519 E: F: 8h PepG G: 8h PepG & AT7519 Fig. S1. AT7519 overrides the survival effects of lipoteichoic acid (LTA) and peptidoglycan (PepG). (A) Human
SDC (Supplemental Digital Content) Figure S1. Percentages of Granzyme B expressing CD8 + T lymphocytes
 Figure S1. Percentages of Granzyme B expressing CD8 + T lymphocytes") Figure S1. Percentages of Granzyme expressing D8 + T lymphocytes 13.5% 1.4%.6% 77% 21% 24% 76% 8 8 Granzyme + (%) 6 4 2 Granzyme + (%) 6 4 2 D8 + Tnaive Tcm Tem Temra D8 + D8 + D28 + D8 + D28 null We analyzed
Figure S1. Percentages of Granzyme expressing D8 + T lymphocytes 13.5% 1.4%.6% 77% 21% 24% 76% 8 8 Granzyme + (%) 6 4 2 Granzyme + (%) 6 4 2 D8 + Tnaive Tcm Tem Temra D8 + D8 + D28 + D8 + D28 null We analyzed
Department of Radiation Oncology, University of Pittsburgh School of Medicine, Pittsburgh, PA,
 ATR kinase inhibitor AZD6738 potentiates CD8 + T cell-dependent anti-tumor activity following radiation Frank P. Vendetti 1, Pooja Karukonda 1, David A. Clump 1, Troy Teo 1, Ronald Lalonde 1, Katriana
Supplementary Figure 1. Normal T lymphocyte populations in Dapk -/- mice. (a) Normal thymic development in Dapk -/- mice. Thymocytes from WT and Dapk
 Normal thymic development in Dapk -/- mice. Thymocytes from WT and Dapk") Supplementary Figure 1. Normal T lymphocyte populations in Dapk -/- mice. (a) Normal thymic development in Dapk -/- mice. Thymocytes from WT and Dapk -/- mice were stained for expression of CD4 and CD8.
Supplementary Figure 1. Normal T lymphocyte populations in Dapk -/- mice. (a) Normal thymic development in Dapk -/- mice. Thymocytes from WT and Dapk -/- mice were stained for expression of CD4 and CD8.
W/T Itgam -/- F4/80 CD115. F4/80 hi CD115 + F4/80 + CD115 +
 F4/8 % in the peritoneal lavage 6 4 2 p=.15 n.s p=.76 CD115 F4/8 hi CD115 + F4/8 + CD115 + F4/8 hi CD115 + F4/8 + CD115 + MHCII MHCII Supplementary Figure S1. CD11b deficiency affects the cellular responses
Supplementary Figure 1
 Supplementary Figure 1 AAV-GFP injection in the MEC of the mouse brain C57Bl/6 mice at 4 months of age were injected with AAV-GFP into the MEC and sacrificed at 7 days post injection (dpi). (a) Brains
MATERIALS AND METHODS. Neutralizing antibodies specific to mouse Dll1, Dll4, J1 and J2 were prepared as described. 1,2 All
 MATERIALS AND METHODS Antibodies (Abs), flow cytometry analysis and cell lines Neutralizing antibodies specific to mouse Dll1, Dll4, J1 and J2 were prepared as described. 1,2 All other antibodies used
ankylosing spondylitis Department of Clinical Immunology, Xijing Hospital, The Fourth Military
 Functional defects in CD4 + CD25 high FoxP3 + regulatory cells in ankylosing spondylitis Huifang Guo 1, 2, 3, Ming Zheng 1, 2, 3, Kui Zhang 1, 3, Fengfan Yang 1, 3, Xin Zhang 1, 3, Qing Han 1, 3, Zhi-Nan
Supplementary Figure 1. Characterization of basophils after reconstitution of SCID mice
 Supplementary figure legends Supplementary Figure 1. Characterization of after reconstitution of SCID mice with CD4 + CD62L + T cells. (A-C) SCID mice (n = 6 / group) were reconstituted with 2 x 1 6 CD4
mtor plays critical roles in pancreatic cancer stem cells through specific and stemness-related functions
 Supplementary Information mtor plays critical roles in pancreatic cancer stem cells through specific and stemness-related functions Shyuichiro Matsubara 1, Qiang Ding 1, Yumi Miyazaki 1, Taisaku Kuwahata
Supplementary Figure 1. IDH1 and IDH2 mutation site sequences on WHO grade III
 Supplementary Materials: Supplementary Figure 1. IDH1 and IDH2 mutation site sequences on WHO grade III patient samples. Genomic DNA samples extracted from punch biopsies from either FFPE or frozen tumor
Posters and Presentations
 Posters and Presentations June 2017: American Society of Clinical Oncology (ASCO) Annual - Preliminary Correlative Analysis of PD-L1 expression from the SUNRISE Study. View April 2017: American Association
Supplementary Figure 1. Basal level EGFR across a panel of ESCC lines. Immunoblots demonstrate the expression of phosphorylated and total EGFR as
 Supplementary Figure 1. Basal level EGFR across a panel of ESCC lines. Immunoblots demonstrate the expression of phosphorylated and total EGFR as well as their downstream effectors across a panel of ESCC
Supplementary fig. 1. Crystals induce necroptosis does not involve caspases, TNF receptor or NLRP3. A. Mouse tubular epithelial cells were pretreated
 Supplementary fig. 1. Crystals induce necroptosis does not involve caspases, TNF receptor or NLRP3. A. Mouse tubular epithelial cells were pretreated with zvad-fmk (10µM) and exposed to calcium oxalate
Supplementary Fig. 1 p38 MAPK negatively regulates DC differentiation. (a) Western blot analysis of p38 isoform expression in BM cells, immature DCs
 Western blot analysis of p38 isoform expression in BM cells, immature DCs") Supplementary Fig. 1 p38 MAPK negatively regulates DC differentiation. (a) Western blot analysis of p38 isoform expression in BM cells, immature DCs (idcs) and mature DCs (mdcs). A myeloma cell line expressing
Supplementary Fig. 1 p38 MAPK negatively regulates DC differentiation. (a) Western blot analysis of p38 isoform expression in BM cells, immature DCs (idcs) and mature DCs (mdcs). A myeloma cell line expressing
Supplementary Figure 1. Deletion of Smad3 prevents B16F10 melanoma invasion and metastasis in a mouse s.c. tumor model.
 A B16F1 s.c. Lung LN Distant lymph nodes Colon B B16F1 s.c. Supplementary Figure 1. Deletion of Smad3 prevents B16F1 melanoma invasion and metastasis in a mouse s.c. tumor model. Highly invasive growth
Preclinical investigation of the promise and challenges of agonistic anti-gitr antibody therapy. Amy Beebe Merck Research Laboratory March 16, 2017
 Preclinical investigation of the promise and challenges of agonistic anti-gitr antibody therapy Amy Beebe Merck Research Laboratory March 16, 2017 Rationale for anti-gitr agonist in cancer GITR is a co-stimulatory
NKTR-255: Accessing IL-15 Therapeutic Potential through Robust and Sustained Engagement of Innate and Adaptive Immunity
 NKTR-255: Accessing IL-15 Therapeutic Potential through Robust and Sustained Engagement of Innate and Adaptive Immunity Peiwen Kuo Scientist, Research Biology Nektar Therapeutics August 31 st, 2018 Emerging
Supporting Information Table of Contents
 Supporting Information Table of Contents Supporting Information Figure 1 Page 2 Supporting Information Figure 2 Page 4 Supporting Information Figure 3 Page 5 Supporting Information Figure 4 Page 6 Supporting
Supplemental Materials. Stromal Modulation Reverses Primary Resistance to Immune Checkpoint Blockade in. Pancreatic Cancer.
 Supplemental Materials Stromal Modulation Reverses Primary Resistance to Immune Checkpoint Blockade in Pancreatic Cancer Jun Zhao 1, Zhilan Xiao 2, 3, Tingting Li 1, 4, Huiqin Chen 5, Ying Yuan 5, Alan
Supplementary Figure 1
 Supplementary Figure 1 Supplementary Figure 1 Schematic depiction of the tandem Fc GDF15. Supplementary Figure 2 Supplementary Figure 2 Gfral mrna levels in the brains of both wild-type and knockout Gfral
Supplementary Materials for
 www.sciencesignaling.org/cgi/content/full/9/430/ra57/dc1 Supplementary Materials for The 4E-BP eif4e axis promotes rapamycinsensitive growth and proliferation in lymphocytes Lomon So, Jongdae Lee, Miguel
5K ALDEFLUOR-positive/ CXCR1-negative. 5K ALDEFLUOR-positive/ CXCR1-positive BAAA BAAA CXCR1-APC BAAA BAAA CXCR1-APC
 A +DEAB -DEAB K ALDEFLUOR-positive/ CXCR-negative BAAA BAAA CXCR-APC B +DEAB -DEAB K ALDEFLUOR-positive/ CXCR-positive BAAA BAAA CXCR-APC C Supplemental Figure. Tumorigenicity of the ALDEFLUOR-positive/CXCR-positive
SUPPLEMENTARY INFORMATION
 doi:1.138/nature1554 a TNF-α + in CD4 + cells [%] 1 GF SPF 6 b IL-1 + in CD4 + cells [%] 5 4 3 2 1 Supplementary Figure 1. Effect of microbiota on cytokine profiles of T cells in GALT. Frequencies of TNF-α
B220 CD4 CD8. Figure 1. Confocal Image of Sensitized HLN. Representative image of a sensitized HLN
 B220 CD4 CD8 Natarajan et al., unpublished data Figure 1. Confocal Image of Sensitized HLN. Representative image of a sensitized HLN showing B cell follicles and T cell areas. 20 µm thick. Image of magnification
Supplementary Materials for
 www.sciencetranslationalmedicine.org/cgi/content/full/8/339/339ra69/dc1 Supplementary Materials for The caspase-8 inhibitor emricasan combines with the SMAC mimetic birinapant to induce necroptosis and
HEK293FT cells were transiently transfected with reporters, N3-ICD construct and
 Supplementary Information Luciferase reporter assay HEK293FT cells were transiently transfected with reporters, N3-ICD construct and increased amounts of wild type or kinase inactive EGFR. Transfections
Nature Medicine: doi: /nm.3922
 Title: Glucocorticoid-induced tumor necrosis factor receptor-related protein co-stimulation facilitates tumor regression by inducing IL-9-producing helper T cells Authors: Il-Kyu Kim, Byung-Seok Kim, Choong-Hyun
Supporting Information
 Supporting Information lpek et al. 1.173/pnas.1121217 SI Materials and Methods Mice. cell knockout, inos / (Taconic arms), Rag1 /, INγR /, and IL-12p4 / mice (The Jackson Laboratory) were maintained and/or
Beverly A. Teicher, PhD DCTD/NCI. The content reflects my professional opinions, not an NCI policy statement.
 Beverly A. Teicher, PhD DCTD/NCI The content reflects my professional opinions, not an NCI policy statement. Outline 1. Transplantable Syngeneic Tumors 2. Human Tumor Xenografts 3. Disseminated Disease
WISP1 mediates IL-6-dependent proliferation in primary human lung fibroblasts
 WISP mediates IL-6-dependent proliferation in primary human lung fibroblasts Klee S, Lehmann M, Wagner DE, aarsma H, Königshoff M Comprehensive Pneumology Center, Helmholtz Zentrum München, Munich, Germany;
Supplementary Figure S1. PTPN2 levels are not altered in proliferating CD8+ T cells. Lymph node (LN) CD8+ T cells from C57BL/6 mice were stained with
 CD8+ T cells from C57BL/6 mice were stained with") Supplementary Figure S1. PTPN2 levels are not altered in proliferating CD8+ T cells. Lymph node (LN) CD8+ T cells from C57BL/6 mice were stained with CFSE and stimulated with plate-bound α-cd3ε (10µg/ml)
Supplementary Figure S1. PTPN2 levels are not altered in proliferating CD8+ T cells. Lymph node (LN) CD8+ T cells from C57BL/6 mice were stained with CFSE and stimulated with plate-bound α-cd3ε (10µg/ml)
Supplementary Figure 1 IMQ-Induced Mouse Model of Psoriasis. IMQ cream was
 Supplementary Figure 1 IMQ-Induced Mouse Model of Psoriasis. IMQ cream was painted on the shaved back skin of CBL/J and BALB/c mice for consecutive days. (a, b) Phenotypic presentation of mouse back skin
Supplementary Data Table of Contents:
 Supplementary Data Table of Contents: - Supplementary Methods - Supplementary Figures S1(A-B) - Supplementary Figures S2 (A-B) - Supplementary Figures S3 - Supplementary Figures S4(A-B) - Supplementary
Supplementary Figure 1. PD-L1 is glycosylated in cancer cells. (a) Western blot analysis of PD-L1 in breast cancer cells. (b) Western blot analysis
 Western blot analysis of PD-L1 in breast cancer cells. (b) Western blot analysis") Supplementary Figure 1. PD-L1 is glycosylated in cancer cells. (a) Western blot analysis of PD-L1 in breast cancer cells. (b) Western blot analysis of PD-L1 in ovarian cancer cells. (c) Western blot analysis
Supplementary Figure 1. PD-L1 is glycosylated in cancer cells. (a) Western blot analysis of PD-L1 in breast cancer cells. (b) Western blot analysis of PD-L1 in ovarian cancer cells. (c) Western blot analysis
Cathepsin S inhibition combines control of systemic and peripheral pathomechanisms of autoimmune tissue injury
 Cathepsin S inhibition combines control of systemic and peripheral pathomechanisms of autoimmune tissue injury Maia Tato, Santhosh V. Kumar, Yajuan Liu, Shrikant R. Mulay, Solange Moll, Bastian Popper,
Supplementary Figure 1: si-craf but not si-braf sensitizes tumor cells to radiation.
 Supplementary Figure 1: si-craf but not si-braf sensitizes tumor cells to radiation. (a) Embryonic fibroblasts isolated from wildtype (WT), BRAF -/-, or CRAF -/- mice were irradiated (6 Gy) and DNA damage
Supplementary Fig. 1 No relative growth advantage of Foxp3 negative cells.
 Supplementary Fig. 1 Supplementary Figure S1: No relative growth advantage of Foxp3 negative cells. itreg were induced from WT (A) or FIR (B) CD4 + T cells. FIR itregs were then removed from the TCR signal
(A) Dose response curves of HMLE_shGFP (blue circle), HMLE_shEcad (red square),
 Dose response curves of HMLE_shGFP (blue circle), HMLE_shEcad (red square),") Supplementary Figures and Tables Figure S1. Validation of EMT-selective small molecules (A) Dose response curves of HMLE_shGFP (blue circle), HMLE_shEcad (red square), and HMLE_Twist (black diamond) cells
Supplementary Figures and Tables Figure S1. Validation of EMT-selective small molecules (A) Dose response curves of HMLE_shGFP (blue circle), HMLE_shEcad (red square), and HMLE_Twist (black diamond) cells
Supplemental Table I.
 Supplemental Table I Male / Mean ± SEM n Mean ± SEM n Body weight, g 29.2±0.4 17 29.7±0.5 17 Total cholesterol, mg/dl 534.0±30.8 17 561.6±26.1 17 HDL-cholesterol, mg/dl 9.6±0.8 17 10.1±0.7 17 Triglycerides,
Transduction of lentivirus to human primary CD4+ T cells
 Transduction of lentivirus to human primary CD4 + T cells Human primary CD4 T cells were stimulated with anti-cd3/cd28 antibodies (10 µl/2 5 10^6 cells of Dynabeads CD3/CD28 T cell expander, Invitrogen)
Supplementary Fig. 1. GPRC5A post-transcriptionally down-regulates EGFR expression. (a) Plot of the changes in steady state mrna levels versus
 Plot of the changes in steady state mrna levels versus") Supplementary Fig. 1. GPRC5A post-transcriptionally down-regulates EGFR expression. (a) Plot of the changes in steady state mrna levels versus changes in corresponding proteins between wild type and Gprc5a-/-
Supplementary Fig. 1. GPRC5A post-transcriptionally down-regulates EGFR expression. (a) Plot of the changes in steady state mrna levels versus changes in corresponding proteins between wild type and Gprc5a-/-
Supplementary Figure 1
 Supplementary Figure 1 Identification of IFN-γ-producing CD8 + and CD4 + T cells with naive phenotype by alternative gating and sample-processing strategies. a. Contour 5% probability plots show definition
The encephalitogenicity of TH17 cells is dependent on IL-1- and IL-23- induced production of the cytokine GM-CSF
 CORRECTION NOTICE Nat.Immunol. 12, 568 575 (2011) The encephalitogenicity of TH17 cells is dependent on IL-1- and IL-23- induced production of the cytokine GM-CSF Mohamed El-Behi, Bogoljub Ciric, Hong
CANCER THERAPEUTICS: A NOVEL APPROACH
 CANCER THERAPEUTICS: A NOVEL APPROACH Mary Dwyer, Ph.D. HBRI and ChemRegen, Inc. SCDMDG Meeting October 23, 212 Outline Introduction Hit, HBRI1: identification & characterization Leads, HBRI2 & HBRI3:
SUPPLEMENTARY MATERIAL
 SUPPLEMENTARY MATERIAL IL-1 signaling modulates activation of STAT transcription factors to antagonize retinoic acid signaling and control the T H 17 cell it reg cell balance Rajatava Basu 1,5, Sarah K.
Supplementary. presence of the. (c) mrna expression. Error. in naive or
 mrna expression. Error. in naive or") Figure 1. (a) Naive CD4 + T cells were activated in the presence of the indicated cytokines for 3 days. Enpp2 mrna expression was measured by qrt-pcrhr, infected with (b, c) Naive CD4 + T cells were activated
Figure 1. (a) Naive CD4 + T cells were activated in the presence of the indicated cytokines for 3 days. Enpp2 mrna expression was measured by qrt-pcrhr, infected with (b, c) Naive CD4 + T cells were activated
Dual-targeting anti- CD47 bispecific antibodies: Safely provoking macrophages to feast NALM-6 tumor cells (B-ALL) Human macrophages
 Human macrophages") Dual-targeting anti- CD47 bispecific antibodies: Safely provoking macrophages to feast Krzysztof Masternak, PhD, Head of Biology 1 2 nd Biologics & BOARD Biosimilars MEETING Congress MARCH 2012 NALM-6
Dual-targeting anti- CD47 bispecific antibodies: Safely provoking macrophages to feast Krzysztof Masternak, PhD, Head of Biology 1 2 nd Biologics & BOARD Biosimilars MEETING Congress MARCH 2012 NALM-6
Spleen. mlns. E Spleen 4.1. mlns. Spleen. mlns. Mock 17. Mock CD8 HIV-1 CD38 HLA-DR. Ki67. Spleen. Spleen. mlns. Cheng et al. Fig.
 C D E F Mock 17 Mock 4.1 CD38 57 CD8 23.7 HLA-DR Ki67 G H I Cheng et al. Fig.S1 Supplementary Figure 1. persistent infection leads to human T cell depletion and hyper-immune activation. Humanized mice
Supplementary Figure S1
 Supplementary Figure S1 12 1 8 6 4 2 1-3 1-2 1-1 1 1 1 1 2 1 3 PF-364422 (µm) U87 (EC 5 = 52.2 ± 8.8 µm) 12 1 8 6 4 2 1-4 1-3 1-2 1-1 1 1 1 1 2 CMPD1 (µm) Primary GM (EC 5 = 1.55 ±.3 µm) U138 (EC 5 = 1.7
Data Sheet PD-1 / NFAT Reporter - Jurkat Cell Line Catalog #: 60535
 Data Sheet PD-1 / NFAT Reporter - Jurkat Cell Line Catalog #: 60535 Product Description Recombinant Jurkat T cell expressing firefly luciferase gene under the control of NFAT response elements with constitutive
Nature Medicine doi: /nm.3957
 Supplementary Fig. 1. p38 alternative activation, IL-21 expression, and T helper cell transcription factors in PDAC tissue. (a) Tissue microarrays of pancreatic tissue from 192 patients with pancreatic
Cover Page. The handle holds various files of this Leiden University dissertation.
 Cover Page The handle http://hdl.handle.net/1887/23854 holds various files of this Leiden University dissertation. Author: Marel, Sander van der Title: Gene and cell therapy based treatment strategies
Expanded View Figures
 Shao-Ming Shen et al Role of I in MT of cancers MO reports xpanded View igures igure V1. nalysis of the expression of I isoforms in cancer cells and their interaction with PTN. RT PR detection of Ish and
PD-L1 blockade enhances response of pancreatic ductal adenocarcinoma to radiotherapy
 Research Article PD-L1 blockade enhances response of pancreatic ductal adenocarcinoma to radiotherapy Abul Azad 1,, Su Yin Lim 1,, Zenobia D Costa 1, Keaton Jones 1, Angela Diana 1, Owen J Sansom 2, Philipp
Pearson r = P (one-tailed) = n = 9
 = n = 9") 8F4-Specific Lysis, % 1 UPN1 UPN3 8 UPN7 6 Pearson r =.69 UPN2 UPN5 P (one-tailed) =.192 4 UPN8 n = 9 2 UPN9 UPN4 UPN6 5 1 15 2 25 8 8F4, % Max MFI Supplementary Figure S1. AML samples UPN1-UPN9 show variable
8F4-Specific Lysis, % 1 UPN1 UPN3 8 UPN7 6 Pearson r =.69 UPN2 UPN5 P (one-tailed) =.192 4 UPN8 n = 9 2 UPN9 UPN4 UPN6 5 1 15 2 25 8 8F4, % Max MFI Supplementary Figure S1. AML samples UPN1-UPN9 show variable
Supplementary Figure 1. Supernatants electrophoresis from CD14+ and dendritic cells. Supernatants were resolved by SDS-PAGE and stained with
 Supplementary Figure 1. Supernatants electrophoresis from CD14+ and dendritic cells. Supernatants were resolved by SDS-PAGE and stained with Coomassie brilliant blue. One µg/ml recombinant human (rh) apo-e
Human and mouse T cell regulation mediated by soluble CD52 interaction with Siglec-10. Esther Bandala-Sanchez, Yuxia Zhang, Simone Reinwald,
 Human and mouse T cell regulation mediated by soluble CD52 interaction with Siglec-1 Esther Bandala-Sanchez, Yuxia Zhang, Simone Reinwald, James A. Dromey, Bo Han Lee, Junyan Qian, Ralph M Böhmer and Leonard
Supplementary Materials for
 www.sciencetranslationalmedicine.org/cgi/content/full/8/333/333ra47/dc1 Supplementary Materials for Androgen receptor antagonists compromise T cell response against prostate cancer leading to early tumor
X P. Supplementary Figure 1. Nature Medicine: doi: /nm Nilotinib LSK LT-HSC. Cytoplasm. Cytoplasm. Nucleus. Nucleus
 a b c Supplementary Figure 1 c-kit-apc-eflu780 Lin-FITC Flt3-Linc-Kit-APC-eflu780 LSK Sca-1-PE-Cy7 d e f CD48-APC LT-HSC CD150-PerCP-cy5.5 g h i j Cytoplasm RCC1 X Exp 5 mir 126 SPRED1 SPRED1 RAN P SPRED1
Supplementary Figure 1
 Supplementary Figure 1 a γ-h2ax MDC1 RNF8 FK2 BRCA1 U2OS Cells sgrna-1 ** 60 sgrna 40 20 0 % positive Cells (>5 foci per cell) b ** 80 sgrna sgrna γ-h2ax MDC1 γ-h2ax RNF8 FK2 MDC1 BRCA1 RNF8 FK2 BRCA1
of whole cell cultures in U-bottomed wells of a 96-well plate are shown. 2
 Supplementary online material Supplementary figure legends Supplementary Figure 1 Exposure to T reg cells causes loss of T resp cells in co-cultures. T resp cells were stimulated with CD3+CD28 alone or
Supplementary Figure 1
 Supplementary Figure 1 Expression of apoptosis-related genes in tumor T reg cells. (a) Identification of FOXP3 T reg cells by FACS. CD45 + cells were gated as enriched lymphoid cell populations with low-granularity.
Supplementary Information Titles Journal: Nature Medicine
 Supplementary Information Titles Journal: Nature Medicine Article Title: Corresponding Author: Supplementary Item & Number Supplementary Fig.1 Fig.2 Fig.3 Fig.4 Fig.5 Fig.6 Fig.7 Fig.8 Fig.9 Fig. Fig.11
A Salt Sensing Kinase in T Lymphocytes, SGK1, Drives Hypertension and Hypertensive End-Organ Damage
 A Salt Sensing Kinase in T Lymphocytes, SGK1, Drives Hypertension and Hypertensive End-Organ Damage Allison E. Norlander 1, Mohamed A. Saleh 2,3, Arvind K. Pandey 4, Hana A. Itani 2, Jing Wu 1, Liang Xiao
Cytokine Arrays Reveal Black Ops Tactics of Tumor-induced Immunosuppression
 Cytokine Arrays Reveal Black Ops Tactics of Tumor-induced Immunosuppression Jarad J Wilson, Ph.D. Technical Support & Marketing Specialist Ruo-Pan Huang, MD, Ph.D. Founder and CEO What are Antibody Arrays?
SUPPLEMENTARY INFORMATION
 DOI: 1.138/ncb3355 a S1A8 + cells/ total.1.8.6.4.2 b S1A8/?-Actin c % T-cell proliferation 3 25 2 15 1 5 T cells Supplementary Figure 1 Inter-tumoral heterogeneity of MDSC accumulation in mammary tumor
Supplemental Materials
 Supplemental Materials Programmed death one homolog maintains the pool size of regulatory T cells by promoting their differentiation and stability Qi Wang 1, Jianwei He 1, Dallas B. Flies 2, Liqun Luo
Chemotherapy enhances tumor cell susceptibility to CTL-mediated killing during cancer immunotherapy in mice
 Chemotherapy enhances tumor cell susceptibility to CTL-mediated killing during cancer immunotherapy in mice Rupal Ramakrishnan,, Esteban Celis, Dmitry I. Gabrilovich J Clin Invest. 2010;120(4):1111-1124.
Supplemental Figure 1. Signature gene expression in in vitro differentiated Th0, Th1, Th2, Th17 and Treg cells. (A) Naïve CD4 + T cells were cultured
 Naïve CD4 + T cells were cultured") Supplemental Figure 1. Signature gene expression in in vitro differentiated Th0, Th1, Th2, Th17 and Treg cells. (A) Naïve CD4 + T cells were cultured under Th0, Th1, Th2, Th17, and Treg conditions. mrna
Supplemental Figure 1. Signature gene expression in in vitro differentiated Th0, Th1, Th2, Th17 and Treg cells. (A) Naïve CD4 + T cells were cultured under Th0, Th1, Th2, Th17, and Treg conditions. mrna
SUPPLEMENTARY INFORMATION
 doi:10.1038/nature12215 Supplementary Figure 1. The effects of full and dissociated GR agonists in supporting BFU-E self-renewal divisions. BFU-Es were cultured in self-renewal medium with indicated GR
Supplementary Figures
 Supplementary Figures Supplementary Fig. 1. Surface thiol groups and reduction of activated T cells. (a) Activated CD8 + T-cells have high expression levels of free thiol groups on cell surface proteins.