Supplemental Figure 1. (A) The localization of Cre DNA recombinase in the testis of Cyp19a1-Cre mice was detected by immunohistchemical analyses
|
|
|
- Donald Maxwell
- 5 years ago
- Views:
Transcription
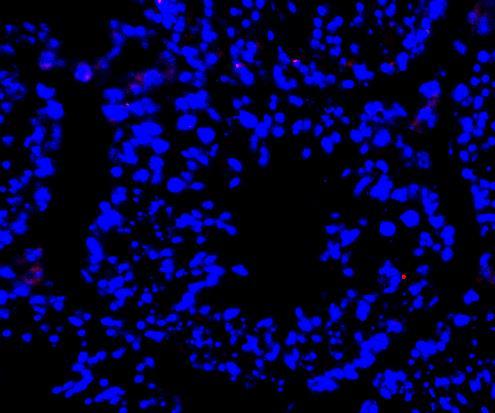
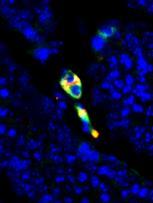
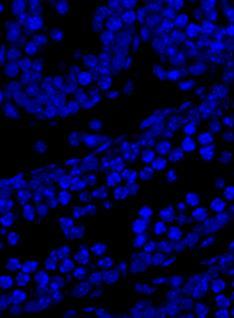
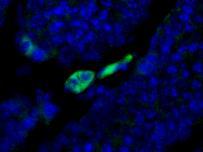
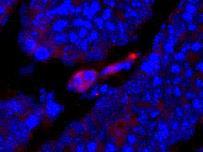
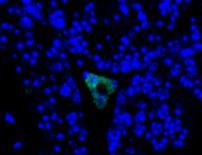
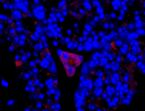
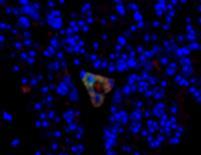
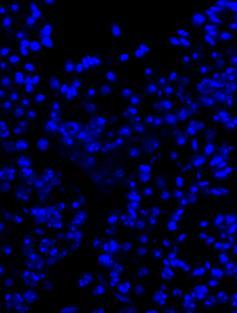
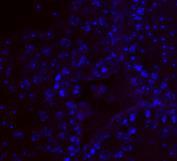
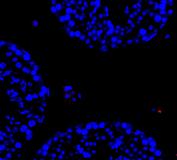
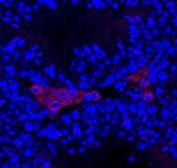
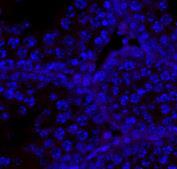
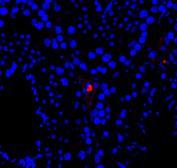
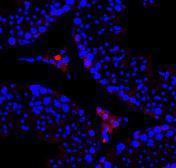
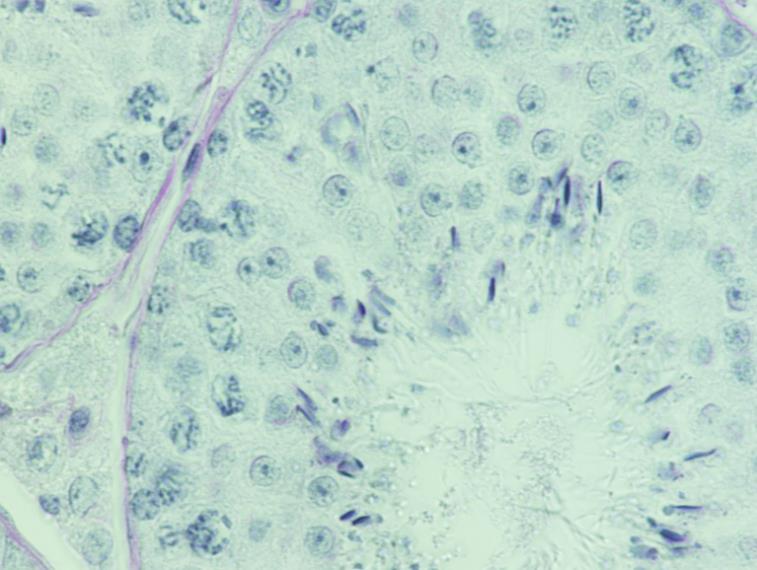
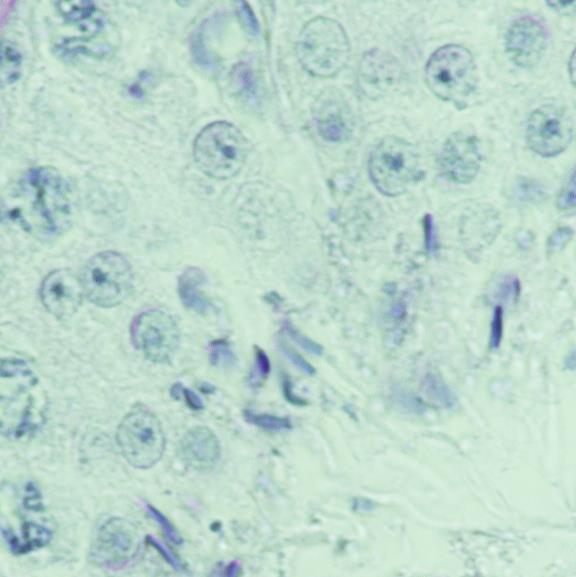
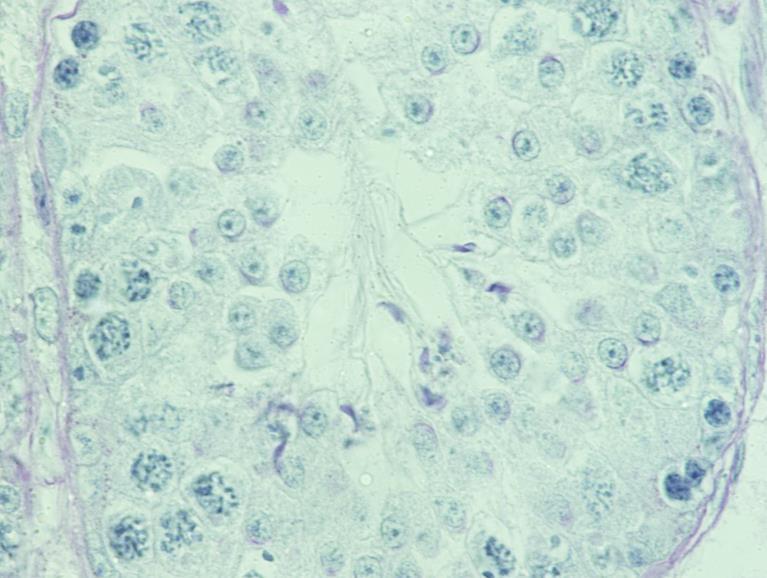
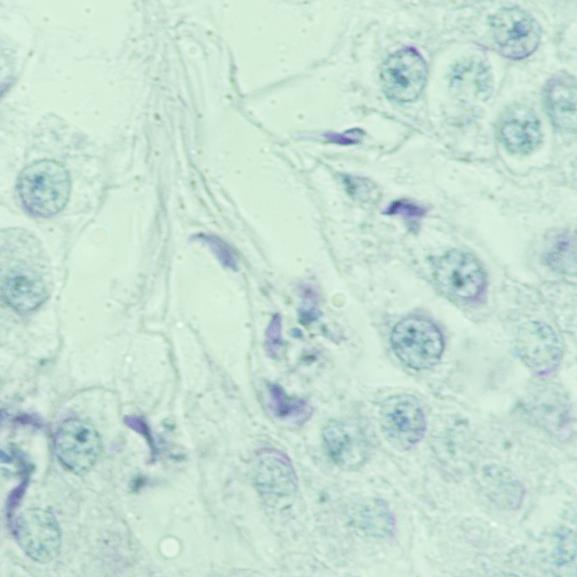
1 Supplemental Figure 1. (A) The localization of Cre DNA recombinase in the testis of Cyp19a1-Cre mice was detected by immunohistchemical analyses using an anti-cre antibody; testes at 1 week (left panel), testes at 12 weeks (right panel). The positive signals were only detected in round interstitial cells (newly formed adult Leydig cells) in testes at 1 week. Scale bars correspond to 100 μm. (B) Cross-sections of mouse testes were stained with antibodies to visualize either Cre DNA recombinase (green) or Cyp19 (red), at postnatal 1 week. White lines delineate the border of the seminiferous tubules. Scale bars correspond to 100 μm. (C) Expression of RFP in the testes of Cyp19-Cre; RFP knock in mice. (D) Expression of the EGF domain of NRG1 in testes of and Nrg1 flox/flox ; Cyp19a1-Cre mice. NRG1 was detected by immunofluorescence using an anti-egf domain of NRG1 antiserum (Kawashima et al., 2014). Red signals are the EGF domain positive cells and blue signals are nuclei. The white line delineates the border of the seminiferous tubules. Scale bars correspond to 100 μm. Positive signals were not detected in interstitial cells of Nrg1 flox/flox ; Cyp19a1-Cre mice, indicating that the functional NRG1 was deleted in ALCs in the mice. NRG1 staining also occurs in spermatogenic cells as reported previously (29) but is not altered in the Nrg1 flox/flox ; Cyp19a1-Cre mice. N.C.; negative controls without primary antibody.

 1week CRE")

2 (A) 1week 12week : CRE Positive cell (B) 1week CRE / CYP19/ DAPI Supplemental Figure 1


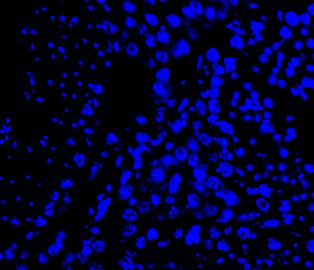
3 (C) 12 week Cyp19-Cre Rfp / DAPI (D) Nrg1 flox/flox ;Cyp19-Cre N.C 1 w 12 w EGF domain / DAPI Supplemental Figure 1
4 Supplemental Figure 2. (A) The expression of type II Nrg1 was not detected in testis. Type II of Nrg1 mrna was analyzed by real-time PCR using specific primer set to recognize the specific region of type II Nrg1. Values are represented as the mean ± SEM of three replicates. (B) The expression of NRG1 in hcg-stimulated mouse testes following GnRH-antagonist treatment. Red signals are NRG1 positive cells; blue signals are nuclei (DAPI). Immature mice at 21 days of age were treated daily for 2 days with a GnRH antagonist (25 μg/day) followed by an i.p. injections of saline or 10 I.U. hcg. After 4 hours, testes was collected and immune-stained. White lines show the localization of seminiferous tubule. Scale bars correspond to 100 μm. The percent of NRG1 positive cells per total number of the interstitial cells was significantly increased by hcg injection. N.C.; negative controls without primary antibody.
 0.")


5 The percent of NRG1 positive cell per interstitial cells Type II Nrg1 / L19 (A) Type II Nrg1 mrna N.D. (B) 0 0week 1week 3week 5week Adult Antagonist Antagonist+hCG N.C NRG1/DAPI 50% 45% * 40% 35% 30% 25% 20% 15% 10% 5% 0% Anta Anta+hCG Supplemental Figure 2
6 Supplemental Figure 3. ErbB3 that is one of the NRG1 receptors is expressed in HSD17B3 positive-leydig cells (ALCs) in mouse testes. Cross-sections of mouse testes were stained with antibodies to visualize either ERBB3 (green) or HSD17B3 (red) at postnatal 1 week (infant) and 12 weeks (adult). White lines delineate the seminiferous tubules. Scale bars correspond to 100 μm. Arrows indicate ERBB3 and/or HSD17B3 positive cells in the interstitial tissue. N.C.; negative controls without primary antibody.
7 ERBB3/DAPI HSD17B3/DAPI ERBB3/HSD17B3/DAPI N.C 1w 12w Supplemental Figure 3
8 Supplemental Figure 4 The photographic image shows the gross morphology of testes at 12 weeks of age in and LeyNrg1KO (KO) mice. Scale bars correspond to 5 mm.
9 12 week KO Supplemental Figure 4
10 Supplemental Figure 5. (A) Phosphorylation of ERK1/2 in testis of but not LeyNrg1KO (KO) mice at 3 and 12 weeks of age. Red signals are phosphorylated ERK1/2 positive cells. Blue signals are nuclei (DAPI). The white lines delineate the seminiferous tubules. Scale bars correspond to 100 µm. (B) Phosphorylation of AKT is detected in testes of but not LeyNrg1KO (KO) mice at 3 and 12 weeks of age. Red signals are phosphorylated AKT positive cells. Blue signals are nuclei (DAPI). The white line sdelineate the seminiferous tubules. Scale bars correspond to 100 µm.

11 (A) 3week 12week KO (B) 3week p-erk1/2/dapi 12week KO p-akt/dapi Supplemental Figure 5
12 Supplemental Figure 6. The phenotype of seminiferous tubules in LeyNrg1KO. (A) The percent of each stage of spermatogenesis in the seminiferous tubules of 3-month-old and LeyNrg1KO (KO) mice. Paraffin sections of each testis were stained in periodic acid-shiff and the stages of spermatogenesis in the tubules were determined according to Oakberg et al (1956). Values are presented as the mean +/- SEM of three different testes in each genotype. (B) The number of Sertoli cells per seminiferous tubule in testes of and LeyNrg1KO (KO) mice at 1 and 12 weeks of age. Values are mean +/- SEM of three different testes in each genotype. (C) The morphology of seminiferous tubules in testes collected from 3-month-old or LeyNrg1KO (KO) mice. Scale bars correspond to 100 µm in low magnification ( 100) and 25 µm in high magnification ( 400). Approximately half of the elongated spermatids were detached (black arrow) from Sertoli cells into the lumen of the tubule at stage VI in the LeyNrg1KO (KO) mice. However, most of elongated spermatids remained attached to Sertoli cells at the same stage in testes of mice (white arrow). (D) Cross sections of testes collected from 3-month-old and LeyNrg1KO (KO) mice were stained by the TUNEL method to detect apoptotic cells (DNA fragmentation). TUNEL-positive signals (green) and nuclei (blue;dapi) indicate that there are more apoptotic cells in the mutant compared to testes. The white line delineates the border of the seminiferous tubule. Scale bars correspond to 100 µm. (E) The percent of TUNEL-positive cells in the lumen of testes in 3-month-old and LeyNrg1KO (KO) mice. Values are mean +/- SEM of three different testes in each genotype. *denotes a significant difference observed between genotypes.
13 The percent of seminiferous tubes stage The number of Sertoli cells per seminiferous tubes (A) (B) 20% 18% 16% 14% 12% 10% 8% 6% 4% 2% 0% I II/III IV V VI VII VIII IX X XI XII KO KO 1month 1 week 12 3month week Supplemental Figure 6
14 (C) Low magnification KO High magnification KO Supplemental Figure 6
 TUNEL /DAPI (E) 25%")

15 The percent of TUNEL-positive lumen (D) TUNEL /DAPI (E) 25% * 20% 15% KO TUNEL /DAPI 10% 5% 0% KO Supplemental Figure 6
16 Supplemental Table1. List of primers employed for RT-PCR and the expected size Gene Forward Primer Reverse Primer Size Anneling temperature L19 5 -GGCATAGGGAAGAGGAAGG-3 5 -GGATGTGCTCCATGAGGATGC Nrg1 5'-CAAGGCTACGGGAGAAGAAATATG -3' 5'-ACAGAACTTGTGTTGCTGTCCATT-3' Nrg1 type I 5 -GGGAATGAGCTGAACCGTAG-3 5 -ACAATGGTGATGTTGGCAGA Nrg1 type II 5 -CTGGGACCAGCCATCTCATA-3 5 -GTTTGGACTTTCATGGGCAC Nrg1 type III 5 -TGCATTGCTGGCCTAAAGTG GTTCTTCCGGGTGGGTACTG Hsd3b6 5 -CGGTTGTACGGGCAAATTCT-3 5 -GAAGCCCCACTCCTTGCTC Cyp17a1 5 -GGCCCCAGATGGTGACTCT-3 5 -GGGACTCCCCGTCGTATGTA
Figure S1. (A) Schematic diagram of dnrar transgene allele. (B) X-Gal staining of testis from
 Schematic diagram of dnrar transgene allele. (B) X-Gal staining of testis from") Figure S1. (A) Schematic diagram of dnrar transgene allele. (B) X-Gal staining of testis from germ cell mutants (dnrar flox/flox, Stra8-Cre +, RARElacZ) (A ), controls (dnrar flox/flox, RARElacZ) (B ),
Figure S1. (A) Schematic diagram of dnrar transgene allele. (B) X-Gal staining of testis from germ cell mutants (dnrar flox/flox, Stra8-Cre +, RARElacZ) (A ), controls (dnrar flox/flox, RARElacZ) (B ),
Supplementary Figure 1. EC-specific Deletion of Snail1 Does Not Affect EC Apoptosis. (a,b) Cryo-sections of WT (a) and Snail1 LOF (b) embryos at
 Cryo-sections of WT (a) and Snail1 LOF (b) embryos at") Supplementary Figure 1. EC-specific Deletion of Snail1 Does Not Affect EC Apoptosis. (a,b) Cryo-sections of WT (a) and Snail1 LOF (b) embryos at E10.5 were double-stained for TUNEL (red) and PECAM-1 (green).
Supplementary Figure 1. EC-specific Deletion of Snail1 Does Not Affect EC Apoptosis. (a,b) Cryo-sections of WT (a) and Snail1 LOF (b) embryos at E10.5 were double-stained for TUNEL (red) and PECAM-1 (green).
Nature Structural & Molecular Biology: doi: /nsmb Supplementary Figure 1. Generation and validation of mtef4-knockout mice.
 Supplementary Figure 1 Generation and validation of mtef4-knockout mice. (a) Alignment of EF4 (E. coli) with mouse, yeast and human EF4. (b) Domain structures of mouse mtef4 compared to those of EF4 (E.
Deletion of tyrosine phosphatase Shp2 in Sertoli cells causes infertility. in mice
 Deletion of tyrosine phosphatase Shp2 in Sertoli cells causes infertility in mice Xiaopeng Hu 1 *, Zhenzhou Tang 1,2 *, Yang Li 2 *, Wensheng Liu 2, Shuang Zhang 3, Bingyan Wang 3, Yingpu Tian 2, Yinan
Supplemental Figure 1: Leydig cells are reduced at multiple stages in both male sterile mutants
 SUPPLEMENTAL FIGURE LEGENDS: Supplemental Figure 1: Leydig cells are reduced at multiple stages in both male sterile mutants (Sgpl1 -/- and Plekha1 -/- ). Using an antibody against CYP11a1 to label Leydig
5 -GGTAAAGCAGGTCTAGGTGGCTGACAGTCT-3. Cre-transgene allele was detected. by PCR using the primers; 5 -ACATGTTCAGGGATCGCCAG-3 and
 Supplemental Information Methods PCR primers for mice genotyping The Gab1 flox allele can be distinguished from the wild type Gab1 allele by PCR on genomic DNAs extracted from tails, using the primer pair
Supplemental Figure 1. Western blot analysis indicated that MIF was detected in the fractions of
 Supplemental Figure Legends Supplemental Figure 1. Western blot analysis indicated that was detected in the fractions of plasma membrane and cytosol but not in nuclear fraction isolated from Pkd1 null
SOPten flox/flox (KO) Pten flox/flox (WT) flox allele 6.0 kb. Pten. Actin. ! allele 2.3 kb. Supplementary Figure S1. Yanagi, et al.
 Pten flox/flox (WT) flox allele 6.0 kb. Pten. Actin. ! allele 2.3 kb. Supplementary Figure S1. Yanagi, et al.") s1 A Pten flox/flox () SOPten flox/flox () flox allele 6. kb B Pten flox/flox () SOPten flox/flox () Pten Actin! allele 2.3 kb Supplementary Figure S1. Yanagi, et al. A B BrdU BrdU positive cells ( ) 3
s1 A Pten flox/flox () SOPten flox/flox () flox allele 6. kb B Pten flox/flox () SOPten flox/flox () Pten Actin! allele 2.3 kb Supplementary Figure S1. Yanagi, et al. A B BrdU BrdU positive cells ( ) 3
(A) PCR primers (arrows) designed to distinguish wild type (P1+P2), targeted (P1+P2) and excised (P1+P3)14-
 PCR primers (arrows) designed to distinguish wild type (P1+P2), targeted (P1+P2) and excised (P1+P3)14-") 1 Supplemental Figure Legends Figure S1. Mammary tumors of ErbB2 KI mice with 14-3-3σ ablation have elevated ErbB2 transcript levels and cell proliferation (A) PCR primers (arrows) designed to distinguish
1 Supplemental Figure Legends Figure S1. Mammary tumors of ErbB2 KI mice with 14-3-3σ ablation have elevated ErbB2 transcript levels and cell proliferation (A) PCR primers (arrows) designed to distinguish
SUPPLEMENTAL INFORMATION FOR. PAX7 expression defines germline stem cells in the adult testis
 SUPPLEMENTAL INFORMATION FOR PAX7 expression defines germline stem cells in the adult testis Gina M. Aloisio, Yuji Nakada, Hatice D. Saatcioglu, Christopher G. Peña, Michael D. Baker, Edward D. Tarnawa,
SUPPLEMENTARY INFORMATION
 doi:10.1038/nature12652 Supplementary Figure 1. PRDM16 interacts with endogenous EHMT1 in brown adipocytes. Immunoprecipitation of PRDM16 complex by flag antibody (M2) followed by Western blot analysis
Supplementary Figure S I: Effects of D4F on body weight and serum lipids in apoe -/- mice.
 Supplementary Figures: Supplementary Figure S I: Effects of D4F on body weight and serum lipids in apoe -/- mice. Male apoe -/- mice were fed a high-fat diet for 8 weeks, and given PBS (model group) or
marker. DAPI labels nuclei. Flies were 20 days old. Scale bar is 5 µm. Ctrl is
 Supplementary Figure 1. (a) Nos is detected in glial cells in both control and GFAP R79H transgenic flies (arrows), but not in deletion mutant Nos Δ15 animals. Repo is a glial cell marker. DAPI labels
Supplemental Table 1. Primers used for RT-PCR analysis of inflammatory cytokines Gene Primer Sequence
 Supplemental Table 1. Primers used for RT-PCR analysis of inflammatory cytokines Gene Primer Sequence IL-1α Forward primer 5 -CAAGATGGCCAAAGTTCGTGAC-3' Reverse primer 5 -GTCTCATGAAGTGAGCCATAGC-3 IL-1β
Supplementary Figure 1.TRIM33 binds β-catenin in the nucleus. a & b, Co-IP of endogenous TRIM33 with β-catenin in HT-29 cells (a) and HEK 293T cells
 and HEK 293T cells") Supplementary Figure 1.TRIM33 binds β-catenin in the nucleus. a & b, Co-IP of endogenous TRIM33 with β-catenin in HT-29 cells (a) and HEK 293T cells (b). TRIM33 was immunoprecipitated, and the amount of
Supplementary Figure 1.TRIM33 binds β-catenin in the nucleus. a & b, Co-IP of endogenous TRIM33 with β-catenin in HT-29 cells (a) and HEK 293T cells (b). TRIM33 was immunoprecipitated, and the amount of
Nature Immunology: doi: /ni eee Supplementary Figure 1
 eee Supplementary Figure 1 Hyphae induce NET release, but yeast do not. (a) NET release by human peripheral neutrophils stimulated with a hgc1 yeast-locked C. albicans mutant (yeast) or pre-formed WT C.
Nature Medicine: doi: /nm.4322
 1 2 3 4 5 6 7 8 9 10 11 Supplementary Figure 1. Predicted RNA structure of 3 UTR and sequence alignment of deleted nucleotides. (a) Predicted RNA secondary structure of ZIKV 3 UTR. The stem-loop structure
Supplemental Figure 1. Intracranial transduction of a modified ptomo lentiviral vector in the mouse
 Supplemental figure legends Supplemental Figure 1. Intracranial transduction of a modified ptomo lentiviral vector in the mouse hippocampus targets GFAP-positive but not NeuN-positive cells. (A) Stereotaxic
Supplementary Figure 1: Hsp60 / IEC mice are embryonically lethal (A) Light microscopic pictures show mouse embryos at developmental stage E12.
 Light microscopic pictures show mouse embryos at developmental stage E12.") Supplementary Figure 1: Hsp60 / IEC mice are embryonically lethal (A) Light microscopic pictures show mouse embryos at developmental stage E12.5 and E13.5 prepared from uteri of dams and subsequently genotyped.
Supplementary Figure 1: Hsp60 / IEC mice are embryonically lethal (A) Light microscopic pictures show mouse embryos at developmental stage E12.5 and E13.5 prepared from uteri of dams and subsequently genotyped.
SUPPLEMENTAL INFORMATIONS
 1 SUPPLEMENTAL INFORMATIONS Figure S1 Cumulative ZIKV production by testis explants over a 9 day-culture period. Viral titer values presented in Figure 1B (viral release over a 3 day-culture period measured
Supplementary Figure 1
 Combination index (CI) Supplementary Figure 1 2. 1.5 1. Ishikawa AN3CA Nou-1 Hec-18.5...2.4.6.8 1. Fraction affected (Fa) Supplementary Figure 1. The synergistic effect of PARP inhibitor and PI3K inhibitor
(A) RT-PCR for components of the Shh/Gli pathway in normal fetus cell (MRC-5) and a
 RT-PCR for components of the Shh/Gli pathway in normal fetus cell (MRC-5) and a") Supplementary figure legends Supplementary Figure 1. Expression of Shh signaling components in a panel of gastric cancer. (A) RT-PCR for components of the Shh/Gli pathway in normal fetus cell (MRC-5) and
Supplementary figure legends Supplementary Figure 1. Expression of Shh signaling components in a panel of gastric cancer. (A) RT-PCR for components of the Shh/Gli pathway in normal fetus cell (MRC-5) and
Supplemental Table S1. Primers used in qrt-pcr analyses. Supplemental Figure S1, related to Figure 4. Extracellular matrix proteins
 Supplemental Material PDGFRb regulates craniofacial development through homodimers and functional heterodimers with PDGFRa Katherine A. Fantauzzo and Philippe Soriano Supplemental materials provided: Supplemental
Supplementary Table 1. The primers used for quantitative RT-PCR. Gene name Forward (5 > 3 ) Reverse (5 > 3 )
 Reverse (5 > 3 )") 770 771 Supplementary Table 1. The primers used for quantitative RT-PCR. Gene name Forward (5 > 3 ) Reverse (5 > 3 ) Human CXCL1 GCGCCCAAACCGAAGTCATA ATGGGGGATGCAGGATTGAG PF4 CCCCACTGCCCAACTGATAG TTCTTGTACAGCGGGGCTTG
770 771 Supplementary Table 1. The primers used for quantitative RT-PCR. Gene name Forward (5 > 3 ) Reverse (5 > 3 ) Human CXCL1 GCGCCCAAACCGAAGTCATA ATGGGGGATGCAGGATTGAG PF4 CCCCACTGCCCAACTGATAG TTCTTGTACAGCGGGGCTTG
SUPPLEMENTARY INFORMATION
 1. Supplementary Figures and Legends Supplementary Fig. 1. S1P-mediated transcriptional regulation of integrins expressed in OP/monocytoid cells. Real-time quantitative PCR analyses of mrna for two integrins,
Supplementary Materials and Methods
 Supplementary Materials and Methods Whole Mount X-Gal Staining Whole tissues were collected, rinsed with PBS and fixed with 4% PFA. Tissues were then rinsed in rinse buffer (100 mm Sodium Phosphate ph
SUPPLEMENTARY FIGURE LEGENDS
 SUPPLEMENTARY FIGURE LEGENDS Supplementary Figure 1. Hippocampal sections from new-born Pten+/+ and PtenFV/FV pups were stained with haematoxylin and eosin (H&E) and were imaged at (a) low and (b) high
Postn MCM Smad2 fl/fl Postn MCM Smad3 fl/fl Postn MCM Smad2/3 fl/fl. Postn MCM. Tgfbr1/2 fl/fl TAC
 A Smad2 fl/fl Smad3 fl/fl Smad2/3 fl/fl Tgfbr1/2 fl/fl 1. mm B Tcf21 MCM Tcf21 MCM Smad3 fl/fl Tcf21 MCM Smad2/3 fl/fl Tcf21 MCM Tgfbr1/2 fl/fl αmhc MCM C 1. mm 1. mm D Smad2 fl/fl Smad3 fl/fl Smad2/3
Morphogenesis of the residual body of the mouse testis
 93 Morphogenesis of the residual body of the mouse testis By CASIMIR F. FIRLIT and JOSEPH R. DAVIS (From the Department of Pharmacology and Therapeutics, Stritch School of Medicine, and Graduate School,
Knockout TM SR : ; ; ; : R ; R : A : X(2013) , ,, B. , (Knockout TM
 , ,, B. , (Knockout TM") 33 1 Vol.33 No.1 013 1 Dec. 013 Reproduction & Contraception doi: 10.7669/j.issn.03-37X.013.1.0804 E-mail: randc_journal@163.com Knockout TM SR ; ; ; 400014 : FBS Knockout TM SRKSR : FBS KSR HE TUNEL RT-PCR
33 1 Vol.33 No.1 013 1 Dec. 013 Reproduction & Contraception doi: 10.7669/j.issn.03-37X.013.1.0804 E-mail: randc_journal@163.com Knockout TM SR ; ; ; 400014 : FBS Knockout TM SRKSR : FBS KSR HE TUNEL RT-PCR
Supplemental Figure S1. RANK expression on human lung cancer cells.
 Supplemental Figure S1. RANK expression on human lung cancer cells. (A) Incidence and H-Scores of RANK expression determined from IHC in the indicated primary lung cancer subgroups. The overall expression
Supplementary Figure 1. The CagA-dependent wound healing or transwell migration of gastric cancer cell. AGS cells transfected with vector control or
 Supplementary Figure 1. The CagA-dependent wound healing or transwell migration of gastric cancer cell. AGS cells transfected with vector control or 3xflag-CagA expression vector were wounded using a pipette
ErbB4 migrazione I parte. 3- ErbB4- NRG1
 ErbB4 migrazione I parte 3- ErbB4- NRG1 1 In rodent brains postnatal neuronal migration is evident in three main areas: the cerebellum (CB), the hippocampus (Hipp) and the rostral migratory stream (RMS).
AP VP DLP H&E. p-akt DLP
 A B AP VP DLP H&E AP AP VP DLP p-akt wild-type prostate PTEN-null prostate Supplementary Fig. 1. Targeted deletion of PTEN in prostate epithelium resulted in HG-PIN in all three lobes. (A) The anatomy
Expression of acid base transporters in the kidney collecting duct in Slc2a7 -/-
 Supplemental Material Results. Expression of acid base transporters in the kidney collecting duct in Slc2a7 -/- and Slc2a7 -/- mice. The expression of AE1 in the kidney was examined in Slc26a7 KO mice.
stability and tumor suppression
 Supplementary information The stress kinase MKK7 couples oncogenic stress to p53 stability and tumor suppression Daniel Schramek 1, Athanassios Kotsinas 2, Arabella Meixner 1, Teiji Wada 1, Ulrich Elling
(A) Cells grown in monolayer were fixed and stained for surfactant protein-c (SPC,
 Cells grown in monolayer were fixed and stained for surfactant protein-c (SPC,") Supplemental Figure Legends Figure S1. Cell line characterization (A) Cells grown in monolayer were fixed and stained for surfactant protein-c (SPC, green) and co-stained with DAPI to visualize the nuclei.
Supplemental Figure Legends Figure S1. Cell line characterization (A) Cells grown in monolayer were fixed and stained for surfactant protein-c (SPC, green) and co-stained with DAPI to visualize the nuclei.
SUPPLEMENTARY INFORMATION
 Supplementary Figure 1. Behavioural effects of ketamine in non-stressed and stressed mice. Naive C57BL/6 adult male mice (n=10/group) were given a single dose of saline vehicle or ketamine (3.0 mg/kg,
Adapted from Preg. & Part., Senger
 MALE ENDOCRINOLOGY AND SPERMATOGENESIS (Chapter 10) AVS 222 (Instructor: Dr. Amin Ahmadzadeh) I. MALE ENDOCRINOLOGY (Figure10-1 to 10-3) A. Glands and their respective hormones 1) Hypothalamic hormone:
Identification of the spermatogenic stages in living seminiferous tubules of man
 Identification of the spermatogenic stages in living seminiferous tubules of man V. Nikkanen, K.-O. S\l=o"\derstr\l=o"\m and M. Parvinen Department of Obstetrics and Gynecology, Turku University Central
Testicular stem cells
 Testicular stem cells Dirk G. de Rooij Department of Endocrinology Faculty of Biology, Utrecht University 1. Knowledge on the development of the spermatogenic stem cell lineage 2. Principals of the nature
c Ischemia (30 min) Reperfusion (8 w) Supplementary Figure bp 300 bp Ischemia (30 min) Reperfusion (4 h) Dox 20 mg/kg i.p.
 Reperfusion (8 w) Supplementary Figure bp 300 bp Ischemia (30 min) Reperfusion (4 h) Dox 20 mg/kg i.p.") a Marker Ripk3 +/ 5 bp 3 bp b Ischemia (3 min) Reperfusion (4 h) d 2 mg/kg i.p. 1 w 5 w Sacrifice for IF size A subset for echocardiography and morphological analysis c Ischemia (3 min) Reperfusion (8
a Marker Ripk3 +/ 5 bp 3 bp b Ischemia (3 min) Reperfusion (4 h) d 2 mg/kg i.p. 1 w 5 w Sacrifice for IF size A subset for echocardiography and morphological analysis c Ischemia (3 min) Reperfusion (8
well for 2 h at rt. Each dot represents an individual mouse and bar is the mean ±
 Supplementary data: Control DC Blimp-1 ko DC 8 6 4 2-2 IL-1β p=.5 medium 8 6 4 2 IL-2 Medium p=.16 8 6 4 2 IL-6 medium p=.3 5 4 3 2 1-1 medium IL-1 n.s. 25 2 15 1 5 IL-12(p7) p=.15 5 IFNγ p=.65 4 3 2 1
Histology of Male Reproductive system (1)
") Histology of Male Reproductive system (1) Prof. Dr. Malak A. Al-yawer Learning Objectives At the end of this lecture, the medical student will be able to: State the organization of the testis Define seminiferous
Histology of Male Reproductive system (1) Prof. Dr. Malak A. Al-yawer Learning Objectives At the end of this lecture, the medical student will be able to: State the organization of the testis Define seminiferous
p = formed with HCI-001 p = Relative # of blood vessels that formed with HCI-002 Control Bevacizumab + 17AAG Bevacizumab 17AAG
 A.. Relative # of ECs associated with HCI-001 1.4 1.2 1.0 0.8 0.6 0.4 0.2 0.0 ol b p < 0.001 Relative # of blood vessels that formed with HCI-001 1.4 1.2 1.0 0.8 0.6 0.4 0.2 0.0 l b p = 0.002 Control IHC:
Supporting Information Table of Contents
 Supporting Information Table of Contents Supporting Information Figure 1 Page 2 Supporting Information Figure 2 Page 4 Supporting Information Figure 3 Page 5 Supporting Information Figure 4 Page 6 Supporting
Supplementary Figures
 Supplementary Figures Supplementary Figure 1. Confirmation of Dnmt1 conditional knockout out mice. a, Representative images of sorted stem (Lin - CD49f high CD24 + ), luminal (Lin - CD49f low CD24 + )
Probe. Hind III Q,!?R'!! /0!!!!D1"?R'! vector. Homologous recombination
 Supple-Zhang Page 1 Wild-type locus Targeting construct Targeted allele Exon Exon3 Exon Probe P1 P P3 FRT FRT loxp loxp neo vector amh I Homologous recombination neo P1 P P3 FLPe recombination Q,!?R'!!
Genesis of cerebellar interneurons and the prevention of neural DNA damage require XRCC1.
 Genesis of cerebellar interneurons and the prevention of neural DNA damage require XRCC1. Youngsoo Lee, Sachin Katyal, Yang Li, Sherif F. El-Khamisy, Helen R. Russell, Keith W. Caldecott and Peter J. McKinnon.
ROLE OF SOME ANTIOXIDANTS ON MERCURY CHLORIDE INDUCED SPERMATOGENESIS IN SWISS ALBINO MICE DURING PRE PUBERTAL PHASE OF LIFE
 Indian J.Sci.Res.1(2) : 19-25, 2010 ROLE OF SOME ANTIOXIDANTS ON MERCURY CHLORIDE INDUCED SPERMATOGENESIS IN SWISS ALBINO MICE DURING PRE PUBERTAL PHASE OF LIFE a1 DUGESH NANDINI SHARMA AND LATA BHATTACHARYA
Supplementary Figure 1: Signaling centers contain few proliferating cells, express p21, and
 Supplementary Figure 1: Signaling centers contain few proliferating cells, express p21, and exclude YAP from the nucleus. (a) Schematic diagram of an E10.5 mouse embryo. (b,c) Sections at B and C in (a)
Supplementary Figures
 Supplementary Figures Supplementary Figure 1 Characterization of stable expression of GlucB and sshbira in the CT26 cell line (a) Live cell imaging of stable CT26 cells expressing green fluorescent protein
Supplementary Figure 1. Confocal immunofluorescence showing mitochondrial translocation of Drp1. Cardiomyocytes treated with H 2 O 2 were prestained
 Supplementary Figure 1. Confocal immunofluorescence showing mitochondrial translocation of Drp1. Cardiomyocytes treated with H 2 O 2 were prestained with MitoTracker (red), then were immunostained with
Reproductive Toxicology
 Reproductive Toxicology 32 (2011) 395 406 Contents lists available at SciVerse ScienceDirect Reproductive Toxicology jo u r n al hom epa ge: ww w.elsevier.com/locate/reprotox Effects of multiple doses
a) Primary cultures derived from the pancreas of an 11-week-old Pdx1-Cre; K-MADM-p53
 Primary cultures derived from the pancreas of an 11-week-old Pdx1-Cre; K-MADM-p53") 1 2 3 4 5 6 7 8 9 10 Supplementary Figure 1. Induction of p53 LOH by MADM. a) Primary cultures derived from the pancreas of an 11-week-old Pdx1-Cre; K-MADM-p53 mouse revealed increased p53 KO/KO (green,
1 2 3 4 5 6 7 8 9 10 Supplementary Figure 1. Induction of p53 LOH by MADM. a) Primary cultures derived from the pancreas of an 11-week-old Pdx1-Cre; K-MADM-p53 mouse revealed increased p53 KO/KO (green,
SUPPLEMENTARY INFORMATION
 DOI: 10.1038/ncb2566 Figure S1 CDKL5 protein expression pattern and localization in mouse brain. (a) Multiple-tissue western blot from a postnatal day (P) 21 mouse probed with an antibody against CDKL5.
Spermatogenesis. What is it and what does it look like? How do hormones regulate spermatogenesis?
 Spermatogenesis What is it and what does it look like? How do hormones regulate spermatogenesis? FSH, androgens, growth factors Animal Physiology (Hill, Wise, Anderson): Ch. 15 435-438 1 Spermatogenesis:
hexahistidine tagged GRP78 devoid of the KDEL motif (GRP78-His) on SDS-PAGE. This
 on SDS-PAGE. This") SUPPLEMENTAL FIGURE LEGEND Fig. S1. Generation and characterization of. (A) Coomassie staining of soluble hexahistidine tagged GRP78 devoid of the KDEL motif (GRP78-His) on SDS-PAGE. This protein was expressed
SUPPLEMENTAL FIGURE LEGEND Fig. S1. Generation and characterization of. (A) Coomassie staining of soluble hexahistidine tagged GRP78 devoid of the KDEL motif (GRP78-His) on SDS-PAGE. This protein was expressed
SUPPLEMENTARY INFORMATION
 DOI: 10.1038/ncb2697 Figure S1 Cytokeratin 5 is a specific marker for basal and intermediate cells in all mouse prostate lobes. (a) Immunofluorescence staining showing co-localization of YFP with p63 in
EGFR shrna A: CCGGCGCAAGTGTAAGAAGTGCGAACTCGAGTTCGCACTTCTTACACTTGCG TTTTTG. EGFR shrna B: CCGGAGAATGTGGAATACCTAAGGCTCGAGCCTTAGGTATTCCACATTCTCTT TTTG
 Supplementary Methods Sequence of oligonucleotides used for shrna targeting EGFR EGFR shrna were obtained from the Harvard RNAi consortium. The following oligonucleotides (forward primer) were used to
label the basement membrane). Different fixation methods of EB-perfused P8 mice to optimize the combination
. Different fixation methods of EB-perfused P8 mice to optimize the combination") Supplementary Figure 1 Optimization of the tissue fixation protocol to combine EB perfusion and IB4 endothelial tip cell staining in the postnatal mouse brain. a-l Labeling of EB-perfused P8 mice with
Supplementary Figure 1 Optimization of the tissue fixation protocol to combine EB perfusion and IB4 endothelial tip cell staining in the postnatal mouse brain. a-l Labeling of EB-perfused P8 mice with
Supplementary Materials for
 www.sciencesignaling.org/cgi/content/full/8/375/ra41/dc1 Supplementary Materials for Actin cytoskeletal remodeling with protrusion formation is essential for heart regeneration in Hippo-deficient mice
SUPPLEMENTARY FIGURE LEGENDS. atypical adenomatous hyperplasias (AAH); Grade II: adenomas; Grade III: adenocarcinomas;
; Grade II: adenomas; Grade III: adenocarcinomas;") SUPPLEMENTARY FIGURE LEGENDS Supplementary Figure S1: Tumor grades in Ras G12D ; p53 / lung tumors. Representative histology (H&E) of K-Ras G12D ; p53 / lung tumors 13 weeks after tumor initiation. Grade
SUPPLEMENTARY FIGURE LEGENDS Supplementary Figure S1: Tumor grades in Ras G12D ; p53 / lung tumors. Representative histology (H&E) of K-Ras G12D ; p53 / lung tumors 13 weeks after tumor initiation. Grade
Supplemental Information. Otic Mesenchyme Cells Regulate. Spiral Ganglion Axon Fasciculation. through a Pou3f4/EphA4 Signaling Pathway
 Neuron, Volume 73 Supplemental Information Otic Mesenchyme Cells Regulate Spiral Ganglion Axon Fasciculation through a Pou3f4/EphA4 Signaling Pathway Thomas M. Coate, Steven Raft, Xiumei Zhao, Aimee K.
PUBLISHED VERSION.
 PUBLISHED VERSION Hye-Won Song, Anilkumar Bettegowda, Daniel Oliver, Wei Yan, Mimi H. Phan, Dirk G. de Rooij, Mark A. Corbett, Miles F. Wilkinson shrna off-target effects in vivo: impaired endogenous sirna
Production of Fertile Sperm. Animal Science 434. Hormonal Regulation of the Testis. hormonal regulation of the testis
 roduction of Fertile Sperm hormonal regulation of the testis nimal Science 434 Lecture 12: Spermatogenesis mitotic division of spermatogonia meiotic divisions of spermatocytes morphologic transformation
sequences of a styx mutant reveals a T to A transversion in the donor splice site of intron 5
 sfigure 1 Styx mutant mice recapitulate the phenotype of SHIP -/- mice. (A) Analysis of the genomic sequences of a styx mutant reveals a T to A transversion in the donor splice site of intron 5 (GTAAC
Supplementary Figure 1 IMQ-Induced Mouse Model of Psoriasis. IMQ cream was
 Supplementary Figure 1 IMQ-Induced Mouse Model of Psoriasis. IMQ cream was painted on the shaved back skin of CBL/J and BALB/c mice for consecutive days. (a, b) Phenotypic presentation of mouse back skin
SUPPLEMENTARY INFORMATION
 DOI: 10.1038/ncb2638 Figure S1 Morphological characteristics of fetal testes and ovaries from 6.5-20 developmental weeks. Representative images of Hematoxylin and Eosin staining of testes and ovaries over
Effect of methotrexate (mtx) administration on spermatogenesis: an experimental on animal model
 administration on spermatogenesis: an experimental on animal model") Effect of methotrexate (mtx) administration on spermatogenesis: an experimental on animal model S Shrestha, 1 S Dhungel, 1 AK Saxena, 2 S Bhattacharya 1 and D Maskey 1 1 Department of Anatomy, B. P. Koirala
Effect of methotrexate (mtx) administration on spermatogenesis: an experimental on animal model S Shrestha, 1 S Dhungel, 1 AK Saxena, 2 S Bhattacharya 1 and D Maskey 1 1 Department of Anatomy, B. P. Koirala
Supplemental Table S1
 Supplemental Table S. Tumorigenicity and metastatic potential of 44SQ cell subpopulations a Tumorigenicity b Average tumor volume (mm ) c Lung metastasis d CD high /4 8. 8/ CD low /4 6./ a Mice were injected
Title: Smooth muscle cell-specific Tgfbr1 deficiency promotes aortic aneurysm formation by stimulating multiple signaling events
 Title: Smooth muscle cell-specific Tgfbr1 deficiency promotes aortic aneurysm formation by stimulating multiple signaling events Pu Yang 1, 3, radley M. Schmit 1, Chunhua Fu 1, Kenneth DeSart 1, S. Paul
Supporting Information
 Supporting Information Franco et al. 10.1073/pnas.1015557108 SI Materials and Methods Drug Administration. PD352901 was dissolved in 0.5% (wt/vol) hydroxyl-propyl-methylcellulose, 0.2% (vol/vol) Tween
Supplementary Table 1. List of primers used in this study
 Supplementary Table 1. List of primers used in this study Gene Forward primer Reverse primer Rat Met 5 -aggtcgcttcatgcaggt-3 5 -tccggagacacaggatgg-3 Rat Runx1 5 -cctccttgaaccactccact-3 5 -ctggatctgcctggcatc-3
Supplementary Figure 1. Nature Neuroscience: doi: /nn.4547
 Supplementary Figure 1 Characterization of the Microfetti mouse model. (a) Gating strategy for 8-color flow analysis of peripheral Ly-6C + monocytes from Microfetti mice 5-7 days after TAM treatment. Living
Supplementary Figure 1. Genotyping strategies for Mcm3 +/+, Mcm3 +/Lox and Mcm3 +/- mice and luciferase activity in Mcm3 +/Lox mice. A.
 Supplementary Figure 1. Genotyping strategies for Mcm3 +/+, Mcm3 +/Lox and Mcm3 +/- mice and luciferase activity in Mcm3 +/Lox mice. A. Upper part, three-primer PCR strategy at the Mcm3 locus yielding
IN normal male fowls, four developmental stages of spermatogenetic activity
 Development of the Testis Tubule in the Fowl By GAMAL A. R. KAMAR (From the Animal Production Department, Faculty of Agriculture, Cairo University, Giza, Egypt) With three plates (figs. 1-3) SUMMARY Three
Supplementary Figure 1. Repression of hepcidin expression in the liver of mice treated with
 Supplementary Figure 1. Repression of hepcidin expression in the liver of mice treated with DMN Immunohistochemistry for hepcidin and H&E staining (left). qrt-pcr assays for hepcidin in the liver (right).
Supplemental Information
 Supplemental Information Tobacco-specific Carcinogen Induces DNA Methyltransferases 1 Accumulation through AKT/GSK3β/βTrCP/hnRNP-U in Mice and Lung Cancer patients Ruo-Kai Lin, 1 Yi-Shuan Hsieh, 2 Pinpin
Formylpeptide receptor2 contributes to colon epithelial homeostasis, inflammation, and tumorigenesis
 Supplementary Data Formylpeptide receptor2 contributes to colon epithelial homeostasis, inflammation, and tumorigenesis Keqiang Chen, Mingyong Liu, Ying Liu, Teizo Yoshimura, Wei Shen, Yingying Le, Scott
Supplemental Figures:
 Supplemental Figures: Figure 1: Intracellular distribution of VWF by electron microscopy in human endothelial cells. a) Immunogold labeling of LC3 demonstrating an LC3-positive autophagosome (white arrow)
Supplementary Figure 1: Expression of NFAT proteins in Nfat2-deleted B cells (a+b) Protein expression of NFAT2 (a) and NFAT1 (b) in isolated splenic
 Protein expression of NFAT2 (a) and NFAT1 (b) in isolated splenic") Supplementary Figure 1: Expression of NFAT proteins in Nfat2-deleted B cells (a+b) Protein expression of NFAT2 (a) and NFAT1 (b) in isolated splenic B cells from WT Nfat2 +/+, TCL1 Nfat2 +/+ and TCL1 Nfat2
Supplementary Figure 1: Expression of NFAT proteins in Nfat2-deleted B cells (a+b) Protein expression of NFAT2 (a) and NFAT1 (b) in isolated splenic B cells from WT Nfat2 +/+, TCL1 Nfat2 +/+ and TCL1 Nfat2
LABORATORY EXERCISES FOR MALE REPRODUCTIVE SYSTEM
 LABORATORY EXERCISES FOR MALE REPRODUCTIVE SYSTEM Slide #101 (1096). Testis, rat. sustentacular ( Sertoli ) cells Nuclei of Sustentacular cells Leydig cells Spermatogonia Spermatocytes Spermatids pale
Supplementary Materials for
 www.sciencetranslationalmedicine.org/cgi/content/full/4/117/117ra8/dc1 Supplementary Materials for Notch4 Normalization Reduces Blood Vessel Size in Arteriovenous Malformations Patrick A. Murphy, Tyson
Atg5 flox/flox ; CAG-Cre, 19M brain heart lung. spleen stomach colon. Takamura_Fig. S1
 Takamura_Fig. S1 brain heart lung spleen stomach colon kidney SM Supplemental Figure 1 Histological findings of tg5 flox/flox ;CG-Cre mouse tissues. H&E staining of the brain, heart, lung, spleen, stomach,
Supplemental Information. Menin Deficiency Leads to Depressive-like. Behaviors in Mice by Modulating. Astrocyte-Mediated Neuroinflammation
 Neuron, Volume 100 Supplemental Information Menin Deficiency Leads to Depressive-like Behaviors in Mice by Modulating Astrocyte-Mediated Neuroinflammation Lige Leng, Kai Zhuang, Zeyue Liu, Changquan Huang,
Lack of cadherins Celsr2 and Celsr3 impairs ependymal ciliogenesis, leading to fatal
 Lack of cadherins Celsr2 and Celsr3 impairs ependymal ciliogenesis, leading to fatal hydrocephalus Fadel TISSIR, Yibo QU, Mireille MONTCOUQUIOL, Libing ZHOU, Kouji KOMATSU, Dongbo SHI, Toshihiko FUJIMORI,
Supplementary Figure 1 CD4 + T cells from PKC-θ null mice are defective in NF-κB activation during T cell receptor signaling. CD4 + T cells were
 Supplementary Figure 1 CD4 + T cells from PKC-θ null mice are defective in NF-κB activation during T cell receptor signaling. CD4 + T cells were isolated from wild type (PKC-θ- WT) or PKC-θ null (PKC-θ-KO)
The subcortical maternal complex controls symmetric division of mouse zygotes by
 The subcortical maternal complex controls symmetric division of mouse zygotes by regulating F-actin dynamics Xing-Jiang Yu 1,2, Zhaohong Yi 1, Zheng Gao 1,2, Dan-dan Qin 1,2, Yanhua Zhai 1, Xue Chen 1,
Zhu et al, page 1. Supplementary Figures
 Zhu et al, page 1 Supplementary Figures Supplementary Figure 1: Visual behavior and avoidance behavioral response in EPM trials. (a) Measures of visual behavior that performed the light avoidance behavior
Supplementary Figure 1. Deletion of Smad3 prevents B16F10 melanoma invasion and metastasis in a mouse s.c. tumor model.
 A B16F1 s.c. Lung LN Distant lymph nodes Colon B B16F1 s.c. Supplementary Figure 1. Deletion of Smad3 prevents B16F1 melanoma invasion and metastasis in a mouse s.c. tumor model. Highly invasive growth
SUPPLEMENTARY LEGENDS...
 TABLE OF CONTENTS SUPPLEMENTARY LEGENDS... 2 11 MOVIE S1... 2 FIGURE S1 LEGEND... 3 FIGURE S2 LEGEND... 4 FIGURE S3 LEGEND... 5 FIGURE S4 LEGEND... 6 FIGURE S5 LEGEND... 7 FIGURE S6 LEGEND... 8 FIGURE
5 15/3/2012. Malik Al-Momani
 5 15/3/2012 Malik Al-Momani بسم هللا الرحمن الرحيم Spermatogenesis Note : Please refer to slides so see photos. Quick Revision : - Testis is divided by septum into testicular lobules, inside the lobules
Supplementary Figure 1: si-craf but not si-braf sensitizes tumor cells to radiation.
 Supplementary Figure 1: si-craf but not si-braf sensitizes tumor cells to radiation. (a) Embryonic fibroblasts isolated from wildtype (WT), BRAF -/-, or CRAF -/- mice were irradiated (6 Gy) and DNA damage
SUPPLEMENTARY FIGURES AND TABLE
 SUPPLEMENTARY FIGURES AND TABLE Supplementary Figure S1: Characterization of IRE1α mutants. A. U87-LUC cells were transduced with the lentiviral vector containing the GFP sequence (U87-LUC Tet-ON GFP).
The spermatogenesis CHARACTERISTICS OF THE SPERMATOZOON 26/04/2017. Reproductive Biotechnologies Andrology I. Prof. Alberto Contri
 Reproductive Biotechnologies Andrology I The spermatogenesis Prof. Alberto Contri CHARACTERISTICS OF THE SPERMATOZOON 1) Aploid cell with high condensed DNA 2) Forward motility - flagellum 3) Enzymes for
Supplementary Figures
 Supplementary Figures Supplementary Figure 1. nrg1 bns101/bns101 embryos develop a functional heart and survive to adulthood (a-b) Cartoon of Talen-induced nrg1 mutation with a 14-base-pair deletion in
GFP/Iba1/GFAP. Brain. Liver. Kidney. Lung. Hoechst/Iba1/TLR9!
 Supplementary information a +KA Relative expression d! Tlr9 5!! 5! NSC Neuron Astrocyte Microglia! 5! Tlr7!!!! NSC Neuron Astrocyte! GFP/Sβ/! Iba/Hoechst Microglia e Hoechst/Iba/TLR9! GFP/Iba/GFAP f Brain
Supplementary Figures
 Supplementary Figures Supplementary Figure 1 Correlation between LKB1 and YAP expression in human lung cancer samples. (a) Representative photos showing LKB1 and YAP immunohistochemical staining in human
Primary Cilia Can Both Mediate and Suppress Hedgehog Pathway- Dependent Tumorigenesis (Supplementary Figures and Materials)
") Primary Cilia Can Both Mediate and Suppress Hedgehog Pathway- Dependent Tumorigenesis (Supplementary Figures and Materials) Sunny Y. Wong, Allen D. Seol, Po-Lin So, Alexandre N. Ermilov, Christopher K.
Primary Cilia Can Both Mediate and Suppress Hedgehog Pathway- Dependent Tumorigenesis (Supplementary Figures and Materials) Sunny Y. Wong, Allen D. Seol, Po-Lin So, Alexandre N. Ermilov, Christopher K.